


Abstract
Objectives. To assess the outcome of subacute low back pain, to identify the characteristics of patients and physicians which were related to outcome and to evaluate the influence of rheumatologists’ beliefs about back pain on their following the guidelines for physical and occupational activity.
Methods. Design: a longitudinal descriptive survey. Setting: a secondary care practice in France. Participants: 266 rheumatologists; 440 patients with subacute low back pain. Outcome measures: the main outcome measure was persistence of back pain 3 months after baseline evaluation. A self-administered questionnaire for physicians assessed attitudes and beliefs about back pain [Fear-Avoidance Beliefs Questionnaire (FABQ)], and one for patients assessed pain, perceived handicap and disability (Quebec Scale), anxiety and depression (Hospital Anxiety Depression Questionnaire), and beliefs about back pain (FABQ).
Results. Forty per cent of patients had persistent low back pain at 3 months; 5.5% of these had sciatica. A total of 10% of rheumatologists and 68% of patients at baseline had a high FABQ physical score (phys; >14). Determinants of outcomes were work-related back pain [odds ratio (OR) = 3.37; 95% confidence interval (CI) 1.08–5.17], anxiety (OR = 2.41; 95% CI 1.44–4.09), sex (female OR = 2.03; 95% CI 1.30–3.18) and patients’ beliefs about back pain at work (OR = 1.02; 95% CI 1.00–1.05). Physicians with high FABQ physical scores were less likely to follow guidelines on prescribing rest and occupational activity for back pain.
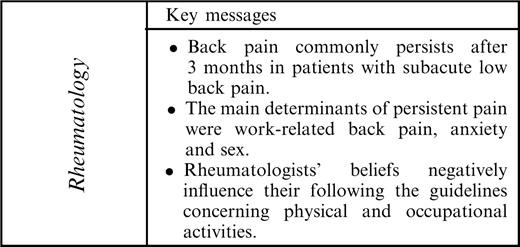
Conclusion. Back pain commonly persists 3 months later in patients with subacute low back pain. Patients and rheumatologists still have negative beliefs about back pain. Rheumatologists’ beliefs influence their following guidelines on physical and occupational activities. National education programmes about low back pain are needed in France.
About 60% of the population of Western industrialized countries are affected by low back pain (LBP) [1]. Chronic LBP has become a major medical, social and economic problem [2]. The costs are comparable to those associated with coronary heart disease, diabetes or depression [3], so diminishing the cost of LBP is a major public health issue. An approach to reducing cost is to determine the subgroup of patients with high risk of developing chronic disabling pain. Adults of working age with subacute LBP (i.e. a duration of pain of more than 4 weeks and less than 12 weeks) are thought to be at risk of developing chronic pain [4]. However, the natural history of subacute LBP is not well known, and outcome determinants have been investigated in only three studies [5–7]. One concerned only blue collar workers [5], another investigated the predictive value of the Quebec Task Force classification [6] and the final study did not take into account psychological factors (anxiety, depression, beliefs about back pain) [7]. Finally, all three studies investigated patient determinants of outcome but none investigated the influence of physicians.
Evidence exists that staying active and coping with pain could decrease the risk of developing chronic pain and the impact of back pain on daily and occupational activity, and guidelines on this topic have been proposed [8]. However, recent studies suggest that physicians do not always follow these guidelines [9–12]. Several hypotheses to explain this attitude have focused on patients and the characteristics of their back pain (previous history of LBP, pain intensity) [12], but little information exists about the impact of physician characteristics such as acquisition of knowledge about LBP or their own fear-avoidance attitudes and beliefs [13].
We conducted this survey to describe the outcome of subacute LBP, to identify the characteristics of patients and rheumatologists related to outcome and to evaluate the influence of rheumatologists’ beliefs about back pain on following guidelines for physical and occupational activity. We chose to conduct this survey among rheumatologists because in France general practitioners are involved in the management of acute back pain and usually refer patients to rheumatologists when pain and disability persist.
Methods
Study design
We conducted a 3-month national longitudinal survey with geographical stratification (17 areas).
Recruitment of rheumatologists
In June 2003, a total of 35 rheumatologists per geographical area were selected at random from a national database with use of a computerized allocation [14, 15], and 595 rheumatologists were invited to participate.
Patients
Each rheumatologist had to enrol one to four consecutive patients with subacute LBP between July and November 2003. Patients were excluded if they were aged less than 18 yr; had pain for less than 4 or more than 12 weeks; had sciatica; had had an episode of subacute LBP during the last 12 months; were unemployed; had consulted another spine specialist for the same episode of back pain; were pregnant; or had back pain related to infection, tumour or inflammatory disease.
Main outcome measure
The main outcome measure was persistence of back pain 3 months after baseline evaluation. Patients were asked to answer ‘yes’ or ‘no’ to the question ‘Has your low back pain persisted since your visit to your rheumatologist 3 months ago?’ Patients with persistent pain (i.e. those answering ‘yes’) were considered to have chronic LBP.
Questionnaires
Rheumatologists’ questionnaire
Rheumatologists completed a five-part self-administered questionnaire. Parts 1, 2 and 3 concerned demographic data (age and sex), professional data (years of practice and exclusive private or public/private practice) and personal history related to back pain (acute, recurrent, chronic) and self-limitation of physical activities for back pain (never, sometimes, often, always), respectively. Part 4 dealt with rheumatologists’ information about and practice for LBP: participation in an education session on back pain in the last 3 yr (yes/no); referral of patients to functional restoration programmes for chronic back pain (yes/no); main objective of physical therapy for back pain (to reduce pain, increase mobility, increase muscle strength); referral of patients to other spine specialists and back school (yes/no); recommendation for sick leave if needed (≤3 days, 3–8 days, 9–15 days, >15 days); advice about physical activity during sick leave (bed rest, rest at home, maximum bearable activities); attitude about patients with chronic back pain concerning job adaptation; sick leave prescription for increased pain; and advice to keep maximum bearable occupational activities (always, often, sometimes, never). Part 5 assessed rheumatologists’ fear-avoidance attitudes and beliefs using the Fear-Avoidance Beliefs Questionnaire (FABQ) [16]. The FABQ comprises two independent subscales: the FABQ phys assesses attitudes and beliefs about general physical activities (four items, range of scores 0–24); the FABQ work assesses attitudes and beliefs about occupational activities (seven items, range of scores 0–42). Each item is scored from 0 ‘do not agree at all’ to 6 ‘completely agree’. For both subscales, a low score indicates low fear-avoidance attitudes and beliefs, and a score of 14 or more on the FABQ phys scale indicates strong beliefs [16, 17]. This questionnaire has been validated in English [16], German [18] and, recently, French [19]. The FABQ was originally developed to assess patients’ attitudes and beliefs on fear-avoidance. To evaluate rheumatologists’ attitudes and beliefs, we did not modify the phrasing of items but slightly adapted the first sentence of the instructions to patients to delete ‘other’: ‘These are statements that other patients have expressed about their low back pain …’.
Patients’ questionnaire
Baseline evaluation. Baseline data were collected during the first visit to the rheumatologist. Patients were interviewed about the physical demands of occupational activities (11-point numeric scale, from 0, no physical demand, to 10, extremely hard physical demand), education level (no full-time education, primary school, high school, post-secondary education), LBP in parents (yes/no), duration of back pain (weeks), work-related back pain (yes/no), sport activities (none, occasional, regular, competition), medication intake during the last week (analgesics, non-steroidal anti-inflammatory drugs, muscle relaxants), pain intensity during the last 48 h (weak, moderate, severe, extremely severe) and level of handicap for activities of daily living (no handicap, weak, moderate, severe, very severe). Self-rated disability was assessed with use of the Quebec Questionnaire (20 items, scored from 0, no disability, to 5, impossible to do; range of final scores 0–100) [20], anxiety and depression were assessed with use of the Hospital Anxiety and Depression Scale (HAD) [21] [seven items, scored from 0 to 3 for anxiety and depression respectively; range 0, no anxiety or depression, to 21, maximum anxiety or depression]. Beliefs about back pain were recorded with use of the FABQ (see above).
Evaluation at 3 months. Follow-up data were recorded by phone interviews conducted by trained research assistants. Patients were asked about persistence of pain since baseline evaluation (yes/no), presence of sciatica (yes/no), sick leave since baseline evaluation (yes/no), duration of sick leave (days) and return to work (yes/no). For patients with persistent back pain, pain intensity, level of handicap, perceived disability, anxiety and depression and beliefs about back pain were recorded as for the baseline evaluation.
Ethical approval
The study protocol was approved by the Comission Nationale Informatique et Liberté and the French National Medical Council (Conseil National de l’Ordre des Médecins). This survey was conducted in compliance with the protocol, Good Clinical Practices and the principles of the Declaration of Helsinki. In accordance with French national law, rheumatologists and patients gave their written consent to participate after being informed about the study protocol.
Statistical analysis
Data analysis involved the use of SAS 8.2. Quantitative variables were described with means ± standard deviations (s.d.). Qualitative variables were described with raw data and percentages. Means were compared by use of the Student's t-test; percentages were compared by use of the χ2 test. Stepwise logistic regression analysis (with levels to enter and to stay in the model of 0.05) was used to determine whether persistence of pain at 3 months differed according to patients’ and rheumatologists’ characteristics and whether rheumatologists’ demographic and professional features influenced their beliefs about back pain. All covariates were treated as fixed effects. For each of the covariates, odds ratios (ORs) with 95% confidence intervals (CIs) were calculated.
Results
Rheumatologists
Among the 595 rheumatologists invited to participate, 391 completed the questionnaire, and 266 completed the questionnaire and enrolled at least one patient (Fig. 1). Table 1 shows the demographic and professional characteristics of the rheumatologists. The characteristics of this sample were similar to those enrolled in a large national study conducted in secondary care practice in France [22].
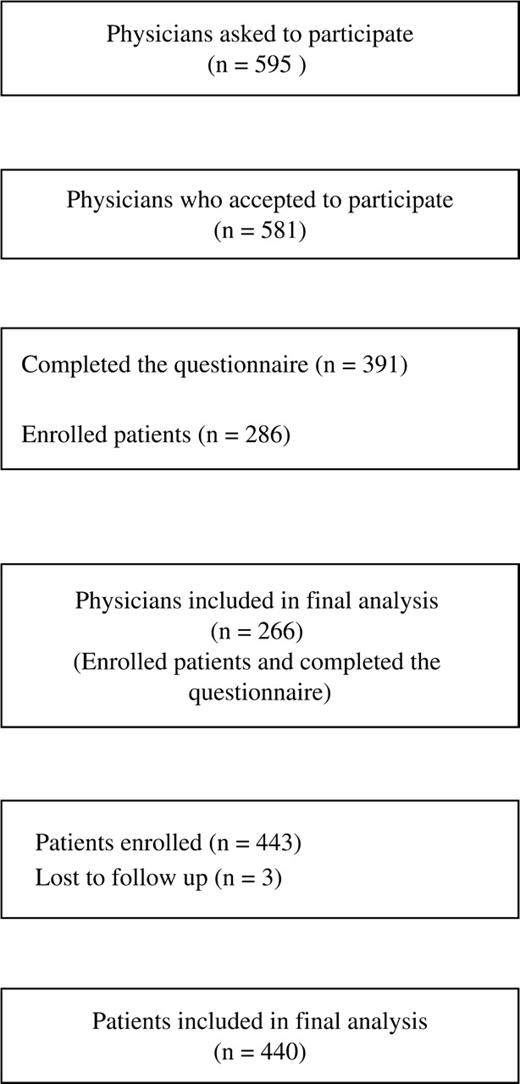
Selection of rheumatologists and patients in a survey of subacute low back pain.
Rheumatologists’ demographic and professional characteristics, personal history of back pain, formation of attitudes and attitudes about low back pain, and recommendations for chronic low back pain
| Whole sample (n = 266) | FABQ phys score ≤14 (n = 240) | FABQ phys score >14 (n = 26) | P value (t-test or χ2) | |||||
|---|---|---|---|---|---|---|---|---|
| Age (mean ± s.d.) | 47.5 (±7.0) | 47.1 (±7.0) | 50.7 (±5.7) | 0.0110 | ||||
| Sex (M) | 209 (76.3%) | 178 (74.8%) | 22 (84.6%) | 0.2670 | ||||
| Years of practice | ||||||||
| <10 | 39 (14.3%) | 37 (15.6%) | 1 (3.9%) | 0.0325 | ||||
| 10–20 | 142 (52.0%) | 126 (53.2%) | 10 (38.5%) | |||||
| 21–30 | 87 (31.9%) | 69 (29.1%) | 15 (57.7%) | |||||
| >30 | 5 (1.8%) | 5 (2.1%) | 0 (0.0%) | |||||
| Type of practice | ||||||||
| Private | 173 (63.1%) | 149 (62.6%) | 18 (69.2%) | |||||
| Public and private | 101 (36.9%) | 89 (37.4%) | 8 (30.8%) | |||||
| Personal history of back pain | ||||||||
| Acute (yes/no) | 111 (45.9%) | 101 (47.4%) | 9 (34.6%) | 0.2163 | ||||
| Recurrent (yes/no) | 88 (38.9%) | 78 (39.0%) | 8 (36.4%) | 0.8096 | ||||
| Subacute (yes/no) | 84 (37.5%) | 76 (38.2%) | 7 (31.8%) | 0.5581 | ||||
| Chronic (yes/no) | 29 (13.5%) | 27 (14.2%) | 1 (4.6%) | 0.3217 | ||||
| Self-limitation of physical activity for back pain | ||||||||
| Never | 61 (28.4%) | 51 (26.8%) | 8 (38.1%) | 0.2756 | ||||
| Rarely | 98 (47.1%) | 88 (47.6%) | 8 (42.1%) | 0.6496 | ||||
| Often | 18 (10.5%) | 14 (9.2%) | 4 (22.2%) | 0.1038 | ||||
| Always | 1 (0.6%) | 1 (0.7%) | 0 (0.0%) | ≈1.0000 | ||||
| Education session on back pain in the last 3 yr (yes/no) | 206 (76.9%) | 186 (78.8%) | 16 (61.5%) | 0.0466 | ||||
| Main objective when referring a patient to a physical therapist | ||||||||
| Decrease pain | 49 (18.4%) | 40 (17.9%) | 9 (36.0%) | 0.019 | ||||
| Increase mobility | 29 (10.9%) | 26 (13.0% | 3 (12%) | |||||
| Increase strength | 167 (62.7%) | 154 (69.1%) | 13 (52%) | |||||
| Recommended sick leave duration for subacute back pain | ||||||||
| ≤3 days | 20 (7.4%) | 18 (7.6%) | 2 (7.7%) | 0.9613 | ||||
| 3–8 days | 165 (61.3%) | 146 (61.6%) | 17 (65.4%) | |||||
| 9–15 days | 81 (30.1%) | 70 (29.5%) | 7 (26.9%) | |||||
| >15 days | 3 (1.1%) | 3 (1.3%) | 0 (0.0%) | |||||
| Physical activities recommended during sick leave | ||||||||
| Bed rest | 5 (1.9%) | 4 (1.7%) | 1 (3.9%) | <0.0001 | ||||
| Rest | 166 (61.9%) | 137 (57.8%) | 24 (92.3%) | |||||
| Maximum bearable activity | 98 (36.6%) | 96 (40.5%) | 1 (3.9%) | |||||
| Recommendations for chronic back pain | ||||||||
| Sick leave during pain periods | ||||||||
| Always | 3 (1.1%) | 3 (1.3%) | 0 (0.0%) | 0.2104 | ||||
| Often | 35 (13.2%) | 28 (12.0%) | 6 (23.1%) | |||||
| Sometimes | 177 (66.8%) | 154 (66.1%) | 18 (69.2%) | |||||
| Never | 50 (18.9%) | 48 (20.6%) | 2 (7.7%) | |||||
| Maintain physical and occupational activities despite pain | ||||||||
| Always | 56 (20.9%) | 54 (22.9%) | 2 (7.7%) | <0.0001 | ||||
| Often | 107 (39.9%) | 96 (40.7%) | 5 (19.2%) | |||||
| Sometimes | 64 (23.9%) | 56 (23.7%) | 8 (30.8%) | |||||
| Never | 41 (15.3%) | 30 (12.7%) | 11 (42.3%) | |||||
Values are numbers (percentages).
Mean scores for FABQ phys and work were 9.2 ± 4.4 (min 0, max 21) and 16.7 ± 6.9 (min 2, max 37), respectively. Almost 10% of the rheumatologists had a high FABQ phys score (>14). Rheumatologists with higher scores were older (P = 0.01) (Table 1) and participated less often in education sessions on LBP (P = 0.05) than those with low scores. They also had a higher mean FABQ work scores (21.0 ± 5.8 vs 16.3 ± 6.6, P = 0.0008) and less often considered that the main objective of physical therapy for back pain was to reinforce muscle strength and endurance (P = 0.02). Rheumatologists did not differ in referring patients to other specialists or to physical therapy or educational programmes. Rheumatologists with high FABQ phys scores less often followed recent recommendations for the management of LBP. They were less likely to advise maintaining maximum bearable activities during sick leave (P = 0.001). For chronic LBP, they were less likely to advise maintaining maximum bearable physical and occupational activity (P = 0.001) (Table 1).
To better understand the determinants of rheumatologists’ FABQ scores, regression analysis revealed that age (OR 1.08; 95% CI 1.02–1.15) and length of practice (OR 1.09; 95% CI 1.03–1.16) had a weak significant influence on FABQ phys scores (Table 2), but none of the covariates (demographic, professional, or personal) explained FABQ work scores.
Comparisons between baseline demographic and clinical characteristics of patients according to outcome
| Whole sample (n = 440) | Resolution of back pain (n = 262) | Chronic back pain (n = 178) | P value (t-test or χ2) | |||||
|---|---|---|---|---|---|---|---|---|
| Age (mean ± s.d.) | 42.8 (±9.5) | 42.7 (±9.9) | 43.0 (±9.1) | 0.7364 | ||||
| Sex (M) | 257 (58.4%) | 166 (63.9%) | 88 (49.7%) | 0.0033 | ||||
| Duration of back pain (weeks) | 6.1 (±1.6) | 6.0 (±1.5) | 6.3 (±1.7) | 0.0386 | ||||
| Physical demand of work (0–10) | ||||||||
| <3 | 70 (16.2%) | 41 (16.1%) | 29 (16.5%) | 0.2606 | ||||
| 3–4 | 92 (21.3%) | 61 (24.0%) | 31 (17.6%) | |||||
| 5–7 | 181 (41.8%) | 106 (41.7%) | 73 (41.5%) | |||||
| >7 | 90 (20.8%) | 46 (18.1%) | 43 (24.4%) | |||||
| Level of education | ||||||||
| No full-time education | 6 (1.4%) | 3 (1.2%) | 3 (1.7%) | 0.6677 | ||||
| Primary school | 86 (19.5%) | 47 (18.2%) | 38 (21.4%) | |||||
| High school | 217 (49.1%) | 133 (51.6%) | 82 (46.1%) | |||||
| Post-graduate | 133 (30.1%) | 75 (29.1%) | 55 (30.9%) | |||||
| Back pain in parents | 281 (64.5%) | 169 (65.3%) | 110 (63.2%) | 0.6649 | ||||
| Work-related back pain | 50 (11.3%) | 20 (7.6%) | 30 (16.9%) | 0.0028 | ||||
| Sports activities | ||||||||
| None | 148 (33.4%) | 71 (27.1%) | 74 (41.6%) | 0.0015 | ||||
| Occasional | 189 (42.7%) | 120 (45.8%) | 69 (38.8%) | |||||
| Usual | 100 (22.6%) | 66 (25.2%) | 34 (19.1%) | |||||
| Competition | 6 (1.4%) | 5 (1.9%) | 1 (0.6%) | |||||
| Medications | ||||||||
| Analgesics (yes/no) | 366 (83.2%) | 218 (83.9%) | 146 (82.5%) | 0.7082 | ||||
| NSAIDs (yes/no) | 228 (53.4%) | 135 (53.6%) | 92 (53.5%) | 0.9866 | ||||
| Muscle relaxants (yes/no) | 165 (38.6%) | 92 (36.4%) | 72 (41.9%) | 0.2532 | ||||
| Pain intensity | ||||||||
| Weak | 14 (3.2%) | 9 (3.4%) | 5 (2.8%) | 0.0013 | ||||
| Moderate | 196 (44.2%) | 132 (50.4%) | 62 (34.8%) | |||||
| Severe | 213 (48.1%) | 115 (43.9%) | 97 (54.5%) | |||||
| Extremely severe | 20 (4.5%) | 6 (2.4%) | 14 (7.9%) | |||||
| Perceived handicap | ||||||||
| None | 1 (0.2%) | 1 (0.4%) | 0 (0.0%) | 0.0066 | ||||
| Weak | 26 (5.9%) | 19 (7.3%) | 7 (3.9%) | |||||
| Moderate | 190 (42.9%) | 125 (47.7%) | 63 (35.4%) | |||||
| Severe | 210 (47.4%) | 111 (42.4%) | 98 (55.1%) | |||||
| Extremely severe | 16 (3.6%) | 6 (2.3%) | 10 (5.6%) | |||||
| FABQ phys (0–24) | 16.7 (±5.2) | 16.1 (±5.0) | 17.5 (±5.3) | 0.0052 | ||||
| FABQ work (0–42) | 19.3 (±12.4) | 17.1 (±11.6) | 22.2 (±13.0) | <0.0001 | ||||
| Quebec (0–100) | 45.6 (±17.8) | 43.2 (±17.6) | 49.2 (±17.6) | 0.0007 | ||||
| HADA (0–21) | 8.9 (±4.2) | 8.1 (±3.9) | 10.2 (±4.4) | <0.0001 | ||||
| HADD (0–21) | 5.7 (±3.4) | 5.1 (±3.1) | 6.6 (±3.5) | <0.0001 | ||||
| Rheumatologists’ beliefs | ||||||||
| FABQ phys | 9.0 (±4.1) | 8.9 (±4.0) | 9.1 (±4.3) | 0.6273 | ||||
| FABQ work | 16.6 (±6.6) | 16.3 (±6.6) | 17.1 (±6.6) | 0.2686 | ||||
NSAIDs, non-steroidal anti-inflammatory drugs.
Values are numbers (percentages).
Patients
Baseline evaluation
Demographic and clinical data for the 443 patients enrolled at baseline are summarized in Table 2. Eleven per cent had work-related back pain, 52% reported severe or extremely severe pain and 51% severe or extremely severe handicap. The self-reported disability (Quebec Disability Questionnaire) mean score was 45.6 ± 17.8 (minimum 3, maximum 95, range 0–100). Mean scores for FABQ phys and work were 16.7 ± 5.2 (minimum 0, maximum 24) and 19.3 ± 12.4 (minimum 0, maximum 42), respectively. More than 68% of patients had a high FABQ phys score (>14).
Three-month evaluation
A total of 440 (99%) patients were assessed at follow-up: 40% reported persistent back pain and 5.5% had experienced sciatica (as defined in Methods). Forty-one per cent of patients had used sick leave during the 3-month period; the mean duration was 30.3 ± 31.7 days (minimum 3 days, maximum 120 days), and 82.5% had returned to work.
Determinants of outcome
Univariate comparisons of patients’ demographic and clinical characteristics at baseline according to outcome revealed that patients experiencing chronic pain were more likely to be female (P = 0.003), had work-related back pain (P = 0.003), participated in few sporting activities (P = 0.0015), had high pain and handicap levels (P = 0.0013 and P = 0.0066, respectively) and had high scores for FABQ phys and work, Quebec and HAD anxiety (HADA) and HAD depression (HADD) (P = 0.0052, P = 0.0001, P = 0.0007, P = 0.0001, P = 0.0001, respectively) (Table 2). In multivariate analysis, determinants of outcome were work-related back pain (OR = 3.37; 95% CI 1.08–5.17), anxiety (OR = 2.41; 95% CI 1.44–4.09), sex (female OR = 2.03; 95% CI 1.30–3.18), and patients’ beliefs about work-related back pain (OR = 1.02; 95% CI 1.00–1.05). Finally, rheumatologists’ characteristics had no significant impact on outcome.
Discussion
Main findings
Our survey, involving a large sample of patients and physicians and a very low rate of patients lost to follow-up, revealed that a high proportion of adults of working age with subacute LBP have persistent pain 3 months later. The main determinants of persistent pain were work-related back pain, anxiety and sex.
This study assesses, for the first time in a national sample, rheumatologists’ fear-avoidance attitudes and beliefs about LBP. Even though a relatively low proportion (10%) of physicians had a high FABQ phys score, their mean score on work-related fears, avoidance attitudes and beliefs (FABQ work) was similar to that of patients. Moreover, beliefs about physical activities negatively influenced their following the guidelines about physical and occupational activity.
The high proportion of patients experiencing persistent pain in our sample strongly suggests that subacute LBP deserves special attention to decrease the associated costs of the condition. Targeted information and education campaigns for physicians and patients have been shown to reduce the clinical and economic impact of LBP [23, 24]. A high proportion of patients reporting pain and disability 3 and 12 months after a visit to their general practitioner for low back pain has already been reported in a different setting [25]. However, comparison of results between both surveys should be taken with caution as samples probably differed in terms of age and duration of back pain.
Age and pain intensity were the strongest predictors of outcome of subacute LBP in a Finnish study [7]. Discrepancies between these and our findings may result from differences in study design. Anxiety and beliefs about back pain were not recorded in the Finnish study, and the 164 patients enrolled in the randomized control trial may not reflect the whole population of people with subacute LBP. In our survey, identifying work-related back pain and anxiety but not the physical demand of work as determinants of persistent pain suggests that interventions in working conditions and decreasing stress and anxiety could be useful in this population.
Although beliefs about back pain were high in the group of patients experiencing chronic pain, the FABQ phys score was not a predictor of outcome and the FABQ work score was a weak predictor. These results may be explained by the correlation between anxiety and back-belief scores (r = 0.25 and 0.36 for HADA and FABQ phys and work, respectively).
To our knowledge, rheumatologists’ beliefs about back pain have never been recorded. One study previously reported on a small sample of general practitioners [13], but its aim was to compare beliefs of practitioners and physical therapists on a non-validated questionnaire that mixed items from several published scales, and the influence of beliefs on practice was not recorded. However, some studies used questionnaires aimed at recording general practitioners’ knowledge and attitudes about physical activity in the management of LBP [26, 27], but beliefs were not reported. Recording both physicians’ beliefs and practice behaviours will help to better understand the factors influencing the sustained following of guidelines on physical and occupational activity for LBP, and to increase the efficacy of campaigns designed to modify practices.
Rheumatologists’ fear-avoidance and beliefs were not related to personal experience of pain, and exploratory analysis failed to extract strong predictors of beliefs among demographic, professional or personal characteristics. These findings suggest that rheumatologists’ beliefs may be related more to popular beliefs about LBP.
Having participated in an education session during the last 3 yr slightly but significantly decreased the rheumatologists’ FABQ phys score but did not influence practice behaviours concerning physical and occupational activity. The efficacy of educational sessions on LBP as they are delivered currently is questionable. Previous studies have shown that education programmes or mass media campaigns could modify general practitioners’ practice behaviours for LBP [23, 24, 26]. This discrepancy from our findings is not surprising, since we did not record the type and number of educational sessions rheumatologists attended, and physicians’ education is very heterogeneous in France. To our knowledge, no widely diffused standardized teaching programme on back pain exists for health-care providers, nor was there an information or education campaign before or during the study.
Limitations
Concerning rheumatologists, this study has the usual limitations of descriptive surveys based on self-reported medical practices. Responses obtained with this type of questioning may be more in accordance with published guidelines and do not completely reflect rheumatologists’ real practice. Thus, our results may be underestimated. However, assessing physicians’ clinical performance is a complex process, and validated measurement tools are not available [28, 29].
We did not used the Health Care Providers’ Pain and Impairment Relationship Scale (HC-PAIRS) [30] to record rheumatologists’ fears, avoidance attitude and beliefs about LBP but rather a slightly modified version of the FABQ. However, the HC-PAIRS was not validated, even in English [31], when we started the survey; the FABQ is the only instrument for assessing fears and beliefs that is validated in French [19], and we wanted to use the same instrument to compare patients’ and physicians’ beliefs. Moreover, we used the same turn of phrase as Rainville et al. [30] to adapt the PAIRS for physicians.
Although we tried to ensure a national representation of rheumatologists, our sample may differ slightly from the population of rheumatologists in France. No national register of rheumatologists is currently available in France, and the characteristics of our sample were similar to those of rheumatologists enrolled in other large studies of secondary care practice in France [22].
Concerning patients, the follow-up was only 3 months but allowed for a very low rate of missing data at the end point. We cannot ensure that our sample of patients is representative of the whole population of patients with subacute LBP in France, since not every patient consults a rheumatologist. We may have recruited patients with a high level of pain and disability, which could explain in part the high proportion of patients reporting persistent pain.
Conclusion
Back pain commonly persists after 3 months in patients with subacute LBP. This study has shed light on the potential use of early treatment strategies for work-related LBP aimed at diminishing anxiety to avoid chronic back pain. Patients and rheumatologists have negative beliefs about back pain, and rheumatologists’ beliefs negatively influence their following the guidelines concerning physical and occupational activities. Widespread, standardized education programmes about LBP for rheumatologists and patients in France should be developed.
This study was funded by Théraplix Aventis Pharma.
The authors have declared no conflicts of interest.
References
Druss BG, Rosenheck RA, Sledge WH. Health and disability costs of depressive illness in a major US Corporation.
Karjalainen K, Malmivaara A, van Tulder M et al. Multidisciplinary biopsychosocial rehabilitation for subacute low-back pain among working age adults.
Lindstrom I, Ohlund C, Nachemson A. Validity of patient reporting and predictive value of industrial physical workdemands.
Loisel P, Vachon B, Lemaire J et al. Discriminative and predictive validity assessment of the Quebec task force classification.
Karjalainen K, Malmivaara A, Mutanen P, Pohjolainen T, Roine R, Hurri H. Outcome determinants of subacute low back pain.
Abenhaim L, Rossignol M, Valat JP et al. The role of activity in the therapeutic management of back pain. Report of the International Paris Task Force on Back Pain.
Bishop PB, Wing PC. Compliance with clinical practice guidelines in family physicians managing worker's compensation board patients with acute lower back pain.
Gonzalez-Urzelai V, Palacio-Elua L, Lopez-de-Munain J. Routine primary care management of acute low back pain: adherence to clinical guidelines.
Dey P, Simpson CW, Collins SI et al. Implementation of RCGP guidelines for acute low back pain: a cluster randomised controlled trial.
Rozenberg S, Allaert FA, Savarieau B, Perahia M, Valat JP. Compliance among general practitioners in France with not to prescribe bed rest for acute low back pain.
Linton SJ, Vlayen J, Ostello R. The back pain beliefs of health care providers: are we fear avoidant.
Breart G, Bouyer J. Epidemiological methods in evaluation.
Briançon S, Girard F, Empereur F, Guillemin F. Evaluation of professional practices.
Waddell G, Newton M, Henderson I, Somerville D, Main CJ. A Fear Avoidance Beliefs Questionnaire (FABQ) and the role of fear-avoidance beliefs in chronic low back pain and disability.
Burton AK, Waddell G, Tillotson KM, Summerton N. Information and advise to patients with low back pain can have a positive effect: a randomized controlled trial of a novel educational booklet in primary care.
Pfingsten M, Kroner-Herwig B, Leibing E, Kronshage U, Hildebrandt J. Validation of the German version of the Fear-Avoidance Beliefs Questionnaire (FABQ).
Chaory K, Fayad F, Rannou F, Fermanian J, Revel M, Poiraudeau S. Validation of the French version of the Fear Avoidance Beliefs Questionnaire (FABQ).
Kopec JA, Esdaile JM, Abrahamowicz M et al. The Quebec Back Pain Disability Scale. Measurement properties.
Zigmond AS, Snaith RP. The hospital anxiety and depression scale.
Ravaud P, Giraudeau B, Logeart I et al. Management of osteoarthritis (OA) with an unsupervised home based exercise programme and/or patient administered assessment tools. A cluster randomised controlled trial with a 2 × 2 factorial design.
Buchbinder R, Jolley D, Wyatt M. Population based intervention to change back pain beliefs and disability: three part evaluation.
Buchbinder R, Jolley D. Population based intervention to change back pain beliefs: three year follow up population survey.
Croft PR, MacFarlane GJ, Papageorgiou AC, Thomas E, Silman AJ. Outcome of low back pain in general practice: a prospective study.
Rainville J, Carlson N, Polatin P, Gatchel RJ, Indahl A. Exploration of physicians’ recommendations for activities in chronic low back pain.
Li LC, Bombardier C. Physical therapy management of low back pain: an exploratory survey of therapist approaches.
Epstein RM, Hundert EM. Defining and assessing professional competence.
Landon BE, Normand SL, Blumenthal D, Daley J. Physician clinical performance assessment: prospects and barriers.
Rainville J, Bagnall D, Phalen L. Health care providers’ attitudes and beliefs about functional impairments and chronic back pain.
Author notes
Service de Médecine Physique et Réadaptation, Hôpital Cochin (AP-HP), Université Paris 5, Institut Fédératif de Recherche (IFR 25) Handicap INSERM, 27 rue du Faubourg Saint-Jacques, 75679 Paris Cedex 14, 1Département d’Epidémiologie, Biostatistique et de Recherche Clinique, Groupe Hospitalier Bichat-Claude Bernard (AP-HP), Université Paris 7, 75018 Paris, 2Centre de Médecine Physique et Réadaptation Notre Dame, Avenue Joseph Claussat, BP 86, 63 404 Chamalières Cedex, 3Service de Rhumatologie, Hôpital de la pitié-Salpêtrière (AP-HP), Université Paris 6, 75013 Paris, 4Département de Médecine Générale, Université Paris 7, 75018 Paris, 5Centre anti-douleur, Hôpital Européén Georges Pompidou (AP-HP), Université Paris 5, 75015 Paris and 6Laboratoire Théraplix Aventis Pharma, 75012 Paris, France.

Comments