


Abstract
The use of hand and foot MRI in the diagnostic process of RA has been advocated. Recent studies showed that MRI is helpful in predicting progression from clinically suspect arthralgia (CSA) to clinical arthritis, and from undifferentiated arthritis (UA) to RA. Symptom-free persons can also show inflammation on MRI. This study aimed to evaluate if MRI findings in symptom-free volunteers are relevant when defining a positive MRI.
Two hundred and twenty-five CSA patients and two hundred and one UA patients underwent MRI of MCP, wrist and MTP joints at baseline and were followed for 1 year on progression to arthritis and RA, respectively, as reported previously. MRI was considered positive if ⩾ 1 joint showed inflammation (called uncorrected definition), or if ⩾ 1 joint had inflammation that was present in < 5% of persons of the same age category at the same location (called 5% corrected definition). Test characteristics were compared for both definitions.
By using MRI data of symptom-free volunteers as reference, specificity of MRI-detected inflammation increased from 22 to 56% in CSA patients, and from 10 to 36% in UA patients. The sensitivity was not affected; it was 88 and 85% in CSA patients and 93 and 93% in UA patients. The accuracy also increased, from 32 to 60% in CSA patients and 22 to 44% in UA patients.
The use of a reference population resulted in a substantial reduction of false-positive results, without influencing the sensitivity. Although common for other tests in medicine, this phenomenon is novel for MRI in the early detection of RA.
Rheumatology key messages
A definition for RA MRI positivity incorporating a symptom-free reference population resulted in a 2-fold increased specificity.
The use of a symptom-free reference population had no major influences on the sensitivity for MRI in RA.
Introduction
MRI is sensitive in detecting local inflammation in hand and foot joints. Although compelling evidence suggests that early treatment of RA is associated with a better outcome, an early disease presentation is frequently accompanied by an incompletely developed clinical phenotype. In this light, the EULAR imaging taskforce has recommended that hand and foot MRI can be used to facilitate the diagnostic process of RA [1]. Several studies have shown that MRI-detected subclinical inflammation is associated with progression from clinically suspect arthralgia (CSA) to clinical arthritis and from undifferentiated arthritis (UA) to RA, independent of other predictors [1–6].
Acknowledging the value of MRI, the subsequent question is how to define a positive MRI result. Several groups have evaluated MRI-detected joint inflammation in the healthy population [7–12]. The largest study up to now included almost 200 symptom-free persons of different age categories [13]. In line with findings of earlier smaller studies, this study observed that low-graded MRI-detected inflammation occurs in the general population, especially in older persons, and at preferential locations (e.g. MTP1, MCP2, 3 and wrist for synovitis; MTP1, lunate and scaphoid for bone marrow oedema (BMO); extensor carpi ulnaris tendon and flexor digitorum tendon of MCP3 for tenosynovitis) [8]. It has been questioned whether MRI-detected inflammation of a reference population is relevant to consider when defining an MRI positive for local inflammation, or whether this is irrelevant (for instance noise induced by sensitive scan protocols or inadequate readers) [14]. If findings observed in symptom-free persons are irrelevant, then taking these into consideration when defining a positive MRI, this can result in a decreased or unchanged accuracy to predict arthritis or RA development. In contrast, if symptom-free persons truly have low-grade inflammation at certain locations at a certain age, then considering this information will result in reduced numbers of false-positives and an increased predictability.
In medicine, the definition of a positive test result often incorporates findings of a reference population. For instance, the cut-offs for several auto-antibody tests were determined relative to findings done in healthy controls [15]. The ESR is another example. A normal population of different ages was explored 50 years ago and resulted in a definition of an abnormal ESR that is age-dependent [16]. The question arose of whether a similar process is required to determine a positive MRI. Therefore, this study evaluated the validity of taking inflammation detected in a symptom-free population into consideration when defining a positive MRI. MRI data of two previously published cohorts of CSA and UA patients were studied to this end [2, 6].
Methods
Participants
CSA cohort
The CSA cohort was a population-based inception cohort that started at the rheumatology outpatient clinic in Leiden, The Netherlands, with the aim of studying the symptomatic phase of RA that precedes clinical arthritis. Inclusion required the presence of arthralgia of small joints for <1 year that, because of the character of the symptoms, a rheumatologist suspected would progress to RA; a detailed description is provided elsewhere [2]. Patients included between April 2012 and March 2015 with available baseline MRI data were studied (n = 225). Follow-up ended when clinical arthritis had developed, or else after 2 years. Outcome here was arthritis development, identified at joint examination by experienced rheumatologists, within 1-year follow-up.
Early arthritis cohort
This longitudinal inception cohort includes patients with clinically confirmed arthritis and symptom duration <2 years that presented to the Leiden rheumatology outpatient clinic. The cohort was initiated in 1993 and baseline MRI was added to the study protocol in August 2010. Patients that presented with UA (n = 201) between August 2010 and October 2014 were studied on progression to RA (1987 criteria) during 1-year follow-up, as described in detail in [17].
Symptom-free volunteers
Symptom-free volunteers that served as a reference (n = 193) were recruited via advertisements in local newspapers and websites and had no history of inflammatory rheumatic diseases, no joint symptoms during the last month and no evidence of arthritis at physical examination, as described in [13]. The age ranged from 19 to 89 years; volunteers were divided into three age groups (18–40 years, n = 51; 40–59 years, n = 90; ⩾60 years, n = 52). From these data, percentages were calculated for the prevalence of synovitis, BMO and tenosynovitis for different severities, joints and age categories as described in [12].
The different sets of participants are schematically depicted in supplementary Fig. S1, available at Rheumatology Online. All studies were approved by the local Medical Ethical Committee (Leiden University Medical Centre). All participants signed for informed consent.
MRI and scoring
Patients and volunteers were scanned on the same scanner (an MSK Extreme 1.5 T extremity MR system (GE Healthcare, Wisconsin, USA). MRI scans of the second to fifth MCP and wrist joints and first to fifth MTP joints were made of the most affected side, or the dominant side in the case of equally severe symptoms and in the symptom-free volunteers. Patients were asked not to use any NSAIDs 24 h before MRI. Sequences acquired were coronal pre-contrast T1-weighted fast spin-echo and coronal and axial post-contrast T1-weighted fast spin-echo with frequency-selective fat suppression of MCP and wrist, and post-contrast coronal and axial sequences of MTP. More details are provided elsewhere [2, 13, 17].
Synovitis and BMO were scored as described previously and in the supplementary methods, available at Rheumatology Online [2, 13, 17]. Total inflammation scores consisted of the sum of synovitis, BMO and tenosynovitis scores. Trapezium and base metacarpal-1 (CMC-1) was excluded. Scans of symptom-free volunteers were evaluated with the same methodology as scans of patients. All inter- and intraclass coefficients were >0.93 (see supplementary methods, available at Rheumatology Online).
Different definitions for a positive MRI were compared. First, an MRI was considered positive when each of two readers indicated inflammation in at least one joint (a score ⩾1 for synovitis, BMO or tenosynovitis), referred to as the uncorrected definition. Second, an MRI was positive if each of two readers indicated inflammation in at least one joint (synovitis, BMO or tenosynovitis) that was present in <5% of the healthy persons in the same age-category at the same location [13], referred to as the 5% corrected definition. In addition to the evaluation of a reference population, we also evaluated the cut-off used. Therefore, a more stringent definition was also explored with a cut-off of <1%, meaning that MRI was considered positive when two readers indicated inflammation in at least one joint that was present in <1% of the reference population, referred to as the 1% corrected definition. For example, a 65-year-old patient with grade 1 synovitis in MCP-4 was indicated positive for the uncorrected definition, positive for the 5% corrected definition as it was seen in 4% of controls in this age category on this location, and negative for the 1% corrected definition. Likewise, a 65-year-old patient with grade 1 tenosynovitis of the flexor of MCP-3 was positive for the uncorrected definition and for negative the 5% and 1% corrected definitions as it was seen in 12% of controls [13].
Statistics
Test characteristics and predictive accuracies with corresponding 95% CIs were calculated. SPSS Statistics v23 was used (IBM, Armonk, NY, USA).
Results
Patients with CSA and UA had a mean age of 44 and 54 years, 77 and 61% were female, and they had a median MRI-inflammation score of 2.5 and 7.0, respectively. Further characteristics are shown in supplementary Table S1, available at Rheumatology Online.
Comparing definitions of MRI positivity for inflammation
MRI had a high sensitivity for both the uncorrected and the 5% corrected definition, which was 88 and 85% in CSA patients and 93 and 93% in UA patients, respectively. Using the 5% corrected definition, the specificity improved from 22 to 56% in CSA patients and from 10 to 36% in UA patients. The accuracy increased from 32 to 60% in CSA patients and from 22 to 44% in UA patients, as illustrated in Fig. 1. Predictive values also increased when using the corrected definition instead of the uncorrected definition (Table 1).
Test characteristics of MRI to detect development of arthritis and RA for uncorrected and corrected definitions
| Sensitivity (95% CI), % | Specificity (95% CI), % | PPV (95% CI), % | NPV (95% CI), % | Accuracy (95% CI), % | AUC | |
|---|---|---|---|---|---|---|
| CSA patients | ||||||
| Main analysis for total MRI inflammation | ||||||
| Uncorrected | 88 (73, 95) | 22 (17, 28) | 16 (12, 22) | 91 (80, 97) | 32 (26, 38) | 0.55 |
| Corrected (<5%) | 85 (69, 93) | 56 (49, 63) | 25 (18, 34) | 96 (90, 98) | 60 (54, 67) | 0.71 |
| Corrected (<1%) | 67 (50, 80) | 72 (65, 78) | 29 (20, 40) | 93 (87, 96) | 71 (65, 77) | 0.69 |
| Sub-analyses per MRI feature | ||||||
| BMO | ||||||
| Uncorrected | 48 (33, 65) | 48 (41, 55) | 14 (9, 21) | 84 (76, 90) | 48 (42, 55) | 0.48 |
| Corrected (<5%) | 30 (17, 47) | 82 (76, 87) | 22 (13, 36) | 87 (82, 91) | 74 (68, 79) | 0.56 |
| Synovitis | ||||||
| Uncorrected | 73 (56, 85) | 44 (37, 51) | 18 (13, 26) | 90 (83, 95) | 48 (42, 55) | 0.58 |
| Corrected (<5%) | 52 (35, 67) | 78 (71, 83) | 28 (19, 41) | 90 (85, 94) | 74 (68, 79) | 0.65 |
| Tenosynovitis | ||||||
| Uncorrected | 70 (53, 83) | 70 (64, 76) | 29 (20, 39) | 93 (88, 96) | 70 (64, 76) | 0.70 |
| Corrected (<5%) | 70 (53, 83) | 76 (70, 82) | 33 (23, 45) | 94 (89, 96) | 75 (69, 80) | 0.73 |
| Sub-analyses per location | ||||||
| MTP | ||||||
| Uncorrected | 42 (27, 59) | 68 (61, 74) | 19 (11, 29) | 87 (81, 92) | 64 (58, 70) | 0.55 |
| Corrected (<5%) | 33 (20, 50) | 89 (83, 92) | 33 (20, 50) | 89 (83, 92) | 80 (75, 85) | 0.61 |
| MCP | ||||||
| Uncorrected | 70 (53, 83) | 58 (51, 65) | 22 (15, 31) | 92 (85, 95) | 60 (53, 66) | 0.64 |
| Corrected (<5%) | 64 (47, 78) | 72 (66, 78) | 28 (19, 40) | 92 (87, 95) | 71 (65, 77) | 0.68 |
| Wrist | ||||||
| Uncorrected | 67 (50, 80) | 45 (38, 52) | 17 (12, 25) | 89 (81, 94) | 48 (42, 55) | 0.56 |
| Corrected (<5%) | 42 (27, 59) | 76 (70, 82) | 23 (14, 35) | 88 (83, 93) | 71 (65, 77) | 0.59 |
| Sub-analyses per age group | ||||||
| 18–40 years | ||||||
| Uncorrected | 77 (50, 92) | 39 (29, 51) | 19 (11, 31) | 90 (75, 97) | 45 (35, 56) | 0.58 |
| Corrected (<5%) | 77 (50, 92) | 59 (48, 70) | 26 (15, 41) | 93 (82, 98) | 62 (51, 72) | 0.68 |
| 40–60 years | ||||||
| Uncorrected | 93 (70, 99) | 13 (8, 21) | 14 (9, 22) | 93 (69, 99) | 24 (17, 32) | 0.53 |
| Corrected (<5%) | 87 (62, 96) | 54 (44, 63) | 22 (13, 34) | 96 (88, 99) | 58 (49, 67) | 0.70 |
| 60+ years | ||||||
| Uncorrected | 100 (57, 100) | 5 (1, 22) | 19 (9, 38) | 100 (21, 100) | 22 (11, 41) | 0.52 |
| Corrected (<5%) | 100 (57, 100) | 50 (31, 69) | 31 (14, 56) | 100 (74, 100) | 59 (41, 75) | 0.75 |
| UA patients | ||||||
| Main analysis for total MRI inflammation | ||||||
| Uncorrected | 93 (78, 98) | 10 (7, 16) | 15 (10, 21) | 90 (70, 97) | 22 (17, 29) | 0.52 |
| Corrected (<5%) | 93 (78, 98) | 36 (29, 43) | 20 (14, 27) | 97 (89, 99) | 44 (38, 51) | 0.65 |
| Corrected (<1%) | 79 (62, 90) | 51 (44, 59) | 21 (15, 30) | 94 (87, 97) | 55 (48, 62) | 0.65 |
| Sub-analyses per MRI feature | ||||||
| BMO | ||||||
| Uncorrected | 76 (58, 88) | 32 (25, 39) | 16 (11, 23) | 89 (78, 94) | 38 (32, 45) | 0.54 |
| Corrected (<5%) | 41 (26, 59) | 56 (48, 63) | 14 (8, 22) | 85 (77, 90) | 54 (47, 60) | 0.49 |
| Synovitis | ||||||
| Uncorrected | 93 (78, 98) | 22 (17, 29) | 17 (12, 23) | 95 (83, 99) | 32 (26, 39) | 0.58 |
| Corrected (<5%) | 62 (44, 77) | 58 (51, 65) | 20 (13, 29) | 90 (83, 94) | 59 (52, 65) | 0.60 |
| Tenosynovitis | ||||||
| Uncorrected | 83 (65, 92) | 45 (38, 53) | 20 (14, 28) | 94 (87, 97) | 51 (44, 58) | 0.64 |
| Corrected (<5%) | 83 (65, 92) | 58 (51, 65) | 25 (17, 35) | 95 (89, 98) | 62 (55, 68) | 0.70 |
| Sub-analyses per location | ||||||
| MTP | ||||||
| Uncorrected | 52 (34, 69) | 48 (41, 56) | 14 (9, 22) | 86 (77, 91) | 49 (42, 56) | 0.50 |
| Corrected (<5%) | 24 (12, 42) | 77 (70, 82) | 15 (7, 28) | 86 (79, 90) | 69 (62, 75) | 0.50 |
| MCP | ||||||
| Uncorrected | 86 (69, 95) | 43 (36, 50) | 20 (14, 28) | 95 (88, 98) | 49 (42, 56) | 0.65 |
| Corrected (<5%) | 79 (62, 90) | 60 (52, 67) | 25 (17, 35) | 94 (89, 97) | 63 (56, 69) | 0.70 |
| Wrist | ||||||
| Uncorrected | 83 (65, 92) | 33 (27, 40) | 17 (12, 24) | 92 (82, 97) | 40 (34, 47) | 0.60 |
| Corrected (<5%) | 69 (51, 83) | 62 (55, 69) | 24 (16, 34) | 92 (86, 96) | 63 (56, 70) | 0.66 |
| Sub-analyses per age group | ||||||
| 18–40 years | ||||||
| Uncorrected | 33 (6, 79) | 19 (9, 35) | 4 (1, 18) | 75 (41, 93) | 20 (10, 36) | 0.26 |
| Corrected (<5%) | 33 (6, 79) | 50 (34, 66) | 6 (1, 27) | 89 (67, 97) | 49 (33, 64) | 0.42 |
| 40–60 years | ||||||
| Uncorrected | 100 (68, 100) | 14 (8, 23) | 10 (5, 19) | 100 (74, 100) | 22 (14, 31) | 0.57 |
| Corrected (<5%) | 100 (68, 100) | 44 (33, 55) | 15 (8, 27) | 100 (90, 100) | 49 (39, 59) | 0.72 |
| 60+ years | ||||||
| Uncorrected | 100 (82, 100) | 2 (0, 9) | 23 (15, 34) | 100 (21, 100) | 24 (16, 35) | 0.51 |
| Corrected (<5%) | 100 (82, 100) | 18 (11, 30) | 27 (18, 39) | 100 (74, 100) | 37 (27, 48) | 0.59 |
Different definitions for a positive MRI were compared for CSA patients and for UA patients. First, an MRI was considered positive when each of two readers indicated inflammation (in ≥ 1 joint a score ≥1 for synovitis, BMO or tenosynovitis), called the uncorrected definition. Second, an MRI was positive if inflammation was present in ≥ 1 joint and in < 5% of the healthy persons in the same age category at the same location, the 5% corrected definition. Additionally, an MRI was considered positive if inflammation was present in ≥ 1 joint and in < 1% of the healthy persons in the same age category at the same location, the 1% corrected definition. Data were also split on inflammation feature, location and age group. Age groups in both groups ranged from 18 to 40 years (CSA, n = 84; UA, n = 35), 40 to 60 years (CSA, n = 114; UA, n = 88) and 60+ years (CSA, n = 27; UA, n = 78); 33 of 225 CSA patients developed clinical arthritis; 29 of 201 UA patients developed RA (according to 1987 criteria). AUC: area under the receiver operating characteristic curve; BMO: bone marrow oedema; LR: likelihood ratio; NPV: negative predictive value; PPV: positive predictive value.
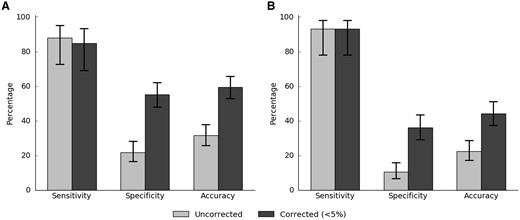
Test characteristics of MRI to detect development of arthritis (A) and RA (B)
Test characteristics of MRI-detected inflammation for the development of arthritis in CSA patients (A) and RA in UA patients (B) during 1-year follow-up. Two definitions for a positive MRI were compared. First, an MRI was considered positive when each of two readers indicated inflammation (in ≥ 1 joint a score ≥1 for synovitis, BMO or tenosynovitis), called the uncorrected definition. Second, an MRI was positive if teach of two readers indicated inflammation in ≥ 1 joint that was present in < 5% of the healthy persons in the same age category at the same location, called the 5% corrected definition. Error bars indicate corresponding 95% CIs.
We not only evaluated the use of a reference population, we also evaluated the cut-off used. Therefore, a more stringent definition was also studied, the 1% corrected definition, indicating that MRI inflammation was considered present if ⩽1% of the age-matched reference population had inflammation at the same location. This yielded increased specificity and accuracy, but now at the cost of a decreased sensitivity; it decreased from 88 to 67% in CSA patients and from 93 to 79% in UA patients (Table 1).
Sub-analyses for different MRI features and age categories
To explore the different features incorporated in the cut-off, analyses were split based on inflammation feature, location and age category, as shown in Table 1 for CSA and UA patients. Overall, results for the sub-analyses were similar in both cohorts. For the 5% corrected definition compared with the uncorrected definition this resulted in increased specificities and stable or lower sensitivities. The accuracy and positive predictive value also increased in all sub-analyses and the negative predictive value remained stable. The least increase in specificity was seen for tenosynovitis, compared with synovitis and BMO. For data of total MRI inflammation based on age group, specificities were very low when using the uncorrected definition in patients aged above 60 years and increased considerably after application of the 5% corrected definition (e.g. from 5 to 50%, Table 1).
Discussion
Early recognition of patients with imminent RA is essential. Early treatment of RA has been associated with better outcomes. It has been suggested that this also applies for the earlier phases of UA and CSA [1]. An early diagnosis is difficult if the phenotype is incompletely developed, and it has been suggested that MRI-detected inflammation is useful in the diagnostic process, though insufficiently accurate when used alone [1, 18]. MRI is a relatively novel technique and although it is not regularly used in daily clinical practice, it is sometimes used in certain patients or in some places. This study evaluated different definitions for a positive MRI, and in particular the effect of the use of a reference population of symptom-free individuals. The data showed that a definition that incorporates a reference population drastically improved the discriminative ability of MRI: it yielded an improved specificity without major influences on the sensitivity. Thus, the number of false-positive test results decreased.
In the field of laboratory tests (for instance auto-antibodies, ESR), data for a reference population are generally used to define a positive test result. For instance a recent auto-antibody test was developed with the 5% definition and earlier an ESR test with ∼1% definition [15, 16]. Also in imaging this is a frequently used principle. For example an MRI made to detect a hernia nuclei pulposi can only be interpreted in light of the clinical presentation, as healthy subjects also show MRI abnormalities without clinical consequences [19]. The current study is the first demonstrating the value of knowledge of a symptom-free reference population for MRI of hand and foot joints. In clinical practice the risk of false-positive results is presumably most relevant in the setting of UA, as a positive MRI result may influence the decision to initiate disease modifying anti-rheumatic medication.
In general, when a cut-off changes, an increased specificity is paralleled by a decreased sensitivity. However, in the main analyses in this study, we did not change a cut-off point, but incorporated data of a reference population in the definition of a positive MRI. Then the number of false-positives reduced without affecting the sensitivity. Next, in addition to incorporating a reference population, a more stringent cut-off was evaluated. Then, as expected when changing cut-offs, the specificity and predictability increased even more, but now at the cost of a decreased sensitivity, indicating that patients that later on developed arthritis were missed.
The main analysis was split on the different inflammation features, revealing similar results, with the least increase in specificity for tenosynovitis. This is explained by the fact that tenosynovitis was least prevalent in controls [13]. Specificity of MRI-detected inflammation in the age group >60 years was very low in both cohorts and increased considerably with the use of a reference population. This is in line with previous findings that MRI-detected inflammation increases with age [13, 17]; in other words, in a general older population some MRI-detected inflammation occurs in certain joints. Without correction, this was considered abnormal, whereas after correction for the reference population, the false-positive rate decreased and specificity increased. Of note, some sub-analyses within age groups were done on small patient groups per age category.
We are aware of the fact that the OMERACT RA MRI scoring (RAMRIS) system was not derived for diagnostics and that according to RAMRIS BMO is scored on a T2fatsat instead of a post-contrast, T1fatsat sequence [20]. However, all patients and participants were scanned and scored according to the same methodology. Hence, these choices do not affect the comparisons made. Nonetheless, if MRI were to be regularly used in the diagnostic process, evaluation scoring methods other than RAMRIS might be useful, and the number of symptom-free persons serving as reference should be increased to arrive at higher numbers per age category.
In conclusion, the current study performed in two population-based longitudinal cohorts demonstrated the value of a reference population in the definition of an abnormal MRI. If MRI were to be more commonly used for the early detection of (imminent) RA, a larger reference population may be required. The present finding of a 2-fold increase in specificity with a stable sensitivity underlines the relevance of further studies on MRI inflammation in persons from the general population to arrive at a data-driven definition of an abnormal hand or foot MRI.
Funding: The research leading to these results was funded by the Dutch Arthritis Foundation and a Vidi-grant of the Netherlands Organisation for Health Research and Development. The funding sources had no role in the design and conduct of the study; collection, management, analysis and interpretation of the data; preparation, review or approval of the manuscript; or decision to submit the manuscript for publication.
Disclosure statement: The authors have declared no conflicts of interest.
Supplementary data
Supplementary data are available at Rheumatology Online.

Comments