


Abstract
Associations between food and beverage groups and the risk of diet-related chronic disease (DRCD) have been the subject of intensive research in preventive nutrition. Pooled/meta-analyses and systematic reviews (PMASRs) aim to better characterize these associations. To date, however, there has been no attempt to synthesize all PMASRs that have assessed the relationship between food and beverage groups and DRCDs. The objectives of this review were to aggregate PMASRs to obtain an overview of the associations between food and beverage groups (n = 17) and DRCDs (n = 10) and to establish new directions for future research needs. The present review of 304 PMASRs published between 1950 and 2013 confirmed that plant food groups are more protective than animal food groups against DRCDs. Within plant food groups, grain products are more protective than fruits and vegetables. Among animal food groups, dairy/milk products have a neutral effect on the risk of DRCDs, while red/processed meats tend to increase the risk. Among beverages, tea was the most protective and soft drinks the least protective against DRCDs. For two of the DRCDs examined, sarcopenia and kidney disease, no PMASR was found. Overweight/obesity, type 2 diabetes, and various types of cardiovascular disease and cancer accounted for 289 of the PMASRs. There is a crucial need to further study the associations between food and beverage groups and mental health, skeletal health, digestive diseases, liver diseases, kidney diseases, obesity, and type 2 diabetes.
Introduction
The role of dietary risk factors in noncommunicable chronic diseases is now well recognized.1,–3 Dietary risk factors have been calculated to account for approximately 14% of disability-adjusted life-years and approximately 26% of deaths in the United States.2 Indeed, the transition from a traditional diet toward a diet composed of more industrialized, refined, and energy-dense foods (i.e., Western diet) has led to the well-known worldwide epidemics of obesity and type 2 diabetes (i.e., the so-called “nutritional transition”). The causes of these two chronic metabolic diseases may be related to the consumption of an unbalanced diet over many years. In addition, both diseases may be risk factors for other diet-related chronic diseases (DRCDs), including cardiovascular diseases (CVD), cancers, digestive diseases, mental illnesses, sarcopenia, and some skeletal, kidney, and liver diseases.4 It was recently shown that the origin of these DRCDs is multifactorial and may result from at least 10 different deregulated metabolic parameters, including antioxidant status, acid-base imbalance, increased inflammatory status, impaired carbohydrate/lipid/one-carbon metabolism, impaired functioning of neurons and DNA transcription, hypertension, and/or modified digestive microflora.4 This supports the need to consume a diversified diet rich in a variety of micronutrients and bioactive compounds, which may have the potential to synergetically counterbalance the above-mentioned deregulated metabolic parameters.
The scientific literature shows that diets rich in unrefined and/or minimally processed plant-based foods (i.e., rich in micronutrients and fiber and low in saturated fat) and/or seafoods (e.g., the Prudent, Mediterranean, and Okinawa diets) are protective against the development of risk factors for several chronic diseases, notably cancers, CVD, obesity, and type 2 diabetes.5,–10 However, while increasingly more observational/epidemiological studies now examine associations between risk of disease and dietary patterns (rather than food groups), studies conducted to date in humans have been focused primarily on food groups, and most observational studies have attempted to associate the intake of particular food groups with the prevalence of DRCDs. For example, some meta-analyses have concluded that fruits and vegetables are somewhat protective against CVD and cancers,11,–14 whole grains are protective against diabetes,15,16 and fish is protective against CVD.17,–19 On the other hand, a high consumption of red/processed meat over many years leads to higher prevalence of cancer.20,–22 Other food groups studied, though to a lesser extent, include legumes, nuts and seeds, eggs, poultry, and dairy products. With regard to beverages, nutrition research has focused mainly on tea, coffee, wine, milk, and sugar-sweetened beverages.
The trends revealed, however, are rarely unidirectional; often, while some studies show protective effects, others find no association. Therefore, it is still unclear whether food groups and beverages can be considered definitively protective or definitively deleterious. For example, there are conflicting opinions about the health protectiveness of milk. There is, therefore, a need for a more holistic approach that incorporates all of the accumulating scientific evidence, i.e., a systematic and exhaustive review of the literature that includes quantitative (pooled/meta-analyses) as well as qualitative (systematic reviews) syntheses.
In a previous study based on an exhaustive review of the literature published from 1950 to 2011, a search for associations between 10 main DRCDs and 10 physiologically relevant deregulated metabolic parameters was conducted; in addition, how each disease may be a risk factor for the 9 other diseases was assessed.4 The objective of this current, second study is twofold: 1) to propose a synthesis of all pooled/meta-analyses and systematic reviews (PMASRs) that have investigated associations between intakes of food groups and beverages and the risk of DRCDs; and 2) to present an updated assessment of the research behind such associations and to establish current areas in which research is most needed. Such a systematic and exhaustive literature review has, up to now, never been performed.
An analysis of 304 articles published from 1950 to August 31, 2013, identified trends related to the health protectiveness of the main food groups and beverages toward the risks of different DRCDs. Some of these trends can be considered strong enough to convert into clear and durable recommendations for public policies related to preventive nutrition and health, e.g., through a food guide pyramid, while others remain ambiguous.
Methods
The DRCDs were chosen on the basis of scientific literature and practical knowledge as described previously.4 Briefly, 10 DRCDs that may occur following a chronically unbalanced diet and encompass the main physiological functions of the organism were selected: overweight/obesity (or, more generally, weight gain), type 2 diabetes, mental illnesses (mainly depression, Alzheimer's and Parkinson's diseases, and cognitive decline), skeletal diseases (mainly fracture risk and osteoporosis), sarcopenia/muscle loss, digestive tract diseases, liver diseases, kidney diseases, CVD, and cancers.
Food groups and beverages were selected on the basis of their study frequency in the literature and their representativeness within the diets of Westernized countries and included the following: tea (from the Camellia sinensis genus of the Theaceae family only), coffee (excluding decaffeinated coffee), milk, wine (red, rosé, and white wines were considered), sweetened beverages, fruits and vegetables, vegetables, fruits, whole-grain cereals, refined cereals, legumes, nuts and seeds, dairy products, eggs, red and processed meats, poultry, and fish. Since dietary fat may be involved in the development of chronic disease, milk – if fat content was specified in the articles analyzed – was stratified as whole (3.5–4% fat), semi-skim/low-fat (1.5–1.8% fat), and skim (<0.1% fat) milk. If no information on fat content was given in the articles, milk was considered undefined and may include all types of milk. However, before 1980, milk was consumed primarily as whole milk. Sweetened beverages included all soft drinks enriched with sugars (e.g., sweetened fruit juices and sodas) and could be carbonated and/or caffeinated. Three matrices were constructed as follows: 1) beverages (n = 5) versus DRCDs (n = 10); 2) plant-based food groups (n = 7) versus DRCDs (n = 10); and 3) animal-based food groups (n = 5) versus DRCDs (n = 10) (see Tables S1–S3 in the Supporting Information online).
For each of these 170 associations within the 170 matrix cells (e.g., “tea vs. overweight/obesity” for matrix 1 and “fruits and vegetables versus CVD” for matrix 2), an exhaustive search of the scientific evidence published between 1950 and August 2013 in the ISI Web of Knowledge database was conducted using specific search histories to include all DRCDs and food groups and beverages as well as all corresponding synonyms. All PMASRs were then identified and collected. By definition, PMASRs result from the selection of at least 2 observational or interventional studies after the application of rigorous inclusion criteria by, in general, at least two reviewers. Meta-analysis and pooled analysis sensu stricto were confounded. Human case reports, animal studies, and in vitro studies were not included. Finally, the references selected were sorted into the 170 cells of the 3 matrices (Tables S1–S3). For each cell, the number of PMASRs was counted. Based on the level of significance of the multi-adjusted odds ratio (OR), hazard ratio (HR), or relative risk (RR) (i.e., P < 0.05 or P ≥ 0.05), the associations between food groups and beverages and DRCDs were determined as follows: ⊕ indicates a significant protective effect against DRCD risk; Θ indicates a significant effect to increase DRCD risk; and Ø indicates an absence of effect or a neutral effect on DRCD risk. In a given systematic review, the original studies selected may show positive, neutral, or negative results. In such cases, the different studies of the given systematic reviews were sorted into 1, 2, or 3 different boxes of the matrices and may be therefore counted several times (Tables S1–S3). Moreover, studies were ranked by order of scientific relevance as follows: 1) interventional study, 2) longitudinal study, 3) case-control study, 4) cross-sectional study, and 5) ecological study. There is no official methodology for pooling the HRs/ORs/RRs of several meta-analyses. Therefore, all HRs/ORs/RRs for a given association were synthesized by the range of minimum and maximum values.
Results
A total of 304 PMASRs were analyzed for the 170 associations studied (Tables S1–S3).
Associations between beverages and risk of diet-related chronic diseases
One hundred forty-nine PMASRs were analyzed to explore the associations between common beverages and DRCDs (Table S1). Some references were common to several cells (e.g., a reference may provide associations with DRCD risk for both coffee and tea), which is why the sum of references for “⊕,” “Ø,” and “Θ” effects relative to total beverages in Table 1 was greater than 149 (n = 250). Cancers (100 references) and CVD (24 references), were the most commonly studied DRCDs, followed by overweight/obesity (10 references), mental illnesses (6 references), diabetes (5 references), skeletal disorders (4 references), digestive diseases (2 references), and liver diseases (1 reference) (Table S1). No reference was found for muscle disease or kidney disease. Tea and coffee were the most studied beverages (56 references), followed by milk (30 references), wine (19 references), and sweetened beverages (13 references) (Table S1). The main trends for the effects of beverage consumption on DRCD prevalence are detailed below.
Number of references (pooled/meta-analyses and systematic reviews) found for each of the 170 associations studied and ranked by protective (⊕), neutral (Ø), and deleterious (Θ) effects
| Beverage, food, or food group | Overweight/ obesity | Type 2 diabetes | Mental health | Skeletal health | Sarcopenia/muscle loss | Digestive diseases | Liver diseases | Kidney diseases | CVD | Cancers | Totala a | ||||||||||||||||||||||
|---|---|---|---|---|---|---|---|---|---|---|---|---|---|---|---|---|---|---|---|---|---|---|---|---|---|---|---|---|---|---|---|---|---|
| ⊕ | Ø | Θ | ⊕ | Ø | Θ | ⊕ | Ø | Θ | ⊕ | Ø | Θ | ⊕ | Ø | Θ | ⊕ | Ø | Θ | ⊕ | Ø | Θ | ⊕ | Ø | Θ | ⊕ | Ø | Θ | ⊕ | Ø | Θ | ⊕ | Ø | Θ | |
| Beverages | |||||||||||||||||||||||||||||||||
| Tea | 1 | 1 | 0 | 1 | 2 | 0 | 3 | 1 | 0 | 0 | 0 | 0 | 0 | 0 | 0 | 1 | 1 | 0 | 1 | 0 | 0 | 0 | 0 | 0 | 4 | 2 | 0 | 16 | 37 | 4 | 27 | 44 | 4 |
| Coffee | 0 | 1 | 1 | 3 | 0 | 0 | 3 | 1 | 0 | 0 | 0 | 0 | 0 | 0 | 0 | 0 | 0 | 0 | 0 | 0 | 0 | 0 | 0 | 0 | 4 | 6 | 4 | 19 | 24 | 10 | 29 | 32 | 15 |
| Milk | 0 | 3 | 2 | 0 | 1 | 0 | 1 | 1 | 0 | 3 | 1 | 0 | 0 | 0 | 0 | 0 | 0 | 0 | 0 | 0 | 0 | 0 | 0 | 0 | 3 | 2 | 1 | 7 | 22 | 4 | 14 | 30 | 7 |
| Wine | 0 | 0 | 0 | 0 | 0 | 0 | 0 | 0 | 0 | 0 | 0 | 0 | 0 | 0 | 0 | 0 | 0 | 0 | 0 | 0 | 0 | 0 | 0 | 0 | 6 | 2 | 1 | 5 | 10 | 2 | 11 | 12 | 3 |
| Sweetened beverages | 2 | 5 | 7 | 0 | 0 | 1 | 0 | 0 | 0 | 0 | 0 | 0 | 0 | 0 | 0 | 0 | 1 | 0 | 0 | 0 | 0 | 0 | 0 | 0 | 0 | 0 | 0 | 1 | 5 | 0 | 3 | 11 | 8 |
| Total | 3 | 10 | 10 | 4 | 3 | 1 | 7 | 3 | 0 | 3 | 1 | 0 | 0 | 0 | 0 | 1 | 2 | 0 | 1 | 0 | 0 | 0 | 0 | 0 | 17 | 12 | 6 | 48 | 98 | 20 | 84 | 129 | 37 |
| Plant-based foods | |||||||||||||||||||||||||||||||||
| Fruits & vegetables | 3 | 3 | 2 | 1 | 4 | 0 | 1 | 1 | 0 | 1 | 1 | 0 | 0 | 0 | 0 | 0 | 0 | 0 | 0 | 0 | 0 | 0 | 0 | 0 | 6 | 2 | 1 | 5 | 6 | 0 | 17 | 17 | 3 |
| Vegetables | 2 | 2 | 0 | 0 | 4 | 0 | 1 | 1 | 0 | 0 | 0 | 0 | 0 | 0 | 0 | 0 | 0 | 0 | 0 | 0 | 0 | 0 | 0 | 0 | 3 | 3 | 0 | 13 | 16 | 3 | 19 | 26 | 3 |
| Fruits | 2 | 1 | 0 | 0 | 4 | 0 | 0 | 1 | 0 | 0 | 0 | 0 | 0 | 0 | 0 | 0 | 0 | 0 | 0 | 0 | 0 | 0 | 0 | 0 | 5 | 1 | 0 | 17 | 15 | 1 | 24 | 22 | 1 |
| Whole-grain cereals | 2 | 3 | 0 | 6 | 2 | 0 | 0 | 0 | 0 | 0 | 0 | 0 | 0 | 0 | 0 | 0 | 0 | 0 | 0 | 0 | 0 | 0 | 0 | 0 | 4 | 1 | 0 | 3 | 4 | 1 | 15 | 10 | 1 |
| Refined cereals | 0 | 0 | 1 | 0 | 0 | 4 | 0 | 0 | 0 | 0 | 0 | 0 | 0 | 0 | 0 | 0 | 0 | 0 | 0 | 0 | 0 | 0 | 0 | 0 | 0 | 1 | 0 | 0 | 0 | 1 | 0 | 1 | 6 |
| Legumes | 0 | 0 | 0 | 1 | 3 | 0 | 0 | 0 | 0 | 0 | 0 | 0 | 0 | 0 | 0 | 0 | 0 | 0 | 0 | 0 | 0 | 0 | 0 | 0 | 2 | 1 | 0 | 18 | 9 | 4 | 21 | 13 | 4 |
| Nuts & seeds | 3 | 1 | 1 | 2 | 0 | 0 | 0 | 0 | 0 | 0 | 0 | 0 | 0 | 0 | 0 | 0 | 0 | 0 | 0 | 0 | 0 | 0 | 0 | 0 | 4 | 3 | 1 | 0 | 0 | 0 | 9 | 4 | 2 |
| Totala | 12 | 10 | 3 | 10 | 17 | 0 | 2 | 3 | 0 | 1 | 1 | 0 | 0 | 0 | 0 | 0 | 0 | 0 | 0 | 0 | 0 | 0 | 0 | 0 | 24 | 11 | 2 | 56 | 50 | 9 | 105 | 92 | 14 |
| Animal-based foods | |||||||||||||||||||||||||||||||||
| Dairy products | 3 | 4 | 1 | 4 | 1 | 0 | 1 | 1 | 1 | 2 | 2 | 1 | 0 | 0 | 0 | 0 | 0 | 0 | 0 | 0 | 0 | 0 | 0 | 0 | 2 | 1 | 0 | 5 | 12 | 6 | 17 | 21 | 9 |
| Eggs | 0 | 0 | 0 | 0 | 0 | 1 | 0 | 0 | 0 | 0 | 0 | 0 | 0 | 0 | 0 | 0 | 0 | 0 | 0 | 0 | 0 | 0 | 0 | 0 | 0 | 2 | 1 | 0 | 7 | 2 | 0 | 9 | 4 |
| Red/processed meat | 0 | 1 | 0 | 0 | 2 | 4 | 0 | 0 | 0 | 0 | 0 | 0 | 0 | 0 | 0 | 0 | 0 | 0 | 0 | 0 | 0 | 0 | 0 | 0 | 0 | 1 | 2 | 2 | 17 | 23 | 2 | 21 | 29 |
| Poultry | 0 | 0 | 0 | 0 | 0 | 0 | 0 | 0 | 0 | 0 | 0 | 0 | 0 | 0 | 0 | 0 | 0 | 0 | 0 | 0 | 0 | 0 | 0 | 0 | 0 | 0 | 0 | 0 | 8 | 2 | 0 | 8 | 2 |
| Fish | 0 | 0 | 0 | 0 | 3 | 1 | 2 | 1 | 0 | 0 | 0 | 0 | 0 | 0 | 0 | 0 | 0 | 0 | 0 | 0 | 0 | 0 | 0 | 0 | 12 | 4 | 0 | 5 | 15 | 0 | 19 | 23 | 1 |
| Total | 3 | 5 | 1 | 4 | 6 | 6 | 3 | 2 | 1 | 2 | 2 | 1 | 0 | 0 | 0 | 0 | 0 | 0 | 0 | 0 | 0 | 0 | 0 | 0 | 14 | 8 | 3 | 12 | 59 | 33 | 38 | 82 | 45 |
| Beverages, plant- & animal-based foods combined | |||||||||||||||||||||||||||||||||
| Totala | 18 | 25 | 14 | 18 | 26 | 7 | 12 | 8 | 1 | 6 | 4 | 1 | 0 | 0 | 0 | 1 | 2 | 0 | 1 | 0 | 0 | 0 | 0 | 0 | 55 | 31 | 11 | 116 | 207 | 62 | 227 | 303 | 96 |
Abbreviations: CVD, cardiovascular disease.
Except refined cereals.
Tea
Compared with the lowest/no consumption level, the highest level of tea consumption (i.e., the highest tertile, quartile, or quintile of consumption) tends to be either protective (27 references; Table 1) or not associated (44 references; Table 1) with DRCD risk (Table 2). A higher risk of cancer was reported in only 4 references, 2 of which found a link between tea and colon cancer, 1 of which found a link between tea and ovary cancer, and 1 of which found a link between very hot tea and esophagus cancer (Table S1). Based on meta-analyses only, the highest levels of tea consumption may significantly reduce the risks of type 2 diabetes, Parkinson's disease, CVD, and cancer by a maximum of 16%, 17%, 28%, and 34%, respectively (Table 3). The types of cancer associated with the highest reductions in risk were as follows: lung (−34%), breast (−22%), stomach (−21%), colorectum (−18%; green tea only), and endometrium and kidney (−15%) (Table S1). Higher consumption of tea was associated with a weight reduction of −1.31 kg over 12–13 weeks (Table 3 and Table S1).
| Beverage | Overweight/ obesity | Type 2 diabetes | Mental health | Skeletal health | Digestive diseases | Liver diseases | CVD | Cancers |
|---|---|---|---|---|---|---|---|---|
| Tea | ⊕ | ⊕ | ⊕ | ⊕ | ⊕ | ⊕ | ⊕ (breast, colon, colorectum, endometrium, esophagus, kidney, liver, lung, ovary, rectum, stomach) | |
| Ø | Ø | Ø | Ø | Ø | Ø (bladder, breast, colon, colorectum, esophagus, kidney, larynx, liver, lung, oral cavity/pharynx, ovary, prostate, rectum, stomach, thyroid, urinary tract) | |||
| Θ (colon, esophagus, ovary) | ||||||||
| Coffee | ⊕ | ⊕ | ⊕ | ⊕ (breast, colon, colorectum, endometrium, esophagus, liver, oral cavity/pharynx, pancreas, rectum, thyroid) | ||||
| Ø | Ø | Ø | Ø (bladder, breast, colon, colorectum, esophagus, kidney, larynx, liver, oral cavity/pharynx, ovary, pancreas, rectum, stomach, thyroid, urinary tract) | |||||
| Θ | Θ | Θ (bladder, colon, colorectum, esophagus, lung, pancreas, prostate, urinary tract) | ||||||
| Milk | ⊕ | ⊕ | ⊕ | ⊕ (bladder, colon, colorectum, stomach) | ||||
| Ø | Ø | Ø (bladder, breast, colon-colorectum, colorectum, kidney, ovary, prostate, rectum, thyroid) | ||||||
| Θ | Θ | Θ (breast, prostate) | ||||||
| Whole milk | Ø | Ø | Ø (ovary, prostate) | |||||
| Θ | Θ (bladder, ovary) | |||||||
| Semi-skim milk | Ø | Ø (breast) | ||||||
| Skim milk | ⊕ (bladder) | |||||||
| Ø | Ø (ovary) | |||||||
| Θ | ||||||||
| Wine | ⊕ (up to 270 mL or 4 drinks/day) | ⊕ (esophagus, kidney, lung) | ||||||
| Ø (150–750 mL/day or ≥5 drinks/day) | Ø (endometrium, esophagus, kidney, lung, ovary, pancreas) | |||||||
| Θ (950–1,985 mL/day) | Θ (breast, head & neck) | |||||||
| Sweetened beverages | ⊕ (esophagus) | |||||||
| Ø | Ø (colon, esophagus, kidney) | |||||||
| Θ | Θ |
Abbreviation: CVD, cardiovascular disease.
⊕, protective effect (P < 0.05); Ø, no effect (P ≥ 0.05); Θ, deleterious effect (P < 0.05).
| Beverage | Overweight/ obesity | Type 2 diabetes | Mental health | Skeletal health | Digestive diseases | Liver diseases | CVD | Cancers |
|---|---|---|---|---|---|---|---|---|
| Tea | ⊕ | ⊕ | ⊕ | ⊕ | ⊕ | ⊕ | ⊕ (breast, colon, colorectum, endometrium, esophagus, kidney, liver, lung, ovary, rectum, stomach) | |
| Ø | Ø | Ø | Ø | Ø | Ø (bladder, breast, colon, colorectum, esophagus, kidney, larynx, liver, lung, oral cavity/pharynx, ovary, prostate, rectum, stomach, thyroid, urinary tract) | |||
| Θ (colon, esophagus, ovary) | ||||||||
| Coffee | ⊕ | ⊕ | ⊕ | ⊕ (breast, colon, colorectum, endometrium, esophagus, liver, oral cavity/pharynx, pancreas, rectum, thyroid) | ||||
| Ø | Ø | Ø | Ø (bladder, breast, colon, colorectum, esophagus, kidney, larynx, liver, oral cavity/pharynx, ovary, pancreas, rectum, stomach, thyroid, urinary tract) | |||||
| Θ | Θ | Θ (bladder, colon, colorectum, esophagus, lung, pancreas, prostate, urinary tract) | ||||||
| Milk | ⊕ | ⊕ | ⊕ | ⊕ (bladder, colon, colorectum, stomach) | ||||
| Ø | Ø | Ø (bladder, breast, colon-colorectum, colorectum, kidney, ovary, prostate, rectum, thyroid) | ||||||
| Θ | Θ | Θ (breast, prostate) | ||||||
| Whole milk | Ø | Ø | Ø (ovary, prostate) | |||||
| Θ | Θ (bladder, ovary) | |||||||
| Semi-skim milk | Ø | Ø (breast) | ||||||
| Skim milk | ⊕ (bladder) | |||||||
| Ø | Ø (ovary) | |||||||
| Θ | ||||||||
| Wine | ⊕ (up to 270 mL or 4 drinks/day) | ⊕ (esophagus, kidney, lung) | ||||||
| Ø (150–750 mL/day or ≥5 drinks/day) | Ø (endometrium, esophagus, kidney, lung, ovary, pancreas) | |||||||
| Θ (950–1,985 mL/day) | Θ (breast, head & neck) | |||||||
| Sweetened beverages | ⊕ (esophagus) | |||||||
| Ø | Ø (colon, esophagus, kidney) | |||||||
| Θ | Θ |
Abbreviation: CVD, cardiovascular disease.
⊕, protective effect (P < 0.05); Ø, no effect (P ≥ 0.05); Θ, deleterious effect (P < 0.05).
Minimum and maximum odd ratios, relative risks, and/or hazard ratios resulting from pooled/meta-analyses for protective (⊕, P < 0.05) and deleterious (Θ, P < 0.05) effects and for absence of associations (Ø, P ≥ 0.05) between main beverage and food groups and chronic diet-related diseases
| Beverage, or food group | Nature of association | Minimum and maximum odds ratio, relative risk, and/or hazard ratio [no. of pooled/meta-analyses]a | |||||
|---|---|---|---|---|---|---|---|
| Overweight/obesity | Type 2 diabetes | Mental health | Skeletal health | CVD | Cancers | ||
| Beverages | |||||||
| Teab | ⊕ | −1.31 kg (for 12–13 wks) [1] | 0.84 [1] | 0.83–0.85 (PD) [2] | 0.72; +2.6% arterial diameter (500 mL/day) [4] | 0.66–0.85 [10] | |
| Ø | 0.96–0.99 [1] | 0.96 [1] | 0.98 [2] | 0.44–1.20 [30] | |||
| Θ | 1.28 [1] | ||||||
| Coffeec | ⊕ | 0.76 [1] | 0.69–0.73 [2] | 0.83–0.96 [4] | 0.50–0.95 [16] | ||
| Ø | 1.01 (for BMI > 30) [1] | 0.90–1.16 [6] | 0.84–1.8 [21] | ||||
| Θ | 1.03 [1] | 1.20–1.83; +8.14 mm Hg SBP; +5.75 mm Hg DBP [4] | 1.16–1.45 [7] | ||||
| Milkd | ⊕ | All milks/undefined milk: −5.9 ng/mL serum osteocalcin; −5.41 nmol/mmol urinary NTx; +40.32 g total body BMD from +0.01 to +0.63 g/cm2 total body BMD [2] | All milks/undefined milk: 0.84; 0.94 (per 200 mL/day) [2] | All milks/undefined milk: 0.66–0.90; skim milk: 0.47 [7] | |||
| Ø | Whole milk: 0.83–0.89 (for BMI > 30); semi-skim/low-fat milk: 0.95–0.96; skim milk: 1.10 (for BMI > 30) [3] | Whole milk: 0.95 [1] | All milks/undefined milk: 0.99 (hip fracture in women for +1 glass/day); 0.91 (hip fracture in men for +1 glass/day) [1] | All milks/undefined milk: 0.81–1.50; whole milk: 0.95–1.22; skim milk: 0.94 [22] | |||
| Θ | All milks/undefined milk: 1.09–1.12 (BMI > 30); skim milk: 1.25 (BMI > 30) [2] | All milks/undefined milk: 1.17–1.28; whole milk: 1.25–2.23 [4] | |||||
| Winee | ⊕ | 0.55–0.69 (1–4 drinks or 150–270 mL wine/day) [5] | 0.50–0.77 (5.0–14.9 g wine alcohol/day or from <1 to >8 drinks/day) [5] | ||||
| Ø | No significant protection at 150–750 mL wine/day; ≈2.50 (≥5 drinks/day) [2] | 0.52–1.49 (≥1 drink/day) [10] | |||||
| Θ | 1.00–1.76 (950–1,985 mL/day or 72–157 mL alcohol/day) [1] | 1.08–6.3 (>30 drinks/wk); +5% increased risk for daily increase of 10 g wine alcohol/day [2] | |||||
| Sweetened beveragesf | Ø | 0.94–1.11 [4] | |||||
| Θ | From 0.1 to 0.8 kg/day for 200–550 kcal/day; +≈454 g with each increased daily serving, per 4-y period [2] | 1.26 [1] | |||||
| Plant-based foods | |||||||
| Fruits & vegetables | ⊕ | 0.74–0.89 [5] | 0.68–0.92 [4] | ||||
| Ø | 0.93–1.00 [3] | 0.93 [1] | 0.91–0.99 [5] | ||||
| Vegetablesg | ⊕ | −0.10 kg (for each daily serving per 4-y period) [1] | 0.77–0.86 [3] | 0.50–0.99 [11] | |||
| Ø | 0.88–0.89 (for BMI>30) [1] | 0.89–0.97 [3] | 0.82; 0.93–0.97 (for an increment of 1–3 servings/day) [3] | 0.72–1.02 [14] | |||
| Θ | 1.28 (picked vegetables) [1] | ||||||
| Fruits | ⊕ | −0.22 kg (for each daily serving per 4-y period) [1] | 0.77–0.86 [5] | 0.49–0.92 [15] | |||
| Ø | 0.92–0.93 [3] | 0.86 [1] | 0.91–1.02 [13] | ||||
| Whole grainsh | ⊕ | −0.48 kg body fat; −0.17 kg (for each daily serving per 4-y period) [2] | 0.73–0.89; −0.93 mmol/L fasting glucose [5] | 0.71–0.79; −0.83 mmol/L total cholesterol; −0.72 mmol/L LDL cholesterol [4] | 0.41–0.86 [2] | ||
| Ø | −0.18 to +0.06 kg; −0.15 cm waist circumference [2] | −0.29 pmol/L fasting insulin [1] | −0.06 mm Hg SBP/DBP [1] | 0.80–0.96 [3] | |||
| Refined cerealsi | Ø | 1.07 [1] | |||||
| Θ | +0.18 kg (for each daily serving per 4-y period) [1] | 1.27–1.40 [3] | |||||
| Legumesj | ⊕ | −0.82 mmol/L fasting glucose; −0.49 pmol/L fasting insulin [1] | −0.35 to −0.30 mmol/L total cholesterol; −0.30 mmol/L LDL cholesterol; −0.22 mmol/L triglycerides (3 wks to 4 y); +0.05 mmol/L HDL cholesterol [2] | 0.52–0.86 [16] | |||
| Ø | −0.68 mmol/L fasting glucose; −0.77 pmol/L fasting insulin; −0.09% blood HbA1C (6 wks to 4 y); −0.43 (HOMA-IR) [2] | −18.94 mg/dL triglycerides; +0.85 mg/dL HDL cholesterol [1] | 0.72–1.10 [7] | ||||
| Θ | 1.18–1.26 (fermented soy foods) [3] | ||||||
| Nuts & seedsk | ⊕ | −0.26 kg (for each daily serving per 4-y period) [1] | 0.63; −10.9% (total cholesterol); −10.2% (LDL cholesterol); −20.6% (triglycerides ≥150 mg/dL); −0.18 mmol/L (total cholesterol) [3] | ||||
| Ø | +0.09% (HDL cholesterol); −0.15 mmol/L (LDL cholesterol); −0.05 mmol/L (HDL cholesterol); −0.04 mmol/L (triglycerides) [2] | ||||||
| Animal-based foods | |||||||
| Dairy productsl | ⊕ | −0.61 kg; −2.19 cm waist circumference; −0.45 kg body fat [2] | 0.82–0.92 [4] | 0.79–0.88 [2] | 0.57–0.85 [4] | ||
| Ø | −0.61 to −0.14 kg; −0.02 (low-fat) to +0.05 (whole-fat) kg (for each daily serving per 4-y period) [3] | 1.00 (high-fat) [1] | 0.88–1.30 [11] | ||||
| Θ | 1.06–2.8 [5] | ||||||
| Eggs | Ø | 0.91–0.99 [2] | 0.94–1.38 [6] | ||||
| Θ | 1.68 [1] | 1.19 [1] | 1.22 (for a 100-g increment/day) [1] | ||||
| Red/processed meat | ⊕ | Red meat: 0.7 [1] | |||||
| Ø | Red meat: +0.43 kg (for each daily serving per 4-y period) Processed meat: +0.42 kg (for each daily serving per 4-y period) [1] | Red meat: 1.16 (per 100 g/day) [1] | Red meat: 1.00–1.17 (per 100 g/day) Processed meat: 1.14 (per 50 g/day) [1] | Beef & canned meat: 0.7–1.2 Red meat: 0.76–1.07 Processed meat: 0.50–1.24 [15] | |||
| Θ | Red meat: 1.21–1.29 Processed meat: 1.41–1.55 [3] | Red meat: 1.09 Processed meat: 1.14 [2] | Meat: 1.18 Red meat: 1.12–2.20 Processed meat: 1.08–1.63 [21] | ||||
| Poultrym | Ø | 0.69–1.25 [8] | |||||
| Θ | 1.21–2.1 [2] | ||||||
| Fishn | ⊕ | 0.81 (dementia) [1] | 0.69–0.91 [11] | 0.7–0.88 [5] | |||
| Ø | 0.99–1.15 [3] | 0.83–1.00 [3] | 0.68–1.04 [15] | ||||
Abbreviations: BMD, bone mineral density; BMI, body mass index; CVD, cardiovascular disease; DBP, diastolic blood pressure; HbA1C, glycosylated hemoglobin; HDL, high-density lipoprotein; HOMA-IR, homeostasis model assessment-insulin resistance; LDL, low-density lipoprotein; NTx, N-terminal telopeptide; SBP, systolic blood pressure.
Number of pooled/meta-analyses. All values – except those for wine – correspond to the highest versus the lowest/no intake (for more details, see Table S1). No studies on muscle or kidney diseases were found.
Includes all types of tea that belong to the Camellia sinensis genus (Theaceae family).
Does not include decaffeinated coffee.
Includes whole, semi-skim, and skim milks (semi-skim/low-fat milk and skim milk contain 1–2% and <0.5% fat, respectively).
Includes red, rosé, and white wines.
Includes all drinks with added sugars (e.g., sweetened fruit juices); may be carbonated and/or caffeinated.
May include legumes in rare studies.
May include only one product, e.g., brown rice.
May include only one product, e.g., white rice.
May include only soy foods.
May include legumes in rare studies.
May include milk.
May include rabbit meat in rare studies.
May also include seafood, e.g., shellfish.
Coffee
Results for coffee consumption are less marked than those for tea consumption. The highest levels of coffee consumption tend to be either protective against (29 references; see Table 1) or not associated (32 references; see Table 1) with DRCD risk (Tables 1 and 2). Based on meta-analyses only, the highest levels of coffee consumption may significantly reduce the risks of type 2 diabetes, mental diseases, CVD, and cancer by a maximum of 24%, 31%, 17%, and 50%, respectively (Table 3). The types of cancer associated with the highest reductions in risk were as follows: liver (−50%), esophagus (−40%), oral cavity/pharynx (−39%), colorectum and thyroid (−30%), endometrium (−29%), colon (−25%), pancreas (−18%), and breast (−5%). However, there is also evidence to suggest that the highest levels of coffee consumption may significantly increase the risks of obesity (BMI in women >30, +3%), CVD (+83%), and cancer (from +16% for prostate and urinary tract cancers to +45% for bladder cancer) (Table 3 and Table S1). Systolic and diastolic blood pressures also may be significantly increased in those with higher levels of coffee consumption, by +8.14 mm Hg and +5.75 mm Hg, respectively (Table 3).
Milk
When all types of milk were considered together, the highest levels of consumption had a protective effect (14 references), no effect (30 references), or a deleterious effect (7 references) on DRCD risk (Tables 1 and 2). When each type of milk was considered separately, the associations for undefined milk (i.e., fat content not specified in references) followed the same profile as that found when all types of milk were considered together, i.e., no obvious trends were observed. Whole milk may have either a neutral (overweight/obesity, type 2 diabetes, vascular dementia, and ovary/prostate cancers) or a deleterious effect (CVD and bladder/ovary cancers) on risk; semi-skim milk has a neutral effect on breast cancer risk; and skim milk may have a protective effect against bladder cancer, a neutral effect on overweight/obesity and ovary cancer risks, and a deleterious effect on overweight/obesity risk (Table 2).
Based on meta-analyses only, the highest levels of undefined milk consumption may significantly reduce the risks of CVD and cancer by a maximum of 16% and 34%, respectively (Table 3). The types of cancer associated with the highest reductions in risk were as follows: stomach (−34%), colon (−22%), colorectum (−17%), and bladder (−16%) (Table S1). Otherwise, meta-analysis also showed that high consumption of undefined milk was associated with a significant reduction in bone metabolism biomarkers such as serum osteocalcin and urinary collagen type 1 cross-linked N-telopeptide, and with a significant increase in total body bone mineral content and bone mineral density (Table 3). However, higher consumption of undefined milk was also positively associated with higher risks of obesity (+12%), breast cancer (+17%), and prostate cancer (+28%) (Table 3 and Table S1). With regard to whole milk, the highest levels of consumption were also positively associated with risks of bladder (+223%) and ovary (+25%) cancer. More generally, the lower the fat content of milk, the more neutral the effect seems to be (Table S1). Finally, a higher consumption of skim milk was associated with a 53% reduced risk of bladder cancer (Table S1), but a 25% higher risk of obesity (Table 1).
Wine
Results for wine pertain to the risks of CVD and cancer only, with 11, 12, and 3 references for both diseases reporting protective, neutral, or deleterious effects, respectively (Tables 1 and 2). For CVD risk, the nature of the association depends on the dose consumed (Table 3 and Table S1). Based on meta-analyses only, the highest levels of wine consumption may significantly reduce the risks of CVD and cancer (esophagus, kidney, and lung) by a maximum of 45% and 50%, respectively (Table 3 and Table S1). Increased risks of CVD (+76% at maximum) and cancer (+630% at maximum for head and neck cancers) were associated with very high wine consumption, i.e., 950–1,985 mL/day or >30 drinks/week) (Table 3). Finally, a +5% increase in risk of breast cancer was reported for each increase of 10 g of alcohol from wine per day (Table S1).
Sweetened beverages
The highest level of consumption of sweetened beverages tends to have either neutral (11 references for overweight/obesity and cancers) or deleterious (8 references for overweight/obesity and type 2 diabetes) effects on DRCD risk (Tables 1 and 2). Based on meta-analyses only, the highest levels of sweetened beverage consumption may significantly increase the risk of type 2 diabetes by a maximum of 26% (Table 3). Meta-analyses also showed that high consumption of sweetened beverages was associated with a weight increase of +0.1 kg/day and +0.8 kg/day for intakes of 200 kcal/day and 550 kcal/day from sweetened beverages, respectively (Table 3).
Associations between plant-based food groups and risk of diet-related chronic diseases
Eighty-three PMASRs were analyzed to explore the associations between main plant-based food groups and risk of DRCDs (Table S2). Cancers (47 references) and CVD (17 references) were the DRCDs most commonly studied in relation to plant-based food group consumption, followed by type 2 diabetes (13 references), overweight/obesity (10 references), and mental (7 reference) and skeletal (7 reference) health (Table S2). No reference was found for digestive, muscle, liver, or kidney diseases. Concerning food groups, vegetables (38 references) and fruits (37 references) were the most studied plant-based food groups followed by legumes (25 references), fruits and vegetables together (23 references), whole-grain cereals (16 references), nuts and seeds (7 references), and refined cereals (6 references) (Table S2). The main trends for the effect of plant-based food group consumption on the prevalence of DRCDs are shown below.
Fruits and vegetables
The highest level of fruit and vegetable consumption tends to be either protective against (17 references) or not associated with (17 references) DRCD risk (Tables 1 and 4). A higher risk of overweight/obesity was observed in 2 systematic reviews only (Table S2). Based on meta-analyses only, the highest level of fruits and vegetable consumption may significantly reduce the risks of CVD and cancer by a maximum of 26% and 32%, respectively (Table 3). The types of cancer associated with the highest reductions in risk were as follows: kidney (−32%), lung (−21%), breast (−11%), colon (−9%), and colorectum (−8%). Twenty-four interventional studies also showed that higher fruit and vegetable consumption was associated with significant weight reduction (Table S2).
| Food group | Overweight/ obesity | Diabetes | Mental health | Skeletal health | CVD | Cancers |
|---|---|---|---|---|---|---|
| Plant-based food | ||||||
| Fruits & vegetables | ⊕ | ⊕ | ⊕ | ⊕ | ⊕ | ⊕ (breast, colon, colorectum, esophagus, kidney, lung, oral cavity/pharynx, pancreas, stomach) |
| Ø | Ø | Ø | Ø | Ø | Ø (breast, colon, ovary, pancreas, rectum, stomach) | |
| Θ | ||||||
| Vegetables | ⊕ | ⊕ | ⊕ | ⊕ (bladder, breast, colon, endometrium, esophagus, larynx, lung, oral cavity/pharynx, pancreas, rectum, stomach) | ||
| Ø | Ø | Ø | Ø (bladder, breast, colon, colorectum, esophagus, kidney, larynx, lung, oral cavity/pharynx, ovary, pancreas, prostate, rectum, small lymphocytic leukemia, stomach) | |||
| Θ (colon, esophagus, rectum, stomach/pickled vegetables) | ||||||
| Fruits | ⊕ | ⊕ | ⊕ (bladder, breast, colon, colorectum, esophagus, kidney, larynx, lung, oral cavity/pharynx, pancreas, rectum, stomach) | |||
| Ø | Ø | Ø | Ø | Ø (bladder, breast, colon, colorectum, endometrium, esophagus, larynx, lung, oral cavity/pharynx, ovary, pancreas, rectum, small lymphocytic leukemia, stomach, thyroid) | ||
| Θ (breast, colon, esophagus, oral cavity/pharynx, rectum) | ||||||
| Whole grains | ⊕ | ⊕ | ⊕ | ⊕ (brain, breast, colon, colorectum, endometrium, esophagus, non-Hodgkin's lymphoma, oral cavity/pharynx, pancreas, rectum, stomach) | ||
| Ø | Ø | Ø | Ø (breast, colorectum, rectum) | |||
| Refined cereals | Ø | |||||
| Θ | Θ | Θ (stomach) | ||||
| Legumes | ⊕ | ⊕ | ⊕ (breast, colon, endometrium, lung, ovary, prostate, stomach) | |||
| Ø | Ø | Ø (bladder, breast/fermented soy foods, colon, colorectum, esophagus, lung, pancreas, prostate/fermented soy foods, rectum, stomach) | ||||
| Θ (colon, oral cavity/pharynx, rectum, stomach/fermented soy foods) | ||||||
| Nuts & seeds | ⊕ | ⊕ | ⊕ | |||
| Ø | Ø | |||||
| Animal-based food | ||||||
| Dairy products | ⊕ | ⊕ | ⊕ | ⊕ | ⊕ | ⊕ (breast, colorectum, stomach) |
| Ø | Ø | Ø | Ø | Ø (bladder, breast, colon, colorectum, ovary, rectum) | ||
| Θ | Θ | Θ | Θ (colorectum, prostate, rectum, thyroid) | |||
| Eggs | Ø | Ø (bladder, colon, colorectum, endometrium, ovary, prostate, rectum, thyroid) | ||||
| Θ | Θ | Θ (breast, colon, colorectum, rectum) | ||||
| Red/processed meat | ⊕ (colorectum, thyroid) | |||||
| Ø | Ø | Ø | Ø (breast, colon, colorectum, kidney, pancreas, prostate, rectum, small lymphocytic leukemia, stomach, thyroid) | |||
| Θ | Θ | Θ (brain, breast, colon, colorectum, endometrium, esophagus, kidney, ovary, rectum, stomach, thyroid) | ||||
| Poultry | Ø (breast, colon, colorectum, endometrium, esophagus, kidney, ovary, rectum) | |||||
| Θ (kidney, thyroid) | ||||||
| Fish | ⊕ | ⊕ | ⊕ (colorectum/fatty fish, esophagus, ovary, rectum, thyroid) | |||
| Ø | Ø | Ø | Ø |
Abbreviation: CVD, cardiovascular disease.
⊕, protective effect (P < 0.05); Ø, no effect (P ≥ 0.05); Θ, deleterious effect (P < 0.05).
| Food group | Overweight/ obesity | Diabetes | Mental health | Skeletal health | CVD | Cancers |
|---|---|---|---|---|---|---|
| Plant-based food | ||||||
| Fruits & vegetables | ⊕ | ⊕ | ⊕ | ⊕ | ⊕ | ⊕ (breast, colon, colorectum, esophagus, kidney, lung, oral cavity/pharynx, pancreas, stomach) |
| Ø | Ø | Ø | Ø | Ø | Ø (breast, colon, ovary, pancreas, rectum, stomach) | |
| Θ | ||||||
| Vegetables | ⊕ | ⊕ | ⊕ | ⊕ (bladder, breast, colon, endometrium, esophagus, larynx, lung, oral cavity/pharynx, pancreas, rectum, stomach) | ||
| Ø | Ø | Ø | Ø (bladder, breast, colon, colorectum, esophagus, kidney, larynx, lung, oral cavity/pharynx, ovary, pancreas, prostate, rectum, small lymphocytic leukemia, stomach) | |||
| Θ (colon, esophagus, rectum, stomach/pickled vegetables) | ||||||
| Fruits | ⊕ | ⊕ | ⊕ (bladder, breast, colon, colorectum, esophagus, kidney, larynx, lung, oral cavity/pharynx, pancreas, rectum, stomach) | |||
| Ø | Ø | Ø | Ø | Ø (bladder, breast, colon, colorectum, endometrium, esophagus, larynx, lung, oral cavity/pharynx, ovary, pancreas, rectum, small lymphocytic leukemia, stomach, thyroid) | ||
| Θ (breast, colon, esophagus, oral cavity/pharynx, rectum) | ||||||
| Whole grains | ⊕ | ⊕ | ⊕ | ⊕ (brain, breast, colon, colorectum, endometrium, esophagus, non-Hodgkin's lymphoma, oral cavity/pharynx, pancreas, rectum, stomach) | ||
| Ø | Ø | Ø | Ø (breast, colorectum, rectum) | |||
| Refined cereals | Ø | |||||
| Θ | Θ | Θ (stomach) | ||||
| Legumes | ⊕ | ⊕ | ⊕ (breast, colon, endometrium, lung, ovary, prostate, stomach) | |||
| Ø | Ø | Ø (bladder, breast/fermented soy foods, colon, colorectum, esophagus, lung, pancreas, prostate/fermented soy foods, rectum, stomach) | ||||
| Θ (colon, oral cavity/pharynx, rectum, stomach/fermented soy foods) | ||||||
| Nuts & seeds | ⊕ | ⊕ | ⊕ | |||
| Ø | Ø | |||||
| Animal-based food | ||||||
| Dairy products | ⊕ | ⊕ | ⊕ | ⊕ | ⊕ | ⊕ (breast, colorectum, stomach) |
| Ø | Ø | Ø | Ø | Ø (bladder, breast, colon, colorectum, ovary, rectum) | ||
| Θ | Θ | Θ | Θ (colorectum, prostate, rectum, thyroid) | |||
| Eggs | Ø | Ø (bladder, colon, colorectum, endometrium, ovary, prostate, rectum, thyroid) | ||||
| Θ | Θ | Θ (breast, colon, colorectum, rectum) | ||||
| Red/processed meat | ⊕ (colorectum, thyroid) | |||||
| Ø | Ø | Ø | Ø (breast, colon, colorectum, kidney, pancreas, prostate, rectum, small lymphocytic leukemia, stomach, thyroid) | |||
| Θ | Θ | Θ (brain, breast, colon, colorectum, endometrium, esophagus, kidney, ovary, rectum, stomach, thyroid) | ||||
| Poultry | Ø (breast, colon, colorectum, endometrium, esophagus, kidney, ovary, rectum) | |||||
| Θ (kidney, thyroid) | ||||||
| Fish | ⊕ | ⊕ | ⊕ (colorectum/fatty fish, esophagus, ovary, rectum, thyroid) | |||
| Ø | Ø | Ø | Ø |
Abbreviation: CVD, cardiovascular disease.
⊕, protective effect (P < 0.05); Ø, no effect (P ≥ 0.05); Θ, deleterious effect (P < 0.05).
Vegetables
The highest level of vegetable consumption tends to be either protective against (19 references) or not associated with (26 references) DRCD risk (Tables 1 and 4). A higher risk of digestive cancers was associated with pickled vegetable consumption in 2 systematic reviews and 1 meta-analysis (Table S2). Based on meta-analyses only, the highest level of vegetable consumption may significantly reduce the risks of CVD and cancer by a maximum of 23% and 50%, respectively (Table S3). The types of cancer associated with the highest reductions in risk were as follows: digestive cancers, i.e., oral cavity/pharynx (−50%), colon (−43%), and stomach (−39%), followed by breast (−25%) and endometrium (−23%) (Table S2). Meta-analysis also showed that high vegetable consumption was associated with a weight reduction of −0.10 kg for each daily serving per 4-year period (Table 3). Finally, higher levels of pickled vegetable consumption may increase the risk of stomach cancer by 28% (Table S2).
Fruits
The highest level of fruit consumption tends to be either protective against (24 references) or not associated with (22 references) DRCD risk (Tables 1 and 4). Based on meta-analyses only, the highest level of fruit consumption may significantly reduce the risks of CVD and cancer by a maximum of 23% and 51%, respectively (Table 3). The types of cancer associated with the highest reductions in risk reduction were as follows: stomach (−51%), larynx (−27%), lung (−23%), rectum (−22%), kidney (−21%), breast (−17%), colon (−13%), and colorectum (−10%) (Table S2). Meta-analysis also showed that high fruit consumption was associated with a weight reduction of −0.22 kg for each daily serving per 4-year period (Table 3). Finally, a higher level of fruit consumption may significantly increase the risk of breast and digestive cancers, as reported by 5 case-control studies found in 1 systematic review (Table S2).
Whole-grain cereals
The highest level of whole-grain cereal consumption tends to be either protective against (15 references) or not associated with (10 references) DRCD risk (Tables 1 and 4). A higher risk of stomach cancer was reported in 1 ecological study only (Table S2). Based on meta-analyses only, the highest level of whole-grain cereal consumption may significantly reduce the risks of type 2 diabetes, CVD, and cancer by a maximum of 27%, 29%, and 59%, respectively (Table 3). The types of cancer associated with the highest reductions in risk were as follows: non-Hodgkin's lymphoma (−59%), esophagus (−48%), endometrium (−45%), oral cavity/pharynx and stomach (−43%), brain (−21%), breast (−33%), pancreas (−30%), colorectum (−21%), and colon (−14%) (Table S2). Meta-analysis also showed that high consumption of whole-grain cereal was associated with a significant reduction in body fat of −0.48 kg for a 2- to 16-week period (Table 3).
Refined cereals
In contrast to the highest consumption of whole-grain cereals, the highest consumption of refined cereal tends to be either not associated with (1 reference) or to have a deleterious effect on (6 references) the risk of DRCD (Tables 1 and 4). The most striking results were associated with white rice: a maximum increase of +40% for risk of type 2 diabetes and a +0.18-kg weight increase for each daily serving per 4-year period (Table 3).
Legumes
The highest level of legume consumption tends to be either protective against (21 references) or not associated with (13 references) DRCD risk (Tables 1 and 4). Fermented soy foods were associated with a higher risk of stomach cancer in 3 meta-analyses (maximum of +26%) and a higher risk of digestive cancers in 2 systematic reviews (Table S2). Based on meta-analyses only, the highest levels of legume consumption may significantly reduce cancer risk by a maximum of 48% (Table 3). The types of cancer associated with the highest reductions in risk reduction were as follows: ovary (−48%), stomach (−46%), lung (−42%), prostate (−31%), endometrium (−30%), and breast (−29%) (Table S2). Meta-analysis also showed that high legume consumption was associated with significant reductions in pooled blood glucose and insulin of −0.82 and −0.49 pmol/L, respectively, for a 1- to 16-week period (Table 3). With regard to CVD risk, meta-analyses reported significant reductions of −0.35 mmol/L in total cholesterol, −0.30 mmol/L in low-density lipoprotein cholesterol, and −0.22 mmol/L in triglycerides, along with a significant increase of +0.05 mmol/L in high-density lipoprotein cholesterol (Table 3).
Nuts and seeds
The highest consumption of nuts and seeds tends to be either protective against (9 references) or not associated with (4 references) DRCD risk (Tables 1 and 4). However, greater weight gain (2 interventional studies) and lower levels of high-density lipoprotein (2 interventional studies) were reported in 2 systematic reviews (Table S2). No meta-analyses or systematic reviews were found for cancer risk. Two systematic reviews (a total of 6 interventional studies) reported a reduction in levels of blood biomarkers of deregulated glucose metabolism, i.e., HbA1C, glucose, and insulin (Table S2). Based on meta-analyses only, the highest levels of nut and seed consumption may significantly reduce CVD risk by 37% and also may reduce several CVD risk factors within 3–8 weeks: total cholesterol by −10.9%, low-density lipoprotein cholesterol by −10.2%, and triglycerides by −20.6% (Table 3).
Associations between animal-based food groups and risk of diet-related chronic diseases
Ninety-nine PMASRs were analyzed to explore the associations between animal-based food groups and DRCDs (Table S3). Cancers (61 references) and CVD (21 references) were the DRCDs most studied in relation to animal-based food consumption, followed by type 2 diabetes (15 references), overweight/obesity (5 references), skeletal health (4 references), and mental health (3 references) (Table S3). As for plant-based food groups, no reference was found for muscle, digestive, liver, or kidney diseases. With regard to animal-based food groups, red/processed meat, fish, and dairy products were studied the most (37, 36, and 29 references, respectively), followed by eggs (11 references) and poultry (10 references) (Table S3). Otherwise, results for animal-based food groups are less homogenous than those for unrefined plant-based food groups (i.e., excluding refined cereals), with more qualitative and quantitative reviews reporting increased risks for higher consumption: 14 for plant-based food groups versus 45 for animal-based food groups (Table S3). The main trends for the effect of animal-based food group consumption on DRCD prevalence are described in the sections below.
Dairy products
The highest level of dairy product consumption tends to be either protective against (17 references) or not associated with (21 references) DRCD risk (Tables 1 and 4). However, 5 meta-analyses and 4 systematic reviews reported increased weight gain and increased risks of mental disease, skeletal diseases, and cancers (Table S3). Notably, the risk of prostate cancer was increased by +13% for the highest consumers of dairy products, and the risk of thyroid cancer was increased by +40% and +280% for the highest consumers of cheese and butter, respectively (Table S3). Based on meta-analyses only, the highest levels of dairy product consumption compared with lowest/no consumption may significantly reduce the risks of type 2 diabetes, CVD, and cancer by a maximum of 15% (all dairy products)/18% (low-fat dairy products), 21%, and 43%, respectively (Table 3 and Table S3). The types of cancer associated with the highest reductions in risk were as follows: stomach (−43%), colorectum (−19%), and breast (−15%) (Table S3). Meta-analysis also showed that high consumption of dairy products was associated with significant reductions in weight (maximum, −0.61 kg for 12–144 weeks), waist circumference (maximum, −2.19 cm for 12–144 weeks), and body fat (maximum, −0.45 kg for 1–36 months) (Table 3). Based on systematic reviews, the highest levels of dairy product consumption may significantly reduce depression and cognitive impairment, decrease fracture risk, and increase bone mass and bone mineral density (Table S3).
Eggs
Results for egg intake showed either a deleterious effect (4 references for type 2 diabetes, CVD, and cancers) or a neutral effect (9 references) among the highest consumers (Tables 1 and 4). No reference was found for a protective effect (Table 1). Based on meta-analyses only, the highest levels of egg consumption may significantly increase the risks of type 2 diabetes, CVD, and breast cancer by a maximum of 68%, 19%, and 22% (for a 100-g increment/day), respectively (Table 3 and Table S3).
Red and/or processed meat
First, considering red and/or processed meat as one group, the highest consumption of red and/or processed meat tends to have either a deleterious effect (29 references, especially for type 2 diabetes, CVD, and cancers) or no association with (21 references) DRCD risk (Tables 1 and 4). Only 1 meta-analysis and 1 systematic review reported a protective effect against thyroid (−30%) and colorectum (1 case-control study) cancers (Table S3). Based on meta-analyses only, with regard to red meat, the highest intakes are associated with significantly higher risks of type 2 diabetes (+29% at maximum), CVD (+9%), and the following cancers: colorectum (+220% at maximum), endometrium (+48%), rectum (+43%), esophagus (+40%), colon (+37%), kidney (+30%), and ovary (+16%) (Table 3 and Table S3). With regard to processed meat, the highest intakes are associated with significantly higher risks of type 2 diabetes (+55%), CVD (+14%), and the following cancers: stomach (+63% at maximum), thyroid (+60%), brain glioma (+48%), colorectum (+41%), esophagus (+40%), colon (+22%), ovary (+19%), kidney (+18%), and breast (+8%) (Table 3 and Table S3).
Poultry
The highest level of poultry consumption tends to be either deleterious (2 references for kidney and thyroid cancers) or not associated with (8 references) cancer risk (Tables 1 and 4). No reference was found for a significant protective effect or for DRCDs other than cancers. Meta-analyses reported increased risks of +21% for kidney cancer and 210% for thyroid cancer (Table S3).
Fish
In contrast to poultry, the highest fish consumption tends to be either protective against (19 references) or not associated with (23 references) DRCD risk (Tables 1 and 4). Based on meta-analyses only, the highest intakes are associated with significantly lower risks of dementia (maximum, −19%), CVD (maximum, −31%), and cancers (maximum, −30%) (Table 3). The types of cancer associated with highest reductions in risk were as follows: thyroid (−30%), colorectum (−27% for fatty fish only), ovary (−24%), rectum (−21%), esophagus (−19%), and colorectum (−12% for all fishes) (Table S3).
Overall trends by diet-related chronic diseases and food groups and beverages
The DRCDs mostly commonly studied in association with the 17 food groups and beverages via PMASRs were cancers (191 different references), followed by CVD (61 references), type 2 diabetes (29 references), overweight/obesity (20 references), mental health (9 references), skeletal health (6 references), digestive diseases (2 references), and liver disease (1 references) (calculated from Tables S1–S3). No reference was found for sarcopenia/muscle loss or kidney diseases. When the number of references is expressed on a 100% basis and all food groups and beverages except refined cereals are considered, the maximum reached for a significant protective effect (⊕) was 55–57% of references for CVD, skeletal health, and mental health (Table 5). For overweight/obesity, type 2 diabetes, and digestive diseases, the maximum percentages of references were for the absence of a significant association (Ø), and they ranged between 44% and 54% (Table 5). The highest percentages of references for a significant deleterious effect were observed for overweight/obesity (25%) and cancers (16%). On the basis of percentage of references, when all DRCDs and the 4 main DRCDs are considered, radar plots indicate the following food groups and beverages to be most protective: grain products against all DRCDs (Figure 1A), fruits and nuts and seeds against overweight/obesity (Figure 1B), coffee, whole-grain cereals, nuts and seeds, and dairy products against type 2 diabetes (Figure 1C), tea, milk, wine, fruits and vegetables, fruits, whole-grain cereals, legumes, nuts and seeds, and dairy products against CVD (Figure 1D), and fruits and legumes against cancers (Figure 1E).
Percentages of references (pooled/meta-analyses and systematic reviews) found for each of the diet-related chronic diseases studied, according to the protective (⊕), neutral (Ø), and deleterious (Θ) effects reported.a
| Beverage or food group | Overweight/ obesity | Type 2 diabetes | Mental health | Skeletal health | CVD | Cancers | Total a | ||||||||||||||
|---|---|---|---|---|---|---|---|---|---|---|---|---|---|---|---|---|---|---|---|---|---|
| ⊕ | Ø | Θ | ⊕ | Ø | Θ | ⊕ | Ø | Θ | ⊕ | Ø | Θ | ⊕ | Ø | Θ | ⊕ | Ø | Θ | ⊕ | Ø | Θ | |
| Total beverages | 13 | 43 | 43 | 50 | 38 | 13 | 70 | 30 | 0 | 75 | 25 | 0 | 49 | 34 | 17 | 29 | 59 | 12 | 34 | 52 | 15 |
| Total plant-based foodsb | 48 | 40 | 12 | 37 | 63 | 0 | 40 | 60 | 0 | 50 | 50 | 0 | 65 | 30 | 5 | 49 | 43 | 8 | 50 | 44 | 7 |
| Total animal-based foods | 33 | 56 | 11 | 25 | 38 | 38 | 50 | 33 | 17 | 40 | 40 | 20 | 56 | 32 | 12 | 12 | 57 | 32 | 23 | 50 | 27 |
| Total food & beverage groupsb | 32 | 44 | 25 | 35 | 51 | 14 | 57 | 38 | 5 | 55 | 36 | 9 | 57 | 32 | 11 | 30 | 54 | 16 | 36 | 48 | 15 |
Abbreviation: CVD, cardiovascular.
No reference found for sarcopenia/muscle loss and chronic kidney disease, only 3 references found for digestive diseases, and only 1 reference found for liver diseases.
Except refined cereals.
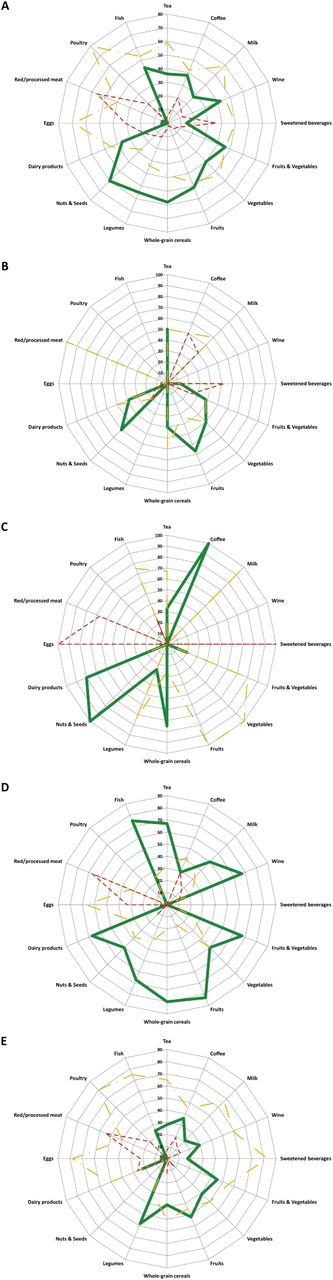
Radar plots for food groups and beverages versus number of references (percentages from 0–100% shown on concentric circles) showing protective (solid green lines), neutral (dashed yellow lines), or deleterious (dotted red lines) effects towards (A) all diet-related chronic diseases considered in this study (B); overweight/obesity; (C) type 2 diabetes; (D) cardiovascular disease; and (E) cancers.
When beverages only are considered, the percentage of references for a protective effect ranged between 13% (overweight/obesity) and 75% (skeletal health), while those for a deleterious effect ranged between 0 (mental and skeletal health) and 43% (overweight/obesity) (Table 5). When the unrefined plant-based food groups are considered, the percentage of references reporting a protective effect ranged between 37% (type 2 diabetes) and 65% (CVD), while those reporting a deleterious effect ranged between 0 (type 2 diabetes, mental health, and skeletal health) and 12% (overweight/obesity) (Table 5). When the 6 main DRCDs in Table 6 are considered (other DRCDs had either no or fewer than 4 associated references), a total of 94% of references was reached for both a protective effect and an absence of effect (P ≥ 0.05) for plant-based food groups. When the animal-based food groups are considered, the percentage of references reporting a protective effect ranged between 12% (cancers) and 56% (CVD), while those reporting a deleterious effect ranged between 11% (overweight/obesity) and 38% (type 2 diabetes) (Table 5). Again, when the 6 DRCDs in Table 6 are considered, a total of 73% of references was reached for both a protective effect and an absence of effect (P ≥ 0.05), and 27% of references reported a deleterious effect for animal-based food groups versus 7% for plant-based food groups. When food groups were the focus, grains-based foods (whole-grain cereals, legumes, and nuts and seeds) and fruits were the groups reported most often as protective, with percentages of references ranging between 50% and 60% (Table 6 and Figure 1A). The less protective food groups and beverages were sweetened beverages (14% of references), eggs (0% of references), red/processed meat (4% of references), and poultry (0% of references, but with only 10 references). Plant-based food groups appeared more protective (50% of references) than animal-based food groups (23% of references) (Table 6 and Figure 1A). Among animal-based food groups, fish was the most protective (44% of references). Fruits, vegetables, whole-grain cereals, tea, and fish were the food groups and beverages with the lowest percentages of references reporting a deleterious effect (2–7% of references) (Table 6 and Figure 1A). Finally, when the 16 food groups and beverages were considered as a whole (refined cereals excluded), most of references reported an absence of a significant association with DRCD risk (48% of references), while a protective effect was reported by twice as many references as those that reported a deleterious effect (36% vs. 15% of references) (Table 6).
Percentages of references (pooled/meta-analyses and systematic reviews) found for each of the 17 beverage and food categories studied according to the protective (⊕), neutral (Ø), and deleterious (Θ) effects reporteda
| Beverage, food, or food group | Total percentage of referencesa | ||
|---|---|---|---|
| ⊕ | Ø | Θ | |
| Beverages | |||
| Tea | 36 | 59 | 5 |
| Coffee | 38 | 42 | 20 |
| Milk | 27 | 59 | 14 |
| Wine | 42 | 46 | 12 |
| Sweetened beverages | 14 | 50 | 36 |
| Total | 34 | 52 | 15 |
| Plant-based foods | |||
| Fruits & vegetables | 46 | 46 | 8 |
| Vegetables | 40 | 54 | 6 |
| Fruits | 51 | 47 | 2 |
| Whole-grain cereals | 58 | 38 | 4 |
| Legumes | 55 | 34 | 11 |
| Nuts & seeds | 60 | 27 | 13 |
| Totalb | 50 | 44 | 7 |
| Animal-based foods | |||
| Dairy products | 36 | 45 | 19 |
| Eggs | 0 | 69 | 31 |
| Red/processed meat | 4 | 40 | 56 |
| Poultry | 0 | 80 | 20 |
| Fish | 44 | 53 | 2 |
| Total | 23 | 50 | 27 |
| Total food & beverage groupsb | 36 | 48 | 15 |
Due to rounding of percentages, totals do not always equal 100%.
Except refined cereals.
Discussion
The present analysis of 304 PMASRs investigating associations between food groups and beverages and DRCDs reveals or confirms strong trends for the most and the least protective food groups and beverages with main DRCDs when the highest versus the lowest/no levels of consumption are compared. Although some of these trends were already known, the current analysis used an a posteriori approach to provide an objective and quantitative basis for them. Nevertheless, several limitations of the study must be noted.
Study limitations
First, the greater tendency for positive results to be published than negative results must be acknowledged.23,–25 This effect is called the fundamental bias in science. Thus, a larger number of studies found for a given association does not necessarily mean that a given food group or beverage is more protective than another. It only reflects the fact that more studies have been published in this research area, e.g., the relationship between red/processed meat and cancers. In other words, the lack of published research articles reflects either the absence of interest in this research area because of current scientific trends or the lack of convincing findings in initial studies on the subject, which consequently may cause research in that particular field to be abandoned. Second, there are obviously more than 10 DRCDs. However, the present study is the second part of a project that aims to study associations between DRCDs, their potential deregulated mechanisms, and food groups, and thus the choice of these 10 DRCDs was explained in detail previously.4 Moreover, most of the PMASRs found in the scientific literature have focused on these 10 DRCDs, especially obesity, type 2 diabetes, CVD, cancers, and mental and skeletal health. Third, this study was purposely designed to include PMASRs only, not isolated observational or interventional human studies. Therefore, some relevant studies were probably not considered, either because they were not included in the selection of the PMASRs up to August 2013 or because they were published after August 2013. However, PMASRs are already the result of a stringent selection process that excludes the less relevant human studies. For the association of food groups and beverages with skeletal health, only a few PMASRs were found (between 4 and 7 references), even though there are numerous isolated human studies about this association, particularly for milk and dairy products. The small number of pooled/meta-analyses probably reflects a high degree of heterogeneity in the studies that did not allow the pooling of results. Finally, it is possible that one study may have been included in several different PMASRs, but none of the PMASRs were based strictly on the pooling of the same studies. Therefore, one PMASR cannot be rejected simply because it contains one study in common with another PMASR.
Main findings as a basis for future research in preventive nutrition
The assessment of research conducted on associations between food groups and beverages and DCRD risk showed that associations with cancer were studied the most (between 47 and 100 references), followed by associations with CVD (17–24 references), type 2 diabetes (5–15 references), overweight/obesity (5–10 references), skeletal health (4–7 references), mental health (3–7 references), digestive diseases (0–2 references), and liver diseases (0–1 reference). No reference for kidney diseases or sarcopenia/muscle loss was found. As expected, cancers and CVD, the 2 leading causes of death in Western countries, and type 2 diabetes and obesity, both of which may lead to all other DRCDs,4 were the most studied DRCDs. These 4 DRCDs are also associated with tremendous human and socioeconomic costs. Similar results were found when associations between DRCDs and metabolic deregulations were studied.4 It was surprising, though, how few PMASRs for overweight/obesity were found compared with PMASRs for CVD and cancers, since obesity is now increasingly recognized to play an important role in increasing all other DRCD risks.4 The under-representation of obesity by PMASRs – as opposed to the focus and attention given to obesity in the general public and the media – may result from an early focus by researchers on fatal diseases, i.e., CVD and cancers. Thus, except for sweetened beverages, no definitive conclusion can be reached for the other 16 food groups and beverages with regard to their potential to increase or reduce weight gain. This also holds true for type 2 diabetes, except in the cases of coffee, whole-grain cereals, and dairy products, for which the prevalence is lower among high consumers. In addition to these 4 main DRCDs, mental (mainly cognitive decline, depression, and some widespread dementia) and skeletal (mainly fracture risk and bone mineral density) health has begun to be studied more in relation to food group and beverage consumption. Finally, associations between food groups and beverages and chronic diseases of the muscle, liver, kidney, and digestive tract have been only very rarely quantified by PMASRs. Indeed, muscle health is virtually unstudied, even though sarcopenia in the elderly is a major health concern that is strongly linked with nutrition, particularly as related to protein turnover.26,–30 With the increasingly aging populations in Western countries, however, it is likely that the relation between food groups and beverages and sarcopenia will be studied more in the near future. The association between nutrition and chronic liver and kidney diseases also was studied only rarely. For example, the absence of PMASRs about hepatic steatosis – except for one about tea – is very surprising. Yet, this metabolic disorder affects several million people worldwide and is a precursor to more severe pathologies such as steatohepatitis, hepatic fibrosis, cirrhosis, and liver cancer.31 Observational studies about hepatic steatosis prevalence and food group consumption are rare, and yet some plant- and animal-based foods may be rich sources of lipotropes (i.e., compounds that limit excess fat deposits in liver, especially triglycerides31), particularly fruits such as blackberries, vegetables such as beetroot and spinach, and grain products such as quinoa and beans.32,–34 Therefore, additional human studies investigating the potential of diets or food groups to prevent hepatic steatosis, which, like obesity, is a gateway to more severe DRCDs, are urgently needed. The association between certain chronic kidney diseases and food group consumption also warrants further study.
The food groups and beverages most studied were tea and coffee (56 references), followed by vegetables (38 references), meat and fruits (37 references), fish (36 references), milk (30 references), dairy products (29 references), legumes (25 references), fruits and vegetables (23 references), wine (19 references), whole-grain cereals (16 references), sweetened beverages (13 references), eggs (11 references), poultry (10 references), and nuts and seeds (7 references). Compared with tea, coffee, fruits, vegetables, meat, fish, milk, and dairy products, grain products (i.e., whole-grain cereals, legumes, nuts and seeds) have been studied less. This is a surprising finding for whole-grain cereals, since cereal products constitute the basis of all food pyramids worldwide. The association between legumes, nuts, and seeds and risk of DRCDs has garnered interest by the scientific community, although only relatively recently, especially for nuts and seeds.35,36 Moreover, legumes are just beginning to enter some food pyramids. Yet grain products are probably the most interesting foods for the future because of their advantages related to sustainability of health, the environment, and economics: 1) they are rich in both energy and protective micronutrients; 2) they are generally inexpensive and, therefore, available to most people, notably the poorest; and 3) they are easy to store over long periods of time.
The increasing intakes of poultry and sweetened beverages worldwide, both in Western and emerging countries (e.g., China), should encourage studies to determine the effects of these foods/beverages on the prevalence of all DRCDs, particularly among individuals who consume the highest levels. Indeed, sweetened beverage consumption has been studied by PMASRs only in relation to weight gain, and poultry consumption has been studied by PMASRs only in relation to cancer. There is, therefore, a need for further research and subsequent PMASRs about associations between sweetened beverage and poultry consumption and health effects. Finally, due to the increasing polemic about the effects of milk consumption on health, there is an important need for more PMASRs, especially those that examine the association of milk intake with weight gain, type 2 diabetes, CVD, and chronic skeletal, mental, digestive, liver, and kidney diseases.
Associations between food groups and beverages and prevalence of diet-related chronic diseases
The associations between food groups and beverages and DRCD risk is of considerable interest in preventive nutrition because they may contribute to a basis for public health policies that recommend better food group, beverage, and/or dietary pattern choices. However, it remains difficult to give general recommendations on a population-wide scale because a level of certainty is required about the associations between the consumption of a diet, food group, food, or beverage and the risk of or protection against DRCDs. Nutrition research is often confronted with contradictory results, which may hinder the identification of strong associations between food groups and beverages and their effects on health. It is hoped that this review of evidence accumulated over several decades will allow some strong trends to be identified, as there does not seem to be an easier or a more direct way of accomplishing this. This is notably the main task of meta-analyses, and their number increases exponentially each year. The present exhaustive review emphasizes the difficulty of identifying clear nutritional tendencies; however, the results confirm the recommendations to eat more plant- than animal-based foods, to select whole-grain cereals over refined cereals, and to limit the intake of red/processed meat. In 2010, dietary risk factors and physical inactivity collectively accounted for 10% of the global disability-adjusted life years as measured in 187 countries, and diets low in fruits, nuts and seeds, whole grains, and vegetables and those high in sodium and total cholesterol were the most prominent dietary risk factors.3 In the present review, 10 main DRCDs were selected, which is fewer than the number of DRCDs selected in the above-mentioned study. Nevertheless, the trends revealed in this review are generally in accordance with the results of Lim et al.,3 i.e., the protective role of fruits, vegetables and grain products and the deleterious effect of red/processed meat – generally cholesterol-rich – in high-level consumers.
Beverages
Except for the deleterious effect of very hot tea on the prevalence of esophagus cancer,37 tea is globally either neutral toward or protective against DRCD occurrence. The most convincing protective effect is towards CVD risk, i.e., stroke,38,39 coronary artery disease,40 and flow-mediated dilation of the brachial artery.41 The main mechanisms involved are probably linked to the protective effect of polyphenols − notably that of catechin on blood pressure. The effect of coffee on the risk of DRCDs is less clear than that of tea, especially toward CVD and cancers. The increased CVD risk in high-level consumers of coffee is due to elevated blood pressure and/or inflammatory markers and/or homocysteine levels.42,–44 On the other hand, convincing results have been obtained for a protective effect of coffee toward the risk of type 2 diabetes and some mental diseases. Although no meta-analysis has been performed to date, coffee is also convincingly protective against chronic liver diseases, especially hepatic steatosis.31 The protective effect of coffee on liver health has been attributed to caffeine, which has been associated with reduced risk of elevated serum γ-alanine aminotransferase activity and which acts directly in the liver as an A1 and A2 adenosine receptor antagonist and/or an antioxidant.45,46 The mechanisms involved in protection against type 2 diabetes are likely multifactorial and probably involve antioxidant compounds,47 inhibition of glucose absorption,48 increased basal energy expenditure,49 stimulation of fat oxidation,50 mobilization of glycogen in muscle,50 an acute decrease in insulin sensitivity,51 the role of magnesium in insulin metabolism,52,53 and weight loss.54 For mental health (cognitive decline and Alzheimer's and Parkinson's diseases), the protective effect of coffee is generally attributed to caffeine.55,–57 In contrast to tea and coffee, both milk and wine may comprise a variety of subtypes. Milk is available as full-fat, semi-skim/low-fat, or skim, and wine is available as red, rosé, or white, with differing contents of alcohol. Such heterogeneity is not always taken into consideration or specified in PMASRs. In addition, wine consumption is associated with a CVD risk that follows a J-shaped dose-response curve.58 Except for its confirmed positive effect on skeletal health, milk intake has a mostly neutral effect toward risk of cancers (22 references) and, to a lesser extent, toward risk of CVD. Contradictory results about the effects of milk intake might also be attributable to the absence of specific information on fat content in some PMASRs. Indeed, as shown in the present study, full-fat milk appears slightly less neutral than low-fat or skim milk towards DRCD risk. For wine, a protective effect against CVD is found for moderate consumption (e.g., 150–270 mL/day or 1–4 drinks/day), while results for an effect on risk of cancer are more heterogeneous, depending on the cancer site. In contrast to high/regular intakes of tea, coffee, milk, and wine, a high/regular consumption of sweetened beverages (aka soft drinks) appears to have deleterious effect on weight gain and type 2 diabetes and a rather neutral effect on cancer risk. Deleterious effects must be attributed primarily to the high simple sugar content of these beverages, i.e., their high energy content. These sugars notably include fructose (used to trigger steatosis in rodent models), dextrose, and corn syrup. The absence of PMASRs assessing the effect of sweetened beverage intake on bone health and hepatic steatosis is, therefore, rather surprising, since sweetened beverages have been convincingly shown to decrease bone mineral density and to increase hepatic steatosis.31 Such effects may be caused by the caffeine, organic acid (carbonic and citric acids), or phosphoric acid (e.g., in colas) in these beverages, the consumption of which may lead to an increased acid load in the organism. These effects could also result from decreased milk consumption (and, thus, lower calcium intake), which may be correlated with highly sweetened beverage consumption.59 Dental caries60,61 and esophageal diseases62,63 were also reported to be associated with high consumption of sweetened beverages.
Plant-based foods
The exhaustive literature did not provide strong evidence of the protective effects of fruits and vegetables, which contradicts the general widespread belief that fruits and vegetables are very healthful: an almost equal number of references were found for a protective effect and a neutral effect. The most convincing tendency was for a protective effect of fruits against CVD risk. The results clearly showed that fruit and vegetable intake does not increase the overall prevalence of DRCDs; the exceptions were 2 systematic reviews that showed trends toward weight gain,64,65 1 ecological study that showed a trend toward increased CVD risk,66 and 4 case-control studies and 1 meta-analysis that showed a trend toward increased cancer risk,67,–69 especially for pickled vegetables versus stomach cancer.67 More conclusive results have been obtained with grain-based food groups, which appear to be protective against overweight/obesity, type 2 diabetes, CVD, and cancers. The mechanisms behind the health protectiveness of whole-grain cereals have already been thoroughly discussed.70 If whole-grain cereals tend to be protective, refined cereals appear to be either neutral or harmful, especially toward type 2 diabetes. Legumes appear to be a promising food group, although there are still only a few studies available. With the exception of fermented soy foods, which increase the risk of stomach cancer, legumes may be particularly protective against cancers. Legumes contain high amounts of slowly metabolized carbohydrates and fiber and have a high satiating potential, all of which accounts for their protective effects.71,–73 The protective effect of nuts and seeds against CVD risk and, to a lesser extent, diabetes risk, is rather convincing. The main mechanisms involved are most likely related to improved inflammatory and antioxidant status, a well-established cholesterol-lowering effect, the substantial levels of unsaturated fatty acids in these foods, and a whole set of protective bioactive compounds usually found in grain products.74,–76 More generally, the complex food structures of legumes, nut, and seed products are preserved intact upon digestion within the small intestine, leading to a slow release of nutrients (notably glucose and fatty acids) and increased satiety, as demonstrated recently with almonds.77,78 Therefore, although consumed in small amounts, these products deserve further study.
Animal-based foods
Compared with plant-based food groups, animal-based food groups appear to be less protective in the highest-level consumers as indicated by the highest percentages of references reporting significant increased DRCD risks (27% versus 7% for plant-based food groups). This statement is particularly true for red/processed meat (56% of references). Thus, only 14 references (refined cereals not included) that reported increased DRCD risks following higher consumption of the unrefined plant-based food group were found, versus 45 for animal-based food groups. Although to a lesser extent than high levels of red/processed meat consumption, high egg consumption tended to be associated with a slightly higher risk of DRCDs, but the limited number of studies collected did not allow definitive conclusions to be reached. With regard to CVD, the harmful effect of eggs might be due to the generally negative dietary patterns often associated with high egg intake.79 Other food groups, including dairy products, poultry, and fish, appear to have a neutral and/or protective effect, although there are still too few observational studies on poultry consumption to draw firm conclusions. For example, there was no PMASR that analyzed the association between poultry consumption and CVD risk. The protective effect of fish against CVD risk is confirmed in this study. It is attributed primarily to the high amounts of long-chain omega-3 polyunsaturated fatty acids in fish.80 Detailed mechanisms of action would involve anti-arrhythmic properties, reductions in serum triglycerides81 and platelet aggregation,82 and improved endothelial dysfunction.83
Conclusion
Overall, the present work confirms previous findings but also provides new results. Moreover, the trends revealed by this study are based on an a posteriori approach via an exhaustive review of the literature published between 1950 and 2013. Therefore, these results substantiate certain a priori nutritional recommendations that are sometimes based on assumptions about the foods that should be included in a balanced diet or on characteristics of “healthy” foods. One typical example is that of milk: the results from the present analysis showed that regular and/or high consumption of milk has a rather neutral effect, i.e., it is not associated with major DRCD risks. In other words, scientifically speaking, drinking milk should not be discouraged, contrary to what might be read or heard within various media today. If animal-based food group consumption is associated with a less protective effect, it must be kept in mind that all results are derived from PMASRs based on the comparison of the highest versus the lowest consumer. Thus, the results do not mean that no animal-based food group should be consumed, rather that individuals with the highest level of consumption should restrict their consumption, and conversely, those with the lowest consumption of plant-based food groups should increase their consumption. Therefore, the results of this analysis are, overall, in agreement with food-based pyramids, except that all grain products should probably be emphasized over fruits and vegetables, rather than the reverse.
This exhaustive and holistic review also confirms that consumption of tea and unrefined plant-based food groups should continue to be highly recommended. In contrast, the consumption of refined cereal products, red/processed meat, eggs, very hot tea (but not tea in general), sweetened beverages, pickled vegetables, and fermented soy foods clearly should be limited, while consumption of poultry and milk and dairy products appears to have a rather neutral effect on DRCD risk. Therefore, on the basis of these results, greater emphasis should be placed on grain products in food pyramids, first on whole-grain cereals and leguminous seeds, and then on nuts and seeds. Grain products show promise as foods with a potential to reduce DRCD risk, most likely even more so than fruits and vegetables. Even more compelling, grain products are a superior source of energy (based on starch content, especially whole-grain cereals), proteins (especially leguminous seeds), and lipids (especially nuts and oleaginous seeds) and are less expensive and easier to store than fruits and vegetables. In addition, the margin for increasing their consumption in Western countries is high, particularly with regard to legumes, nuts, and seeds, which remain niche products today. Nevertheless, contamination of grains by pesticides must be considered, even though pesticides are probably easier to remove from grain products than from fruits and vegetables prior to marketing.
Interestingly, the results presented here a posteriori support the recommendations of the Mediterranean diet: i.e., encourage consumption of vegetables, legumes, fruits and nuts, cereal, and fish, while consumption of meat, poultry, and dairy products should be limited. In this study, when the protective effects of these 9 food groups toward all 10 DRCDs are considered on the basis of PMASR percentages only, the same trends are found (Figure 1A). The one exception is the finding for dairy products; since their association with DRCDs was more or less neutral, the present results do not discourage their consumption.
This work emphasizes the need for future research. For example, it is curious that no observational studies have been carried out to investigate the association between risk of sarcopenia and consumption of the main food groups and beverages. Surprisingly, the number of meta-analyses investigating the associations of animal-based food group consumption with weight gain, overweight and/or obesity, and, to a lesser extent, diabetes, is quite low. Both obesity and diabetes have become worldwide epidemics and are strong risk factors for other fatal chronic diseases, such as CVD and cancers.4 The absence of meta-analyses for the association between wine and liver diseases is also rather surprising because high alcohol consumption has been positively associated with chronic liver diseases, especially cirrhosis.84,85 The same is true for the association between wine and diabetes.
This work emphasizes the difficulty of identifying strong and/or definitive associations in nutrition, as demonstrated by the still important heterogeneity of the results obtained. It seems difficult, in these cases, to give general recommendations to different populations in different countries. It is highly probable that such heterogeneity supports the concept that nutritional tendencies may vary among populations, and subsequent recommendations should be restricted to one country or region or a clearly identified lifestyle. In addition, there may be genetic factors in a given population that influence the effect of consumption of a particular food group or beverage. For example, it is recognized that genetic polymorphisms may significantly influence the metabolism of caffeine and lactose. Consequently, the heterogeneity of results could be partly attributable to the heterogeneous background of the population studied, and stronger associations for some food groups and beverages may imply a more homogenous genetic background underlying the health effect reported, whether neutral, negative, or positive. In other words, genetic background may be prevalent upon the food effect for some foods (e.g., coffee and dairy products/milk), and for others, the food effect may be prevalent upon genetic background (i.e., tea). Furthermore, dietary habits and many other factors may differ among populations. Therefore, it is not surprising that high consumption of dairy products and milk would impact health differently, particularly the risk of osteoporosis in Chinese (i.e., Asian) or European (i.e., Western) populations, who have quite different lifestyles. In other words, the results obtained are most likely population dependent, and nutritional recommendations should be adapted according to the target at continental (e.g., Western vs. Asian countries), national, population, or individual levels. For example, a recommendation to drink milk during adolescence may be promoted at the national level but may differ when addressing an individual, e.g., one who is lactose intolerant.
This work was based on intakes of the major food groups and beverages that have been studied the most in the literature. In reality, however, people do not consume food groups, but diets. Data from the literature for the associations between diet and DRCDs were still too limited and too recent to allow significant results or trends to be calculated, although convincing results for the protective effect of the Mediterranean diet have been reported previously.5,8,9 In the future, therefore, dietary patterns should be emphasized, and PMASRs should assess the associations of DRCD risks with dietary patterns rather than with isolated nutrients, beverages, foods, or food groups.
Together with in vivo, in vitro, and in silico studies, in biblio studies (e.g., via data mining) should be increasingly developed and refined to help analyze the vast amount of nutritional data published each year (i.e., “big data”) and to search for previously hidden associations.
Author contributions
AF designed and conducted the research and collected the data. AF and YB analyzed and interpreted the data and wrote the manuscript. Both authors read and approved the final manuscript.
Funding
No external funding was provided for this study.
Declaration of interest
The authors have no relevant interests to declare.
References
