


A magnetoencephalography study was conducted to reveal the neural code of interaural time difference (ITD) in the human cortex. Widely used crosscorrelator models predict that the code consists of narrow receptive fields distributed to all ITDs. The present findings are, however, more in line with a neural code formed by two opponent neural populations: one tuned to the left and the other to the right hemifield. The results are consistent with models of ITD extraction in the auditory brainstem of small mammals and, therefore, suggest that similar computational principles underlie human sound source localization.
I. Introduction
Our ability to localize low-frequency sounds, for instance, speech, relies on the submillisecond interaural time difference (ITD) that results from the differential time delay for the sound to reach the two ears.1,2 The current view on the neural extraction of ITD is based on a theoretical framework originally proposed by Jeffress.3 According to this theory, the ITD is extracted by a system of neuronal delay lines and coincidence detectors. This results in an orderly place code representation of auditory space where each neuron is narrowly tuned to a preferred value of ITD. Neurophysiological studies have placed the coincidence detector system in the mammalian medial superior olive4 (MSO).
Recently, the Jeffress model has been challenged by a hemifield model of ITD detection.5,6 According to this view, ITD is extracted based on the relative timing of excitatory and inhibitory inputs arriving to the MSO.5 This neuronal computation results in a hemifield code of auditory space where the location of a sound source is represented in the firing rates of two opponent populations: one tuned to the left and the other to the right hemifield. Neurophysiological evidence for this code has been found in small mammals5,6 but it is unclear to what extent the results can be generalized to humans. Studies of spatial coding in the monkey7 and human8 auditory cortices have found receptive fields consistent with the hemifield code by utilizing free-field sound stimulation. It is, however, not clear what the contribution of ITD is in these results. The free-field stimuli include a prominent interaural level difference (ILD), which is represented as a hemifield code already in the lateral superior olive (LSO) of the brainstem.9
The aim of the present magnetoencephalography (MEG) investigation was to find out whether the ITD is represented in the human auditory cortex by neurons narrowly tuned to ITD consistent with the output of the Jeffress model or by hemifield-tuned neurons as suggested by recent work on small mammals. For probing the ITD tuning of single neurons in the human brain, we used a stimulus-specific adaptation paradigm that capitalizes on the attenuation of activity of individual neurons after the presentation of a stimulus to which the neurons are sensitive.10 We measured the amplitude of the N1m response that occurs at around 100 ms after stimulus onset in the event-related field and reflects the compound activity of auditory cortical areas. A probe sound with an ITD corresponding to a location in the left hemifield was presented in the context of adaptors with varying ITDs (Fig. 1). The narrow ITD tuning predicts that the strongest attenuation follows from the adaptor having the same ITD as the probe because they activate the same population of ITD-selective neurons. When the ITD of the adaptor is either shorter or longer than that of the probe, the two sounds activate distinct ITD-selective neurons and, thus, less attenuation is expected. The hemifield tuning, in contrast, predicts that the response to the probe sound arises mainly from a population tuned to the left hemifield and, therefore, the strength of the attenuation depends on the ability of the adaptor to activate this population. Consequently, the attenuation is the stronger the further to the left the adaptor is.
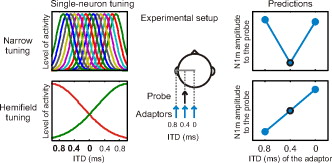
Models of ITD processing and their experimental predictions. Two alternative neuronal representations of ITD have been suggested: narrowly tuned receptive fields and hemifield tuning (left). In the present study, a probe sound was presented with , left-ear leading, and the amplitude of the N1m response was measured (middle). The probe presentation alternated with an adaptor sound presented with ITDs of 0, 0.4, and 0.8 ms. The alternative models of ITD coding predict distinct patterns of adaptation of the N1m response amplitude (right). The narrow tuning curves would lead to strongest attenuation when the probe and the adaptor have the same ITD (0.4 ms). The hemifield tuning, in contrast, predicts that adaptation is strongest when the adaptor is furthest to the left (0.8 ms).
Models of ITD processing and their experimental predictions. Two alternative neuronal representations of ITD have been suggested: narrowly tuned receptive fields and hemifield tuning (left). In the present study, a probe sound was presented with , left-ear leading, and the amplitude of the N1m response was measured (middle). The probe presentation alternated with an adaptor sound presented with ITDs of 0, 0.4, and 0.8 ms. The alternative models of ITD coding predict distinct patterns of adaptation of the N1m response amplitude (right). The narrow tuning curves would lead to strongest attenuation when the probe and the adaptor have the same ITD (0.4 ms). The hemifield tuning, in contrast, predicts that adaptation is strongest when the adaptor is furthest to the left (0.8 ms).
An additional goal of the experiment was to test the limits of ITD representation in the human auditory cortex. The ITD has a natural upper limit determined by head size. To test whether the neuronal representation reflects the limits of naturally occurring interaural delays, we measured ITD-selectivity both within and outside the upper bound of physiologically possible values.
II. Methods
Fourteen subjects participated in the study with written informed consent and the approval of the Ethical Committee of Helsinki University Central Hospital. The data of three subjects were discarded due to a poor signal-to-noise ratio. The remaining 11 subjects had a mean age of 27 (standard deviation 6, four females), reported no history of neurological or hearing disorders, and were all right-handed. During the measurements, the subjects sat in a reclining chair and were under the instruction to ignore the sound stimulation and to focus on watching a self-selected silent film.
The stimulus was a 200-ms low-pass filtered segment of white noise with the cut-off frequency at 3 kHz presented at 75 dB sound pressure level (SPL) (A). Stimuli with ITDs ranging from 0 to 2.4 ms were generated at intervals of 0.4 ms by delaying the right-ear with respect to the left-ear signal. Thus, both an onset and an ongoing ITD were imposed. The shortest two of the ITD values, 0 and 0.4 ms, are well within the physiologically determined range of delays (determined by the size of the human head). The third-smallest value, 0.8 ms, is at the physiological extreme or slightly longer. The ITD values larger than 0.8 ms are well outside the physiological range and, thus, represent ITDs that do not occur naturally. The subjects perceived all stimuli with an as lateralized the left. Sounds were presented through insert-tip earphones.
The stimulus presentation alternated between the probe and the adaptor with an onset-to-onset interstimulus interval of 1 s. In each stimulus block, a probe sound with and an adaptor with , 0.4, or 0.8 ms was used (Fig. 1). Additionally, the setup was repeated for ITDs outside the physiological range, with the ITD of the probe being 0.8, 1.2, 1.6, or 2.0 ms. Again, for each probe, we used three adaptors that differed in their ITD values from that of the probe by −0.4, 0, or 0.4 ms (Fig. 3). Each probe-adaptor pair was presented within its own stimulation block with a duration of approximately 6 min. The presentation order of the blocks was counterbalanced across subjects.
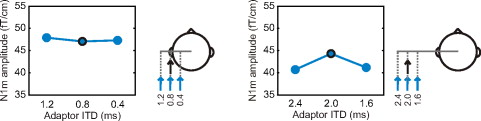
Neuronal tuning in the right hemisphere to ITDs outside the physiological range. The experimental setup was repeated for values outside the naturally occurring range of ITDs. The amplitude of the N1m response to the probes with large ITDs did not depend on the ITD of the adaptor. Note that the illustrations on the right do not depict the perceived locations of the stimuli but, rather, demonstrate the magnitudes of the delays.
Neuronal tuning in the right hemisphere to ITDs outside the physiological range. The experimental setup was repeated for values outside the naturally occurring range of ITDs. The amplitude of the N1m response to the probes with large ITDs did not depend on the ITD of the adaptor. Note that the illustrations on the right do not depict the perceived locations of the stimuli but, rather, demonstrate the magnitudes of the delays.
Brain responses were acquired with a 306-channel whole-head MEG device (Vectorview 4-D, Neuromag Oy, Finland) with a passband from 0.03 to 200 Hz and a sampling rate of 600 Hz. A minimum of 150 responses to each sound were averaged online over a window from 100 before to 350 ms after stimulus onset. Eye-movements were monitored with electrodes, and absolute deviations larger than or 3000 fT/cm led to automatic discarding of the epoch. The averaged brain responses were filtered at 2–30 Hz and baseline-corrected with respect to a 100-ms pre-stimulus period. To quantify the amplitude of the N1m response, the magnitudes of the vector sums from three gradiometer pairs showing the largest response amplitudes were averaged separately for the left and right hemispheres. The N1m response was identified as the waveform peak in the 80–140 ms latency region.
The peak amplitudes of the N1m responses to the probe sounds were submitted to a repeated-measures analysis of variance with cortical hemisphere, probe ITD, and adaptor ITD as the repeating factors. For further comparisons, Newman–Keuls post-hoc analyses and a set of planned comparisons were used. The planned comparisons were designed to evaluate the significance of the match between the experimental data and each of the model predictions and targeted responses measured to the probe with (Fig. 1). First, a contrast measuring the match to the prediction arising from narrow tuning gave weights of 1, −2, and 1 to adaptor values of 0, 0.4, and 0.8 ms, respectively. This results in large contrast values if the smallest responses are measured when the adaptor ITD is 0.4 ms and larger responses arise from other conditions. Second, a contrast measuring the match to the hemifield-tuning prediction gave weights of 1, 0, and −1 to adaptor conditions of 0, 0.4, and 0.8 ms, respectively. This contrast results in large values when the N1m response amplitude declines with increasing adaptor ITD.
III. Results
The adaptor ITD had a significant influence on the peak amplitude of the N1m response elicited by the probe (interaction between probe and adaptor ITD: ). Post-hoc analyses revealed that the effect of the adaptor ITD was limited to the responses measured for the probe with an ITD of 0.4 ms, that is, to the stimulation conditions with ITDs within the physiologically plausible range (Figs. 2 and 3). No variation in the amplitude of the N1m response was found for probes with longer ITDs. This suggests that neuronal sensitivity in the cortex is limited to naturally occurring interaural delays.

MEG results supporting hemifield tuning. MEG waveforms (left) and N1m response amplitudes (right) averaged over 11 subjects are presented for the left and right hemispheres. For the probe with an ITD of 0.4 ms, the largest N1m amplitudes were measured with the adaptor ITD of 0 ms (i.e., sound source in front) and the smallest with the adaptor ITD of 0.8 ms (i.e., sound source furthest to the left). This corresponds to the predictions based on hemifield tuning to ITD (see Fig. 1).
MEG results supporting hemifield tuning. MEG waveforms (left) and N1m response amplitudes (right) averaged over 11 subjects are presented for the left and right hemispheres. For the probe with an ITD of 0.4 ms, the largest N1m amplitudes were measured with the adaptor ITD of 0 ms (i.e., sound source in front) and the smallest with the adaptor ITD of 0.8 ms (i.e., sound source furthest to the left). This corresponds to the predictions based on hemifield tuning to ITD (see Fig. 1).
For the probe sound presented within the physiological range (0.4 ms), the largest responses (i.e., the weakest attenuating effects of the adaptor) were measured with the adaptor ITD being 0 ms (Fig. 2). Response amplitudes were intermediate for the adaptor with an ITD identical to that of the probe. Finally, the smallest responses (i.e., the strongest attenuating effects) were measured when the adaptor ITD was 0.8 ms, that is, longer than the ITD of the probe (, compared to adaptor ITD being 0 ms). Thus, the adaptation of the response to the probe sound in the left hemifield was the stronger the further the adaptor was situated to the left. This result is consistent with the hemifield code of ITD (Fig. 1).
To further analyze whether ITD is represented in cortex through narrow or hemifield tuning, we conducted planned comparisons. These contrasts were designed to measure the extent to which the variation of the peak amplitude of the N1m response matches the hypothesized results arising from the two alternative models, with a significant contrast indicating a good match between the experimental result and the prediction. For the right-hemispheric N1m response, the contrast corresponding to hemifield tuning yielded significant results while that corresponding to narrow tuning was non-significant . In the left hemisphere, the contrast corresponding to hemifield tuning approached significance and that corresponding to narrow tuning was again non-significant . This provides further evidence that the results are in favor of hemifield tuning to ITD.
The ITD-specific adaptation of the N1m response in the left cortical hemisphere was similar to that in right hemisphere (Fig. 2). The right-hemispheric N1m responses were larger in amplitude than the left-hemispheric ones as is often found for left-lateralized sounds.10 No interaction was found between the hemisphere and the stimulus conditions suggesting that the two cortical hemispheres have similar neuronal selectivity to ITD.
IV. Discussion
We conducted MEG measurements to reveal how the ITD cue of sound source location is represented by neurons in the human auditory cortex. The present findings are inconsistent with the narrow spatial receptive fields. If the human cortex implemented a narrow tuning to ITD, the strongest attenuation of brain responses should occur when the ITDs of the probe and the adaptor are the same and the adaptation should be weaker when the ITDs of the two stimuli differ. Rather than observing this response pattern, we found that the attenuation was the stronger the more lateral the adaptor was. This finding is in line with an alternative, hemifield-tuning view of ITD representation. In hemifield tuning, neurons exhibit wide tuning curves with a flat maximum corresponding to sound sources either to the left or to the right. This type of tuning is consistent with the neural codes of auditory space found previously in single-unit studies of primate cortex7 and MEG studies of the human brain8 utilizing free-field stimuli. Therefore, it seems that in the human cortex the hemifield coding strategy applies to all horizontal sound source localization cues.
In the hemifield code, the ability of the neurons to discriminate between spatial locations is best when the sound source location corresponds to the steepest slopes of the tuning curves, that is, when the sound source is in front of the subject.6,11 Due to the steepness of the tuning curve, a small separation between sound source locations in front produces a large change in the level of activity of the neurons. At lateral locations, however, sound sources with the same separation lead to a much smaller change in activity as the sources are mapped to the flat top portion of the tuning curve. The ITD-specific adaptation found in the present study is explained by the stimuli falling onto the slope of the tuning curve: The ITD values 0, 0.4, and 0.8 ms all corresponded to distinct heights of the ITD tuning curves and, consequently, were differently effective as adaptors. The larger ITD values extending outside the physiologically possible range, in contrast, were all similarly effective as adaptors. This suggests that the ITD tuning curves were at the same height for all of the adaptors with the unnaturally long ITDs. Thus, the ITD tuning curves seem to have their steepest slopes and therefore exhibit maximal discriminability for the range of delays that are relevant for sound source localization. This finding coincides with behavioral measures of ITD discrimination, which show a fast decline in performance when going beyond the limits of naturally occurring ITDs.12
The present findings have interesting parallels in recent psychophysical studies of adaptation in the human spatial hearing system. Exposure to an adaptor sound produces an aftereffect that alters the perceived source location of subsequently presented test sounds.13,14 These effects are determined by the spatial location of the adaptor sound so that perception is always biased toward the hemifield opposite to the location of the adaptor. The effect can be induced by both ITD and ILD cues. For instance, when an adaptor is presented with an ITD corresponding to a location in the left hemisphere, the perceived locations of subsequent test sound sources are shifted toward the right from their perceived locations in conditions when no adaptors are presented. Importantly, depending on the location of the adaptor and the test sound sources (i.e., depending on whether the test sound is at a more lateral location than the adaptor), the aftereffect can lead to biases either toward or away from the adaptor location. Thus, it cannot be described in terms of the adaptor location repelling the perceived location of subsequent sounds. This can be explained in the hemifield-code framework by the laterally presented adaptor attenuating selectively one of the hemifield-tuned neuronal populations while the other one remains unaffected. Thus, the biased perception of the test sound results from the stronger neuronal activity arising from the population tuned to the hemifield opposite to the adaptor location. This finding would be very hard to account for with a model based on narrow ITD tuning but is well in line with hemifield tuning.
Here, we studied the neuronal receptive fields to ITD in the human auditory cortex. The extraction of ITD, however, occurs already in the auditory nuclei of the brainstem and, therefore, the cortical measures reflect the output of neuronal computations taking place at earlier stages of the auditory pathway. Recently, research on small mammals has led to detailed neural models of ITD extraction5,6 whose output is consistent with the present findings on the receptive fields in human cortex. Nevertheless, the possibility remains that the hemifield tuning to ITD in the human cortex arises from some other, still unknown computational strategy realized in the auditory brainstem. To establish whether the models constructed based on small mammal data apply to human sound source localization, more detailed predictions will need to be formulated and tested in human brain imaging and behavioral studies.
Acknowledgment
This study was supported by the Academy of Finland (Project Nos. 111848, 217082, and 217113).