Article Text

Abstract
Objective: To measure the levels and patterns of physical activity, using accelerometers, of 11-year-old children participating in the Avon Longitudinal Study of Parents and Children (ALSPAC).
Design: Cross-sectional analysis.
Setting: ALSPAC is a birth cohort study located in the former county of Avon, in the southwest of England. This study used data collected when the children were 11 years old.
Participants: 5595 children (2662 boys, 2933 girls). The children are the offspring of women recruited to a birth cohort study during 1991–2. The median age (95% CI) of the children is now 11.8 (11.6 to 11.9) years.
Methods: Physical activity was measured over a maximum of 7 consecutive days using the MTI Actigraph accelerometer.
Main outcome measures: Level and pattern of physical activity.
Results: The median physical activity level was 580 counts/min. Boys were more active than girls (median (IQR) 644 (528–772) counts/min vs 529 (444–638) counts/min, respectively). Only 2.5% (95% CI 2.1% to 2.9%) of children (boys 5.1% (95% CI 4.3% to 6.0%), girls 0.4% (95% CI 0.2% to 0.7%) met current internationally recognised recommendations for physical activity. Children were most active in summer and least active in winter (difference = 108 counts/min). Both the mother and partner’s education level were inversely associated with activity level (p for trend <0.001 (both mother and partner)). The association was lost for mother’s education (p for trend = 0.07) and attenuated for partner’s education (p for trend = 0.02), after adjustment for age, sex, season, maternal age and social class.
Conclusions: A large majority of children are insufficiently active, according to current recommended levels for health.
Statistics from Altmetric.com
Regular physical activity in children is associated with improved health.1–3 A recent systematic review of the evidence relating physical activity to health concluded that children should spend at least 60 min in moderate to vigorous physical activity (MVPA) each day, in order to promote a broad range of health improvements.3 Few studies4–6 worldwide have collected objective physical activity data in large samples of children and we lack population-based objective data describing levels and patterns of children’s activity. Nevertheless, physical activity is frequently implicated in the escalating levels of type 2 diabetes7 and obesity8–12 in children. We report here on objectively measured physical activity levels and patterns in a large contemporary cohort of 11-year-old children—the Avon Longitudinal Study of Parents and Children (ALSPAC).
PARTICIPANTS AND METHODS
Participants
ALSPAC is a birth cohort study that recruited subjects resident in the former county of Avon in the southwest of England, and has been described in detail elsewhere.13 A total of 14 541 pregnant women were recruited, resulting in 14 062 live births. We conducted the present study between January 2003 and January 2005, when most of the children were 11 years old. The ALSPAC Law and Ethics Committee and other local research ethics committees approved the study.
Methods
Descriptive data
The 32-week antenatal questionnaire asked the mother to record her highest education level, which was categorised into none/CSE (national school exams at age 16), vocational, O level (national school exams at age 16, higher than CSE), A level (national school exams at age 18) or university degree. She also recorded the occupation of both herself and her partner, which were used to allocate them to social class groups (classes I–V with III split into non-manual and manual) using the 1991 Office of Population Censuses and Surveys.14 Where the social class of the mother and partner differed, the lower of the two was used in the analysis. We used lowest social class because it has been used in previous analyses on this cohort and gives the most variability within this measure. More recent measures of socioeconomic status have been taken, but at this point they are not coded and entered. A puberty questionnaire was filled in by the child’s carer (usually the child’s mother) when the child was approximately 11 years old, which included questions on pubertal stage. Pubertal stage for boys was based on pubic hair development, and for girls was based on the most advanced stage for pubic hair and breast development.
Measurement of physical activity
We chose the uni-axial MTI Actigraph accelerometer, model WAM 7164 (Manufacturing Technology Inc, Fort Walton Beach, Florida) to measure physical activity. Objective methods such as accelerometers provide considerably greater precision of measurement, as they overcome children’s lack of ability to recall and quantify physical activity. They also allow detailed investigation of patterns of activity on a minute-by-minute basis. This instrument is becoming more widely used in physical activity studies and has been shown to compare favourably with other similar instruments.15 It has also proved to be robust in epidemiological, fieldwork situations. The Actigraph is a lightweight, electronic motion sensor comprising a single plane (vertical) accelerometer. The accelerometers are small (4.5×3.5×1.0 cm) and light (about 43 g) and are worn on an elasticated belt on the right hip. Movement in a vertical plane is detected as a combined function of the frequency and intensity of the movement. Movement counts are averaged over defined epochs and these data are stored in memory and subsequently downloaded to a computer. The Actigraph has been validated in both children and adolescents.16–21
Actigraphs were programmed to measure 1-min epochs, and the children were asked to wear the Actigraph during waking hours for 7 consecutive days. Although shorter epochs have been recommended—as longer epochs underestimate moderate and vigorous activity, we needed to use 1-min epochs to achieve a full 7 days of measurement. The limiting factor was the data storage capacity of the instrument we used. We accept that a small amount of underestimation of MVPA is inherent in this analysis. Children who did not achieve a minimum of 600 min valid data on at least 3 separate days were omitted from the analyses.5 We have recently reported22 data investigating different combinations of minimum day length, minimum days recorded and the influence of weekday and weekend days. Three days of at least 600 min a day recorded gave adequate reliability and power (>90%) and ensured a sufficient sample size for all analyses, irrespective of the inclusion of a weekend day. Although a weekend day was not specified in order to fulfil validity criteria, 90% of children had at least one weekend day of recording.
Two main physical activity variables were derived—total physical activity and time spent in MVPA. Total physical activity was the average accelerometer counts/min over the full period of valid recording. MVPA was the average minutes of moderate and vigorous physical activity per valid day. From our calibration study, the level of accelerometer counts/min corresponding to the lower threshold of moderate intensity activity (4 METS)—assessed by indirect calorimetry—was established as 3600 counts/min. This threshold lies around midway between a “comfortable” walking pace for children (4.4 kmph; 2950 counts/min) and a “brisk” walking pace (5.8 kmph; 4175 counts/min). We additionally derived minutes of activity during individual hours of the day and sustained bouts per day of MVPA lasting at least 5, 10 and 20 min.
Statistical analyses
We analysed the data using Stata version 8.1. The median and the interquartile range (IQR) were calculated for all variables. All physical activity variables, weight and body mass index (body mass index) were skewed, and therefore log transformations were carried out. Statistical tests were carried out on these transformed variables. Differences between groups were assessed using independent samples t tests. A two-sample proportion test was used to test for group differences (participants vs non-participants, boys vs girls) in the proportions of children achieving recommended levels of activity. The total time (min) of MVPA recorded was divided by the number of valid days recording, giving an average number of min/day across the measurement period. We considered this to be more valid than scrutinising each individual day as this would disadvantage children who achieved well in excess of 60 min on 1 day followed by a marginal failure to achieve 60 min on another. The additional activity on day 1 in our view more than compensates (in health terms) for the marginal failure to gain 60 min on the next day.
To establish whether there were differences in activity levels between children with different numbers of days of measurement, mean values of activity counts/min were calculated separately for children with 3, 4, 5, 6 and 7 days of valid activity measurements. Differences between the groups with different numbers of valid days of measurement were assessed using one way analysis of variance (ANOVA). The influence of season and social position on physical activity levels was assessed using multiple linear regression. For the regression analysis, data were not transformed but robust standard errors were used. Robust standard errors allow derivation of confidence intervals and standard errors based on the actual distribution of the outcome variable in the dataset, rather than on an assumed underlying probability distribution.23
To use International Task Force (IOTF) criteria, linear regression was used to adjust heights and weights to age 11.5, based on decimal age of each child. BMI was then recalculated from the age-adjusted variables. The IOTF sex-specific cut-offs for age 11.5 were applied.24 To use the British 1990 criteria, age-specific and sex-specific centiles were used to generate standard deviation scores, and cut-offs of BMI >1.04 (85th centile) and BMI >1.64 (95th centile) were applied.25 We used both criteria because there is no universal agreement about which is more appropriate, and to allow greater comparison with other studies that have used both.
RESULTS
A total of 7159 children attended the 11-year clinic and 6622 (92.5%) agreed to wear an Actigraph. Of the children who agreed to participate, 2662 boys and 2933 girls returned Actigraphs that satisfied the validity criteria. Children who provided valid recordings differed from children who did not provide valid recordings in terms of age, weight, BMI, sex and pubertal status but the size of the differences were small. More girls than boys returned instruments with valid data (81% girls vs 76% boys; p<0.001). Parental variables were not strongly associated with compliance. Children were more likely to comply if their mother had a higher level of education but again the differences were small. Full details of these differences and their implications have been reported elsewhere.22
The one way ANOVA indicated a difference between the activity levels of children with different numbers of valid days’ measurement (F = 8.144,5591, p<0.001). Activity levels on day 1 of measurement were on average 17 (95% CI 10 to 24) counts/min higher than the average of subsequent days, indicating that the instrument may have a very small, “reactive” effect. Linear regression, allowing for multiple measurements per child, also indicated that day 1 of measurement tended to show slightly higher activity levels than subsequent days (p for trend <0.001). We have reported this fully in a previous methods paper.22 We do not believe this magnitude of effect is meaningful.
Table 1 shows the main descriptive and physical activity data for boys and girls. Overall, boys had higher activity levels than girls during both weekdays and weekend days. Boys also participated in more MVPA. The largest sex differences were seen in the proportion of children meeting recommended activity levels. Both boys and girls spent most of their active time in light intensity activity (200–3599 counts/min). Forty per cent of boys and 22% of girls averaged at least one bout per day of MVPA lasting at least 5 min; 5% of boys and 2% of girls averaged at least one 10-min bout and <1% of both boys and girls averaged at least one 20-min bout.
Social class was inversely associated with total physical activity (p for trend <0.001), but the association was lost after adjustment for age, sex, maternal age, season and mother and partner’s education. Social class was not associated with MVPA in either unadjusted or adjusted models. Both the mother and partner’s education level were inversely associated with activity level (p for trend <0.001 (both mother and partner). The association was lost for mother’s education (p for trend = 0.07) and attenuated for partner’s education (p for trend = 0.02), after adjustment for age, sex, season, maternal age and social class.
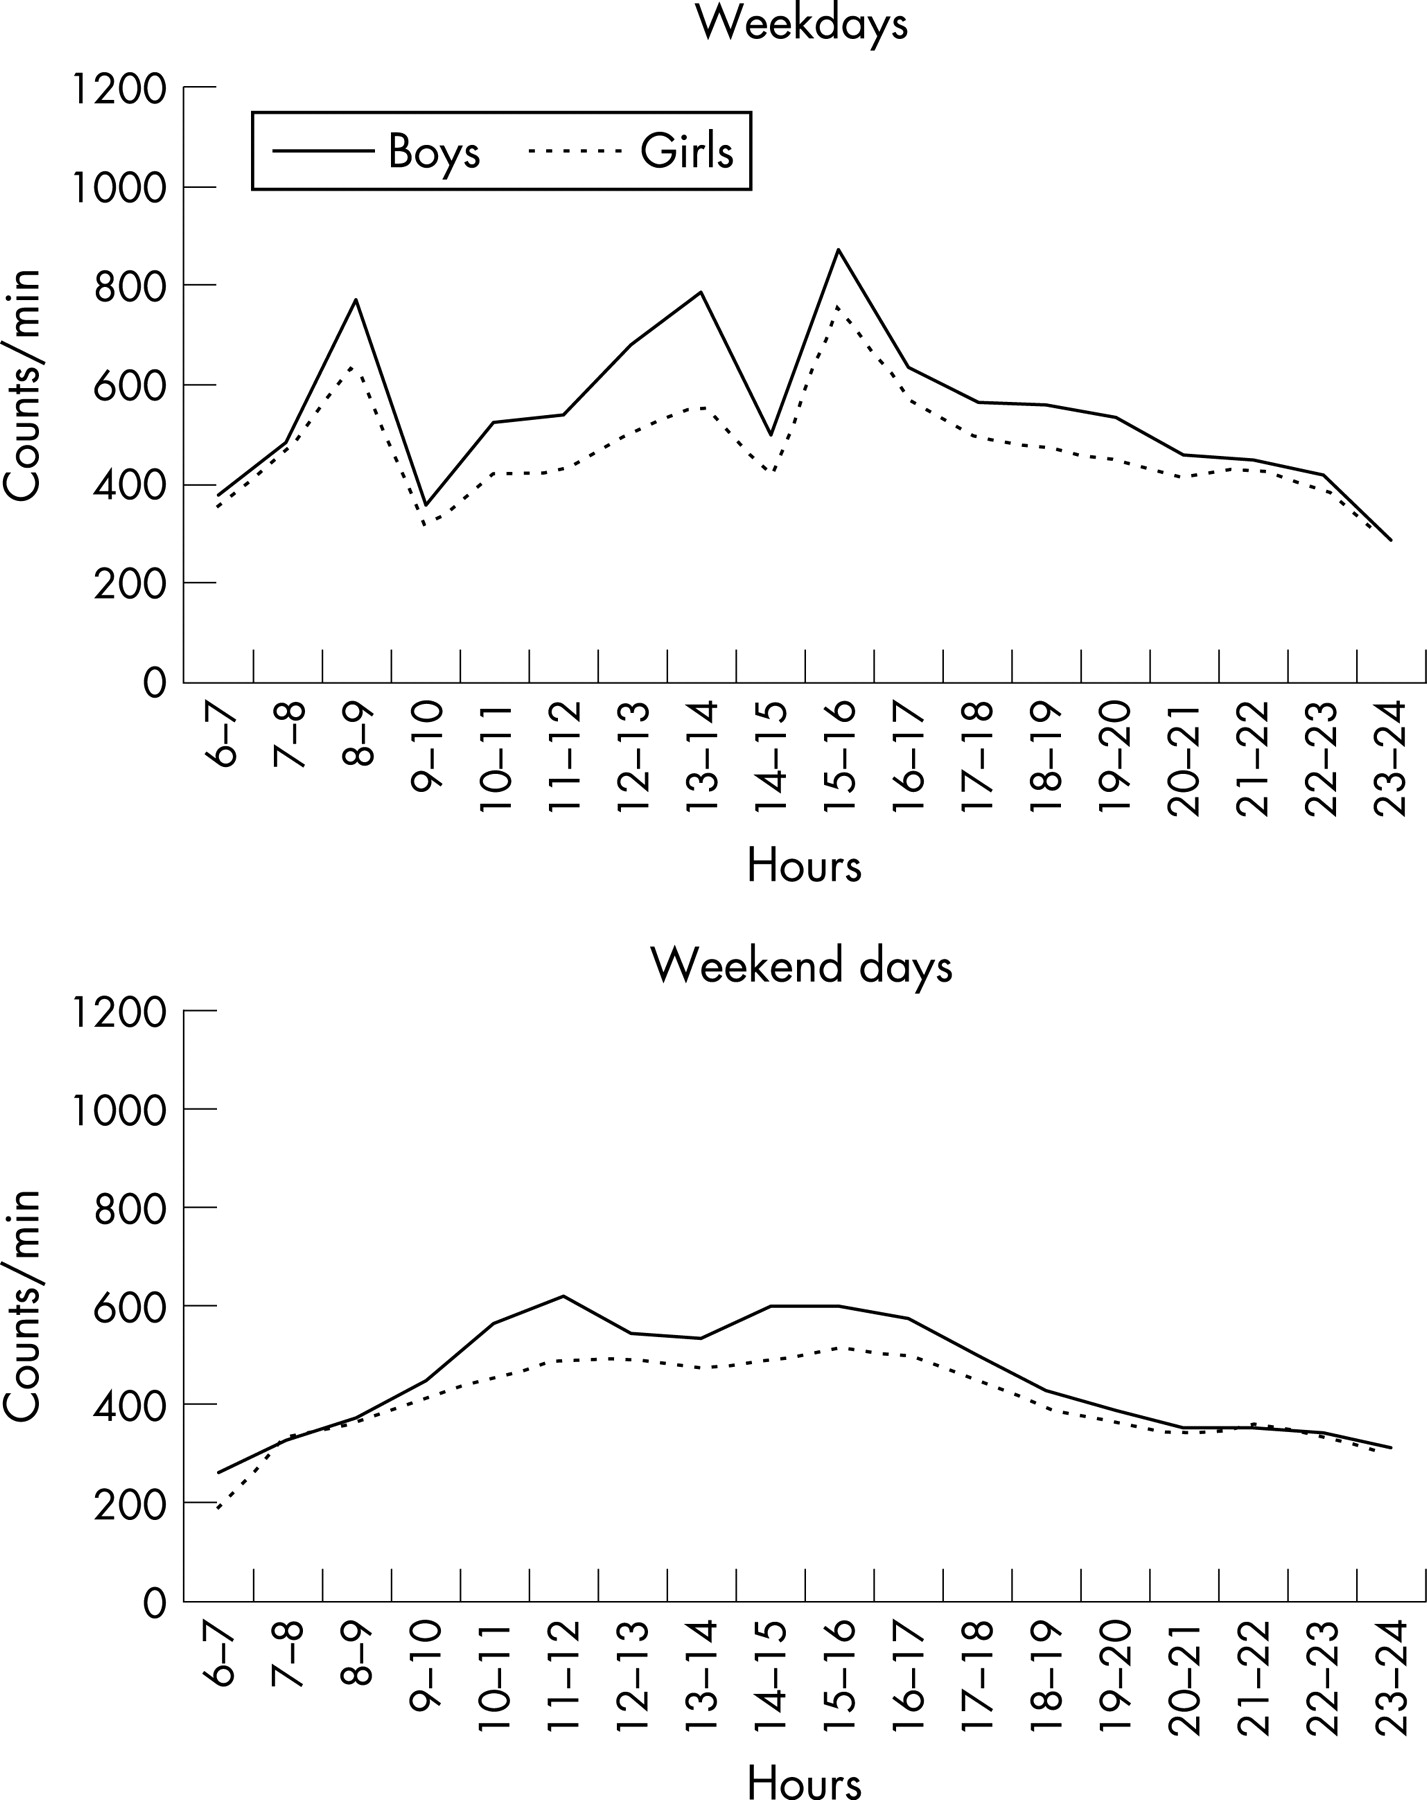
Figure 1 shows the association between mother and partner’s education level and their child’s activity level. There was no association between either the mother or partner’s education level and minutes of MVPA. Figure 2 shows the influence of season on physical activity level (counts/min) and MVPA, adjusted for age and sex. Activity levels were lowest in winter. Figure 3 shows the daily physical activity patterns of boys and girls for weekdays and weekend days. Marked differences in activity patterns can be observed between weekdays and weekend days in both boys and girls. Weekdays demonstrate more peaks and troughs, probably representing the school day, with children sitting in classrooms interspersed with periods of free time and recreation. The activity patterns of boys and girls are very similar.


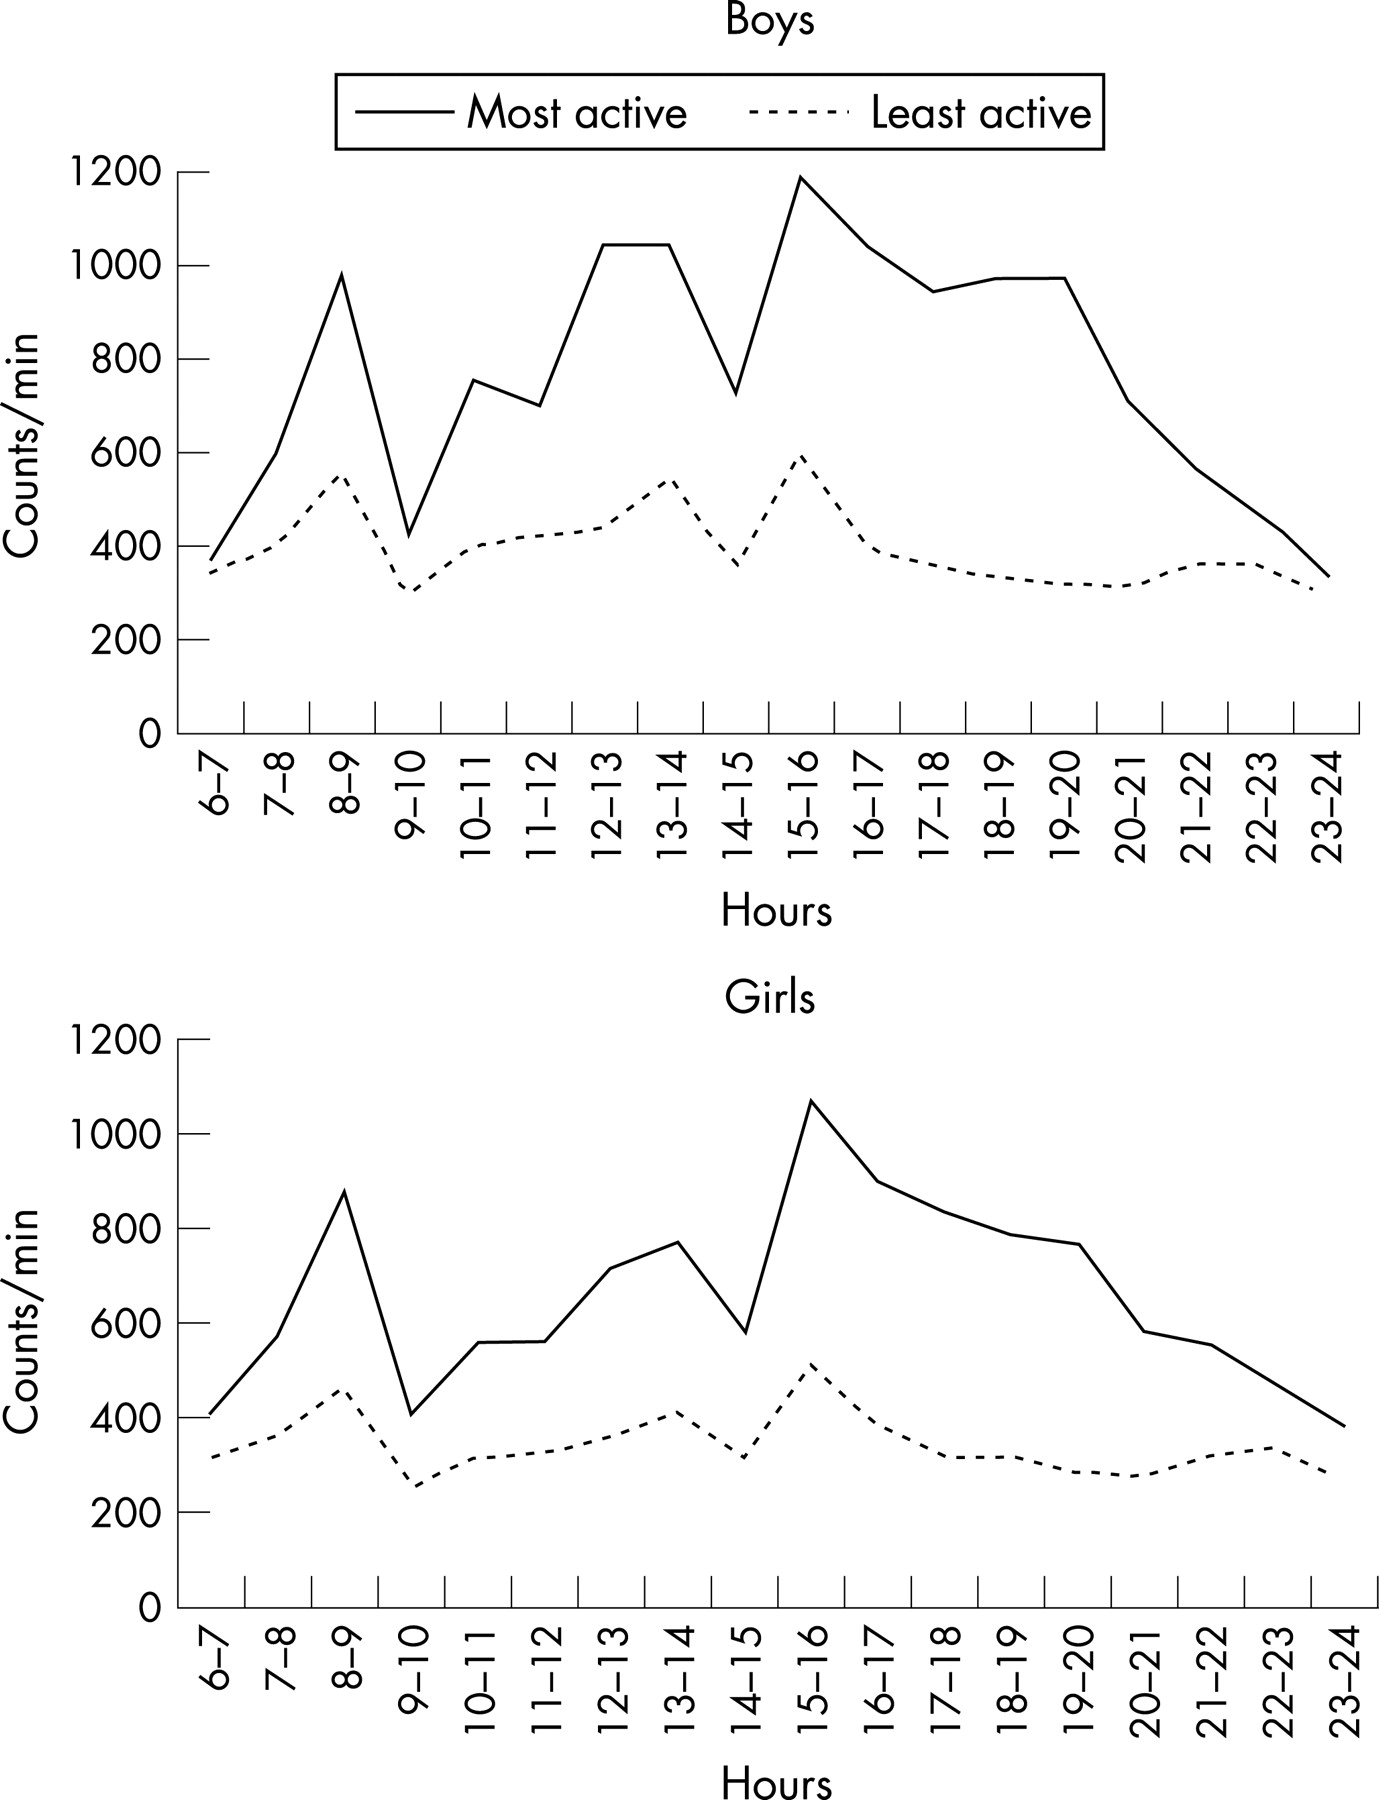
Figures 4 and 5 show the daily physical activity patterns of most and least active (highest/lowest quintiles) boys and girls for weekdays and weekend days. Again, the patterns of the two groups are remarkably similar, differing only in the amount of activity performed. During weekdays, the period between the end of school (mid-afternoon) and bedtime seems to be the period of the day when the largest differences in activity occur. During weekend days, patterns are again very similar with larger differences in activity levels being seen in the boys.

The prevalence of overweight and obesity varies considerably, according to the method of derivation. Using the IOTF criteria, 17% of children were categorised as overweight and 5% obese. Using the 1990 centiles, 13% were overweight and 15% obese. Table 2 shows how physical activity varied by children’s level of overweight or obesity. In both analyses, activity levels were lower in both the overweight and obese boys and girls. In boys, a graded inverse relationship was apparent across normal, overweight and obese categories, whereas in girls the differences were seen between normal and the other two categories—differences between overweight and obese girls were small.
Figure 6 shows the differences in activity levels by pubertal stage. For girls, Tanner stages 1–5 were used. For boys, analyses were restricted to Tanner stages 1–4 as probably any boy at this age would not be in Tanner stage 5. All analyses were restricted to those children who had returned their puberty questionnaire within 16 weeks of obesity measurement. This study confirms that self-reported pubertal stage is inversely associated with physical activity girls and to a lesser extent in boys.

DISCUSSION
What is already known on this topic
-
From a range of previous studies mostly using self-report methodology, children’s activity levels are thought to be inadequate for health.
-
Boys are considered more active than girls at all ages.
What this study adds
-
This study is one of the first to use objective measurement techniques in a large, representative cohort of children, reporting activity data that are more valid and generalisable than previous studies.
-
These data show levels and patterns of physical activity which, in many children, may be inadequate to promote good health.
Our study has two important findings. First, compared with adults, children participate in high volumes of physical activity, but few children—specially girls—meet the current health related recommendation of 60 min of MVPA daily. Second, very little activity is performed in sustained bouts at a level that would provide promote cardiorespiratory fitness.
Total physical activity
In keeping with previous studies,4 5 boys were more active than girls (median = 644 counts/min vs 529 counts/min). Cooper et al26 reported typical activity levels of between 200 and 400 counts/min in normal, overweight and obese adults from the same geographical region as our children. This indicates that children’s activity level is around double that of adults. However, as levels of childhood overweight and obesity are rising,8 10–12 it seems likely that these levels of activity, although higher than adults, are in fact low.
Light, moderate and vigorous intensity activity
Recommendations for healthy levels of physical activity in children focus exclusively on MVPA (at least 60 min of MVPA daily). The median time spent in MVPA in this study is 20 min/day (boys: 25 min/day; girls: 16 min/day). These figures are considerably lower than those reported for European and American children. Riddoch et al5 reported 192 min/day and 160 min/day in 9 year-old European boys and girls, respectively. Trost et al4 reported that American children achieved 100 min/day of MVPA in the children most closely approximating the age of our children (grades 4–6). Similarly, Pate et al6 reported median values of 146 min/day (boys) and 111 min/day (girls) in 10-year-old American children. These differences are likely to be caused by the use of different cutpoints of accelerometer counts to define the lower threshold of moderate intensity activity. Sleap and Tolfrey27 have highlighted the wide disparity of conclusions that can be reached when different thresholds of light, moderate and vigorous activity are applied.
It should be a matter of some concern that only 5.1% of boys and 0.4% of girls achieved the current recommended level of activity. For adults, 45–60 min of MVPA is recommended to prevent obesity1 and one would hope that most children—known to be more active than adults—would achieve at least this level at this age. It is a sobering thought that children’s activity levels actually peak at around this age and decline precipitously during adolescence.4 28–30
Daily/weekly patterns of activity
Children are more active during weekdays than weekend days, although differences are small (31 counts/min). However, the reasons for this are not clear. Both boys and girls follow similar daily activity patterns. The period 11:00–14:00 h seems to be a time when boys are substantially more active than girls on both weekdays and weekend days. During weekdays, the morning travel to school period, lunch break and the immediate after-school period are the key times when children are most active. At the weekend, activity patterns are smoother, without the marked peaks and troughs seen on weekdays.
The most and least active children have almost identical daily activity patterns, albeit at different levels. Of particular note is the apparent importance during weekdays of the period from the end of school to bedtime (15:00 h onwards). It is during this period that the active children seem to be substantially more active, with differences between the two groups exceeding 700 counts/min and remaining substantial throughout the evening period. At the weekends, inactive children exhibit extremely flat activity profiles of between 200 and 400 counts/min throughout the day. Conversely, the most active children show peaks of activity during late morning and mid afternoon.
Modifying effects of season and socioeconomic factors
Seasonal influences are relatively strong with a summer–winter difference of 108 counts/min. Fisher et al reported similar seasonal differences in young children, a range of 125 counts/min.31 The most active season for both studies was summer.
Neither social class nor the mother’s education level was associated with either physical activity level or MVPA. Only the partner’s education level demonstrated an association with activity level. Kimm et al32 reported that lower levels of parental education were associated with greater rates of decline in activity through adolescence in children in the USA. In a study of Scottish children, socioeconomic position was not associated with objectively measured activity levels after adjustment for age, sex, BMI, and month of measurement.33 Similarly, a systematic review found no evidence of an association between children’s physical activity and socioeconomic position.34 Socioeconomic conditions in childhood are related to mortality later in life35 and also the increasing prevalence of childhood obesity is strongest in children from lower socioeconomic strata.9 Conversely, Dummer et al36 have reported no association between obesity and indices of deprivation. From our data, it seems unlikely that these health patterns are explained by differences in activity levels.
Physical activity by overweight/obesity status
It is clear that activity levels are lower in overweight and obese children, although the precise nature of the relationship appears to differ between boys and girls. It is notable that the accelerometer measures movement, not energy expenditure. Therefore, it is possible that differences in activity as recorded by the accelerometer may not reflect true differences in energy expenditure, as heavier children have more weight to move. It may be that the tendency of obesity to cluster with other metabolic measures is a more important outcome measure, as recently highlighted by Andersen et al.37
Sustained bouts of physical activity
In adults, cardiorespiratory fitness is a powerful independent predictor of morbidity and mortality at a higher level than physical activity38 and frequent sustained bouts of 10 min of moderate intensity activity have been shown to have beneficial effects not only on cardiorespiratory fitness, but also on a range of cardiovascular risk factors.39 In this study, few children achieved sustained bouts of MVPA. Our data support those of Trost et al4 who reported that sustained 10-min and 20-min bouts of MVPA were extremely rare in children in the USA. Our results also concur with earlier studies of children using heart rate monitoring,40 which also showed very low frequency of sustained bouts of activity. It is unsurprising that children do not achieve many sustained bouts of activity, as the natural tempo of their activity is characterised by frequent short bursts of activity lasting just seconds.41 The health implications of such a sporadic activity pattern are unknown.
Physical activity levels by pubertal stage
We have shown that physical activity level decreases with increasing pubertal stage, most notably in girls. We cannot imply cause and effect, and we cannot separate out the biological influence of physical development and the psychosocial changes that occur during this period. Possibly both are important contributors to activity status and this will be a focus for future papers using longitudinal data through ages 11–15.
CONCLUSIONS
Although many children achieve relatively high volumes of activity compared with adults, few children achieve the level of MVPA recommended for health, particularly girls. These children may be predisposed to the development of childhood obesity, the early onset of cardiovascular risk factors and ultimately chronic disease.
Acknowledgments
We are extremely grateful to all the families who took part in this study, the midwives for their help in recruiting them, and the whole ALSPAC team, which includes interviewers, computer and laboratory technicians, clerical workers, research scientists, volunteers, managers, receptionists and nurses.
REFERENCES
Footnotes
-
Funding: The UK Medical Research Council, the Wellcome Trust and the University of Bristol provide core support for ALSPAC. This research was specifically funded by a grant from National Heart, Lung and Blood Institute (R01 HL071248-01A).The funding source had no input to the study design, apart from changes required by external peer reviewers.
-
Competing interests: None.
- Abbreviations:
- ALSPAC
- Avon Longitudinal Study of Parents and Children
- BMI
- body mass index
- IOTF
- International Task Force
- MVPA
- moderate to vigorous physical activity
Linked Articles
- Atoms