Article Text

Abstract
Introduction Young children with type 1 diabetes (T1D) consume more saturated fat and less fruit and vegetables than recommended. A common challenge in this age group is unpredictable appetite potentially impacting the way parents manage diabetes cares at mealtimes. This small study aimed to assess nutritional intake and mealtime routines of young children with T1D in a clinic where the majority of children were achieving glycemic targets. A secondary aim was to explore association of eating pattern with HbA1c.
Methods A retrospective, cross-sectional review of children aged less than 7.0 years with T1D attending a pediatric diabetes service in Australia was performed (n=24). Baseline characteristics, glycated hemoglobin (HbA1c), a 3-day weighed food diary and a mealtime management survey were collected.
Results Twenty-two children (55% male) were included aged 4.9±1.3 years (mean±SD), HbA1c 47±10 mmol/mol (6.4%±0.9%), body mass index Z-score 0.8±0.9 and diabetes duration 1.7±1.1 years. Preprandial insulin use was reported in 95% of children. Macronutrient distribution (% energy intake) was carbohydrate (48%±4%), protein (16%±2%) and fat (33%±5%) with saturated fat (15%±3%). The majority of children did not meet vegetable and lean meat/protein intake recommendations (0% and 28%, respectively). HbA1c was not correlated with daily total carbohydrate, protein or fat intake (p>0.05). HbA1c was significantly higher in children offered food in a grazing pattern compared with those offered regular meals (mean 61 mmol/mol vs 43 mmol/mol (7.7% vs 6.1%), p=0.01).
Conclusions Dietary quality is a concern in young children with T1D with excessive saturated fat and inadequate vegetable intake. Our results suggest that young children meeting glycemic targets give insulin before meals and follow a routine eating pattern.
- child, preschool
- diabetes mellitus, type 1
- diet
- pediatrics
This is an open access article distributed in accordance with the Creative Commons Attribution Non Commercial (CC BY-NC 4.0) license, which permits others to distribute, remix, adapt, build upon this work non-commercially, and license their derivative works on different terms, provided the original work is properly cited, appropriate credit is given, any changes made indicated, and the use is non-commercial. See: http://creativecommons.org/licenses/by-nc/4.0/.
Statistics from Altmetric.com
Significance of the study
What is already known about this subject?
It is known that mealtimes in young children with type 1 diabetes (T1D) can be challenging as food intake can be difficult to predict.
What are the new findings?
This study shows that young children with T1D eat diets similar to their peers, although fruit and vegetable intake remain a concern. Following a routine eating pattern was associated with improved glycemic outcomes.
How might these results change the focus of research or clinical practice?
The findings suggest that grazing and snacking continually over the day may be associated with poorer glycemic outcomes in young children. Further research into the association between routine eating patterns over the day and glycemic outcomes in young children is needed.
Introduction
International guidelines for nutrition in type 1 diabetes (T1D) provide guidance regarding macronutrient composition and are based on healthy eating recommendations suitable for the whole family.1 2 The International Society of Pediatric and Adolescent Diabetes (ISPAD) recommend a dietary macronutrient composition of carbohydrate (CHO) 45%–55% Energy (E), 15%–20%E Protein and 30%–35%E Fat (with less than 10%E saturated fat) for preschool aged children.2 Australian Healthy Eating guidelines suggest children under 8 years of age include a minimum of 1–1.5 serves of fruit, 2.5–4.5 serves of vegetables, 4 serves of grain/cereal foods, 1–1.5 serves of lean meat and proteins, and 1–1.5 serves of dairy foods.3 Early childhood is a period of rapid growth and development, and therefore appropriate nutritional intake is of great importance. Age-associated food behaviors such as transient food preferences, behavioral resistance, variable appetite and food refusal occur in this age group and are part of normal early childhood development. These may also be encountered in older age groups, and in older children, food neophobia and pickiness have been negatively associated with diabetes management adherence.4 Although these behaviors may present challenges at meal times in both children with and without T1D,5 6 they present unique challenges for very young children with T1D and their caregivers.
Previous studies examining dietary intakes in this age group with T1D have found children with T1D consume more dietary fat, including saturated fat than recommended and do not consume sufficient fruit and vegetables.7–10 However, previous studies included children with an average HbA1c above the international glycemic target, and it is unknown if young children meeting glycemic targets consume dietary intakes in line with recommendations.
The aim of this study was to assess dietary intakes and meal-time routines in young children with T1D attending the pediatric diabetes clinic in Newcastle, Australia, that have been educated in a novel intensive diabetes management program, described previously, where the majority of children met glycemic targets.11 A secondary aim was to explore the association of nutritional intake and eating patterns with HbA1c. We hypothesized that glycemic targets can be achieved in this age group by adhering to international dietary recommendations for macronutrient content and fruit and vegetable intake, with routine eating patterns and preprandial insulin dosing an integral part of management.
Methods
This single-center, retrospective, cross-sectional study reviewed information obtained from medical records of children with T1D aged <7 years receiving care at the pediatric diabetes clinic in Newcastle, Australia. This multidisciplinary pediatric diabetes clinic is referred all children with T1D in the Hunter New England Region of New South Wales, Australia. The region includes one major metropolitan center, several regional communities and some rural and remote areas. In 2016, the clinic provided care to 344 children and adolescents with T1D. The service developed an intensive T1D management program starting in 2004, which resulted in an improvement in average HbA1c in children under 7 years of age from 63 mmol/mol (7.9%) to 51 mmol/mol (6.8%) in 2016.11 The nutritional component of this has been described previously11 and saw a change in dietary practices that were unique to the program and not in the guidelines at the time. Key components were carbohydrate counting taught from diagnosis with minimum and maximum carbohydrate quantity guidance appropriate for age and activity level, advice given for larger main meals and very small snacks with continuous snacking discouraged to encourage appetite for main meals and preprandial insulin adjusted for anticipated intake.11
In a 10 month period in 2015, a parent of each child <7 years of age attending the clinic was invited to complete a 3-day weighed food diary and a questionnaire defining diabetes management routines at mealtimes and eating patterns. Of a possible 24 children, a total of 18 children completed the food diary and 22 children completed the questionnaire, reflecting a response rate of 75% and 91%, respectively. In addition to questionnaire responses and food diaries, HbA1c, age, height, weight, body mass index z-score (BMI Z-score), duration of diabetes, method of insulin administration and occurrences of severe hypoglycemia since diagnosis were extracted from the medical record. Severe hypoglycemia was defined as loss of consciousness or seizure.
Food diary
Paper-based 3-day weighed food diaries were used as a validated method of measuring dietary intake.12 The parents completed a 3-day weighed food diary that documented all food and drink consumed including the type of food and brand name (where available), the measured amount of food offered either by scales or measuring spoons or cups, the amount of food consumed and the preparation/cooking method (eg, grilled, fried, streamed and boiled). Parents were also asked to record the time of all food and drink consumed.
Nutrient analysis
Food diaries were analysed for total energy and nutrient intakes using nutrient analysis software (FoodWorks, Xyris Software, Version 7.0.3016, Australia). The dietary analysis program calculated the total carbohydrate, protein, fat and micronutrient content for each food item the child consumed. All diet records were reviewed by a registered dietitian within 1–2 days of recording. Food diaries were also compared with the recommended number of serves for grain foods, fruit, vegetables and legumes, meat and protein alternatives, dairy products and discretionary foods for age and gender according the Australian Guide to Healthy Eating.3 Schofield’s height–weight equation13 was used to estimate energy requirement based on individual age, sex and activity.
Glycemic index (GI) and glycemic load (GL)
Dietary GI and GL values were determined for each meal. Each single, carbohydrate-containing food in the food record was assigned a GI value from the published international GI tables.14 Foods containing minimal carbohydrate such as meat, fats and oils, cheese, eggs, salad and vegetables were not included in this analysis as per recognized practice. Where an exact match for a food was not available, the next closest match was used as a substitute. This was agreed on by two registered dietitians. When multiple GI values were published for one food, the mean GI value was used.
The GL for each single food was calculated as the mathematical product of the GI value and the grams of carbohydrate, divided by 100.14 The GL for each meal was obtained by the sum of the GL for each single food within the meal. Similarly, the mean daily GL was obtained by dividing the sum of the GL for each meal by the number of days the record was kept for.
The weighted GI of each meal and day was calculated by multiplying the GL of the meal or day by 100 and dividing by the grams of carbohydrate in the meal or day respectively. The mean daily GI represents the average of the 3 days.
Food variety
Unique foods identified in the child’s food diary were given one point, regardless of the quantity consumed. Foods consumed multiple times were only counted once, unless prepared in a substantially different manner (eg, potato served boiled and as fries were counted separately) or a different variations of the same food (white bread was counted separately to wholemeal bread). The total number of foods accumulated over the 3 days was summed, and the mean number of times a unique food was included was determined for the group.
Food and insulin routine questionnaire
The 16-item clinical diabetes management routines at mealtimes survey was a paper-based questionnaire developed by the clinical team that consisted of three open-response questions with the remainder multiple-choice closed-response questions. Five questions captured information on family mealtime structure including regularity of breakfast lunch and dinner, pattern of eating and snacking. Three questions addressed practice regarding timing and delivery of prandial insulin therapy. Six questions collected information regarding mealtime behaviors, which included whether the child ate with the family, allowed duration of the mealtime, reported physical feeding of the child and management of food refusal and requests for additional food. Two questions related to strategies used when meals were not finished.
Statistical analysis
Results are stated as mean±SD unless otherwise specified. Pearson's correlation coefficient was used to test for correlation between HbA1c and daily macronutrient intake. The Wilcoxon rank sum test was used as a non-parametric method to consider differences between two groups.
Results
Participants
There were 24 children <7 years of age with a diagnosis of T1D in the clinic during the time period December 2014–October 2015. Of these, 22 children had completed questionnaires and 18 had completed food diaries reflecting a response rate of 91% and 75%, respectively. The two children for whom there was no questionnaire or food diary were not included in the analysis and did not have baseline characteristics different to the children included (HbA1c: 46 vs 50 mmol/mol (6.4% vs 6.7%)). All children and parents had received education provided according to the pediatric diabetes program described previously.11 Participant baseline characteristics are summarised in table 1. Nineteen of the 22 included children had HbA1c meeting 2018 ISPAD target of less than 7.0%.15 Insulin therapy was given by either insulin pump therapy (IPT) or multiple daily injections (MDI) consisting of basal bolus regimen with four injections per day including three injections of short-acting insulin at main meals and basal insulin (glargine or detemir).
Baseline characteristics of included children
Dietary intakes
Children’s mean energy intake was 86%±14% of their estimated energy requirement as estimated by the Schofield equation.13 The proportion of energy from CHO and protein were within recommended ISPAD targets (see table 2).
Just over half of the children met the Australian recommended number of serves for their age and gender for fruit (61%, n=11), dairy (61%, n=11) and breads and cereals (56%, n=10). No child met the recommended serves of vegetables with vegetable serves ranging from 0 to 1.5 compared with the recommended 2.5 serves/day. Thirty-nine per cent included more discretionary food than recommended with more than two serves in their average daily intake. The most common discretionary foods consumed were ice cream and sweet biscuits.
GI and GL
One hundred and thirty-five foods were able to be assigned a published GI value. A further 109 foods were assigned a GI based on the closest fit according to food type determined by a registered dietitian. The average daily dietary GI was 54±4 (median 54) and the GL was 94±15 (median 89).
Food variety
The total number of unique foods eaten by participants over the 3 days was 161. The mean number of foods per child was 26±7 over the 3 days (range: 15–38). The most commonly eaten foods across the group were apple, banana, strawberries, cheese, full-cream milk, fruit yoghurt, white bread, sweet biscuits and ice cream.
Questionnaire results
Daily meal structure
All children (n=22) reportedly ate at least three main meals every day (breakfast, lunch and dinner) and 81% (n=18) were reported to also eat both morning and afternoon snacks each day. The majority of parents identified a pattern of eating where the parent determined the number of occasions their child was offered food over the day (81%, n=18), 4–5 times per day (n=12) or six times per day (n=6). The remaining 18% (n=4) of children were reported to be offered food in a grazing pattern led by the child: ‘whenever hungry’. The food diaries of the children showed that those offered food 4–5 times per day included three larger main meals and 1–2 snacks and those offered food six times per day had three larger main meals and three smaller snacks. Those eating whenever hungry ate in a grazing pattern with less difference in meal size between the main and snack meals. Snack food tended to be of poor nutritional quality (crisps and cookies) and high in saturated fat.
Insulin routine
Ninety-five per cent of children (n=21) were reportedly usually given their insulin directly before (n=18) or 15 min before the meal (n=3). Only one child was usually given insulin during the meal. No children were reportedly given insulin after the meal. However, when trying new foods, the timing of insulin dosing changed for some children. The majority 77% (n=17) were still given insulin 15 min prior to or immediately before the meal, but one child was given insulin during the meal, and the remaining 18% (n=4) of children were given insulin after the meal. The HbA1c of the four children given insulin after the meal when trying new foods was not significantly different to the children who always gave insulin preprandially (mean 50 mmol/mol vs 46 mmol/mol (6.7% vs 6.4%), p=0.13). However, the frequency of trying new foods was not collected.
Twenty-seven per cent (n=6) of children frequently requested additional CHO-containing foods at mealtimes (‘always’ or ‘most of the time’) with a further 36% (n=8) reporting this ‘sometimes’. The remaining 36% (n=8) reported this occurred rarely or never. Fifty per cent (n=11) of parents reported giving additional insulin for additional CHO at dinner (‘always’: n=10, ‘sometimes’: n=1) and 45% (n=10) reported they did not. One parent did not answer the question. All children using IPT were given additional insulin if having additional carbohydrate at meals (100%, n=9) but only 15% (n=2) of those using MDI. Of those on MDI who did not give additional insulin, 70% (n=7) reported not allowing additional food or only allowing food that had a minimal CHO content.
Mealtime behavior
All parents reported ‘always’ or ‘sometimes’ eating meals together with their child. Allowed mealtime duration varied, with the majority (72%, n=16) reporting between 15min and 30 min, but others allowing longer (up to 90 min) with two reporting no limit on meal duration.
Food refusal was reported to occur ‘sometimes’ in 59% (n=13) and ‘most of the time’ in 14% (n=3). Half (52%, n=11) of parents reported ‘sometimes’ feeding their child (ie, loading the fork/spoon or directly feeding the child), while the remainder (n=10) ‘never’ used these techniques. There was no significant difference in age range between those children physically fed and those who were not (2.7–6.5 vs 2.5–6.3 years).
Carbohydrate substitution
Half (50%) of the parents substituted CHO-containing foods when children failed to consume between 6 g and 10 g of expected CHO intake of meal. Other responses ranged from 1 to 5 g to >15 g. Bread, milk, yoghurt and juice were most commonly used as substitute foods.
Associations of nutritional intake and mealtime structure with HbA1c
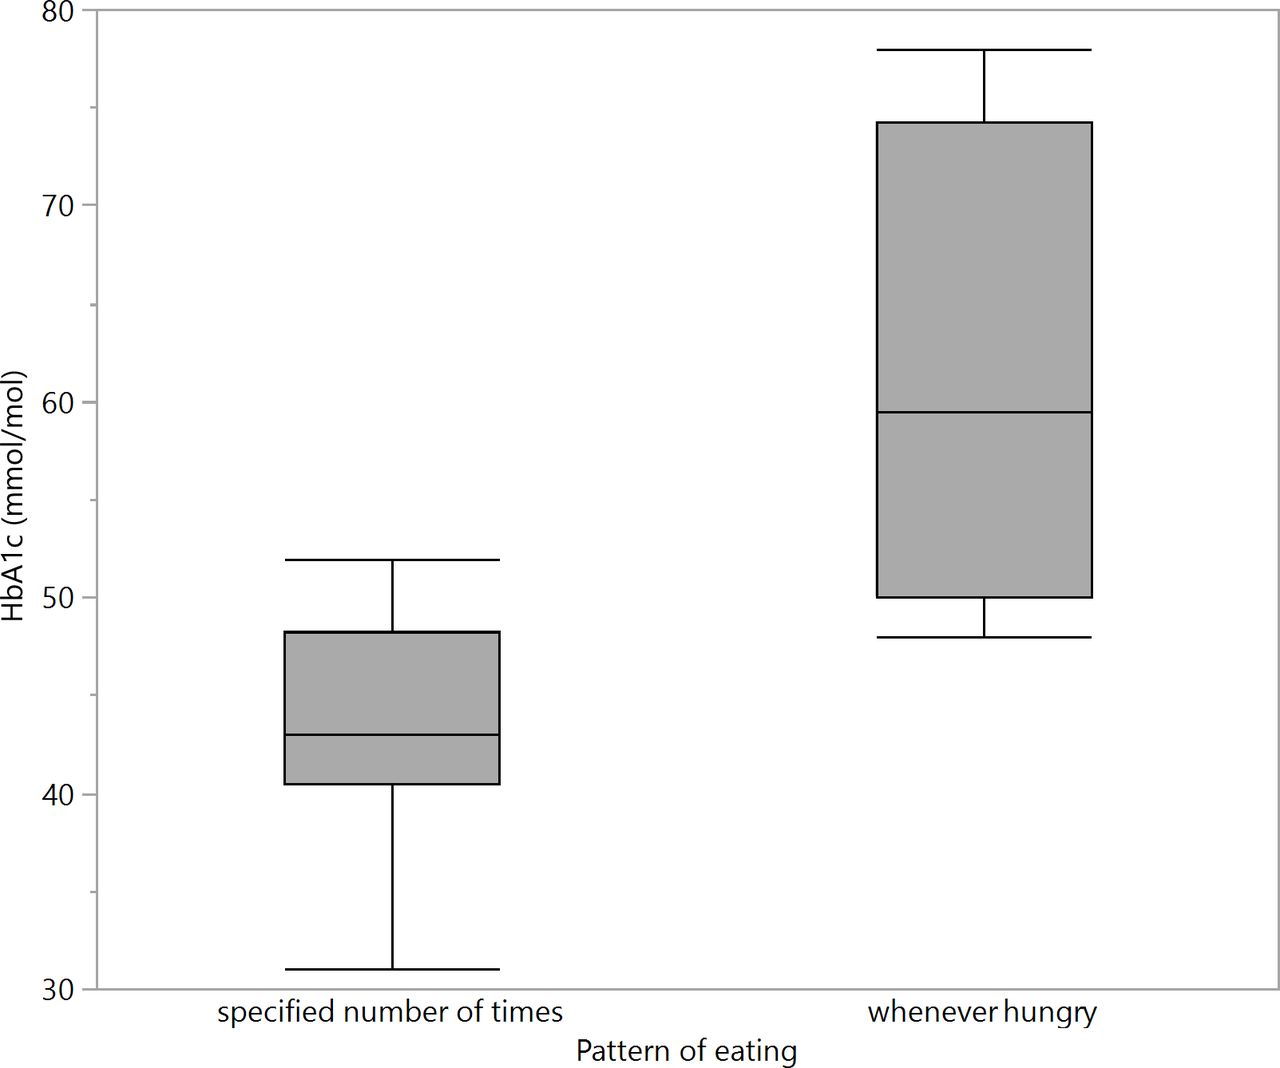
The total daily CHO (g) consumed was not correlated with HbA1c (r=−0.01, p=0.95). Similarly %E CHO was not correlated with HbA1c (r=−0.18, p=0.47) (see figure 1). No significant correlation was found between HbA1c and the other macronutrients (%E protein (r=0.05, p=0.84), %E Fat (r=0.14, p=0.50) and %E saturated Fat (r=0.23, p=0.35)), GI (r=0.0, p=1.00), GL (r=0.0, p=0.93) or food variety (r=0.24, p=0.34). Those with a grazing eating pattern (offered food whenever hungry) had a significantly higher HbA1c than those offered food a routine number of times per day (mean HbA1c 61 v 43 mmol/mol, p=0.01) (see figure 2).

Scatter plot of HbA1c by percentage daily energy of carbohydrate.
Comparison of HbA1c by pattern of eating.
Discussion
To the authors’ knowledge, this is the first study to examine dietary intake and eating patterns in a sample of young children with T1D with mean HbA1c that meets international guidelines. Our results provide the first suggestion that structured meal pattern routines coupled with preprandial dosing in very young children with T1D is associated with meeting glycemic targets. However, dietary quality remains a concern as excessive saturated fat and inadequate serves of vegetables were reported. The carbohydrate, protein, fat, saturated fat content and GI were similar to general population data of a similar age group16 suggesting that children are eating diets similar to their peers without diabetes.
Our findings regarding poor dietary quality in young children with T1D support those of previous studies.7 9 17 These report saturated fat intakes above recommendations and inadequate serves of fruit and vegetables.7 9 This is concerning as children and adolescents with T1D have a greater risk of overweight or obesity, dyslipidemia, atherosclerosis and cardiovascular disease.7 8 10 18–21 Specific strategies and interventions to promote dietary quality and particularly vegetable intake in children are required. Repeated exposure to a new food such as vegetables can be helpful in overcoming neophobia.22 However, effective interventions to increase vegetable intake in this age group are lacking with a recent Cochrane Review finding only low-quality evidence supporting either child feeding practice intervention or multicomponent interventions with very small increases in vegetable intake.23 Furthermore, a pilot parent-based educational intervention targeting mealtime behaviors among nine families of young children with T1D improved mean daily blood glucose levels, although dietary quality remained unchanged.24 Recently, authoritative parenting style at mealtimes has been associated with increased dietary quality25 and may be advantageous for glycemic control.26 This may be a strategy to consider in this population.
The findings of this study suggest routine around eating pattern may be an important consideration in intensive diabetes management in young children with T1D even with intensive insulin regimens that allow for greater flexibility in food intake. Frequent snacking in older children has been associated with higher HbA1c, with more snacking events worsening glycemic control.27 Furthermore, a routine meal pattern in children and young people using intensive therapy has been associated with lower blood glucose levels.28 The importance of a routine eating pattern in children is also supported by another study29 that found that parental monitoring of food intake was associated with less unhealthy snacking, more fruit and vegetable intake and reduced negative eating behaviors such as food refusal. Therefore, a routine eating pattern may also assist with improving dietary quality, and this should be explored in future studies.
Pump therapy is recommended in preschool-aged children2 and may be chosen to give greater flexibility in meal choices. This flexibility is reflected in this study’s results showing that those children with IPT were more likely to be allowed additional CHO containing food when requested at meal times. However, it is important that meal boluses are not missed as this can lead to significant deterioration in glycemic control.30
The majority of children in this cohort routinely give insulin before meals, which has been shown to be an important factor in minimizing postmeal glycemic excursions.31 In addition to a study that previously demonstrated a decrease in HbA1c by the administration of preprandial versus postprandial insulin,32 a recent study using T1D Exchange Clinic registry data reported a association between preprandial insulin dosing and lower HbA1c.33 However, as opposed to our small sample where 95% gave insulin before meals, only 61% of 419 parents/carers surveyed in the T1D Exchange gave insulin before the meal, suggesting that this may be an area of concern for health providers and parents alike. Of concern in our population, when new foods were tried, 17% (n=4) changed usual practice and gave insulin during or after the meal. As the early years are an important time of trialing new foods and neophobia is common, it is important diabetes teams work with families to increase confidence with preprandial insulin administration and how this can be achieved safely in young children.
There are a number of limitations to this study. It was a retrospective cross-sectional study performed in a single center. The sample size of this study is very small, and it is a homogeneous demographic that limits the generalizability of the results. However, there are few studies in young children with T1D in this age group examining nutritional intakes, and these are also of a small sample size.7 9 17 Sundberg et al7 included a cohort of 24 children aged <7 years old with T1D, Patton et al17 reported on a cohort of 19 children aged 2–6 years with T1D and Patton et al9 investigated a cohort of 39 children <7 years of age with T1D on intensive diabetes therapy; however, the mean HbA1c in each of these studies was above international targets and higher than the present study. A potential limitation was that we were unable to report the total insulin dose/day as it varied daily depending on the child’s intake. It is possible that dietary diaries may have resulted in under-reporting of food intake; however, a weighed food diary has been shown to offer advantages over other types of food intake assessment including dietary recall, dietary intake and food frequency questionnaires.34 A further limitation of the study is that the food and insulin routine questionnaire was not a validated questionnaire. Alternative ways to observe family meal-time behaviors have been used in a study of young children with T1D using video taping of home meals.6 This can provide insights into effective behavioral interventions to assist challenges faced by parents of young children with T1D. Finally, Schofield equation, similar to all equations used to estimate energy requirement, has limitations and can potentially overestimate the energy requirement.13 35 This may be why the children in this study reportedly consumed on average 86% of estimated energy requirement yet had good growth.
Our study has a number of strengths. There is consistency of these findings with the published literature regarding dietary quality in young children with T1D with demonstration of new associations with eating pattern and HbA1c. The study also reports that the majority of parents administered insulin preprandially despite the young age of the children. These findings may serve as pilot data to inform larger studies to further evaluate these observations to optimize glycemic outcomes. Additionally, our results suggest that restrictive diets are not required to meet glycemic targets in children using intensive diabetes management. Further investigation into the associations described here in a larger and more diverse sample of young children with T1D is warranted to test these findings.
Conclusions
The current study highlights the challenges families with young children with T1D face in meeting dietary recommendations for vegetables and saturated fat even when receiving specialist dietician support. Specific strategies are needed to encourage healthy eating in this age group as food preferences likely impact future eating habits. This study suggests that young children with T1D can use preprandial insulin that may assist in meeting postprandial glycemic targets and improving overall HbA1c. In this group, a routine eating pattern also appeared important in diabetes management, with grazing associated with higher HbA1c. However, further exploration of meal patterns and the association with glycemic control in a larger sample is necessary.
Acknowledgments
We would like to thank the children and parents of the clinic and the members of the clinical pediatric diabetes team at John Hunter Children's Hospital who provided and recorded the data used in this study from the clinical records.
References
Footnotes
Contributors CS and BRK designed the study. AS and CS designed the clinical questionnaire. RS, AS, KB and CS collated data. RS and PH performed statistical data analyses. RS, PH, BRK, KB and CS contributed to drafting the manuscript. All authors reviewed and edited the manuscript to produce the final version.
Funding The authors have not declared a specific grant for this research from any funding agency in the public, commercial or not-for-profit sectors.
Competing interests None declared.
Patient consent for publication Not required.
Ethics approval Approval for this study was given by Hunter New England Research Ethics Committee (Reference number: AU201802-8).
Provenance and peer review Not commissioned; externally peer reviewed.
Data availability statement All data relevant to the study are included in the article or uploaded as supplementary information.