Article Text

Abstract
Objective To examine how the population with fractured neck of femur has changed over the last decade and determine whether they have evolved to become a more physically and socially dependent cohort.
Design Retrospective cohort study of prospectively collected Standardised Audit of Hip Fractures of Europe data entered on to an institutional hip fracture registry.
Participants 10 044 consecutive hip fracture admissions (2000–2012).
Setting A major trauma centre in the UK.
Results There was a generalised increase in the number of admissions between 2000 (n=740) and 2012 (n=810). This increase was non-linear and best described by a quadratic curve. Assuming no change in the prevalence of hip fracture over the next 20 years, our hospital is projected to treat 871 cases in 2020 and 925 in 2030. This represents an approximate year-on-year increase of just over 1%. There was an increase in the proportion of male admissions over the study period (2000: 174 of 740 admissions (23.5%); 2012: 249 of 810 admissions (30.7%)). This mirrored national census changes within the geographical area during the same period. During the study period there were significant increases in the numbers of patients admitted from their own home, the proportion of patients requiring assistance to mobilise, and the proportion of patients requiring help with basic activities of daily living (all p<0.001). There was also a twofold to fourfold increase in the proportion of patients admitted with a diagnosis of cardiovascular disease, renal disease, diabetes and polypharmacy (use of >4 prescribed medications; all p<0.001).
Conclusions The expanding hip fracture population has increasingly complex medical, social and rehabilitation care needs. This needs to be recognised so that appropriate healthcare strategies and service planning can be implemented. This epidemiological analysis allows projections of future service need in terms of patient numbers and dependency.
This is an Open Access article distributed in accordance with the Creative Commons Attribution Non Commercial (CC BY-NC 4.0) license, which permits others to distribute, remix, adapt, build upon this work non-commercially, and license their derivative works on different terms, provided the original work is properly cited and the use is non-commercial. See: http://creativecommons.org/licenses/by-nc/4.0/
Statistics from Altmetric.com
Strengths and limitations of this study
-
This analysis is based on 10 044 consecutive hip fracture admissions over a 13-year period from a defined geographical area using standardised data collection.
-
Trends in the hip fracture population including information on patient demographics, medical comorbidities, physical functioning, social circumstances and cognitive capacity during this period are presented.
-
On the basis of these data we have been able to produce a simplified equation that allows individual centres to calculate their own expected increases in hip fracture admissions over the next 20 years.
-
This is a retrospective analysis and there may be issues relating to coding inaccuracies and recorder bias.
-
Any projections to a national population of hip fractures from a single centre, single population study may be liable to regional discrepancies and may not be applicable to other hospital populations where incidence of, for example, other comorbidities may be significantly different.
Introduction
The UK currently treats approximately 80 000 hip fractures every year at an estimated annual cost of two billion pounds in direct healthcare costs alone.1–3 One in every 12 patients who sustains a hip fracture will die in the first month following injury and three in every 10 will die within the first year.3 The WHO has estimated that the number of people aged 65 and over will increase by 88% over the next 25 years due to an aging world population, better public health and an increased use of medical interventions that prolong the average life expectancy.4 Despite a decline in the age-specific incidence of hip fractures over the last decade5–7 these population changes mean the overall number of hip fractures will continue to increase.5 ,6 The annual number of hip fractures in the UK is projected to rise to 91 500 by 2015 and 101 000 by 2020.6
The projected rise in hip fracture incidence has implications for health strategy and resource allocation. These must be addressed if we are to continue to manage the specific needs of these patients and improve the standard of care. Previous studies have evaluated how hip fracture incidence has changed with time,5–7 the relationships to changing population demographics5 and the impact on projected future healthcare requirements.8–10 Few, if any, studies have evaluated how physical dependency, medical comorbidities, social needs and care requirements have changed within this population with time. This is important to appreciate as these factors will also have a significant impact on the requirements for future medical, nursing, rehabilitation and social services.
To address these concerns we interrogated an institutional hip fracture database with the aim of answering the following research question: ‘How has the population of patients admitted to hospital with a fractured neck of femur changed over the last decade and have they evolved to become a more physically and socially dependent cohort?’. Our null hypothesis was that the population with fractured neck of femur would not have changed with time for any of the markers of physical and social dependency examined during this analysis.
Patients and methods
The Nottingham Hip Fracture Database
Nottingham University Hospitals cover a catchment population of approximately 785 000 and admit approximately 800 hip fractures each year. For the entire study period, it has been the only hospital providing a trauma service for the local population and its surrounding areas. In May 1999, the Nottingham Hip Fracture Database was initiated to prospectively collect information on all patients with hip fracture for the purpose of an ongoing audit and service evaluation. Data for all patients with hip fracture are recorded using a modified version of the Standardised Audit of Hip Fractures of Europe (SAHFE) data collection form.4 All data are collected prospectively by a team of independent audit staff who administer the local hip fracture database. SAHFE data completion is mandatory for all hip fractures in our hospital and in 2012 the trust recorded over 93% in the domain of data completeness within the National Hip Fracture Database (NHFD).11 Audit data are strictly confidential and are managed in accordance with national data protection (Caldicott) guidelines.
Study design and dataset
To address our research question a retrospective cohort study was conducted using all of the information held within the hip fracture database from its inception (May 1999) to the date of the current project data request (March 2013). In total 10 739 consecutive hip fracture admissions were identified. From this cohort we excluded the cases from 1999 (n=446) and 2013 (n=249) as a complete years’ worth of admission data were not available. Analysis was therefore based on a consecutive series of 10 044 hip fractures admitted during a 13-year period between the 1 January 2000 and 31 December 2012. The baseline demographics for study cohort are given in table 1.
Baseline data for the study cohort
Outcome variables
The Nottingham Hip Fracture Database records information on patient demographics, medical comorbidities, physical functioning, social circumstances and cognitive capacity for each patient with hip fracture. The database records information pertaining to specific comorbidities, including questions about the presence of a diagnosis of cardiovascular disease (CVD), cerebrovascular disease, chronic obstructive pulmonary disease, renal disease, diabetes mellitus (DM), rheumatoid arthritis, Parkinson's disease and malignancy. During the study period there was no change in the definitions used by the database for each of these conditions. Information about medication use is also recorded, with specific questions about the use of steroids, anticoagulants (eg, clopidogrel and warfarin) and polypharmacy (the use of >4 regular medications; table 1).
Physical functioning is assessed using specific questions related to mobility status, independence within and outside the house and ability to perform activities of daily living (ADLs) such as washing, dressing, cleaning, feeding and toileting. Social circumstances are assessed by questions relating to the type of residence, cohabitation and the requirement for additional carers. The abbreviated mental test score is used to assess cognitive capacity.12
To ascertain how the hip fracture population had changed with time, the distribution of each of these outcome variables was calculated for each year of the analysis (2000–2012). This allowed observed changes and trends in the distributional characteristics of these variables with time to be appreciated.
Statistical analysis
Initial graphical and tabular summaries were performed to demonstrate how the hip fracture population changed over the period of analysis. Comparison with publically available Nottingham census data (2001 and 2011) was conducted to see if the observed changes in the hip fracture population mirrored those seen for the general population.
Statistical comparisons were performed to determine if each of the analysed variables changed over the period of observation. For continuous parametric data comparisons were made using independent t tests and one-way analysis of variance. For continuous non-parametric data comparisons were made using Mann-Whitney and Kruskal-Wallis tests. For categorical data Fishers exact and χ2 tests were used. A p value of p<0.05 was used to indicate statistical significance.
Time series analysis was used to produce a mathematical model for the year-on-year changes in the observed number of hip fracture admissions. Linear, quadratic, exponential and S-Curve models were sequentially fitted to the data and for each model its adequacy was assessed using the mean absolute percentage error, mean absolute deviation and the mean squared deviation. The ‘best fit’ quadratic time series model was selected as it was the model type that minimised each of these variables. This model was then used to generate forecasts of the expected number of admissions in 2020, 2025 and 2030. Statistical analysis was performed using SPSS V.19 (IBM Corporation, Armonk, USA) and the time series analysis was undertaken using Minitab V.16 (Minitab Ltd, Coventry, UK).
Results
Hip fracture admissions
During the period 2000–2012 a total of 10 044 patients were admitted with a hip fracture. The mean number of admissions per year was 773 (SD 44.9, range 704–854) with a generalised increase in the number of hip fracture admissions each year. This increase was non-linear and best described by the quadratic curve: admissions=715.59+(8.72×number of years after 1999)−(0.06×(number of years after 1999)2), (ie, year 2000 = 1; figure 1). Assuming no change in the prevalence of hip fracture over the next 20 years, our hospital is projected to treat 871 cases in 2020, 899 in 2025 and 925 in 2030. A simple equation to allow hip fracture units to estimate their future hip fracture numbers (assuming similar demographics to Nottingham) is shown in figure 1.

Number of hip fracture admissions 2000–2012 with ‘best fit’ time series model (red line: admissions=715.59+(8.72×number of years after 1999)−(0.06×(number of years after 1999)2), ie, year 2000=1). Green line represents the forecasted number of admissions based on this model beyond 2030. Hip fracture admissions can be approximated in any hospital using a simplified equation based on this model: predicted admissions in year X=admissions in specified unit in 2012+(0.01×admissions in specified unit in 2012×(X−2012))−(0.0001×admissions in specified unit in 2012×(X−2012)2).
Patient demographics
Baseline demographics for the entire study cohort are presented in table 1.
Age at admission did not significantly change during the period of study (p=0.67). However the median age of women (83 years (IQR 77–88, range 19–105 years)) was significantly higher than that for men (80 years (IQR 70–86, range 17–105 years; p<0.001)). While they differed, the age distributions of male and female patients did not significantly change with time (comparison across all years: female p=0.70, male p=0.11). During the period of study there was a steady and significant increase in the proportion of male admissions from 174 of 740 (24%) in 2000 to 249 of 810 (31%) in 2012 (p<0.001; table 2).
Changes in patient and social demographics between 2000 and 2012 (results for 2000, 2004, 2008 and 2012 shown for clarity)
Comorbidities
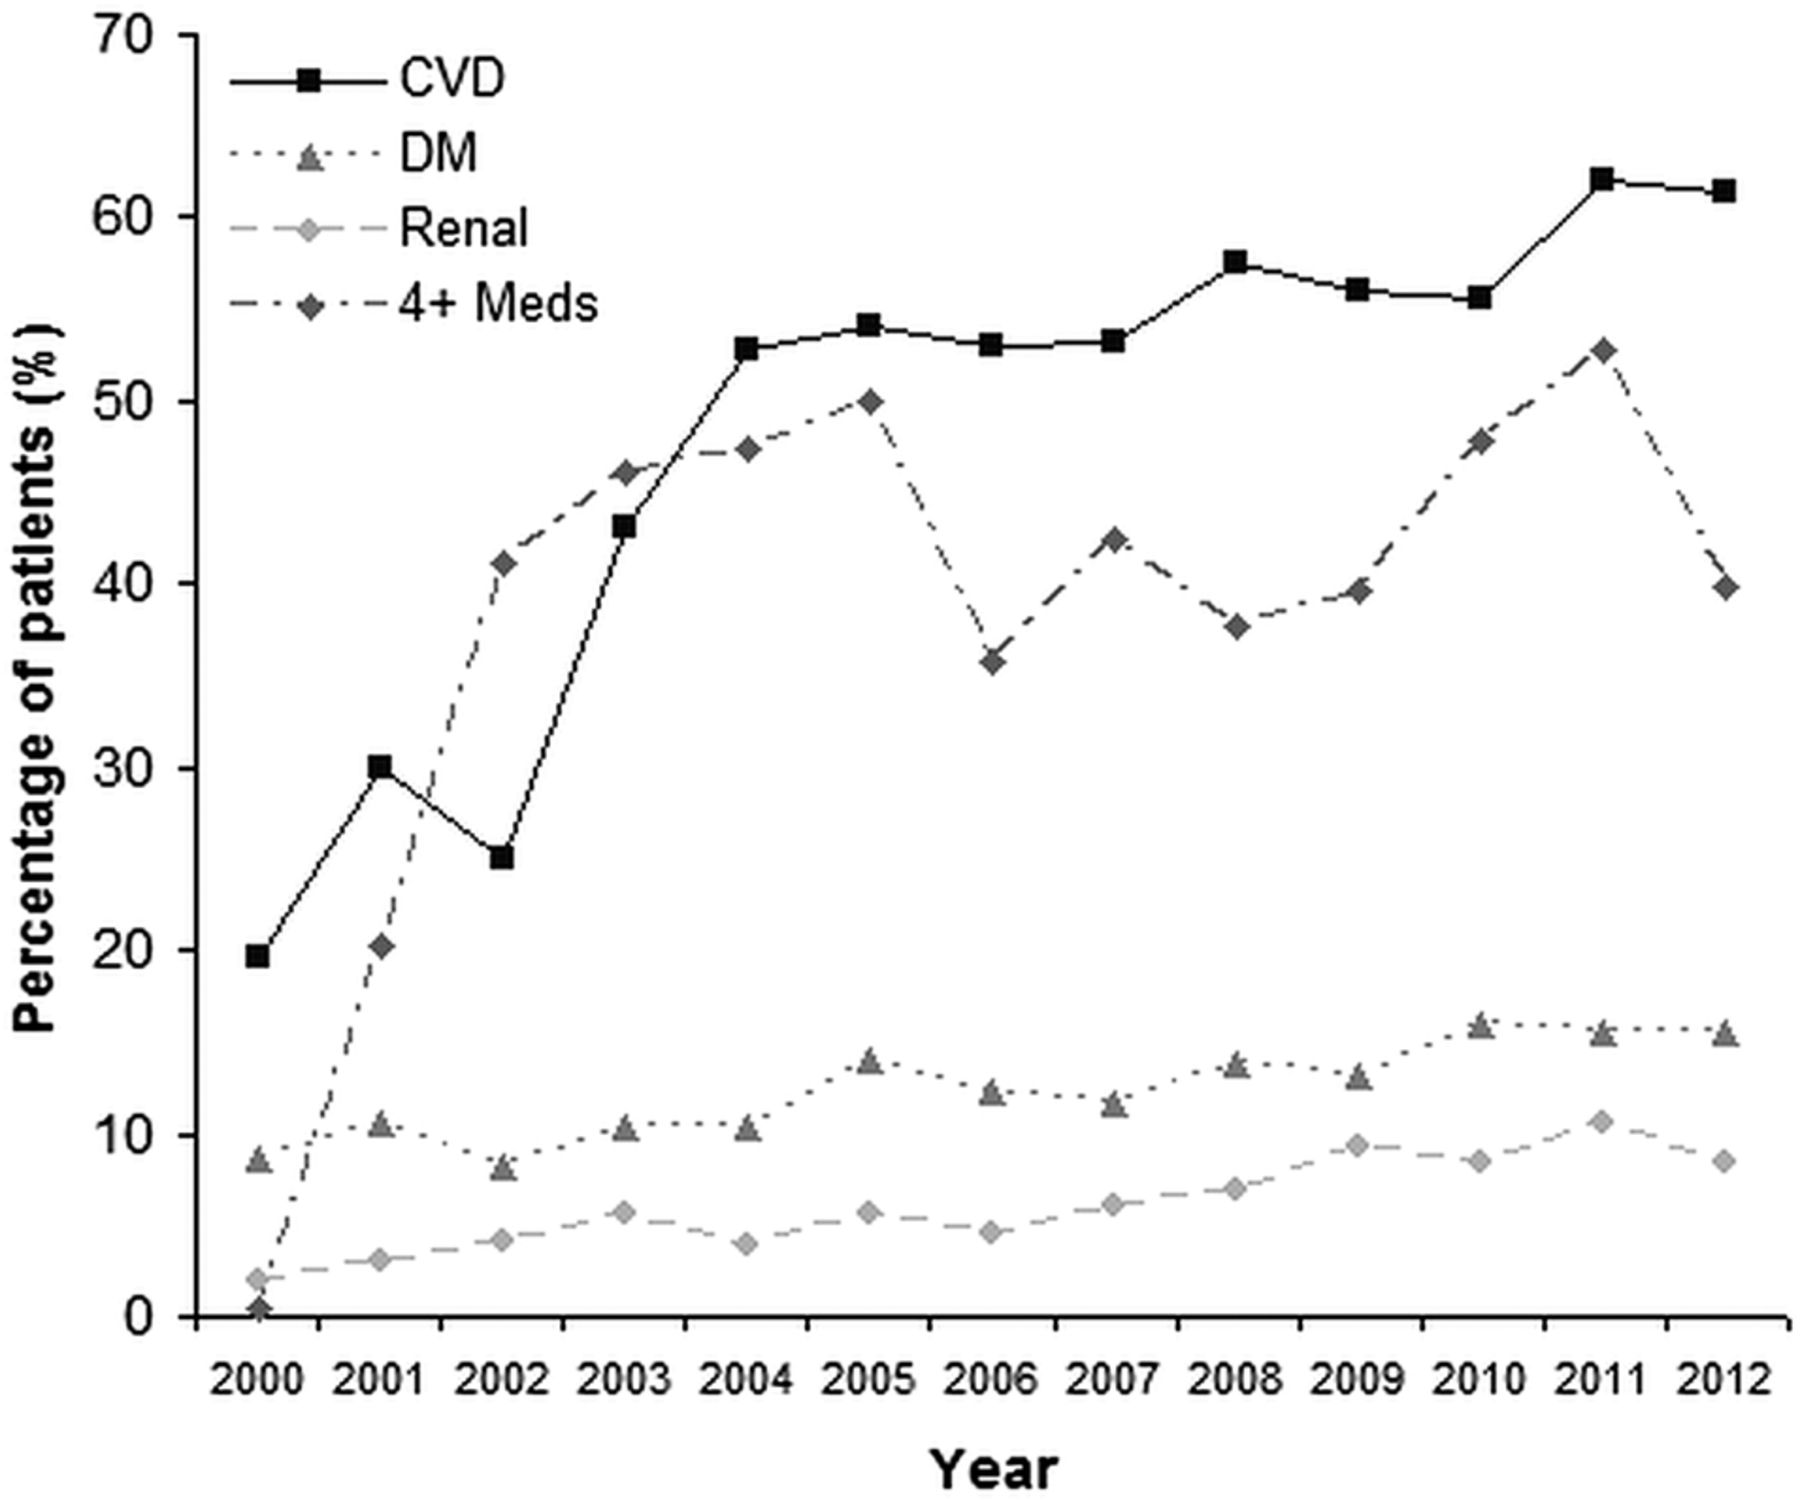
Of the comorbidities recorded there was a significant increase in the proportion of patients presenting with CVD, DM, renal disease and polypharmacy (patients on greater than 4 prescribed medications) with time (figure 2). In 2000, the percentage of patients with CVD was 20% (145 of 740 admissions), which increased by a factor of 3.1 to 61% in 2012 (497 of 810 admissions; p<0.001). Similarly the percentage of patients with DM increased by a factor of 1.8 from 9% (64 of 740 admissions) in 2000 to 15% (125 of 810 admissions) in 2012 (p<0.001). The presence of renal disease increased from 2% (15 of 740 admissions) in 2000 to 9% (69 of 840 admissions) in 2012, a greater than fourfold increase (p<0.001). The proportion of patients with polypharmacy also increased by a factor of two between 2000 (20%, 142 of 740 admissions) and 2012 (40%, 322 of 810 admissions; p<0.001). For all other recorded comorbidities the proportions of admissions with a positive diagnosis remained similar throughout the period of observation.

Trends in the proportion of patients admitted with cardiovascular disease (CVD), diabetes mellitus (DM), renal disease (renal) and polypharmacy (4+ meds) between 2000 and 2012.
The median abbreviated mental test score for patients was 9 (IQR 3–10, range 0–10) and did not change significantly year to year (p=0.51). The number of patients prescribed either clopidogrel or warfarin demonstrated significant variation from year to year and followed a steadily increasing trend between 2000 and 2012 (both p<0.001; figure 3).

Number of admissions that were prescribed either clopidogrel (C) or warfarin (W). Percentages represent the proportion of admissions that were taking either of these agents in each year.
Social demographics
Baseline social demographic data are presented in table 1. Between 2000 and 2012 there was a gradual increase in the number of admissions of patients living in their own homes (p<0.001). Over the same time period there was a reciprocal decrease in admissions from warden-aided/residential care and nursing care (p<0.001; figure 3). Of the 6742 patients living in their own homes 3278 (49%) lived alone. The proportion of patients living alone in their own homes remained similar over the period of observation (table 2).
At the time of admission 5027 of the 10 044 (50%) admissions mobilised independently outdoors (table 1). Of these 5027 patients 3119 (62%) did not use any mobility aids, 1520 (30%) used one aid and 388 (8%) used two aids/frame/walker. The reliance on walking aids increased as the level of mobility decreased (p<0.001). The proportion of patients mobilising independently outdoors at the time of admission increased significantly between 2000 and 2012. During the same period there was a reciprocal decrease in the proportion of patients mobilising independently indoors (p<0.001; table 2).
The proportions of patients who were completely independent for all ADLs were similar across the study period (table 2). Overall 4011 of 10 044 (40%) patients were completely independent for all ADLs. For the 6033 patients who were not independent for their ADLs, 2586 (43%) required assistance with some form of basic care (washing, dressing, feeding, toileting; figure 4). The proportion of patients requiring this level of care increased from 161 of 455 patients requiring assistance with ADLs (36%) in 2000 to 220 of 460 patients requiring assistance with ADLs (48%) in 2012 (p<0.001).

Patients requiring assistance with basic care (washing, dressing, feeding and toileting) as a proportion of all patients requiring assistance with their activities of daily living (n=6033).
Fracture demographics
The distributions of the type of fractures presenting to the unit by year are shown in figure 5 and given in table 1. The distribution of intracapsular and extracapsular (intertrochanteric/subtrochanteric/other proximal femoral fractures) remained consistent over the period of study with approximately 60% of hip fractures/year being intracapsular.

Distribution in the pattern of presenting fracture by year (2000–2012).
Discussion
Principle findings and comparison with other studies
The last decade has seen an increase in the number of hip fractures admitted to our institution. The number of admissions is expected to increase further over the next 20 years with a forecasted 15% rise in admissions by 2030. However, while the number of admissions is increasing, the quadratic time series curve produced suggested that, the size of the annual increase is reducing year on year. Using our data we have produced a simplified forecasting model which was ±1% accurate when compared to the predicted results from the time series curve. This equation can be used by centres wanting to calculate their expected short-term to mid-term hip fracture service requirements.
The predicted rise in the number of hip fractures mirrors the trends predicted for England5 and Scotland.6 However, the size of the increase is smaller than the 45–75% rise in numbers predicted by the Scottish group6 and significantly lower than the ‘pessimistic’ estimate of a doubling in the number of hip fractures by 2033 reported for England by White and Griffiths.5 Hip fracture admissions are expected to continue to rise despite a global decrease in the age-related incidence of these fractures during the last decade.5 ,7 This is because the population continues to age due to the success of public health strategies and the advent of medical interventions, that prolong the average life expectancy, during the second half of the 20th century.4 ,13 In 2011 approximately 1 in 5 (22.6%) of the population of England and Wales was aged over 60 and the total number of residents aged over 90 was 430 000, up from 340 000 in 2001.14 Between 2001 and 2011 the population of Nottinghamshire increased by 37 500 (5%) from 748 300 (2001) to 785 800 (2011) with an associated 3% increase in the proportion of the population aged over 60 (21.1% in 2001, 24.1% in 2011).15 ,16 This may explain the observed 10% increase in the number of hip fracture admissions to our unit over the same time period and the relatively conservative estimate for the number of future admissions. Geographical areas with greater increases in the proportion of their population over 60 are likely to experience greater increases in hip fracture admissions in future years. Our equation for predicting future clinical need must therefore be interpreted in the context of each individual centre’s geographical population and will be most accurate for centres that service patient populations similar to our own.
The median age of our cohort did not change with time, however, the proportion of male admissions increased. This contrasts with the review by Haleem et al13 which found a trend towards an increasing mean age and a static female:male ratio in the 36 publications they reviewed pertaining to hip fractures between 1959 and 1998. Similarly the 2013 NHFD report demonstrates an increase in the proportion of hip fractures in the very elderly (>90 years) with a static female:male ratio between 2009 and 2013.11 Census data for Nottingham suggest that between 2001 and 2011 there was a large increase in the number of male patients aged 75–89 years living within the hospital’s catchment area15 ,16 helping to explain these differing findings and the increasing number of male admissions observed within our cohort.
Between 2000 and 2012 we observed a number of significant changes in the hip fracture population. At the end of the period a greater number of patients were living alone in their own homes, requiring assistance with basic ADLs, and presenting with significant medical comorbidities. This increase in the levels of physical and social dependence has implications for the delivery of the hip fracture service. As a result of these changes we can expect to see increases in the rates of postoperative mortality, morbidity and length of hospital stay.5 ,6 White and Griffiths5 predicted that, as the population ages, 30-day mortality rates will rise from 8.3% in 2008 to 9.3% by 2033, resulting in 7000 additional deaths each year. This effect is likely to be compounded by the increasing frailty observed in this study, and if these trends continue this estimate may need to be revised upward. These changes also suggest that we are supporting a population of patients who are increasingly frail and have significant social care needs within their own homes. This has implications for acute nursing care, postoperative rehabilitation and eventual discharge planning. Patients are less likely to achieve the requisite level of physical functioning to permit discharge home if they have poor functional reserve to begin with. They are also less likely to get home if they are socially isolated and require increased levels of social care. There are also implications for benchmarking and audit systems, such as the NHFD and the Nottingham Hip Fracture Score that use living at home versus living in an institution as a surrogate for frailty.17 ,18 Our data suggest that this distinction may be becoming less clear-cut. Such scores may therefore need recalibration in future years.
Changes in the prevalence of specific comorbidities may be a direct manifestation of an increasingly frail elderly population with declining health. Some of this effect may be attributable to greater data accuracy as the hip fracture database matured and administrators became more familiar with the datasets. However, this is unlikely to account for the magnitude of the observed changes in each of the comorbidities. The changing prevalence may also have been influenced by the introduction of national guidelines and health policies that aim to promote evidence-based practice and incentivise the treatment of a range of chronic conditions in primary care during the period of study. Initiatives such as the Quality and Outcome Frameworks19 have been introduced to reward primary care practices if they deliver high quality on a range of services.20 Areas of clinical care linked to rewards include the implementation of clinical interventions known to benefit patients with chronic conditions such as CVD, diabetes and chronic renal disease.21 ,22 The initiation of such strategies in 2003/2004 may, in part, account for the sudden jump in proportion of patients we observed with these comorbidities. In addition, during the study period, the National Institute for Clinical Excellence23–28 and the National Service Framework29 have published a range of guidance which may have increased diagnostic awareness for these conditions.
Strengths and limitations
This study benefits from the size of the cohort available for analysis, the consecutive period of follow-up, consistent data collection and the range of data collected. The hospital serves a well-defined urban/rural population with no alternative hip fracture service within this geographical area. During the study period the trauma service at Nottingham was awarded major trauma centre status. This is, however, unlikely to have had a significant impact on the number of hip fracture admissions and our future hip fracture projections as referrals to a major trauma centre are triggered primarily based on mechanism of injury. As the majority of hip fractures occur after low-energy injuries such as fall from standing height, they should not trigger the major trauma pathway and should be taken to their nearest orthopaedic unit as previously. While the unit's current data completeness rate of 93% is good and much better than Hospital Episode Statistics, it could be better. The introduction of the National Institute for Health and Care Excellence (NICE) guidance and best practice tariff may have raised awareness in reporting of facets of patient care giving more accurate and complete data in the later years. Inaccuracies in coding and recorder intervariability are potential sources of error which may account for some of the year-on-year differences observed. Any projections to a national population of hip fractures from a single centre, single population study may be liable to regional discrepancies and may not be applicable to other hospital populations where incidence of, for example, other comorbidities may be significantly different. In addition our projections for future admissions are based on static hip fracture incidence whereas current hip fracture incidence is declining at approximately 0.6% per year.5 While we accept this may result in the number of hip fracture admissions being overestimated it was carried out to simplify the analysis, and the ability of other centres to use the proposed equations. In addition, it is unclear whether this decrease in prevalence will continue at the same rate over the next 20 years, or it will decrease further or increase at some undefined point so that the prevalence starts to rise. However, despite these concerns we feel that the overall trends reported here are likely to be generalisable to national practice. While the NHFD publishes yearly reports on management of the hip fracture population it has only been reporting national results since 2009.11 Despite comprising over 250 000 records its report contains limited information on dependency and does not present data on comorbidities.3 ,11 The information presented here therefore adds significantly to the results available from this database. Further useful information is likely to come from the recently undertaken hip fracture Anaesthesia Sprint Audit Project (ASAP).30 This audit of 11 000 hip fracture cases will complement the information presented here by allowing us to better understand the absolute numbers and the variation in prevalence of a range of comorbidities, and the differing ways in which these comorbidities are treated.
Conclusion
The cost of treating hip fractures is rising.1 ,5 Currently the annual cost of treating these injuries is approximately £2 billion/year which helps to deliver a high-quality service based on NICE's recommendations of surgery performed on dedicated trauma lists within 36 h of admission, adequate physiotherapy and occupational therapy provision allowing early mobilisation and rehabilitation, and ongoing orthogeriatric assessment and support. However, the projected increase in the number of hip fractures, combined with more frail, elderly and socially dependent patients who are likely to experience greater rates of mortality, postoperative morbidity and longer inpatient stays will drive this figure up over the next 20 years. Cost estimates for hip fracture treatment predict a 243% increase in costs to £5.6 billion by 2033.5 Worryingly we have shown that more and more patients have complex medical comorbidities and social needs and so it is likely that the cost of treating these patients is likely to climb at a faster rate than these projections based on changes in the age demographics alone. This must be appreciated to so that appropriate healthcare strategies and service planning can be implemented to prevent the hip fracture service enduring a financial shortfall, particularly at a time when there is an ever increasing drive to meet best practice targets.
Footnotes
-
Contributors PNB, OS, BJO, DPF, NW, IKM and CGM have made significant contributions to: the conception and design, or analysis and interpretation of these data, drafting the article or revising it critically for important intellectual content, and final approval of the version to be published. The lead author affirms that the manuscript is an honest, accurate and transparent account of the study being reported; that no important aspects of the study have been omitted; and that any discrepancies from the study as planned have been explained.
-
Funding Department of Trauma and Orthopaedics, Queens Medical Centre, Nottingham University Hospitals NHS Trust.
-
Competing interests None.
-
Ethics approval This study was performed on anonymised data held within an ongoing institutional hip fracture audit programme. As there was no further patient contact the project was performed as a service evaluation without need for formal ethical approval. Utilised Nottinghamshire census data is available publicly via the Nottinghamshire city council. Nottingham University Hospitals hip fracture data are also available publicly on request.
-
Provenance and peer review Not commissioned; externally peer reviewed.
-
Data sharing statement This study was conducted on data collected as part of the ongoing audit of hip fracture patients admitted to the Nottingham University Hospitals NHS Trust. All data collected as part of this audit programme are held by the hip fracture audit coordinators in the department of trauma and orthopaedics, Queens Medical Centre, Nottingham. This database is administered by the senior author (CGM). The data used for this study were extracted from this database for the sole purpose of the stated analyses. The corresponding author therefore possesses no additional unpublished data in respect of this study. Data held within the Nottingham Hip Fracture Database and the data used for these analyses were stored and used in accordance with local Caldicott guidelines.