Article Text

Abstract
Objective To examine the relationship between physical frailty and risk of disability, and to identify the component(s) of frailty with the most impact on disability in community-dwelling older adults.
Design Prospective cohort study.
Setting A Japanese community.
Participants 4341 older adults aged ≥65 living in the community participated in a baseline assessment from 2011 to 2012 and were followed for 2 years.
Main outcome measures Care-needs certification in the national long-term care insurance (LTCI) system of Japan, type of physical frailty (robust, prefrail, frail) and subitems (slowness, weakness, exhaustion, low activity, weight loss), adjusted for several potential confounders such as demographic characteristics, analysed with Kaplan-Meier survival curves for incidence of disability by frailty phenotype.
Results During the 2-year follow-up period, 168 participants (3.9%) began using the LTCI system for incidence of disability. Participants classified as frail (HR 4.65, 95% CI 2.63 to 8.22) or prefrail (2.52, 1.56 to 4.07) at the baseline assessment had an increased risk of disability incidence compared with robust participants. Analyses for subitems of frailty showed that slowness (2.32, 1.62 to 3.33), weakness (1.90, 1.35 to 2.68) and weight loss (1.61, 1.13 to 2.31) were related to increased risk of disability incidence. In stratified analyses, participants who were classified as frail and who had lower cognitive function had the highest percentage (30.3%) of disability incidence during the 2 years after baseline assessment.
Conclusions Physical frailty, even being prefrail, had a strong impact on the risk of future disability. Some components of frailty, such as slowness, weakness and weight loss, are strongly associated with incident disability in community-dwelling older adults.
- Frailty
- Disability
- Slowness
This is an Open Access article distributed in accordance with the Creative Commons Attribution Non Commercial (CC BY-NC 4.0) license, which permits others to distribute, remix, adapt, build upon this work non-commercially, and license their derivative works on different terms, provided the original work is properly cited and the use is non-commercial. See: http://creativecommons.org/licenses/by-nc/4.0/
Statistics from Altmetric.com
Strengths and limitations of this study
This study included a large-scale prospective sample of community-dwelling Japanese older adults and the application of a comprehensive measure of physical frailty including questionnaires and physical performance measurements.
Physical frailty, even being prefrail, strongly predicts increased risk of disability in the Japanese older population.
Modified cut-off values for slowness (walking speed <1.0 m/s) and weakness (handgrip strength <26 kg for men and <18 kg for women) are appropriate criteria for physical frailty assessments in the Japanese older population.
Slowness, weakness and weight loss are particularly associated with incident disability.
This study did not determine the causes of the incidence of disability.
Introduction
Since Japan has a rapidly ageing population, assessing frailty earlier in this population could help identify those more at risk for disability earlier to implement a more effective intervention.
Disability is an adverse outcome of frailty.1 Frailty is recognised as a biological syndrome associated with multisystem declines in physiological reserve and increased vulnerability to stressors, resulting in an increased risk of adverse outcomes such as disability, hospitalisation and death.2–4 Although there is a general consensus on the definition of frailty phenotype, which classifies it into robust, prefrail and frail,2 many different ways to assess frailty have been reported.5
The well-known concept of physical frailty model includes slowness, weakness, exhaustion, low activity and weight loss.4 Moreover, these components could have an additive effect on adverse outcomes such as disability.2 ,3 We hypothesised that these components have differential effects on the incidence of disability. Thus, the purpose of this prospective cohort analysis was to evaluate the association between physical frailty phenotype and incidence of disability, and to identify the component(s) of frailty that has the most impact on disability among older adults (≥65 years) in Japan.
Methods
This prospective cohort study sampled 4341 community-dwelling elderly adults (≥65 years) enrolled in the Obu Study of Health Promotion for the Elderly (OSHPE). OSHPE participants were recruited from Obu, a residential suburb of Nagoya, Japan. Inclusion criteria were age of ≥65 years at examination in 2011 or 2012, being a resident of Obu, participation in follow-up assessments, and no previous participation in other studies. Exclusion criteria were the need for support or care certified by the Japanese public long-term care insurance system (LTCI; care level ≥3/5), disability in basic activities of daily living (self-feeding, personal hygiene and grooming, walking, climbing stairs and bathing) and inability to undergo performance-based assessments (eg, severe hypertension, balance impairment or pain). We also excluded participants with a history of Parkinson's disease, stroke, depression, Alzheimer's disease, or those with Mini-Mental State Examination (MMSE) scores <18.6 ,7 Participants who died or who moved to another city during the 2-year follow-up period were also excluded. Between August 2011 and February 2012, 5104 community-dwelling elderly people participated in a baseline OSHPE assessment that included a face-to-face interview and measures of physical and cognitive function.
Participants were then followed monthly and monitored for inclusion into the LTCI system for the next 2 years. The mandatory social LTCI system was implemented in Japan on 1 April 2000.8 ,9 To assess eligibility for these benefits, the LTCI system conducts assessments on incident disability. Informed consent was obtained from all participants prior to their inclusion in the study.
Baseline assessments
Licensed nurses recorded demographic data, including age, sex, number of prescribed medications and medical history in face-to-face interviews. Participants were asked about their history regarding the following diagnoses: stroke, Parkinson's disease, hypertension, heart disease, diabetes mellitus and osteoporosis. We measured participants’ height and weight and calculated their body mass index (BMI). Global cognitive function was assessed using the MMSE,7 with a cut-off point of 23/24.10 Depressive symptoms were measured using the 15-item Geriatric Depression Scale (GDS).11 The cut-off score of ≥6 has a sensitivity of 82% and a specificity of 75% with a structured clinical interview for depression.12
Operationalisation of the physical frailty phenotype
We considered the physical frailty phenotype to be characterised by limitations in three or more of the following five conditions based on those used in Fried et al's2 original studies: slowness, weakness, exhaustion, low activity and weight loss. Participants who had none of these components were considered to be robust; those with one or two components were considered to be prefrail.
A majority of previous prospective cohort studies seem to agree with the use of walking speeds for health predictors in ageing.13 Walking speed was measured in seconds using a stopwatch. Participants were asked to walk on a flat and straight surface at a comfortable walking speed. Two markers were used to indicate the start and end of a 2.4 m walk path, with a 2 m section to be traversed before passing the start marker, such that participants were walking at a comfortable pace by the time they reached the timed path. Participants were asked to continue walking for an additional 2 m past the end of the path to ensure a consistent walking pace while on the timed path. Slowness was established according to a predetermined cut-off (<1.0 m/s).6 Together with slowness, low handgrip strength is considered an important indicator of health outcome such as fractures,14 disability15 and death.16 Weakness was defined using maximum grip strength. Grip strength was measured in kilograms using a Smedley-type handheld dynamometer (GRIP-D; Takei Ltd, Niigata, Japan). In addition, weakness was established according to a sex-specific cut-off (<26 kg for men and <18 kg for women).17 Exhaustion was considered to be present if the participant responded with ‘yes’ to the following questions taken from the Kihon-Checklist, a self-reported comprehensive health checklist developed by the Japanese Ministry of Health, Labour and Welfare18: “In the last two weeks, have you felt tired for no reason?” We evaluated the role of physical activity by asking the following questions about time spent engaged in sports and exercise: (1) “Do you engage in moderate levels of physical exercise or sports aimed at health?” and (2) “Do you engage in low levels of physical exercise aimed at health?” Participants who answered “no” to both of these questions were classified as low activity.6 Weight loss was assessed by a response of “yes” to the question, “Have you lost 2 kg or more in the past six months?”18
Outcomes
Participants were followed monthly for incident certification of need of care according to the LTCI system during the 2 years after the baseline assessment. Japan implemented a mandatory social LTCI system on 1 April 2000.8 ,9 Every Japanese citizen aged 65 and older is eligible for benefits (institutional and community-based services, but not cash) in cases of physical and/or mental disability. The computer-aided standardised needs-assessment system used by the mandatory social LTCI system categorises people into seven levels of needs.9 To determine an individual's level of nursing care need, a trained local government official visits that individual's home and administers a questionnaire on current physical and mental status (73 items in 7 dimensions; eg, paralysis and limitation of joint movement, movement and balance, complex movement, conditions requiring special assistance, activities of daily living/instrumental activities of daily living, communication and cognition, behavioural problems) and use of medical procedures (12 items). The results of this questionnaire are then entered into the computer to calculate the applicant's standardised scores for the seven dimensions of physical and mental status and the estimated time for nine categories of care (grooming/bathing, eating, toileting, transferring, eating, assistance with instrumental activities of daily living, behavioural problems, rehabilitation and medical services), after which a care needs level based on the total estimated time taken for care is assigned. After this, the Nursing Care Needs Certification Board, which comprises physicians, nurses and other experts in health and social services, reviews and confirms the care needs level.9 We defined onset of disability as the point at which a participant was certified as needing care according to the LTCI classification.
Statistical analyses
Student's t test and Pearson's χ2 test were used to test differences in baseline characteristics between participants with incidence of disability during the 2 years after baseline assessment and those without.
We calculated the cumulative incidence of disability during follow-up according to baseline frailty status (frail, prefrail and robust) and corresponding to each frailty component (slowness, weakness, exhaustion, low activity and weight loss) with Kaplan-Meier curves. Intergroup differences were estimated by the log-rank test.
Cox proportional hazards regression models were used to analyse the associations between frailty phenotype and disability risk. The first model (model 1) was adjusted for age and sex. We then used a multiple adjustment model adjusted for age, sex, BMI, MMSE, number of prescribed medications, hypertension, heart disease, diabetes mellitus, osteoporosis and GDS (model 2). These covariates were included as categorical (age, sex and diagnoses) and continuous variables (BMI, MMSE, number of prescribed medications and GDS). We estimated adjusted HRs for incidence of disability and their 95% CIs.
Stratified analyses were performed to examine the relationship between frailty and disability risk in different subgroups defined by sex, age (74/75 years old), cognitive function (MMSE score 23/24) and depressive symptoms (GDS score 5/6).12 Adjusted HRs for incidence of disability and their 95% CIs were also estimated in the stratified analyses.
All analyses were conducted using IBM SPSS Statistics 19.0 (IBM Japan Tokyo). The level of statistical significance was set at p<0.05.
Results
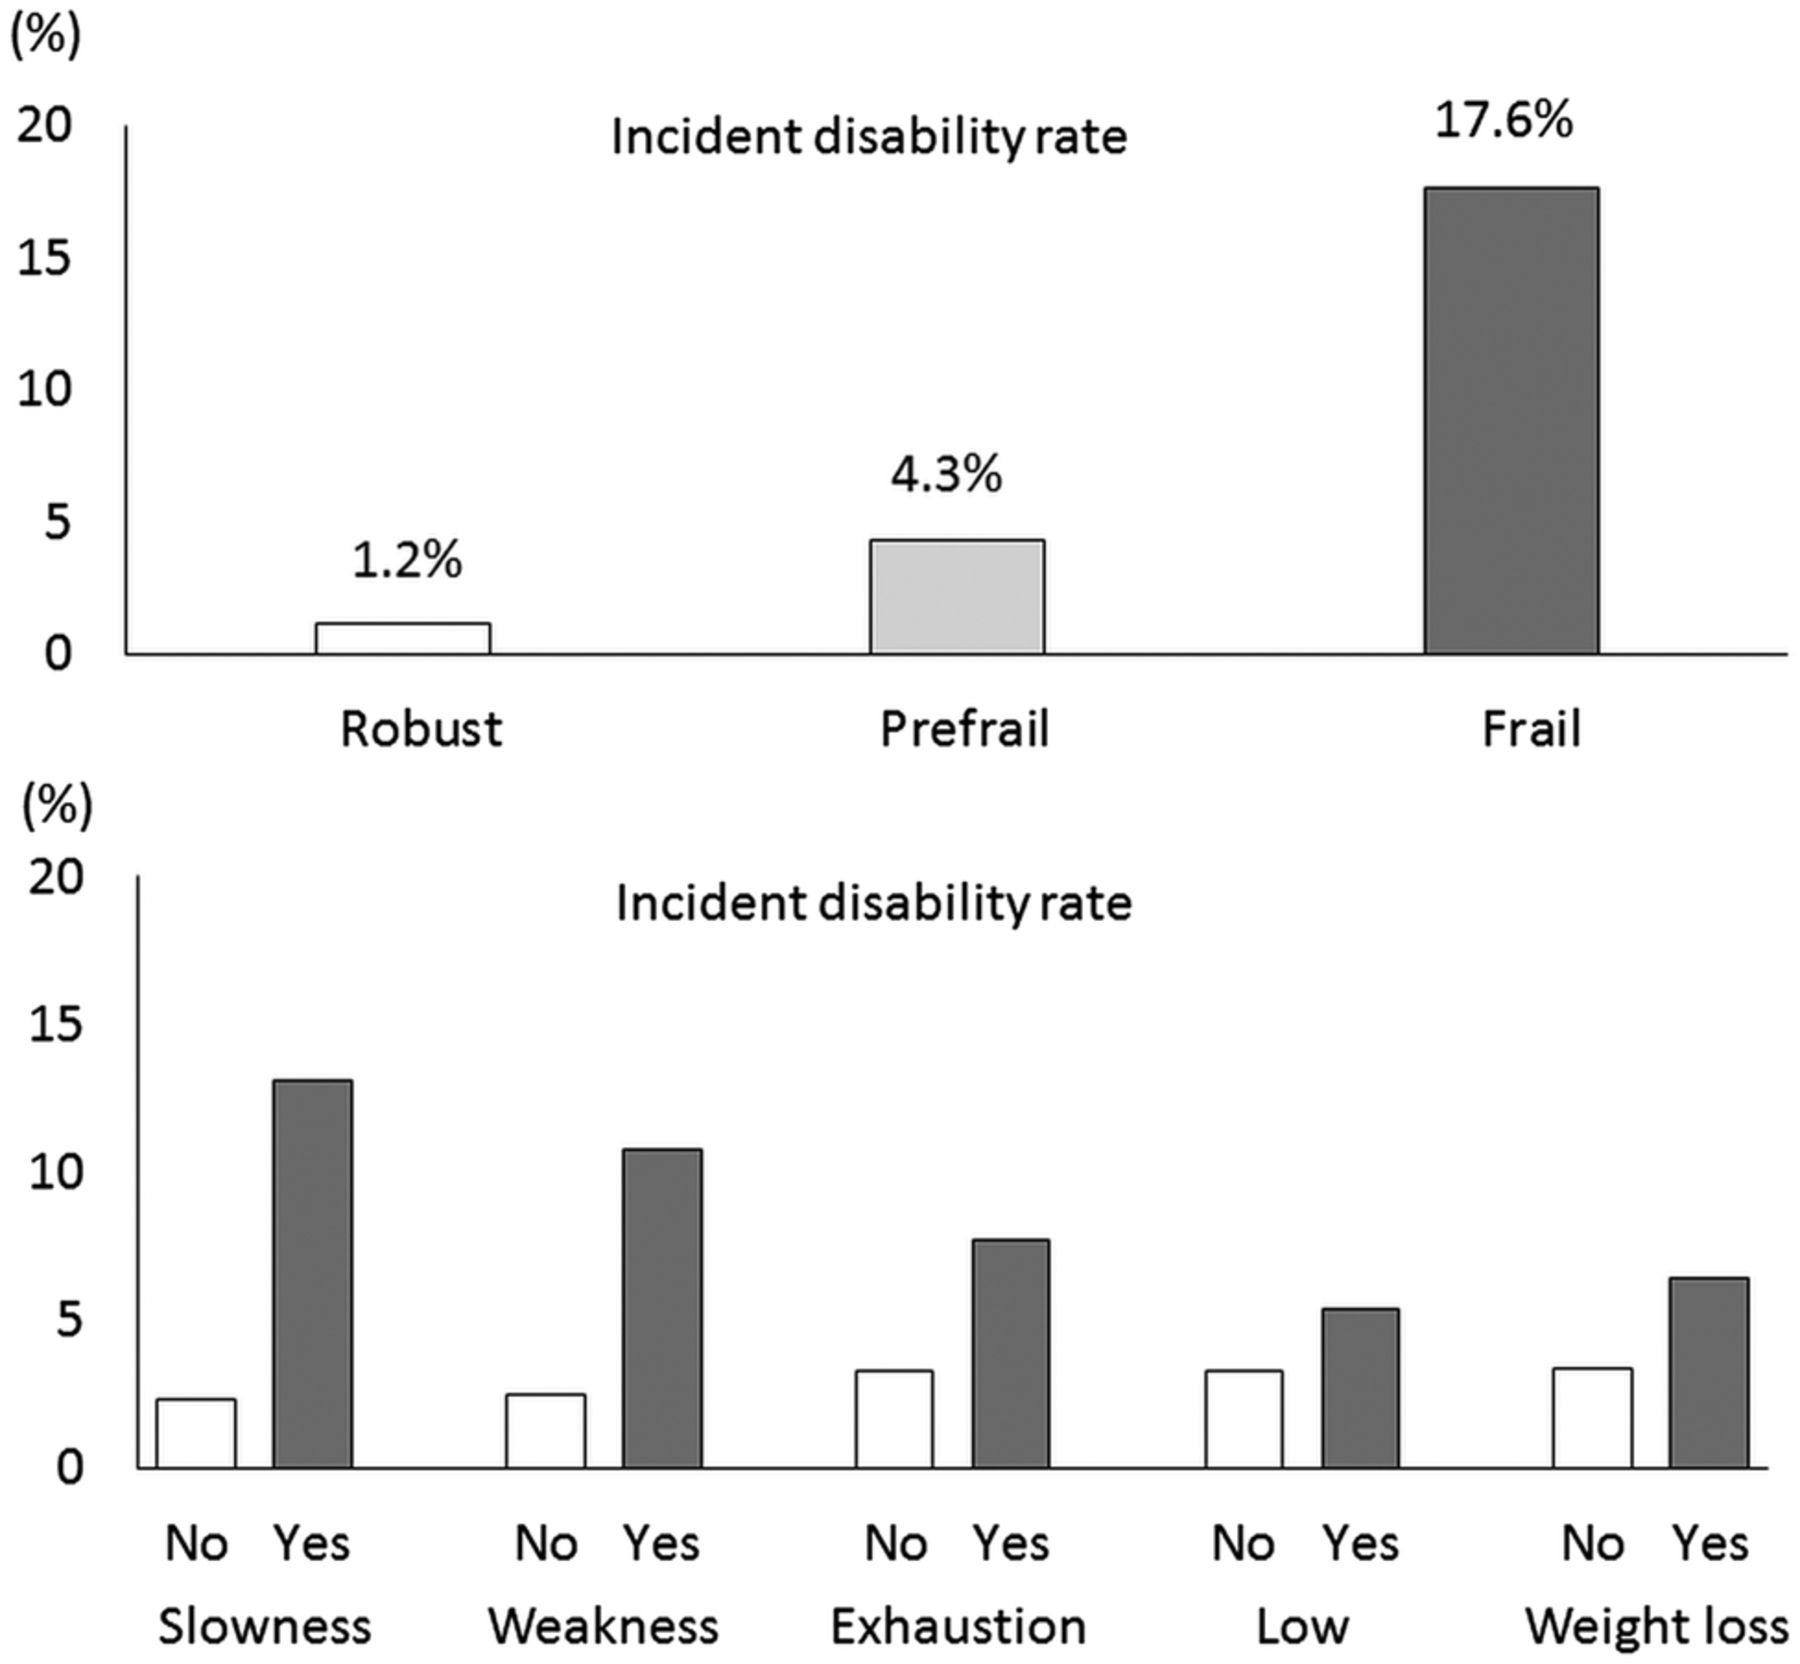
Of 5104 participants who completed a baseline assessment from August 2011 to February 2012, 763 had a history of Parkinson's disease (n=23), stroke (n=281), MMSE scores of <18 (n=31), missing data for frailty phenotype (n=249), were already using the LTCI system (n=124) at baseline, or had missing follow-up data (n=55), and were excluded from further analyses (figure 1). The mean (SD) age of the 4341 participants included in the study was 71.8 (5.4); 2241 (51.6%) were women. The prevalence rates of each component for determining frailty phenotype including slowness, weakness, exhaustion, low activity and weight loss were 14.8%, 16.4%, 13.2%, 28.6% and 14.8%, respectively. The prevalence of frailty and prefrailty was 6.9% and 49.6%, respectively. During the 2-year follow-up period, 168 participants (3.9%) had incident disability and were certified as needing care or support according to LTCI criteria. Figure 2 shows the incident disability rates of frailty status and components.

Flow chart of participant recruitment process (LTCI, long-term care insurance; MMSE, Mini-Mental State Examination; OSHPE, Obu Study of Health Promotion for the Elderly).

Incident disability rates during the 2 years after baseline assessment by frailty status and frailty components at baseline Frailty phenotype containing three or more of the following was defined as frail, one or two as prefrail, and none as robust: slowness, weakness, exhaustion, low activity and weight loss.
Table 1 presents participants’ baseline characteristics by incidence of disability during follow-up. Participants who developed disability during these 2 years were older, more often women, had more prescribed medications and a higher prevalence of hypertension, heart disease and osteoporosis compared with those who remained independent. Those with incident disability exhibited lower MMSE and higher GDS scores compared with those in the independent group at baseline. The prevalence of frailty in those who developed disability within these 2 years was 31.5% and approximately fivefold compared with those who remained independent (5.9%).
Baseline characteristics of participants by incidence of disability during the 2 years after baseline assessment
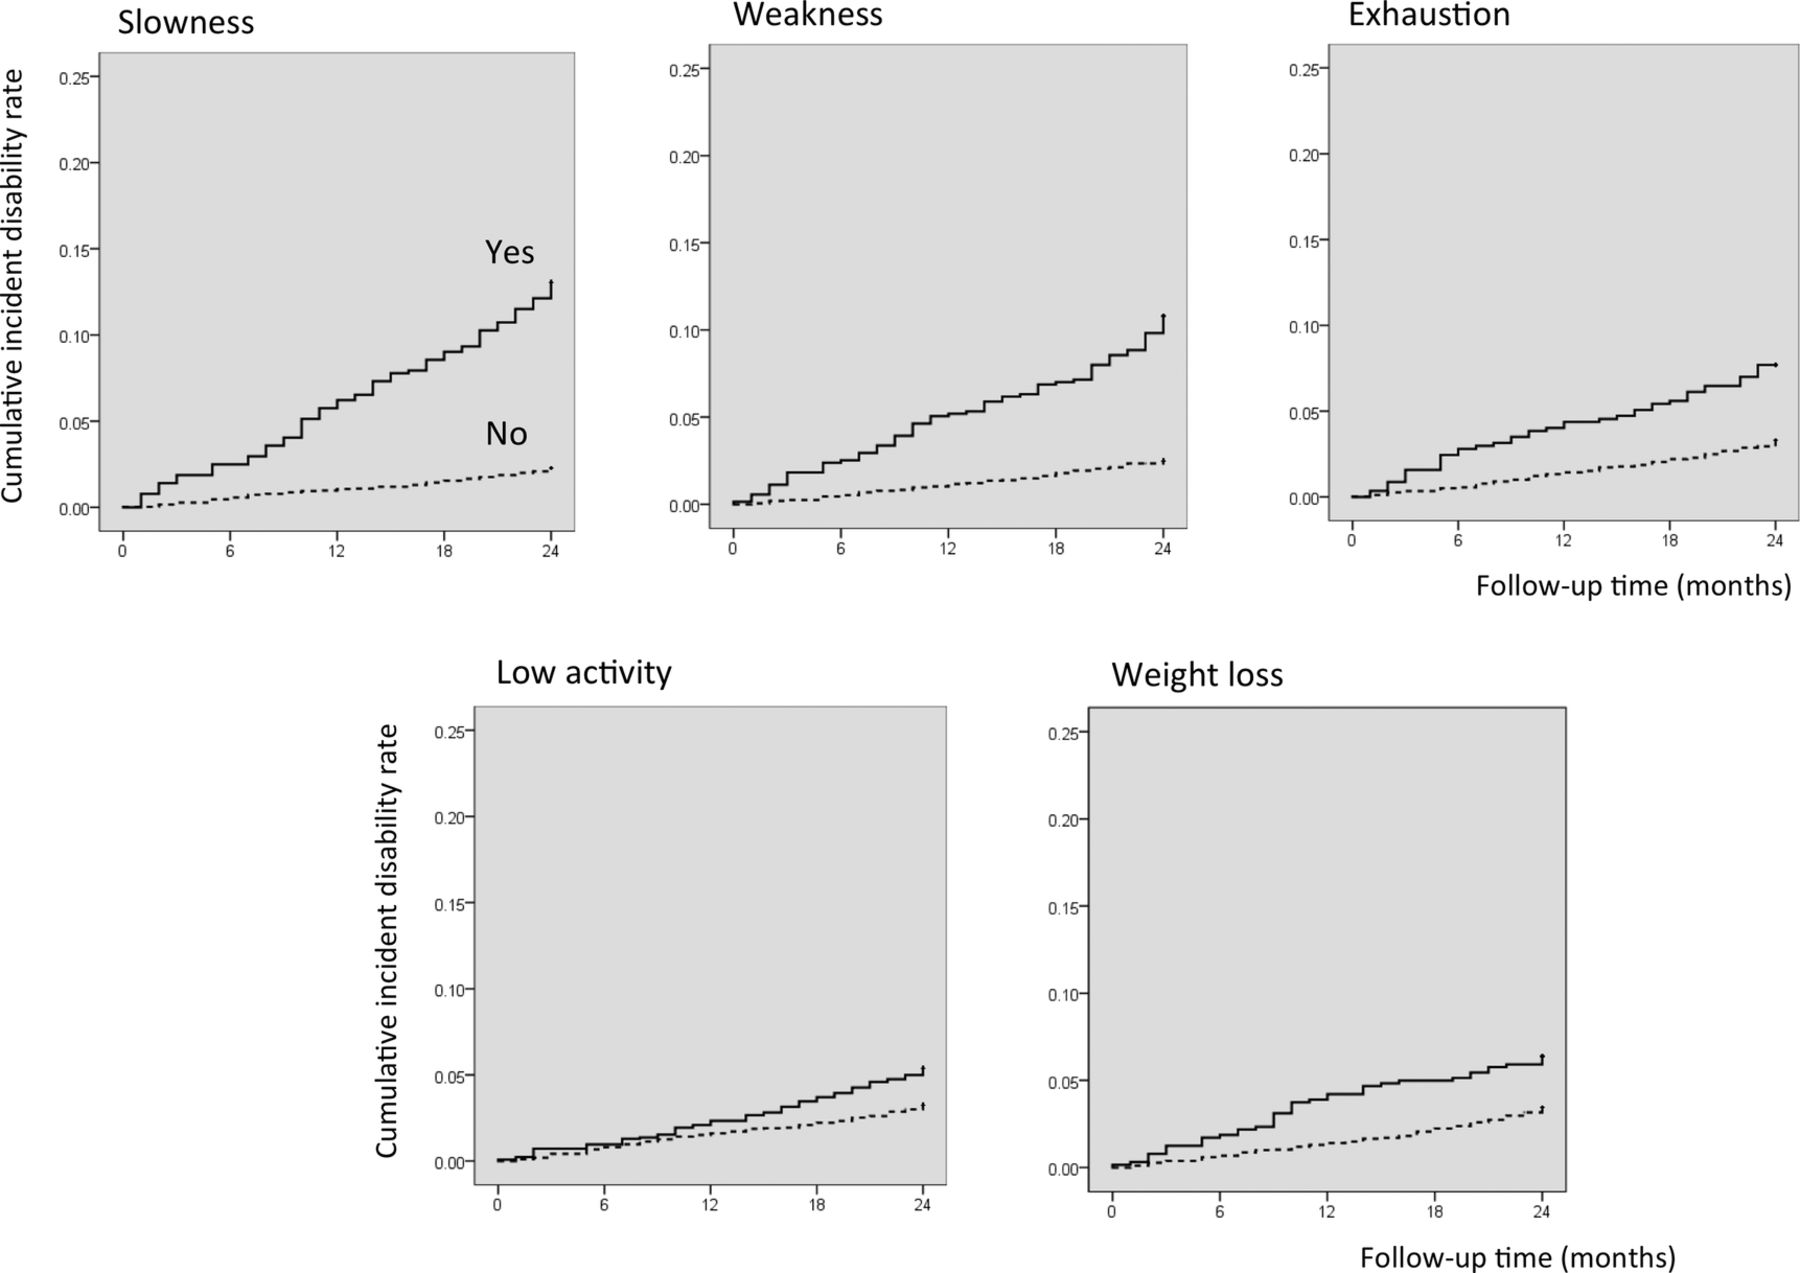
Figures 3 and 4 show the cumulative risk of disability based on frailty status and components. Survival analyses with the Kaplan-Meier log-rank test showed that the probability of incidence of disability was significantly higher in participants categorised as frail compared with those categorised as prefrail or robust (p<0.001). Furthermore, there was a significant difference in the incidence of disability between prefrail and robust individuals (p<0.001). Survival analysis performed for frailty components showed significant differences in the incidence of disability, according to the presence of frailty subitems at baseline (p<0.001) (figure 4).
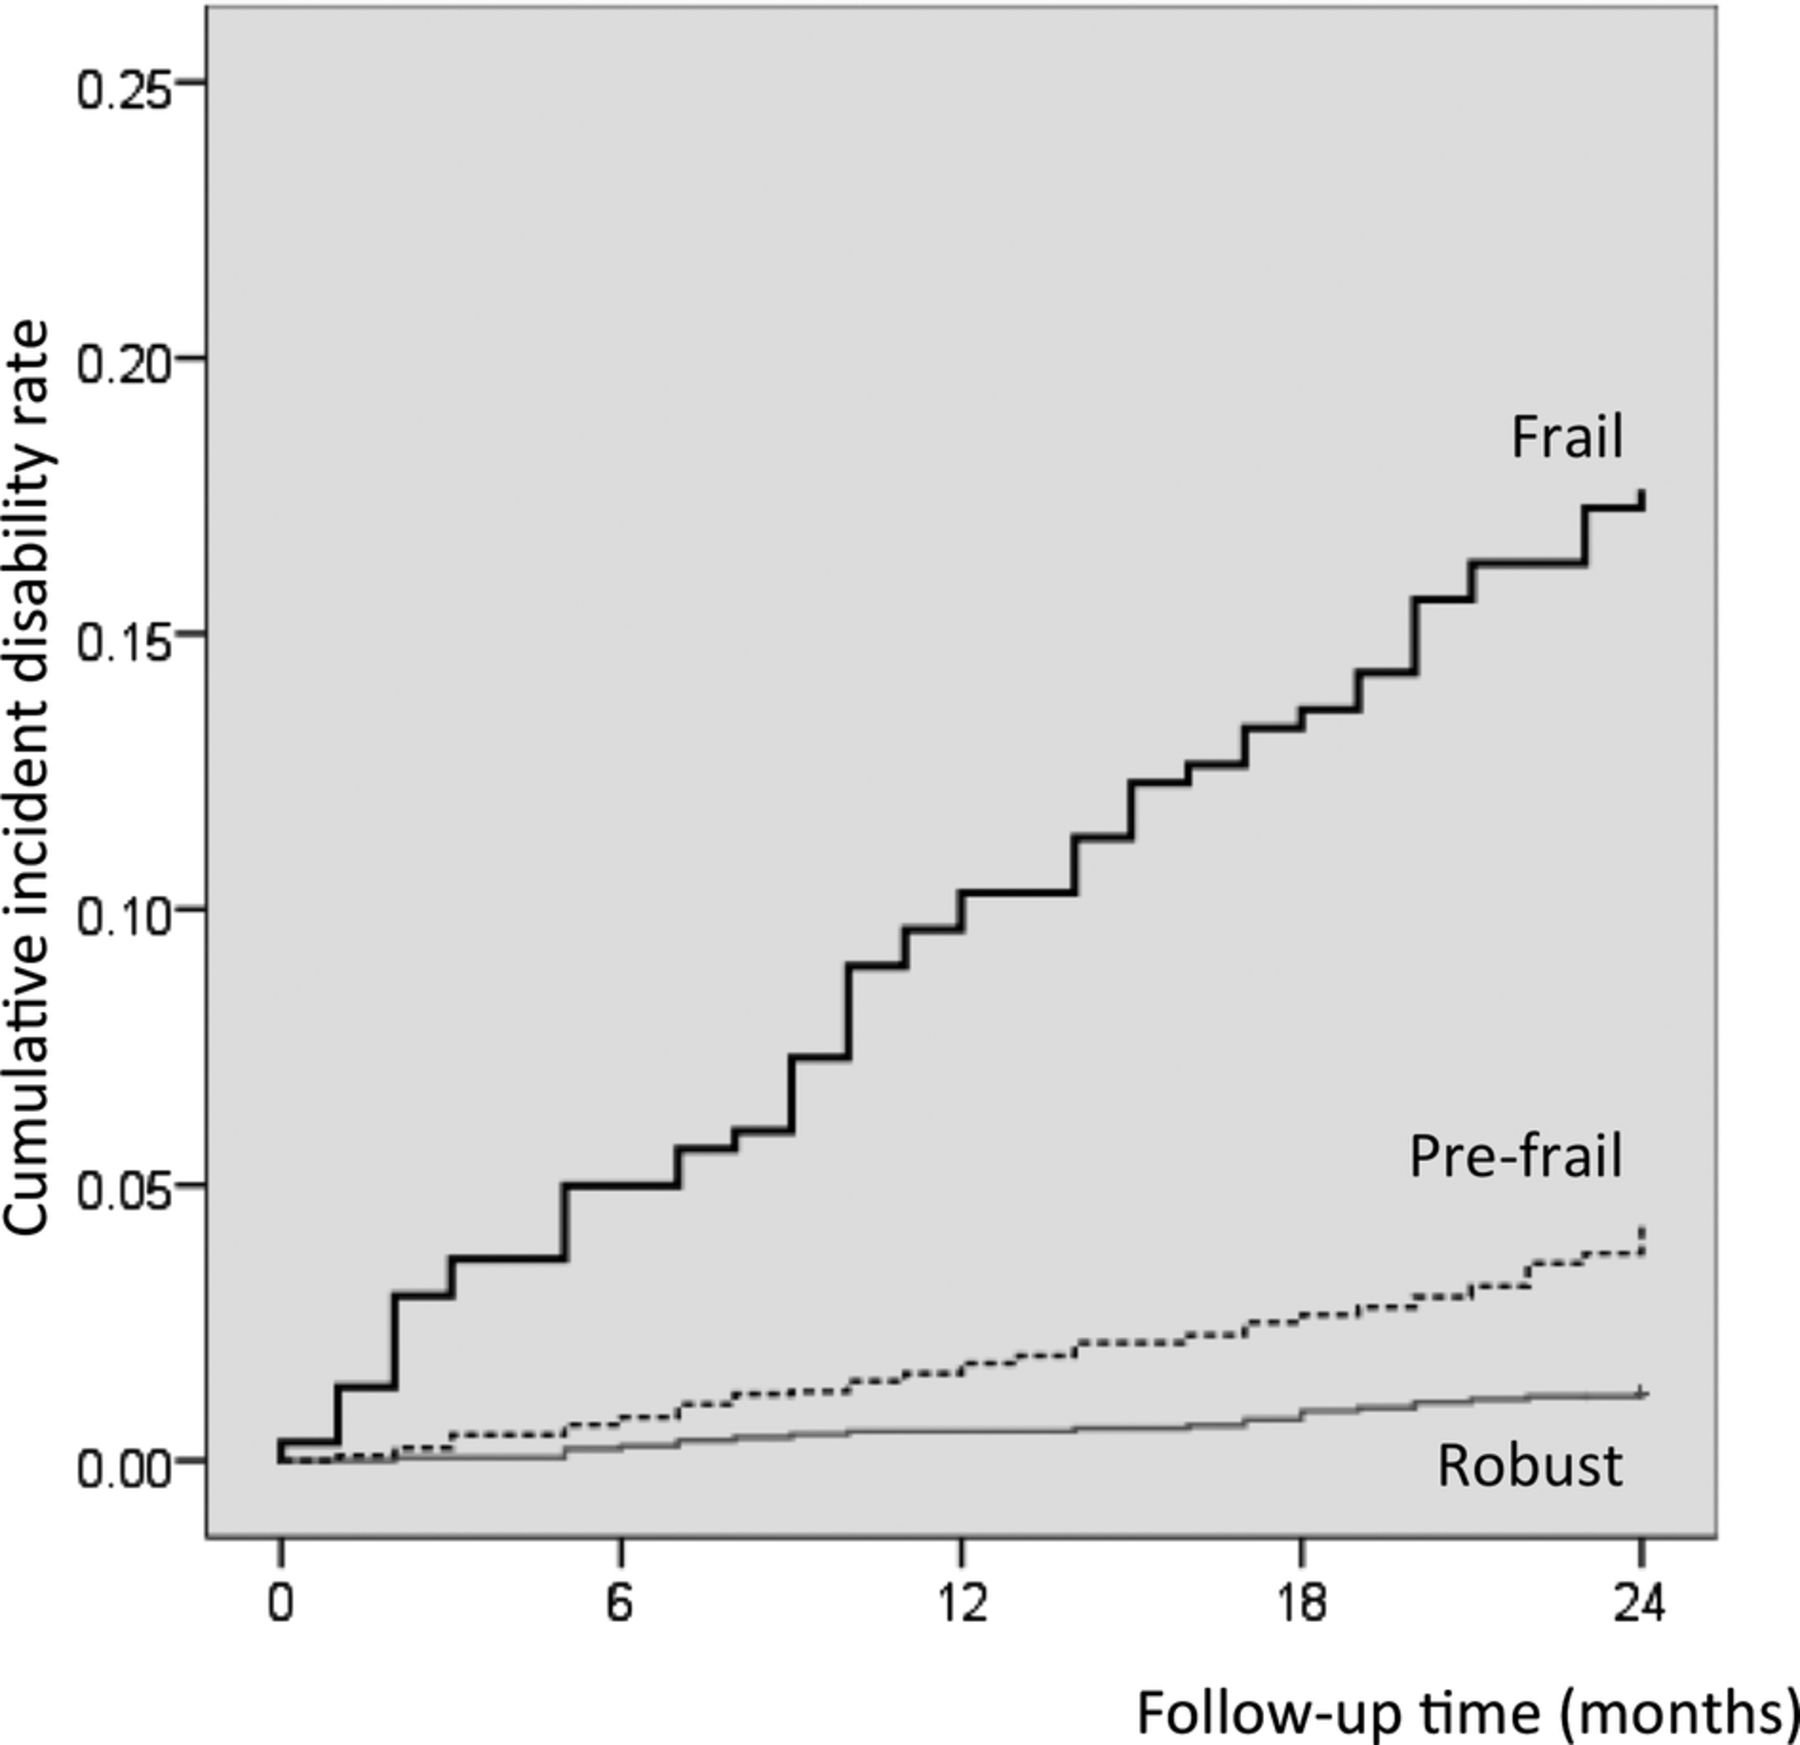
Kaplan–Meier estimates of cumulative incidence of disability according to frailty status. Frailty phenotype containing three or more of the following was defined as frail, one or two as prefrail, and none as robust: slowness, weakness, exhaustion, low activity and weight loss.

Kaplan–Meier estimates of cumulative incidence of disability according to components of frailty phenotype. Slowness (walking speed) was defined at <1.0 m/s and weakness (handgrip strength) was defined at <26 kg for men and <18 kg for women.
Cox proportional hazards regression models were used to analyse associations between frail categories and disability risk (table 2). In the first model (model 1) that was adjusted for age and sex, participants classified as frail (HR 5.85, 95% CI 3.44 to 9.96) or prefrail (HR 2.73, 95% CI 1.72 to 4.33) at the baseline assessment had an increased risk of incident disability compared with robust participants. All subitems of frailty were significantly associated with increased risk of disability. The second model (model 2) was adjusted for age, sex, BMI, MMSE, number of prescribed medications, hypertension, heart disease, diabetes mellitus, osteoporosis and GDS. Both frail (HR 4.65, 95% CI 2.63 to 8.22) and prefrail (HR 2.52, 95% CI 1.56 to 4.07) remained significantly associated with the incidence of disability in model 2. In model 2, analyses for the subitems of frailty showed that slowness (HR 2.32, 95% CI 1.62 to 3.33), weakness (HR 1.90, 95% CI 1.35 to 2.68) and weight loss (HR 1.61, 95% CI 1.13 to 2.31) were related to increased risk of incident disability. Exhaustion (HR 1.15, 95% CI 0.79 to 1.69) and low activity (HR 1.27, 95% CI 0.92 to 1.75) did not reach statistically significant levels in model 2.
HRs for incident disability 2 years after baseline assessment according to frailty status and subitems (n=4341)
Figure 5 shows the results of the stratified analyses. Each status is defined by sex, age, cognitive function and depressive symptoms. In all statuses, participants classified as frail had increased risk of incident disability across various strata defined by sex, age, cognitive function and depressive symptoms, even after adjustment for age, sex, BMI, MMSE, number of prescribed medications, hypertension, heart disease, diabetes mellitus, osteoporosis and GDS. Critically, participants with lower MMSE scores (<24 points) and who were classified as frail had the highest disability incidence rate (30/99, 30.3%), and those who were younger (<75 years) and classified as non-frail had the lowest disability incidence rate (12/1543, 0.8%) during the 2 years after baseline assessment.

HRs estimate the relative risk of incidence of disability in subgroups defined by sex, age, cognitive function and depressive symptoms in stratified analyses. HRs estimate the relative risk of disability incidence in those classified as prefrail or frail compared with those classified as robust (reference group) in a different subgroup defined by sex, age (74/75 years), cognitive function (Mini-Mental State Examination (MMSE) score 23/24) and depressive symptoms (Geriatric Depression Scale (GDS) score 5/6).
Discussion
This study adds the following to the available evidence in the field. First, slowness and weakness, as assessed by performance-based assessments, are strongly associated with incident disability. Second, the modified cut-off values for slowness (walking speed <1.0 m/s) and weakness (handgrip strength <26 kg for men and <18 kg for women) appear to be appropriate criteria for physical frailty assessments in the Japanese older population. Finally, physical frailty and lower cognitive function concurrently represent a higher risk of incident disability within 2 years.
Clinical and policy implications
Many different ways to assess physical frailty were reported in previous studies from around the world,5 with the majority of cohort studies conducted in Western countries.19 Thus, it might be inappropriate to extend the results of these studies to Asian countries. Indeed, the European Working Group on Sarcopenia in Older People20 and the Asian Working Group for Sarcopenia (AWGS)17 have different diagnostic cut-offs for the frailty phenotype. Thus, assessing frailty phenotype in an Asian population would develop a more comprehensive definition of the concept and lead to better-designed studies on its effect on the risk of disability among community-dwelling older adults in Asian countries. In this prospective cohort study of community-dwelling older adults, individuals with frail or prefrail phenotype at baseline had an increased risk of disability incidence during the 2 years after baseline assessment. These results support findings from previous cohort studies with large samples.2 ,3 Regarding the components of frailty, slowness, weakness and weight loss were more strongly associated with incident disability than the other components. The associations between frailty and the incidence of disability remained across various strata defined by sex, age, cognitive function and depressive symptoms. Specifically, participants with both a frail phenotype and lower cognitive function (MMSE scores <24) had the highest disability incidence rate (30.3%) during the 2 years after baseline assessment (figure 3). Thus, physical frailty and lower cognitive function could have additive effects on the risk for disability incidence.
The results of this prospective study showed that participants with the slowness component (defined as having a walking speed slower than 1.0 m/s) had more than a twofold higher risk of disability. However, there is no consensus regarding the cut-off point for walking speed as an indicator of slowness.21–23 Although additional studies are necessary to determine the optimal cut-off values, slowness defined as a walking speed slower than 1.0 m/s could be useful as a component of frailty for predicting disability and preventing functional decline among community-dwelling older adults who are relatively well functioning. In this study, weakness was also determined using modified cut-off values of handgrip strength for Asian populations suggested in a consensus report from AWGS. The AWGS recommends using <26 kg for men and <18 kg for women as the cut-off values for handgrip strength among community-dwelling older adults in Asia.17 Our findings indicated that low handgrip strength, as suggested by AWGS, was independently associated with the incidence of disability after adjustment for potential covariates; thus, these modified cut-off values would be appropriate for diagnosing frailty in Asian populations.
Two components of frailty, exhaustion and weight loss, assessed using items in the Kihon-Checklist, identified prevalence rates similar to those reported in a previous cohort study sampling more than 5000 community-dwelling older adults.2 Although physical activity was assessed by two simple questions according to participation in sports or physical exercises in this study, we should recognise that many other kinds of activities such as domestic tasks and gardening could play important roles with regard to physical activity in older people. We thus need to consider these points, despite the fact that the total prevalence of frailty in our study was very similar to that reported in the Cardiovascular Health Study.2 There seems to be a general consensus on the essential components of physical frailty phenotype, and the present study also indicated these impacts on incident disability in the Japanese older samples. Frailty is due to an accumulation of deficits in areas including physical and cognitive impairment and psychosocial risk factors.24
Although frailty has generally been regarded as an important concept and several multidimensional instruments have been developed to measure frailty in its totality, there is still considerable variety in how the concept is defined and measured. Specifically, there appear to be two major approaches to defining and measuring frailty: namely, regarding it as either a multifactorial construct (comprising social, psychological and physical aspects) or a mainly physical one. Thus far, the social and psychological dimensions of frailty have not been sufficiently verified.25 For instance, there is insufficient evidence regarding the operational definition of cognitive frailty and the validity of its measurements.26 A recent conference defined cognitive frailty as a clinical entity characterised by cognitive impairment related to physical causes with potential reversibility,27 making it a useful target for the secondary prevention of cognitive problems in older people.27 Indeed, considering physical frailty and cognitive impairment as a single complex phenotype may be central to the prevention of dementia and its subtypes, although this should be confirmed with secondary preventive trials on cognitively frail older individuals.28 In addition, according to the integral conceptual model of frailty, where frailty is affected by physical, psychological and social factors, life-course determinants such as sociodemographic characteristics, lifestyle, life events and environment-related factors can directly influence frailty as well as the onset of diseases that lead to frailty.29 Therefore, further studies on frailty that focus on physical as well as cognitive and psychosocial domains will be needed.
Another contentious point in defining and measuring frailty is whether to include performance-based measurements, especially for the identification of physical frailty.5 Frailty questionnaires appear to be a highly feasible method for obtaining data from large samples and for assessing participants in a busy clinical practice setting; however, slowness and weakness as assessed by performance-based methods were more strongly associated with incident disability in our study. Our findings indicate that combining questionnaires and performance-based assessments could be an effective method to identify older adults with frailty phenotype as a way to predict risk for disability incidence. Furthermore, assessments of walking speed and handgrip strength are very simple and easy to implement in community settings, and are good predictors for health outcomes.30 A notable point of our findings is that older adults with physical frailty and lower cognitive function (MMSE scores <24) concurrently represented the highest percentage, more than 30%, of incident disability in stratified analyses. Previous studies have indicated the association between physical frailty and cognitive impairment among non-demented community-dwelling older adults31–33 and shown that cognitive decline leads to higher risks of poor health.34 Our findings also suggest that physical frailty and lower cognitive function have additive effects on disability incidence.
Strengths and limitations
A major strength of this study is the application of a monthly follow-up of disability using a mandatory social LTCI in Japan. Since most frailty models were developed in white populations, different cut-offs for frailty should be considered when examining different populations.4 Although few prospective cohort studies regarding frailty phenotype and disability have been reported in Asia, this study included a large-scale prospective sample of community-dwelling Japanese older adults and the application of a comprehensive measure of physical frailty including questionnaires as well as physical performance measurements.
Nevertheless, several limitations should be considered. In the multivariate analyses, although some diagnoses, such as hypertension, heart disease, diabetes mellitus and osteoporosis, were included, several potential clinical confounders, such as haematological diseases including anaemia, oncological diseases and eye diseases causing severe visual impairment, were not included. In addition, these clinical conditions were based on self-report. We should therefore consider these issues carefully in interpreting the results. This study involved community-dwelling older people who were relatively well functioning and able to participate in the assessments at the community centre on their own. Therefore, this is likely to lead to an underestimation of the actual incidence of disability. In addition, our follow-up period was shorter than that in previous studies.2 ,3 ,35 ,36 Another limitation is that the causes of the incidence of disability were not determined. The major causes of incident disability certification by the LTCI include poststroke, dementia and severe stage of frailty. Moreover, anybody aged 65 and older (and anyone aged 40 to 64 with an ageing-related disability) is eligible for LTCI.37 Thus, future studies examining causes of disability incidence and the longitudinal relationships between frailty and disability using longer follow-up data would be helpful for the development of preventive strategies for disability.
Conclusion
In summary, the results of this prospective cohort study show that physical frailty, even being prefrail, has a strong impact on increased risk of disability. Among the components of physical frailty, slowness, weakness and weight loss are more strongly associated with incident disability in community-dwelling Japanese older adults. These findings indicate that physical frailty assessments including simple performance measurement (slowness, weakness) and questionnaires (exhaustion, low activity and weight loss) could be combined for a more effective prediction of disability incidence in the Japanese older population.
References
Footnotes
Contributors HM and HS conceived and designed the study. HM performed the analyses and drafted the manuscript. HS, TD, KT and TS revised the manuscript. TD and KT prepared the data. All authors participated in interpreting the results. All authors had full access to the data and are guarantors for the study.
Funding This work was supported by the National Center for Geriatrics and Gerontology (Research Funding for Longevity Sciences) (grant number 22-16 and 26-33).
Competing interests None declared.
Ethics approval The study was approved by the Ethical Committee of the National Center for Geriatrics and Gerontology (#490).
Provenance and peer review Not commissioned; externally peer reviewed.
Data sharing statement No additional data are available.