Article Text

Abstract
Background The UK Government has introduced several national policies to improve access to primary care. We examined associations between patient experience of general practice and rates of visits to accident and emergency (A&E) departments and emergency hospital admissions in England.
Methods The study included 8124 general practices between 2011–2012 and 2013–2014. Outcome measures were annual rates of A&E visits and emergency admissions by general practice population, according to administrative hospital records. Explanatory variables included three patient experience measures from the General Practice Patient Survey: practice-level means of experience of making an appointment, satisfaction with opening hours and overall experience (on 0–100 scales). The main analysis used random-effects Poisson regression for cross-sectional time series. Five sensitivity analyses examined changes in model specification.
Results Mean practice-level rates of A&E visits and emergency admissions increased from 2011–2012 to 2013–2014 (310.3–324.4 and 98.8–102.9 per 1000 patients). Each patient experience measure decreased; for example, mean satisfaction with opening hours was 79.4 in 2011–2012 and 76.6 in 2013–2014. In the adjusted regression analysis, an SD increase in experience of making appointments (equal to 9 points) predicted decreases of 1.8% (95% CI −2.4% to −1.2%) in A&E visit rates and 1.4% (95% CI −1.9% to −0.9%) in admission rates. This equalled 301 174 fewer A&E visits and 74 610 fewer admissions nationally per year. Satisfaction with opening hours and overall experience were not consistently associated with either outcome measure across the main and sensitivity analyses.
Conclusions Associations between patient experience of general practice and use of emergency hospital services were small or inconsistent. In England, realistic short-term improvements in patient experience of general practice may only have modest effects on A&E visits and emergency admissions.
- general practice
- emergency department
- patient satisfaction
- health services research
- health policy
Statistics from Altmetric.com
Introduction
The responsiveness of health systems to the expectations of their populations is a key measure of health system performance internationally. In 2000, the WHO listed this responsiveness as one of three overall goals for health systems to achieve (alongside good health and fair financing).1 Having high-quality and accessible primary care services is central to this goal.2 As a result, many countries have experimented with primary care reform to improve patients’ experiences of healthcare. For example, reform in the USA has focused on the Primary Care Medical Home model, which includes accessibility as a central principle; operational standards require primary care practices to offer appointments in the evenings and at weekends, for example.3 Part of the interest in this model also comes from the hypothesis that more responsive primary care services will reduce use of emergency hospital services.4–9 This hypothesis has also been studied in European countries, such as in Italy where extended opening hours up to 12 hours each day were found to reduce certain types of emergency department visits in one region.10
In England, the National Health Service (NHS) has planned several changes to general practice services.11 One widely debated policy is for general practices to offer more appointments in the evenings and at weekends.12 13 The UK Government’s mandate to the NHS states ‘100% of population has access to weekend/evening routine GP appointments’ as a goal to achieve by 2020.14 Other interventions promoted to improve patient experience include greater use of telephone and video consultations and online appointment booking systems.15 One goal of these reforms, as in other countries, is to reduce use of emergency hospital services.15 The number of visits to accident and emergency (A&E) departments in England increased from 18.9 to 22.9 million from 2006–2007 to 2015–2016.16 The number of emergency hospital admissions increased from 4.7 to 5.8 million over the same period.17 18 However, the relationships between patient experience of general practice and rates of A&E visits and emergency admissions, and their policy implications, remain unclear.
Several observational studies19–34 have investigated associations between use of emergency hospital services and patient experience of access to general practice by linking administrative records from English hospitals to a national patient survey—the General Practice Patient Survey (GPPS). However, these studies have focused on individual English regions,19–21 demographic groups (eg, children)22 or conditions (eg, asthma)23–31; only analysed A&E visits or a subset of them32–34; and have often not translated abstract statistical results into absolute numbers that are actionable. Consequently, past research does not suggest what the effect of improving patient experience of general practice on total use of emergency hospital services, across the whole population, is likely to be. This is arguably what is most relevant to national policymakers. It is not possible to synthesise results across the past studies because of substantial differences in their methods. These studies often have further limitations such as analysing only one data year cross-sectionally19–23 31–34; cross-sectional analyses cannot examine temporal relationships between variables and can be more susceptible to residual confounding.
In this study, we use national data to assess relationships between all A&E visits and emergency admissions in England with three measures of patient experience from the GPPS. Two of these measures, relating to experiences of making appointments and overall experiences, are monitored in the national outcomes framework for the NHS.35 The third measure—satisfaction with opening hours—is directly relevant to plans to extend the opening hours of general practices. Each measure is plausibly linked to use of emergency hospital services. For example, patients with poor experiences overall or of making appointments in the past may be more likely to visit an A&E department instead. Many patients report visiting A&E departments after being unable to get suitable general practice appointments,36 which may be affected by opening hours.37 Moreover, patients with acute illnesses who do not have prompt access to general practice may deteriorate and be at greater risks of requiring unplanned hospital treatment. We estimate annual differences in national numbers and costs of A&E visits and emergency admissions with changes in patient experience of general practice.
In England, almost all residents are registered with a general practice that is free at the point of use as part of the universal coverage provided by the healthcare system.
Methods
Our study was a regression analysis of cross-sectional time series data from the 2011–2012, 2012–2013 and 2013–2014 financial years. The GPPS included 8289 English general practices (24 392 practice-years) during this period. We excluded practice-years where practices had 1000 or fewer registered patients or had 50 or fewer patients respond to the GPPS. This removed practices serving the smallest populations (which are likely to be atypical) with unreliable survey results at the practice level. The vast majority of practices in the GPPS remained in the study population (8124 practices, 98% of survey sample); 23 875 practice-years was the final sample size. Most practices were present in the final sample in each year of the study period (7802 practices, 96% of final sample).
A&E visits and emergency admissions
We used routine administrative records from Hospital Episode Statistics (HES) data to count numbers of A&E visits and emergency admissions by practice-year. HES is a data warehouse containing records of admissions, outpatient visits and A&E visits to all NHS-funded hospitals in England. This study used the HES Inpatient and A&E data sets for the 2011–2012, 2012–2013 and 2013–2014 financial years, as provided by the Health and Social Care Information Centre (now NHS Digital). Both data sets contained a variable recording the general practice that each patient was registered with. This allowed data to be aggregated by practice-year and linked to the GPPS.
Each record in HES A&E data corresponds to a single visit. Our main outcome variable for A&E visits was a simple count of these records by practice-year. This variable included visits to each of the three types of A&E department in England: consultant-led general services (known as emergency departments); consultant-led single specialty services (such as ophthalmology); and doctor or nurse-led minor injury and illness services (such as walk-in centres). Record coverage for emergency departments was around 100% (99% in 2012–2013), but it was less for single specialty (77%) and minor injury and illness services (46%); coverage across all A&E types was 83% in 2012–2013.38 In this year, emergency department visits accounted for 66% of all A&E visits, but 79% of records in HES A&E data. We conducted a sensitivity analysis with only emergency department visits included in the outcome variable. We discuss possible implications of the missing data for the results in the ‘Discussion’ section of the article.
Each record in HES Inpatient data corresponds to a continuous period of hospital care under the same consultant doctor. Some hospital stays generate several records where patients are transferred between consultants within the same hospital or between hospitals. To avoid counting several admissions in these instances, the analysis was based on ‘superspells’ which are continuous periods of care from initial admission to final discharge after any hospital transfers; we refer to superspells as admissions in the rest of the article.39 The outcome variable for emergency admissions included all superspells where the method of admission indicated an emergency admission; this included emergency admissions via A&E departments (73% in 2012–2013) as well as other methods such as general practitioners (GP) and hospital outpatient clinics (27%).16 The outcome variable recorded numbers of emergency admissions by practice-year.
The outcome variables in the main analysis included all age ranges of patients, including children. A sensitivity analysis included A&E visits and emergency admissions for adults only (see ‘Sensitivity analyses’ below).
Patient experience of general practice
The GPPS is a quantitative postal survey conducted annually for the NHS. Patients aged at least 18 years old who have valid NHS numbers and have been registered with an English general practice continuously for the last 6 months are eligible to participate.40 The sampling frame includes all practices with eligible patients. Questionnaires are sent to stratified (by age group, gender and practice) random samples of eligible patients in each practice, with 2 912 535 respondents from 8289 practices between 2011–2012 and 2013–2014 (36% of 8 134 705 questionnaires sent).40–42 The mean number of responses per practice-year was 119 (SD=23), which provides most patient experience measures with practice-level reliability that is ‘excellent’ (≥0.9) or ‘good’ (≥0.8) in a given year.43 NHS England provided us with respondent-level survey data.
We analysed three patient experience measures—experience of making an appointment, satisfaction with opening hours and overall experience. Each measure was generated from survey questions with five response options: satisfaction with opening hours was recorded as ‘very satisfied’ to ‘very dissatisfied’, while experience of making an appointment and overall experience were recorded as ‘very good’ to ‘very poor’ (online supplementary appendix 1). We treated responses as lying on an interval scale: 100 (most favourable), 75, 50, 25, 0 (least favourable), as is the common method in previous research.44–46 The survey asked all respondents to complete the questions analysed. We chose these measures because of their policy relevance, plausible causal mechanisms and because they represent three distinct constructs within the GPPS; overall experience is most strongly associated with the interpersonal quality of care provided by GPs,47 whereas experience of making an appointment is most strongly associated with the accessibility of services, and satisfaction with opening hours is only weakly associated with other GPPS measures.48
Supplementary file 1
We calculated practice-level measures of patient experience as the means of respondent-level values for each practice-year. When calculating these means, we weighted responses using the weights given in the survey data sets; these weights account for differential response probabilities (based on patient age, gender, region of England, and area-based demographic and socioeconomic indicators) and the probabilities of eligible patients being sent questionnaires in each practice.40–42 Practice-level measures had hypothetical ranges of 0 (when all respondents chose the most negative option) to 100 (when all chose the most positive option). Some variation in patient experience measures between practices is explained by differences in respondent characteristics between practices.44 46 This variation may not reflect true differences in patient experience; it could be influenced by how different patient groups interpret questionnaires, for example. We therefore conducted a sensitivity analysis with practice-level measures adjusted for respondent case mix (see ‘Sensitivity analyses’ below). The weighted measures represent the values of patient experience expected if all patients registered at each general practice responded, whereas the case mix adjusted measures represent the values practices would have if they had similar patient populations.
General practice characteristics
We analysed eight characteristics of general practices as potential confounding variables for associations between patient experience and use of emergency hospital services.
The number and age-gender distribution of patients registered to each practice were provided by the Health and Social Care Information Centre (by email or online).49 Data were for 30 September in each financial year of the study period. We coded the age-gender distributions as percentages for 14 age-gender bands50 (male/female; 0–4 years, 5–14 years, 15–44 years, 45–64 years, 65–74 years, 75–84 years, 85 years or more), as coded in the original data sets. Ethnicity profiles for lower layer super output areas (LSOA; small areas with mean populations of 1500) were available from the 2011 national census.51 We calculated the percentages of each practice’s population of various ethnicities (white, mixed, Asian, black and other) as weighted sums of the percentages for each LSOA in which a practice had patients.51 52 The weights were the proportions of each practice’s population living in each LSOA.52 We also used this method to calculate seven measures of socioeconomic status at the practice level based on each domain of the 2010 Index of Multiple Deprivation.53
We analysed several intermediate clinical outcome measures from the UK Quality and Outcomes Framework, using data provided by the Health and Social Care Information Centre for each year of the study period (online supplementary appendix 2).54–56 We focused on intermediate outcome (rather than process) measures as these show the greatest correlations with patient experience measures, though the correlations are still weak (Spearman rank correlations ≤0.18).57 We used a composite measure of performance calculated as the weighted sum of achievement on intermediate outcome measures, using the relative number of points for each measure as the weights.57 The type of general practice contract (‘General’, ‘Personal’, ‘Alternative Provider’ or ‘Primary Care Trust’ Medical Services) was also available from the Health and Social Care Information Centre in each study year.49 58 We also analysed whether a general practice was located in an urban area (population of 10 000 or more59) and which Clinical Commissioning Group area it was in (out of 211 areas in England).
General practice variables for ethnicity, socioeconomic status, urban classification and Clinical Commissioning Group area were treated as unchanging over the study period. Other general practice characteristics could change between financial years.
Statistical methods
We linked GPPS data with HES and other data sources at the practice level using the unique identifiers of general practices in England. Only a few practice-years in the GPPS data were not present in the other data sets (0.2%). Descriptive statistics included all eligible practice-years (23 875 for 8124 practices). When estimating associations between variables, each model only included practice-years without missing data for any of the variables included in that model (as indicated in the results tables).
We estimated associations between the outcome and patient experience measures using Poisson regression. The outcome variable in the regression models was either the number of A&E visits or the number of emergency admissions by practice-year. Each model was estimated, in turn, for A&E visits and emergency admissions. Models included the natural logarithm of the number of patients registered to each practice as an offset term, with its coefficient equal to 1, so that the estimated coefficients represented associations with rates of the outcomes (rather than numbers). We present exponentiated coefficients, referred to as rate ratios (RR), with 100*(RR-1) equalling the percentage change in the rate of A&E visits or emergency admissions resulting from a specified change in a patient experience measure.
Our models included a random intercept at the general practice level to account for repeat observations on the same practices. Associations were estimated using both variation in measures between practices and within practices between financial years. This partially adjusted results for potential confounders that were unobserved and were constant within practices over the study period. Models also included either the mean A&E visit rate or emergency admission rate for each practice in the three financial years before the study period (2008–2009 to 2010–2011).50 60 These presample mean rates provide extra adjustment for unobserved characteristics of practices that are constant in time and affect use of emergency hospital services. We adjusted for financial year using indicator variables, which accounted for national time trends in rates of A&E visits and emergency admissions. We calculated 95% CIs from Huber-White SEs to account for possible overdispersion and heteroscedasticity.61
In multivariable analyses, we entered patient experience measures into models as explanatory variables simultaneously, along with the measures of general practice characteristics. Each model was estimated four times: once with all three experience measures coded as continuous variables and three times with only one of these measures coded as categorical fifths. All practice characteristics given above were adjusted for (regardless of their statistical significance) as their purpose was to reduce confounding. We omitted two variables to prevent perfect collinearity among general practice characteristics: the percentages of practice populations that were male aged 15–44 years old and the percentages of white ethnicity. Remaining collinearity between the age-gender and ethnicity variables was unimportant as they were only being used as control variables (so their associations were not of interest). We generated indicator variables for practice contract type (three indicators), urban location (one indicator) and Clinical Commissioning Group (210 indicators).
We standardised patient experience measures to have means equal to 0 and SDs equal to 1. This allowed associations to be interpreted in terms of a 1 SD change in these measures, which helped compare the sizes of associations across measures. We used the associations to calculate absolute differences in numbers of A&E visits and emergency admissions with 0.5 and 1 SD increases in any patient experience measures consistently associated with the outcomes. We translated these differences into provider costs using NHS reference costs.62
Sensitivity analyses
We tested the robustness of our results in five sensitivity analyses. First, we included visits to emergency departments only (rather than all A&E departments such as walk-in centres or minor injury units) in the outcome. Second, we included visits to all types of A&E department but only included patients aged 18 years old or more, as only adults participate in the GPPS.
Third, we created practice-level measures of patient experience adjusted for the case mix of survey respondents. To do this, we estimated random-effects linear regression models with the patient experience measures (at the respondent level) as the outcome variables and respondent characteristics (age, gender, ethnicity, socioeconomic status, ability to take time off work to see a GP and confidence in managing own health63) as explanatory variables. We then predicted the practice-level random intercepts to give empirical Bayes case mix adjusted measures of patient experience at the practice level in each study year.57
Fourth, we added further explanatory variables. These were: the prevalences of 21 conditions in each practice as recorded for the UK Quality and Outcomes Framework,54–56 the number of full-time equivalent GPs per 1000 patients, the weighted percentages of GPPS respondents who knew how to contact an out-of-hours GP service and a measure of relational continuity of care from the GPPS; this measure, detailed elsewhere,64 assesses how often respondents who have a preferred GP consult that GP.
Fifth, we estimated associations using variation in measures within practices between years only (using practice-level fixed effects). This removed possible confounding from variables that affect use of emergency hospital services and do not change within practices over time. Data management and analysis used Stata MP V.13.65
Results
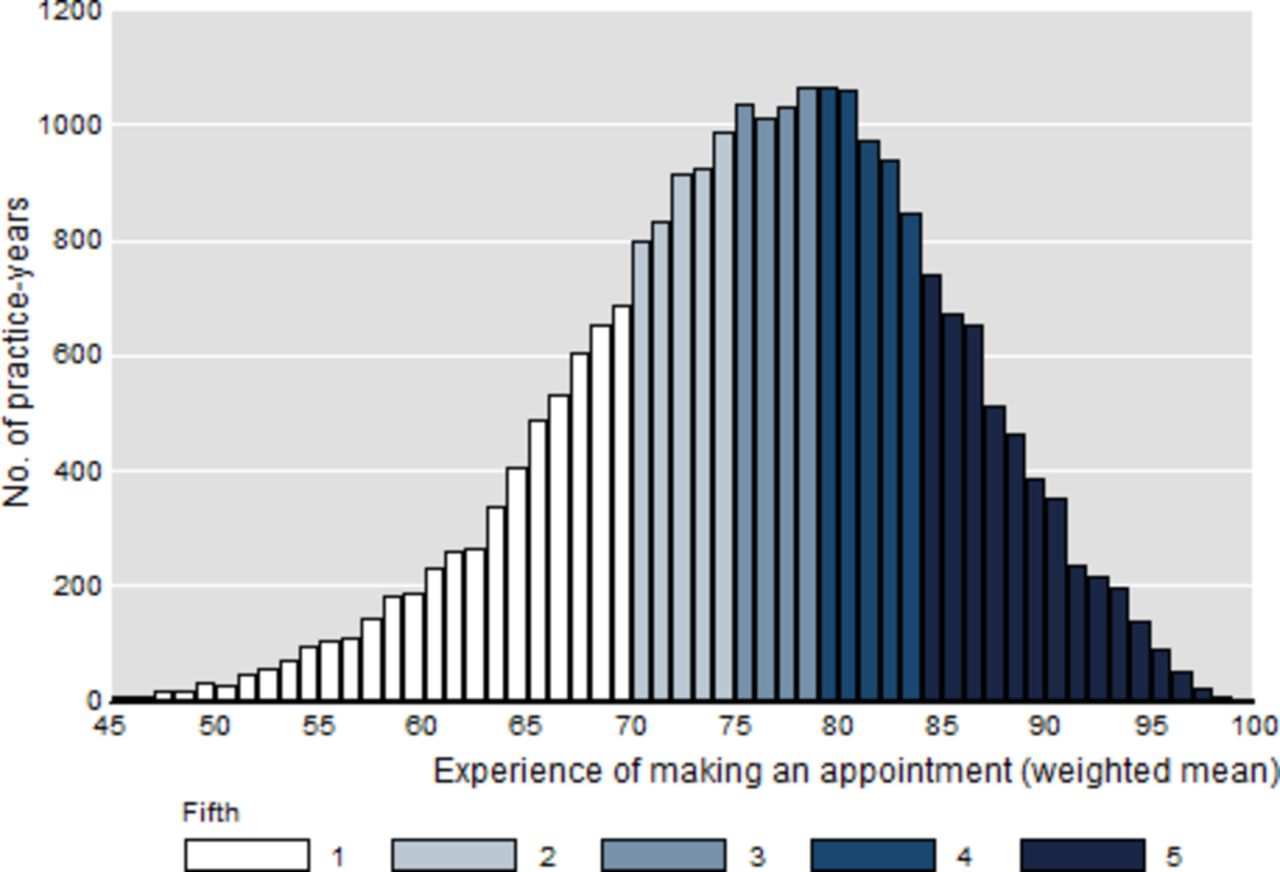
Table 1 describes rates of A&E visits and emergency admissions and the patient experience measures at the practice level. Mean values of the patient experience measures decreased year on year, while use of emergency hospital services increased over the study period. Figure 1 shows the distribution of the experience of making an appointment measure at the practice level; the distributions of the other two experience measures were similar (table 1). Most survey respondents reported favourable experiences of their practices; for example, 42% and 45% of weighted respondents described their overall experiences as ‘good’ and ‘very good’, respectively (online supplementary appendix 3). The mean number of patients registered to each practice was 6940 (SD=4220) and most practices were located in urban areas (85.7% of practice-years) (online supplementary appendix 4).

Distribution of mean experiences of making appointments for general practices in England, 2011–2014 (n=23 875 practice-years). Fifty-four practice-years (0.2%) with values less than 45 (minimum=30.3) not charted.
Descriptive statistics for patient experience measures and rates of A&E visits and emergency admissions for general practices in England, 2011–2014
Table 2 shows that general practices with increased values for the three patient experience measures reduced rates of A&E visits on average in the unadjusted analyses. After adjusting for other variables, this association remained for experience of making an appointment only (table 2). A 1 SD increase in this measure predicted a 1.8% decrease in the rate of A&E visits (95% CI −2.4% to −1.2%). There was no evidence of an association for satisfaction with opening hours (RR=1.001, 95% CI 0.997 to 1.006, P=0.519) or overall experience (RR=1.004, 95% CI 0.998 to 1.010, P=0.182). The adjusted rate of A&E visits in the fifth of practices with the greatest mean values of experience of making an appointment was 2.1% lower than in the fifth with the lowest mean values (95% CI −3.4% to −0.7%) (table 2).
Associations between rates of A&E visits and fifths of experience of making an appointment, satisfaction with opening hours and overall experience for general practices in England, 2011–2014
Table 3 shows that practices with improved experiences of making appointments also reduced mean rates of emergency admissions in both unadjusted and adjusted analyses. After adjusting for other variables, a 1 SD increase in this experience measure predicted a 1.4% decrease in the admission rate (95% CI −1.9% to −0.9%). The adjusted rate of emergency admissions in the fifth of practices with the greatest mean values of experience of making an appointment was 3.9% lower than in the fifth with the lowest mean values (95% CI −4.9% to −2.9%) (table 3). Table 3 also shows that emergency admission rates did not vary systematically over categories of satisfaction with opening hours or overall experience.
Associations between rates of emergency admission rates and fifths of experience of making an appointment, satisfaction with opening hours and overall experience for general practices in England, 2011–2014
Table 4 presents the results of the sensitivity analyses. It shows adjusted RRs for A&E visits and emergency admissions comparing the fifths of practices with the greatest patient experience values with the fifths of practices with the lowest values. The results were generally consistent with the main analysis; better experiences of making appointments were associated with lower rates of A&E visits and emergency admissions in all analyses.
Sensitivity analyses: adjusted rate ratios for A&E visits and emergency admissions comparing English general practices in the highest and lowest performing fifths of patient experience measures, 2011–2014
Table 5 provides estimates of the predicted annual differences in numbers of A&E visits and emergency admissions with 0.5 and 1 SD increases in experience of making an appointment. The total short-term cost saving, for both A&E visits and emergency admissions, from a 1 SD increase in experience of making an appointment was estimated to be £206 359 098 ($278 025 549, €233 802 805) per year.
Estimated changes in numbers of A&E visits and emergency admissions, and associated provider costs, with 0.5 and 1 SD increases in practice mean experiences of making appointments
Discussion
General practices with improved experiences of making appointments on average reduced rates of A&E visits and emergency admissions. This association existed before and after adjusting results for several characteristics of practices and remained in all sensitivity analyses. The results suggest 301 174 fewer A&E visits and 74 610 fewer emergency admissions per year if values of this patient experience measure were 1 SD greater than they were during the study period. This equals a total annual cost saving to A&E departments and hospitals of approximately £206.4 million ($278.0 million, €233.8 million). Variation between general practices in the measure of experience of making an appointment is largely explained by four other measures in the GPPS: ease of telephone contact, helpfulness of receptionists, ability to get an appointment and appointment convenience.48 These measures are all relevant to patients’ access to services. Possible mechanisms for the above results, under a causal interpretation, include that: some patients who experience or expect problems with accessing their general practices visit an A&E department instead36 37; and difficulties with access may lead to worsened health and increased risks of requiring unplanned hospital care.
However, the size of the association was modest. NHS England has committed at least £175 million ($236 million, €198 million) to fund general practices to test new ways of improving access since April 2014.66 The effect of these interventions on patient experience is unknown, but an increase in the experience of making an appointment measure by 1 SD is ambitious (9 points on the 0–100 scale); it is equal to 84% of practices having greater values of this measure than the mean value before the intervention period. An increase of 0.5 SD is more realistic in the short term which we estimated as producing annual cost savings of £103.6 million ($139.5 million, €117.3 million) to A&E departments and hospitals. It is therefore uncertain whether current plans to improve patient experience of general practice will provide net cost savings to the NHS. Previous research suggests that many A&E visits in England currently occur after a patient is unable to get a suitable general practice appointment,36 but the extent to which this can be changed in the short term is another matter. General practices, A&E departments and hospitals are embedded in complex systems that may act to resist change and reinforce the status quo, while patient behaviour may change in unexpected ways.67
Our results provide little evidence that improvements in satisfaction with opening hours or overall experience are independently associated with reduced A&E visit or emergency admission rates. Patient experience of making appointments was the only experience measure consistently associated with use of emergency hospital services, though the estimated associations were relatively modest.
Relation to existing literature
Three other studies32–34 have investigated associations between patient experience measures from the GPPS and rates of A&E visits across England. The first of these studies32 examined emergency department visits where patients had referred themselves and were discharged (39% of visits); practices where patients were more able to see a GP within 2 weekdays had lower A&E visit rates in 2010–2011.32 Tammes et al 33 examined data from 2012 to 2013 and reported similar findings for the above outcome variable and also for an outcome including additional types of A&E department. Scantlebury et al 34 investigated all A&E visits in 2011–2012 and reported that practices where patients were more likely to be able to get an appointment had lower A&E visit rates. Cecil et al 22 also found this association in 2011–2012 for children aged less than 15 years old.22 Zhou et al 68 estimated that worse experiences of in-hours general practice services were associated with greater use of out-of-hours services.
Other studies24–31 have examined relationships between patient experience of accessing general practice and rates of emergency admissions in England. These studies focused on specific conditions such as asthma,31 chronic obstructive pulmonary disease25 and heart failure.26 Practices with higher scores on GPPS measures related to access had lower adjusted admission rates in all but one study, though the exact measure(s) showing this association is inconsistent across studies. Bottle et al 23 found that patients had lower risks of an emergency admission (vs elective admission) for cancer if they were more likely to be able to see a GP within 2 weekdays. Another study found that patients are more likely to have an emergency admission via an A&E department, rather than via their GP, if they are registered with a less accessible practice.69
Our study develops this existing literature in several important ways. First, it included the whole population of England and was not limited to individual demographic or clinical groups. Second, it included all A&E visits and emergency admissions to assess the total, or overall, relationship between acute hospital services and patient experience of general practice. Third, it translated results into absolute reductions in A&E visits and emergency admissions and their associated costs. Fourth, it used several years of data to estimate associations with more robust methods than previous studies. This novel approach now suggests that, overall, realistic short-term improvements in patient experience of general practice will likely only have modest effects on A&E visits and emergency admissions and not provide large financial benefits to the health service nationally.
Previous studies, which have often focused on particular populations or subsets of A&E visits and admissions, may mislead national policymakers if the overall associations in the whole population are much smaller than in the study population. For example, a quasiexperimental study of interventions to improve access to general practice in Greater Manchester, England, estimated a 26% reduction in ‘minor’ A&E visits but a statistically insignificant reduction of 3% across all A&E visits.70 A similar analysis in London, England, estimated a 10% decrease in A&E visits in four practices that extended opening times, but it found no effect in 30 neighbouring practices whose patients could use the practices with longer opening hours.71 It is important to consider the magnitudes of associations in whole populations when assessing this research area.
Strengths and limitations
A strength of our study is that we used national data including all general practices in England. The findings are therefore externally valid and directly relevant to national policymakers, in contrast to previous local analyses.19–21 70 71 We also used several years of data which allowed us to test the sensitivity of results to different assumptions about unmeasured confounders at the practice level. Most previous national analyses cited above have often used just one data year or assumed that there is no confounding by time-constant practice level variables which is unlikely. We used three data years because GPPS methods changed substantially from 2010–2011 to 2011–2012, and the most recent HES data we could obtain were for 2013–2014. Though we adjusted results for possible confounding factors that are constant within practices over time, the results may still be biased by unobserved confounders that vary within practices over time. We were unable to account for this form of confounding using our chosen study design. Data on the quality of mental health services and social care, for example, would have been useful to incorporate. Since our analysis was conducted at the practice level, associations should not be inferred at the patient level (to avoid ecological fallacy). We could not conduct analysis at the patient level as individual GPPS responses cannot be linked to HES data.
HES recorded 83% of visits across all types of A&E department in 2012–2013.38 If the percentages of visits missing for each practice were not associated with the patient experience measures, associations estimated for these measures will not be biased but the 95% CIs will be wider than they would otherwise have been (as the SEs will be biased upwards). This is not a critical concern here because the sample size was large so the CIs remained small. Incomplete recording of visits by an A&E department should affect all practices within the local area relatively equally, so adjusting for practice location (as we did) should reduce the chances of bias being introduced by missing data. Moreover, incomplete recording may affect the same practice equally in each year of the study period, so the analysis is unlikely to be affected by this potential source of bias. The sensitivity analysis that included visits to emergency departments only (where record coverage is close to 100%38) produced results that do not alter our overall conclusions.
We estimated potential changes in costs associated with A&E visits and emergency admissions using average reference costs. This may not accurately reflect the true change in costs if, for example, changes in patient experience of general practice disproportionately affected simpler, and therefore cheaper, use of services.
Though we acknowledge the potential problems associated with the survey response rate of 36%, any non-response bias that may result should also be fairly constant within practices over time (as the patient populations do not change quickly) and therefore have little effect on the results. Moreover, a previous analysis of GPPS data suggested minimal associations between response rates and the outcome measures studied.72 Meta-analysis of survey literature indicates that associations between response rates and non-response bias are generally weak when probability sampling methods like those in the GPPS are used.73
Changes in patient experience within practices between years are measured with error due to sampling variation in the GPPS. This measurement error will have attenuated associations between patient experience measures and rates of A&E visits and emergency admissions; the analysis could therefore underestimate the expected reductions in A&E visits and emergency admissions, and associated costs, with improvements in experiences of making appointments, for example.
Implications for research and policy
Our results suggest that only patient experience of making appointments at general practices was consistently associated with use of emergency hospital services, and this association was modest. These results cast doubt on interventions that are expected to substantially reduce use of emergency hospital services through improving patient experience of general practice. However, interventions may affect A&E visit and admission rates independently of patient experience as reported in the GPPS; the effects and causal mechanisms of any intervention are likely to depend largely on its unique design and context. Policies may also be implemented primarily for other reasons, such as improving patient experience of general practice in itself (which declined across several measures from 2011–2012 to 2014–2015).48 Moreover, the results from trialling new policies now, despite an uncertain evidence base, may be better than the results of other policies introduced later on after waiting for more evidence to form. To conclude, we recommend caution in expectations that current plans to improve patient experience of general practice can substantially reduce use of emergency hospital services and provide net cost savings to the NHS in England.
References
Footnotes
Twitter @Azeem_Majeed
Contributors TEC is responsible for the whole of the work and is the guarantor. MJH and AM contributed to the interpretation of results and revisions of the article. All authors approved the published version.
Funding This report is independent research supported by the National Institute for Health Research (NIHR) (Doctoral Research Fellowship, Thomas Cowling, DRF-2013-06-142). The views expressed in this publication are those of the authors and not necessarily those of the NHS, the NIHR, or the Department of Health.
Competing interests None declared.
Provenance and peer review Not commissioned; externally peer reviewed.