Article Text

Abstract
Background As part of a larger study examining the effectiveness of the Maternal Newborn Dashboard, an electronic audit and feedback system to improve maternal-newborn care practices and outcomes, the purpose of this study was to increase our understanding of factors explaining variability in performance after implementation of the Dashboard in Ontario, Canada.
Methods A collective case study. A maximum variation sampling approach was used to invite hospitals reflecting different criteria to participate in a 1-day to 2-day site visit by the research team. The visits included: (1) semistructured interviews and focus groups with healthcare providers, leaders and personnel involved in clinical change processes; (2) observations and document review. Interviews and focus groups were audio-recorded and transcribed verbatim. Qualitative content analysis was used to code and categorise the data.
Results Between June and November 2016, we visited 14 maternal-newborn hospitals. Hospitals were grouped into four quadrants based on their key indicator performance and level of engagement with the Dashboard. Findings revealed four overarching themes that contribute to the varying success of sites in achieving practice change on the Dashboard key performance indicators, namely, interdisciplinary collaboration and accountability, application of formal change strategies, team trust and use of evidence and data, as well as alignment with organisational priorities and support.
Conclusion The diversity of facilitators and barriers across the 14 hospitals highlights the need to go beyond a ‘one size fits all’ approach when implementing audit and feedback systems. Future work to identify tools to assess barriers to practice change and to evaluate the effects of cointerventions to optimise audit and feedback systems for clinical practice change is needed.
- maternal-newborn care
- audit and feedback
- case study
- qualitative
- knowledge translation
- obstetrics
This is an open access article distributed in accordance with the Creative Commons Attribution Non Commercial (CC BY-NC 4.0) license, which permits others to distribute, remix, adapt, build upon this work non-commercially, and license their derivative works on different terms, provided the original work is properly cited, appropriate credit is given, any changes made indicated, and the use is non-commercial. See: http://creativecommons.org/licenses/by-nc/4.0
Statistics from Altmetric.com
Background
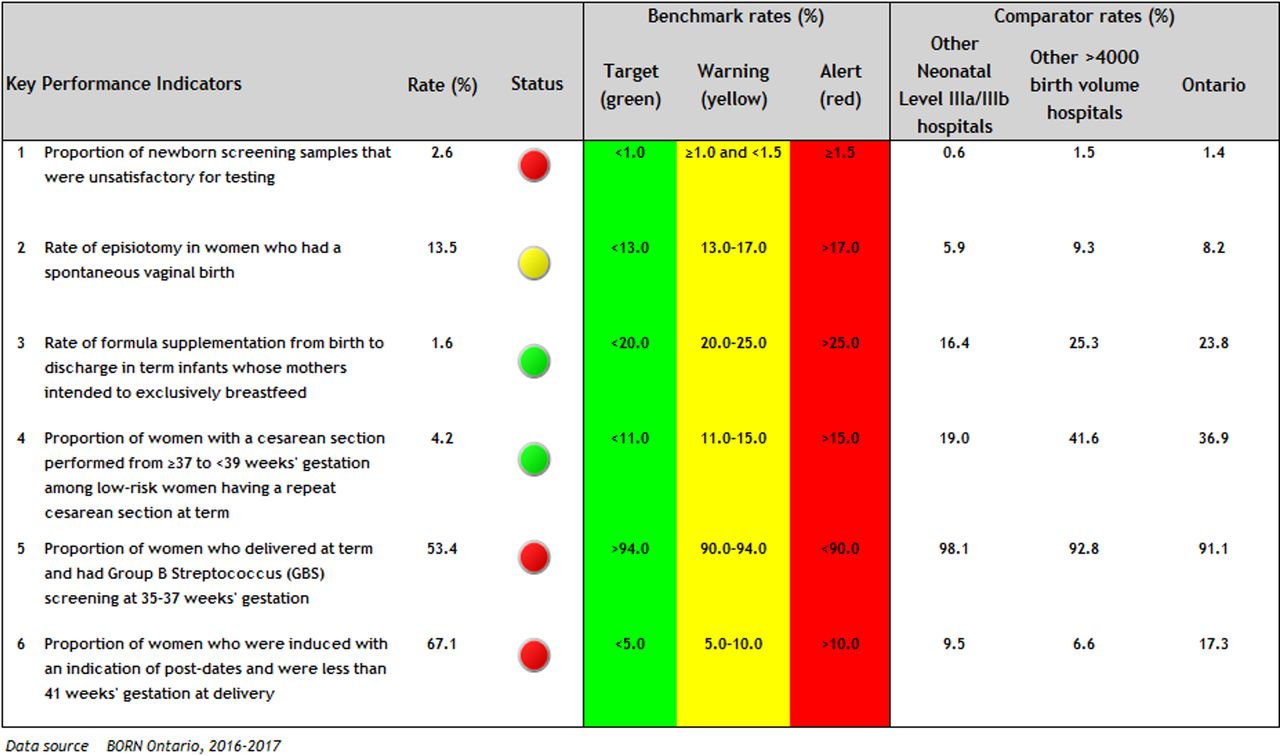
In Canada and the USA, labour/birth is the top reason for admission to hospital1 2 and wide variation in clinical practices and outcomes is observed,3 4 suggesting that optimal care is not always delivered and room for improvement exists. The Better Outcomes Registry & Network (BORN) is an internet-based data collection system operating since 2012 in all Ontario hospitals providing maternal-newborn care. Pregnancy, birth and childhood data are held in the BORN Information System, henceforth referred to as the registry, and is available to users to facilitate care. To increase awareness among Ontario maternal-newborn hospitals and care providers regarding performance and quality of care issues, BORN Ontario implemented the Maternal Newborn Dashboard (the Dashboard) within the registry in November 2012.5 The Dashboard is an electronic audit and feedback system that provides hospitals with near real-time feedback, peer comparison data and provincial benchmarks for practice change on six key performance indicators (KPIs). Following a rigorous process, the KPIs were selected for their clinical relevance, measurability using the available registry data and amenability to change.5 The associated benchmarks were established following review of the evidence, current clinical practice rates in Ontario and input from an interprofessional panel of clinical experts.5 The Dashboard home page (figure 1) provides hospital rates for each KPI, a colour signal aligned with the benchmarks and peer and provincial comparison rates. Additional data tables are also available for each KPI providing detailed information about the numerator and denominator, confidence intervals and missing data to facilitate interpretation.

Sample Maternal Newborn Dashboard homepage.
A Cochrane review reported that the use of audit and feedback interventions is associated with a median 4.3% increase in desired practice (IQR 0.5%–16%).6 Our evaluation of the Dashboard demonstrated a statistically significant absolute improvement on four out of six KPIs, with the magnitude of effect ranging from 1.5 to 11.7 per hundred at 30 months postimplementation,7 which is consistent with the 2012 Cochrane review.6 Although the Dashboard triggered improvements in care, the observed effects were variable across hospital sites and the six KPIs. The effectiveness of audit and feedback may be influenced by a variety of factors, including the nature of the clinical behaviour change, the baseline performance and the source, format and frequency of the feedback.6 Key characteristics of the Dashboard that align with recommendations to optimise the effectiveness of audit and feedback include use of timely data (ie, near real-time), ongoing and continuous feedback (ie, rather than one-off), relevant comparators (ie, by similar level of care and birth volume) and from a credible source (ie, the province’s birth registry).8
Yet even with an optimally designed intervention, it is important to consider the context in which the change is being implemented. Existing literature and knowledge translation frameworks have identified common factors influencing uptake of evidence into practice, including the attributes of the innovation and the adopters and structural and social factors within the practice environment;9–12 barriers to behaviour change;13 implementation strategies10 14 15 and the organisational receptiveness/readiness for change.10 16 In addition, a recent systematic review of qualitative studies evaluating characteristics of healthcare organisations struggling to improve quality of care identified key influencing domains including poor organisational culture, inadequate infrastructure, lack of a cohesive mission, system shocks and dysfunctional external relations.17 As such, it is important to increase our understanding of specific factors influencing hospital use of the Dashboard to develop targeted strategies to support sites to improve maternal-newborn care and outcomes. Thus, the purpose of this study was to identify factors that facilitate and impede hospitals’ use of the Dashboard to improve clinical practice and outcomes on the KPIs.
Methods
Study design
As part of a larger sequential mixed-methods study to evaluate the effect of the Dashboard on six KPIs,18 we completed a collective case study19 using a qualitative descriptive approach20 21 to facilitate comparison between diverse settings. Specifically, we aimed to understand how maternal-newborn hospitals used the Dashboard for clinical practice change and why some hospitals were successful and others were not.
Setting
The setting was Ontario, Canada. We defined a ‘case’ as an Ontario hospital providing maternal-newborn care, allowing for inclusion of both the maternal-newborn unit and the broader hospital system in which it is embedded.19 In Canada, healthcare is a publicly funded single-payer system. In Ontario specifically, there are approximately 140 000 births per year, 97% of which occur in hospital.22 Nearly 80% of hospital births are attended by obstetricians, 8% by family physicians and 10% by midwives.3
Sampling
We used a maximum variation sampling approach23 to identify hospitals reflecting different criteria (newborn level of care, birth volumes, geographic locations, KPI performance following implementation of the Dashboard).
Recruitment
Invitations were sent to the obstetrical manager/director of selected hospitals over 5 months, allowing us to examine characteristics of accepting hospitals and target specific hospitals to ensure maximum variation in sampling. Recruitment ended when sampling saturation was achieved (ie, hospitals reflecting the different criteria were recruited). Managers/directors of recruited sites were asked to identify and invite healthcare providers, hospital leaders and other personnel involved in the clinical change process to participate in the site visit. Additionally, the research team invited each hospital’s BORN Coordinator, who helps facilitate data entry into the registry, to provide feedback about their hospitals’ use of the Dashboard data during follow-up individual telephone interviews.
Data collection
We conducted 1-day to 2-day hospital site visits comprised of interviews/focus groups (online supplementary table 1), observations and document review. If participants were unable to attend an interview/focus group in person, an individual interview was conducted by telephone (n=7). Interviews and focus groups were conducted by research team members trained in qualitative data collection and who were unknown to participants. All participants signed a written consent form prior to participation. On average, focus groups, dyadic interviews (ie, with two participants),24 and individual interviews lasted 58 min, 48 min and 36 min, respectively. Interviews and focus groups were audio-recorded and transcribed verbatim. One interview participant declined to be audio-recorded so notes were taken.
Supplemental material
Managers/directors were asked to provide opportunities to observe the day-to-day activities of the maternal-newborn units and/or hospital, including unit tours and attendance at departmental meetings. Detailed notes of observations and photographs augmented the data. Last, managers/directors were asked to share relevant documents with the research team, including policies/procedures, educational materials and patient resources.
Data analysis
All transcripts were uploaded to NVivo11.25 We used conventional content analysis to code and categorise the data.26 Four research team members coded the data, with 40% of transcripts coded independently by two team members to increase trustworthiness.27 The following process was used: (1) transcript was read as a whole; (2) transcript was re-read and coded; (3) team members met after every two to three transcripts to compare coding and develop and revise the coding scheme. The codes were subsequently grouped into broader themes, which were discussed by the research team at regular meetings. After analysing the data sources for each hospital, an interpretive summary was written for the case according to predefined questions (online supplementary table 2).
Supplemental material
Next, based on emergent themes from our data, we grouped cases into four quadrants according to KPI performance (high performance (P+)/low performance (P-)) and level of engagement with the Dashboard (high engagement (E+)/low engagement (E-)) (table 1) to facilitate identification of similarities and differences among hospitals within and between quadrants.
Definitions of performance and engagement used to classify hospital sites into four quadrants
Results
We invited 31 out of 94 potential hospitals to participate in a site visit, and between June and November 2016, we visited 14 Ontario maternal-newborn hospitals (table 2), located within 9 of 14 health regions in the province. A total of 107 people participated in an interview or focus group (online supplementary table 3).
Supplemental material
Characteristics of hospitals in each quadrant
Our findings revealed four overarching themes that contribute to the varying success of sites on the Dashboard KPIs, namely, interdisciplinary collaboration and accountability, application of formal change strategies, team trust and use of evidence and data, as well as alignment with organisational priorities and support (table 3). We present a description of these overarching themes to illustrate how these factors facilitated and impeded use of the Dashboard for clinical practice change. Illustrative quotes are presented in table 4.
Themes by quadrant
Participant quotes by theme to illustrate barriers and facilitators
Interdisciplinary collaboration and accountability
High performing sites (Q1:P+/E+, Q2:P+/E-) described positive relationships between different professions such as nursing and physicians, often with a flattened hierarchy. For example, a strategy used by some sites to improve specific KPIs (such as KPI 4: caesarean sections, KPI 6: inductions) (figure 1) was to empower members of the healthcare team to communicate interprofessionally and collectively own the identified practice issue. While some sites with low performance (Q3:P-/E+, Q4:P-/E-) stated that physician caesarean section and induction bookings were not within the control of nurses, multiple high performing sites described ‘empowering’ nurses to talk to physicians about their practices as an important strategy to ensure alignment with current Dashboard recommendations.
Sites with low performance (Q3:P-/E+, Q4:P-/E-) described challenges in interprofessional relationships at their sites and a lack of interprofessional representation on committees. Several sites expressed a lack of collective accountability for practice issues. For example, nurses would state that they did not have any influence on physician practices (related to KPIs 2, 4, 5, 6) (figure 1) and some physicians stated they did not have any influence on their peers’ practices. This individualised approach was congruent with the ‘divide’ described between the different professional groups, which likely limited success on improving performance.
Application of formal change strategies
High engagement sites (Q1:P+/E+, Q3:P-/E+) gave extensive examples of strategies used to improve on KPIs. Examples included auditing specific cases contributing to red/yellow signals on the Dashboard and following up with staff, developing new policies, procedures and documentation forms as well as implementing individual-level and group-level staff-targeted education. Despite the use of a variety of strategies to improve clinical practice, a key difference between Q1 (P+/E+) and Q3 (P-/E+) that may have influenced performance was the consistent application of various change frameworks by Q1, which facilitated leaders’ ability to be with the frontline workers, identify problems and empower and coach staff to develop and implement solutions to problems. In contrast, despite the presence of a highly engaged leader, only one of the three sites in Q3 (P-/E+) identified a formal framework used for change, resulting in a less coordinated approach to clinical practice change with inconsistent involvement in the change process from the broader team.
Sites classified in Q2 (P+/E-) also did not describe a concrete process or framework for clinical practice change, with one site perceiving that change happened ‘randomly’. Yet despite this lack of formal change process, the Q2 (P+/E-) sites showed more improvement on the KPIs compared with some other sites visited, which is likely attributable to the structural characteristics of the hospital sites (eg, small teams with fewer decision makers and less ‘red tape’). In Q4 (P-/E-), there were limited examples of formal change processes initiated to target Dashboard KPIs, which likely contributed to the lack of improvement.
Team trust and use of evidence and data
High performance sites (Q1:P+/E+, Q2:P+/E-) described specific systems for entering, auditing and sharing Dashboard data. Among Q1 (P+/E+) specifically, all sites took ownership for their data quality, invested significant time to ensure that the Dashboard output was accurate and trustworthy and dedicated resources to resolving data quality issues through regular audits and staff training. These systems for improving data quality enhanced trust in the Dashboard and facilitated planning, implementing and monitoring clinical practice changes. In addition, these sites described how Dashboard data were shared systematically throughout their organisation and at regional network meetings (eg, departmental meetings, huddles, hospital display boards, email). These sites valued sharing the Dashboard data to reinforce positive practice changes, showcase successes, highlight areas for improvement related to data quality and practice changes and facilitate priority-setting. A unique finding related to data in Q2 (P+/E-) sites was that some of the improved performance on their KPIs was related to improved data entry rather than changes in clinical practice.
Conversely, in low performance sites (Q3:P-/E+, Q4:P-/E-), there were challenges related to the team’s beliefs in the evidence backing the selected KPIs and associated benchmarks and challenges related to understanding and using data. These sites questioned the evidence behind the KPI benchmarks and some gave examples of how change was limited by physicians’ belief that there would be no negative clinical impact for their patients if they did not adhere to the gestational age cut-off set for the KPI benchmarks (ie, KPI 4: caesarean section; KPI 6: inductions) (figure 1). In addition, in Q3 (P-/E+) participants demonstrated an implicit or explicit lack of knowledge regarding the intricacies of the KPIs, such as the precise definitions for the KPI numerators and denominators. Without a full understanding of such intricacies, efforts to target KPIs did not always translate into improvements on the Dashboard. In Q4 (P-/E-), there were significant concerns about the accuracy of the data and the Dashboard output, resulting in limited action to improve the clinical practice issues related to the KPIs. Mistrust in the accuracy of the Dashboard output led to a continual need to ‘prove’ there was a clinical problem before team members would consider planning and implementing quality improvement initiatives.
Of the nine sites that entered data manually, seven were classified as highly engaged. Although some of these sites discussed the time-consuming nature of manual data entry and the desire to transition to uploading data from the patient electronic record into the registry, these sites described more frequent access to and awareness of the data in the registry. For some sites, manual data entry facilitated trust in the data and the output of the Dashboard. This was especially true when team collaboration was high, and the team trusted that the people who entered the data into the registry to populate the Dashboard have done so carefully and accurately.
Alignment with organisational priorities and support
The alignment between the Dashboard and current organisational priorities and the availability of sufficient resources to implement changes influenced the extent to which sites engaged with the Dashboard system and were able to improve performance. All high engagement sites (Q1:P+/E+, Q3:P-/E+) identified how one or more of the KPIs aligned with their existing regional, institutional (eg, strategic plan or Baby Friendly Initiative accreditation) or unit priorities. This increased integration of the Dashboard and the focus on specific KPIs into current work. In addition, all sites in Q1 (P+/E+) identified key roles and individuals within their organisations that facilitated use of the Dashboard, including directors, managers, clinical educators as well as internal BORN data champions. Regardless of the specific job title, these individuals were viewed as having dedicated time, resources, skills and passion to support the team to fully use the Dashboard and facilitate clinical practice changes.
Both sites in Q2 (P+/E-) were small and experienced challenges with resources, especially with KPI 4 (caesarean sections) (figure 1). Specifically, both relied on their hospital’s main operating room and were limited to specific dates and times to conduct caesarean sections. This led to some obstetricians conducting caesarean sections prior to the recommended 39 weeks’ gestation. Neither site met the KPI 4 benchmark, largely due to resource limitations.
In Q4 (P-/E-), there was a lack of alignment between their hospital or unit priorities and the Dashboard. For instance, one site described how their hospital had prioritised growth of other clinical areas, with fewer resources for the maternal-newborn programme. Another site described investment in other maternal-newborn initiatives, leaving less capacity to target the Dashboard KPIs.
Discussion
Findings from our study revealed diverse hospital responses to and experiences with the Dashboard audit and feedback system. We identified key themes related to interdisciplinary collaboration and accountability, the application of formal change strategies, team trust and use of evidence and data, as well as alignment with organisational priorities and support. These factors influenced how engaged teams were with the Dashboard system and their performance on the six KPIs.
Our study identified barriers and facilitators to clinical practice change related specifically to the quality and use of data. In all four quadrants, we identified either facilitators or barriers to KPI improvement related to the existence of reliable data entry systems, team trust of the data entry processes and the Dashboard output, sharing of data among the team and organisation and level of understanding of the KPI definitions (ie, numerator and denominator definitions) which influenced how the data were interpreted. For audit and feedback to be effective, the information must be perceived as credible.8 Trust in the quality of the data was the most commonly identified influencing factor reported in a systematic review of use of medical registries giving information feedback to healthcare providers.28 This same barrier to change was also identified by members of our team in an earlier pilot of KPI 4 (caesarean sections) (figure 1), with some team members doubting the credibility of the hospital-level data.29 With the Dashboard, each hospital is responsible for the data that is entered in the registry and subsequently used to generate rates on the KPIs. Thus, it is within the control of each organisation to ensure data entry, and subsequent Dashboard output, is accurate and trustworthy. In our study, we identified sites with low engagement with the Dashboard, with data quality identified as a barrier to use by team members at these hospitals. Given that data quality is within the control of each hospital, it is possible that the absence of data quality improvement initiatives at these sites was related to team resistance to change or lack of knowledge and skill of how to actually improve data quality. Identifying and supporting hospitals that require assistance to train personnel and improve data entry processes may increase trust and utilisation of the Dashboard for quality improvement.
A review of 16 qualitative studies30 examining healthcare providers’ experiences using feedback from patient reported outcome measures found several themes that resonate with our findings. Like our study where participants demonstrated knowledge gaps related to understanding the intricacies of the KPI rate calculations and how to interpret them, several studies included in the review identified important ‘practical considerations’ including appropriate training and statistical support to understand the data. In addition, the review highlighted the importance of healthcare providers understanding the rationale behind collecting and using the data, as well as the significance of practitioners’ perceptions related to whether the data were a true reflection of clinical practice. In our study, sites in quadrant 1 (P+/E+) gave extensive examples of how Dashboard data are shared at multiple levels with multiple groups; this regular sharing and discussing of data likely facilitated the team’s understanding and trust of the data.
Another feature of effective audit and feedback systems is that the recommended actions are within the control of the recipient.8 Our Dashboard audit and feedback system targets six KPIs, some of which are primarily physician practices and some of which are primarily nursing or laboratory technician practices. The use of multiple KPIs targeting multiple healthcare professionals made the change process more complex and challenging for sites without an existing culture of interprofessional collaboration. At several lower performing hospitals in quadrants 3 (P-/E+) and 4 (P-/E-), we heard stories of interprofessional divides where nurses felt they did not have influence over physician driven KPIs. Yet overall, many nurses in our study spoke positively of the Dashboard and had ‘going green’ stories related to the nursing-driven KPIs. Similarly, a qualitative study31 explored the perceptions of nurses and nurse managers after implementation of unit-based dashboards. Overall, nurses responded positively to the dashboards and valued the ability to see the impact of their work on patient outcomes, the ability to track their progress over time and the ability to identify areas for improvement. In addition, a finding from a qualitative study32 exploring factors that influence success of audit and feedback in the intensive care unit setting was the importance of physician engagement—both in influencing physician practice change and in supporting nurses to implement change. This highlights the need to find strategies for professions to work collaboratively as many issues are complex and require work from the multidisciplinary team and management to achieve success. This resonates with the stories we heard in quadrant 1 (P+/E+), where increasing interprofessional communication and collaboration was a facilitator for success on KPIs. This is consistent with recommendations from the United Kingdom’s Royal College of Obstetricians and Gynaecologists which state that the entire maternity team should be engaged in monitoring dashboard indicators.33
Implications
The diversity in context within our case hospitals and in the facilitators and barriers they experienced demonstrates the challenges of implementing one audit and feedback system across an entire sector (all maternal-newborn hospitals). Assessing and addressing barriers is essential to optimise the effectiveness of audit and feedback interventions.8 A preimplementation hospital-level assessment to learn about the potential organisational barriers that may be encountered during implementation of a new dashboard or new KPI may facilitate identification of sites who need additional supports to fully use the dashboard for clinical practice change and inform development of tailored strategies to address local barriers to change. Furthermore, the use of a formal change process may facilitate implementation and monitoring of the targeted clinical practice change, particularly in high volume hospitals where the structure is larger and more complex.34
In our current study, we did not provide hospitals with action plans to guide the clinical practice change process, but several teams selected and implemented various formal change strategies and frameworks to facilitate practice change. Evidence from previous studies suggests that audit and feedback may be enhanced by the inclusion of specific action plans that provide guidance on how to improve performance.6 Other teams are exploring the effectiveness of audit and feedback augmented with additional supports such as educational outreach and implementation toolkits to assist with developing, implementing and monitoring a quality improvement plan.35 36 Cluster randomised controlled trials or quasi-experimental studies of augmented audit and feedback in maternal-newborn settings should be conducted to evaluate the effectiveness of co-interventions to optimise the effects of feedback.
Strengths and limitations
There are several important strengths of our study. We used a rigorous collective case study design to develop an in-depth understanding about how hospitals used the Dashboard and why some were successful and others were not. This study explored the use of a novel intervention to deliver audit and feedback nested within a large, province-wide birth registry in a healthcare system providing publicly-funded maternal-newborn care. Finally, we included representatives from different professional groups (eg, nursing, obstetrics, paediatrics, midwifery) as well as management, providing us with differing perspectives about barriers to use of data and practice change within 14 diverse hospital settings.
In this study, we visited 14 out of a potential 94 hospitals. Through the use of maximum variation sampling, diverse experiences were represented. Nevertheless, it is important to acknowledge that these findings are only transferable to similar contexts. In addition, while we classified the hospital sites into four quadrants to facilitate analysis of similarities and differences within and between groups, it is important to recognise that each organisation is comprised of individuals with different experiences and responses to the Dashboard. Another limitation is that several of our included sites had low birth volumes; the performance of these sites needs to be interpreted with caution since there was the possibility that colour changes on their Dashboard could simply be because small changes in either numerators or denominators could result in large changes in the KPI rates. The use of a qualitative case study design, however, allowed us to speak with team members at enrolled hospitals to help provide the context surrounding changes in performance on the KPIs, including the unique perspectives of these smaller sites.
Conclusion
The diversity of facilitators and barriers experienced across the 14 hospitals we visited highlights the need to go beyond a ‘one size fits all’ approach when implementing audit and feedback systems. There is a need to identify tools to assess likely barriers to practice change, to develop formal change processes and to evaluate the effects of cointerventions to optimise the effects of audit and feedback systems for clinical practice change in maternal-newborn care.
References
Footnotes
Contributors SID and MCW are coprincipal investigators for the described study. SID, AES, IDG, JMG, WEP, EKD, DBF, JH, GNS, MT, MCW contributed to the conceptualisation and the design of the study. JR, HO, JW, AQ visited the hospital sites and collected and coded all data. JR, HO, JW, AQ, SID, IDG, WEP, DW contributed to analysing the data. JR and SID drafted the initial manuscript. All authors participated in the writing of this manuscript and reviewed and approved the final manuscript.
Funding This study was funded by the Canadian Institutes of Health Research (CIHR-FRN: 133576) and the Ontario Ministry of Health and Long-Term Care (MOHLTC—#06684). IDG is a recipient of a CIHR Foundation grant (FDN# 143237). JMG is a recipient of a CIHR Foundation grant (FDN# 143269). MCW is a recipient of a CIHR Foundation grant (FDN# 148438).
Disclaimer The funding bodies had no role in study design, data collection, analysis, interpretation of data or the decision to submit this or future manuscripts for publication.
Competing interests None declared.
Patient consent for publication Not required.
Ethics approval Children's Hospital of Eastern Ontario Research Ethics Board (#13/218X) and University of Ottawa Research Ethics Board (#A01-14-03).
Provenance and peer review Not commissioned; externally peer reviewed.
Data sharing statement The data analysed during this study (ie, interview and focus group transcripts, photographs and hospital documents) are not publicly available due to them containing information that could compromise research participant privacy/consent.