Article Text

Abstract
Objective To characterise gut microbiome in patients with hepatocellular carcinoma (HCC) and evaluate the potential of microbiome as non-invasive biomarkers for HCC.
Design We collected 486 faecal samples from East China, Central China and Northwest China prospectively and finally 419 samples completed Miseq sequencing. We characterised gut microbiome, identified microbial markers and constructed HCC classifier in 75 early HCC, 40 cirrhosis and 75 healthy controls. We validated the results in 56 controls, 30 early HCC and 45 advanced HCC. We further verified diagnosis potential in 18 HCC from Xinjiang and 80 HCC from Zhengzhou.
Results Faecal microbial diversity was increased from cirrhosis to early HCC with cirrhosis. Phylum Actinobacteria was increased in early HCC versus cirrhosis. Correspondingly, 13 genera including Gemmiger and Parabacteroides were enriched in early HCC versus cirrhosis. Butyrate-producing genera were decreased, while genera producing-lipopolysaccharide were increased in early HCC versus controls. The optimal 30 microbial markers were identified through a fivefold cross-validation on a random forest model and achieved an area under the curve of 80.64% between 75 early HCC and 105 non-HCC samples. Notably, gut microbial markers validated strong diagnosis potential for early HCC and even advanced HCC. Importantly, microbial markers successfully achieved a cross-region validation of HCC from Northwest China and Central China.
Conclusions This study is the first to characterise gut microbiome in patients with HCC and to report the successful diagnosis model establishment and cross-region validation of microbial markers for HCC. Gut microbiota-targeted biomarkers represent potential non-invasive tools for early diagnosis of HCC.
- hepatocellular carcinoma
- liver cirrhosis
- gut microbiota
- early diagnosis
This is an open access article distributed in accordance with the Creative Commons Attribution Non Commercial (CC BY-NC 4.0) license, which permits others to distribute, remix, adapt, build upon this work non-commercially, and license their derivative works on different terms, provided the original work is properly cited, appropriate credit is given, any changes made indicated, and the use is non-commercial. See: http://creativecommons.org/licenses/by-nc/4.0/.
Statistics from Altmetric.com
Significance of this study
What is already known on this subject?
Hepatocellular carcinoma (HCC) is the third leading cause of cancer-related death worldwide due to the poor prognosis, high incidence and postsurgical recurrence.
The gut microbiota promotes HCC development by the microbiota-liver axis in HCC animal models, but microbial characteristics in patients with HCC have not been reported.
The concept of the gut microbiome serving as a tool towards for achieving targeted non-invasive biomarkers for specific diseases or cancer, including type 2 diabetes, liver cirrhosis and colorectal cancer, has been established by compelling studies, but it is unclear whether gut microbial markers could discriminate HCC.
What are the new findings?
Faecal microbial diversity was decreased from healthy controls to cirrhosis, but it was increased from cirrhosis to early HCC with cirrhosis.
Butyrate-producing bacterial genera were decreased, while genera producing-lipopolysaccharide were increased in early HCC versus healthy controls.
The optimal 30 microbial markers were identified through a fivefold cross-validation on a random forest model and achieved an area under the curve of 80.64% between 75 early HCC and 105 non-HCC samples.
Gut microbial markers validated strong diagnosis potential for early HCC and even advanced HCC. Importantly, microbial markers successfully achieved a cross-region validation of HCC from Northwest China and Central China.
Significance of this study
How might it impact on clinical practice in the foreseeable future?
This is the first report to illustrate gut microbial characteristics in patients with early HCC through large-cohort Miseq sequencing.
Gut microbial alterations may contribute to the development of HCC, which implies that the changed gut microbiota may represent a potential target to prevent HCC development by the gut-microbiota-liver axis.
This study is the first to report the successful diagnosis model establishment and cross-region validation of microbial markers for HCC, notably including data from three different regions of China. Gut microbiota-targeted biomarkers represent potential non-invasive tools for early diagnosis of HCC.
Introduction
Hepatocellular carcinoma (HCC) is the third leading cause of cancer-related death worldwide.1 2 Currently, there are an estimated 29 200 new HCC cases in males and 11 510 cases in females in the USA in 2017.3 More seriously, estimated new HCC cases achieved 343 700 in males and 122 300 in females in China in 2015,4 which is mainly attributed to the prevalence of hepatitis B virus (HBV) persistent infection and HBV-induced cirrhosis. Due to the absence of specific symptoms in early stages and the lack of early diagnostic markers, most patients with HCC are often diagnosed in an advanced stage with poor prognosis (the overall ratio of mortality to incidence is 0.95).5 6 Therefore, novel diagnostic markers for early HCC and new therapeutic strategies are urgently needed to improve the prognosis of this population.
The human gut microbiota have been considered the most important microecosystem living in symbiosis with the body.7–11 It is identified as a crucial determinant of intestinal inflammation and as a key player in chronic inflammatory liver diseases.12 Gut microbial alterations contribute to the onset and progression of alcoholic liver disease, non-alcoholic fatty liver disease,13 liver cirrhosis and its complications.14 Recent studies in animal models indicate that the intestinal microbiota promote HCC development through the gut microbiota-liver axis.15 16 However, until now, gut microbial characteristics in clinical patients with HCC have not yet been reported.
The concept of gut microbiome serving as a non-invasive diagnosis tool for specific diseases or cancer, including type 2 diabetes (T2D)17 and colorectal cancer (CRC),18 has been established by compelling studies. We previously established an accurate patient discrimination index based on 15 gene biomarkers of the gut microbiome in 98 patients with cirrhosis and 83 healthy controls19 and demonstrated that gut microbial markers achieved a high classification power for pancreatic carcinoma (PC) by 16S rRNA Miseq sequencing, suggesting microbial marker as a non-invasive diagnostic tool.20 However, the diagnosis potential of gut microbiome for HCC has not been evaluated. In this study, a total of 486 faecal samples from East China, Central China and Northwest China were prospectively collected. Finally 419 samples were enrolled and subjected to 16S rRNA Miseq sequencing. In the discovery phase, 75 healthy controls, 40 patients with cirrhosis and 75 patients with early HCC with cirrhosis characterised gut microbiome and constructed diagnostic model for early HCC. Furthermore, the validation cohort and independent diagnosis cohorts were used to evaluate the potential of the gut microbiome as a non-invasive biomarker for HCC.
Material and methods
Participant information
The study was designed according to the principle of the PRoBE design (prospective specimen collection and retrospective blinded evaluation).21 It was performed in accordance with the Helsinki Declaration and Rules of Good Clinical Practice. The study was approved by the Institutional Review Board of the First Affiliated Hospital, School of Medicine, Zhejiang University (2014–334); the First Affiliated Hospital of Zhengzhou University (2017-XY-002) and the First Affiliated Hospital of Xinjiang Medical University. All participants signed written informed consents on enrolment.
A total of 486 faecal samples from East China, Central China and Northwest China were prospectively collected, and finally 419 samples were included and subjected to 16S rRNA Miseq sequencing. Participants’ demographics, clinicopathological data, CT scan, histopathology images and diet habit were collected from hospital electronic medical records and questionnaires (online supplementary table S1). Detailed diagnostic criteria and inclusion and exclusion criteria of the participants are described in the online supplementary methods.
Supplementary file 1
Supplementary file 2
Faecal sample collection and DNA extraction
Each individual provided a fresh tail stool sample at 06:30–08:30 hours. Each stool sample completed faecal routine testing. The sample was divided into five aliquots of 200 mg and immediately stored at −80°C. DNA extraction was conducted as we previously described.22 23 The details are described in the online supplementary methods.
Stool moisture measurement
Stool consistency was assessed using stool routine testing results. Stool moisture content was determined in duplicate on the frozen homogenised faecal material (−80°C) as the percentage of stool mass loss after lyophilisation (Labconco FreeZone, LABCONCO, USA).24
PCR amplification, MiSeq sequencing and Sequence data process
Extracted DNA samples were amplified, DNA libraries were constructed and the sequencing was performed on an IlluminaMiSeq platform by Shanghai Itechgene Technology, China. Amplified reads were processed. The details are described in the online supplementary methods. Raw Illumina read data for all samples were deposited in the European Bioinformatics Institute European Nucleotide Archive database under accession number PRJEB8708.
Operational Taxonomy Units (OTUs) clustering and taxonomy annotation
We randomly chose the reads from all samples with equal number, and OTUs were binned by the UPARSE pipeline.25 The details are described in the online supplementary methods. All OTUs for all samples in the discovery set, validation sets and independent diagnosis sets were collected. We annotated the sequences using RDP classifier V.2.626 according to the developer’s documents (http://rdp.cme.msu.edu/classifier/class_help.jsp#conf), and all OTUs annotations are listed in the online supplementary table S2.
Bacterial diversity and taxonomic analysis
Bacterial diversity was determined by sampling-based OTUs analysis and presented by Shannon index, Simpson index and Invsimpson index, which was calculated using R program package ‘vegan’.27 The details are listed in the online supplementary table S3. Principal coordinates analysis (PCoA) was conducted by R package (http://www.R-project.org/) to display microbiome space between samples. The weighted and unweighted unifrac distances were calculated with the phyloseq package.28 A heatmap of the identified key variables was completed by the Heatmap Builder.
Bacterial taxonomic analyses and comparison including bacterial phylum and genus were conducted between two groups using Wilcoxon rank sum test. Faecal microbial characterisation were analysed by linear discriminant analysis (LDA) effect size (LEfSe) method (http://huttenhower.sph.harvard.edu/lefse/) e/).29 Based on the normalised relative abundance matrix, features with significantly different abundances between assigned taxa were determined by LEfSe with Kruskal-Wallis rank sum test (p<0.05) and LDA was used to assess the effect size of each feature (LDA score (log10)=2 as cut-off value).30
OTU biomarker identification and probability of disease (POD) construction
We mapped reads from the discovery phase, validation phase and independent diagnosis phase against these represented sequences to generate the discovery OTU frequency profile, validation OTU frequency profile and independent diagnosis frequency profile, respectively. Wilcoxon test was used to determine the significance (p<0.05), based on which 57 OTU biomarkers were selected for further analysis. Fivefold cross-validation was performed on a random forest model (R 3.4.1, randomForest 4.6–12 package) with default parameters except for ‘importance=TRUE’ using the 57-OTU abundance profile of training cohort, including 75 healthy controls and 40 patients with liver cirrhosis (assigned as non-HCC cohort) and 75 patients with HCC, as previously described.31 32 Using five trials of the fivefold cross-validation, we then obtained the cross-validation error curve. The point with the minimum cross-validation error was viewed as the cut-off point, and the cut-off value was determined via the minimum error plus the SD at the corresponding point. We listed all sets (≤30) of OTU markers with the error less than the cut-off value and chose the set with the smallest number of OTUs as the optimal set. POD index was defined as the ratio between the number of randomly generated decision trees that predicted sample as ‘HCC’ and that of healthy controls. The identified optimal set of OTUs was finally used for the calculation of POD index for both the training and testing cohort. And the receiver operating characteristic (ROC) curve was obtained (R 3.3.0, pROC package) for the evaluation of the constructed models, and the area under the ROC curve (AUC) was used to designate the ROC effect. The detailed script of microbial marker identification and POD construction can be found in the online supplementary methods.
Statistical analysis
One-way analysis of variance was used to evaluate the differences among the three groups. Continuous variables were compared using the Wilcoxon rank sum test between both groups. Fisher’s exact test compared categorical variables. Statistical analyses were performed using SPSS V.20.0 for Windows (SPSS, Chicago, Illinois, USA).
Results
A total of 486 faecal samples from East China, Central China and Northwest China were prospectively collected. After a strict pathological diagnosis and exclusion process, 150 patients with HCC, 40 patients with cirrhosis and 131 healthy controls were included and randomly divided into the discovery phase and the validation phase (figure 1). In the discovery phase, we characterised gut microbiome among 75 early HCC with cirrhosis, 40 cirrhosis and 75 healthy controls and identified microbial markers and constructed HCC classifier by random forest model between the early HCC cohort and non-HCC cohort (cirrhosis and healthy controls). In validation phase, 56 controls, 30 early HCC and 45 advanced HCC were used to validate diagnosis efficacy of HCC classifier. Moreover, 18 patients with HCC from Xinjiang and 80 HCC from Zhengzhou were served as independent diagnostic phase to verify the potential of the HCC classifier.

Study design and flow diagram. A total of 486 faecal samples from East China, Central China and Northwest China were prospectively collected. After a strict pathological diagnosis and exclusion process, 150 patients with HCC, 40 patients with cirrhosis and 131 healthy controls were included and randomly divided into the discovery phase and validation phase. In the discovery phase, we characterised gut microbiome among 75 early HCC with cirrhosis, 40 cirrhosis and 75 healthy controls and identified microbial markers and constructed HCC classifier by random forest model between the early HCC cohort and non-HCC cohort (cirrhosis and healthy controls). In validation phase, 56 controls, 30 early HCC and 45 advanced HCC were used to validate diagnosis efficacy of HCC classifier. Moreover, 18 patients with HCC from Xinjiang and 80 HCC from Zhengzhou served as independent diagnostic phase. HCC, hepatocellular carcinoma.
Characteristics of the participants
In the discovery cohort, clinical characteristics of the participants including age, gender and body mass index were matched among the three groups. Serum alpha-fetoprotein level was significantly increased in patients with early HCC versus controls and cirrhosis (table 1). Serum levels of alanine aminotransferase, aspartate aminotransferase, glutamyl transpeptidase, total bilirubin and direct bilirubin were markedly increased, while the concentrations of total protein, albumin and platelets were significantly decreased in patients with early HCC versus controls (table 1).
Clinical characteristics of the enrolled participants in discovery phase
Stool form scale and moisture
Stool consistency and moisture are strongly associated with gut microbiota richness and composition, enterotypes and microbial markers.24 33 34 Thus, we first assessed stool form scale based on stool routine testing and measured stool moisture by lyophilisation assay on the frozen homogenised faecal material (online supplementary table S4). Benefit from the unified sample collection protocol, stool character in all samples from the discovery cohort and validation cohort were soft. In stool colour, most of stool samples presented yellow and showed no significant difference among early HCC, liver cirrhosis and healthy controls in the discovery phase and among controls, early HCC, advanced HCC, Xinjiang samples and Zhengzhou samples in the validation phase (online supplementary figure S1). Moreover, in terms of stool moisture, there were no significant difference among early HCC, liver cirrhosis and healthy controls in the discovery phase, and among controls, early HCC, advanced HCC, Xinjiang samples and Zhengzhou samples in the validation phase (online supplementary figure S2).
Supplementary file 3
Increased gut microbial diversity in early HCC
Rarefaction analysis based on the discovery cohort showed that estimated OTUs richness basically approached saturation in each group, and it was significantly decreased in liver cirrhosis (n=40) versus healthy controls (n=75) and was increased in early HCC (n=75) versus cirrhosis (figure 2A). Compared with the controls, faecal microbial diversity, as estimated by Shannon index, Simpson index and Invsimpson index, was significantly decreased in liver cirrhosis (p=0.0011, 0.0007 and 0.0007, respectively). In contrast, microbial diversity was markedly increased in early HCC versus liver cirrhosis (p=0.0234, 0.0068 and 0.0068, respectively) (figure 2B–D).

Increased faecal microbial diversity in patients with eHCC (n=75) versus patients with cirrhosis (n=40). (A) Shannon-Wiener curves between number of samples and estimated richness. The estimated OTUs richness basically approached saturation in all samples. Compared with the controls, faecal microbial diversity, as estimated by the Shannon index (B), Simpson index (C) and Invsimpson index (D), was significantly decreased in patients with liver cirrhosis (p=0.0011, 0.0007 and 0.0007, respectively). In contrast, microbial diversity was markedly increased in patients with eHCC versus patients with liver cirrhosis (p=0.0234, 0.0068 and 0.0068, respectively). (E) A Venn diagram displaying the overlaps between groups showed that 524 of the total richness of 932 OTUs were shared among the three groups, while 564 of 843 OTUs were shared between cirrhosis and eHCC. (F) Beta diversity was calculated using weighted UniFrac by PCoA, indicating a symmetrical distribution of faecal microbial community among all the samples. eHCC, early HCC; HCC, hepatocellular carcinoma; LC, liver cirrhosis; OTUs, Operational Taxonomy Units; PCoA, principal coordinates analysis.
Moreover, a Venn diagram displaying the overlaps between groups showed that 524 of the total 932 OTUs were shared among the three groups, while 564 of 843 OTUs were shared between the cirrhosis and early HCC (figure 2E). Notably, 90 of 932 OTUs were unique for early HCC. To display microbiome space between samples, beta diversity was calculated using weighted UniFrac, and PCoA analysis indicated a symmetrical distribution of faecal microbial community among all samples (figure 2F).
Phylogenetic profiles of faecal microbial communities in early HCC
Phylotypes with a median relative abundance larger than 0.01% of total abundance were included for comparison. To identify key OTUs phylotypes in early HCC, OTUs abundance were analysed by Wilcoxon rank-sum test with Benjamini-Hochberg method. A total of 110 OTUs were identified as key lineages for early HCC, and their abundance and distribution are shown in the online supplementary figure S3 (online supplementary table S5).
Bacterial phyla of Bacteroidetes, Firmicutes and Proteobacteria, together accounting for up to 90% of sequences on average, were the three dominant populations in three groups (figure 3A). Faecal microbial composition in each sample from three groups at the phylum and genus levels are presented in the online supplementary figure S4A,B. Average composition of bacterial community at the phylum and genus levels are shown in the figure 3A and B, respectively.

Phylogenetic profiles of gut microbes among patients with eHCC with cirrhosis (n=75), patients with liver cirrhosis (n=40) and healthy controls (n=75). Composition of faecal microbiota at the phylum level (A) and genus level (B) among the three groups. The increased microbial community at the phylum level (C) and genus level (D) in eHCC with cirrhosis versus liver cirrhosis. The decreased microbial community at the phylum level (E) and genus level (F) in patients with eHCC with cirrhosis versus healthy controls. (G) The increased microbial community at the genus level in patients with eHCC with cirrhosis versus healthy controls. The box presented the 95% CIs; the line inside denotes the median, and the symbol ‘+’ denotes the mean value. eHCC, early HCC; HCC, hepatocellular carcinoma; LC, liver cirrhosis.
Compared with liver cirrhosis, phylum Actinobacteria was significantly increased in early HCC (p=0.0049, figure 3C, online supplementary table S6). Correspondingly, 13 genera including Gemmiger, Parabacteroides and Paraprevotella were enriched in early HCC versus liver cirrhosis (all p<0.05, figure 3D, online supplementary table S7). Compared with controls, phylum Verrucomicrobia was decreased in early HCC (p=0.0348, figure 3E). At the genus level, 12 genera, including Alistipes, Phascolarctobacterium and Ruminococcus were significantly decreased, while 6 genera, including Klebsiella and Haemophilus were increased in early HCC versus controls (all p<0.05, figure 3F,G, online supplementary table S8). Moreover, bacterial difference at the phylum and genus levels between liver cirrhosis and controls were compared and are shown in the online supplementary figure S5A–C.
To identify specific bacterial taxa associated with early HCC, we compared faecal microbiota using LEfSe. A cladogram representative of faecal microbial structure and their predominant bacteria displayed the greatest differences in taxa between liver cirrhosis and early HCC (all p<0.05, online supplementary figure S6). Meanwhile, the cladogram of faecal microbial structure between early HCC and healthy controls also showed the greatest differences in taxa (all p<0.05, online supplementary figure S7), which suggested gut microbial dysbiosis in early HCC.
Identification of microbial OTUs-based markers of early HCC
To illustrate the diagnostic value of faecal microbiome for early HCC, we constructed a random forest classifier model that could specifically identify early HCC samples from non-HCC samples. To detect unique OTUs markers of early HCC, we conducted a fivefold cross-validation on a random forest model between 75 early HCC and 105 non-HCC samples (40 cirrhosis and 75 controls) in the discovery phase. The result indicated that the 30 OTU markers were selected as the optimal marker set (figure 4A). The relative abundance of the 30 OTUs markers in each sample from the discovery phase were presented (online supplementary table S9). The corresponding bacterial genera of the 30 OTUs markers are listed in the online supplementary table S10. The POD index was calculated using the identified optimal 30 OTUs set for both the discovery cohort (online supplementary table S11) and the validation cohort (online supplementary table S12).
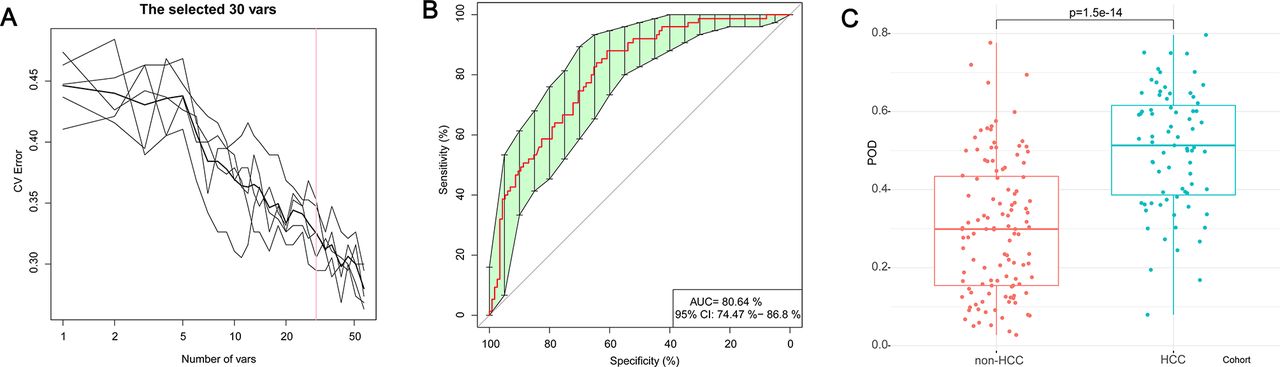
Identification of microbial OTUs-based markers of early HCC by random forest models. To detect unique OTUs markers of early HCC, we conducted a fivefold cross-validation on a random forest model between 75 early HCC and 105 non-HCC samples (40 cirrhosis and 75 controls) in the discovery set. (A) The 30 OTUs markers were selected as the optimal marker set by random forest models. (B) The POD index achieved an AUC value of 80.64% with 95% CI of 74.47% to 86.80% between early HCC and non-HCC cohorts in the discovery phase. (C) The POD value was significantly increased in the early HCC samples versus the non-HCC samples (p=1.5×10⁻¹⁴). AUC, area under the curve; CV Error, the cross-validation error; HCC, hepatocellular carcinoma; OTUs, Operational Taxonomy Units; POD, probability of disease.
In the discovery phase, the POD index achieved an AUC value of 80.64% with 95% CI of 74.47% to 86.8% between early HCC and non-HCC cohorts (figure 4B). The POD value was significantly increased in the early HCC samples versus the non-HCC samples (p=1.5×10⁻¹⁴, figure 4C). These data suggested that the POD based on microbial OTUs markers achieved a powerful diagnostic potential for early HCC cohort from the non-HCC cohort.
Validation and independent diagnosis of microbial markers for HCC
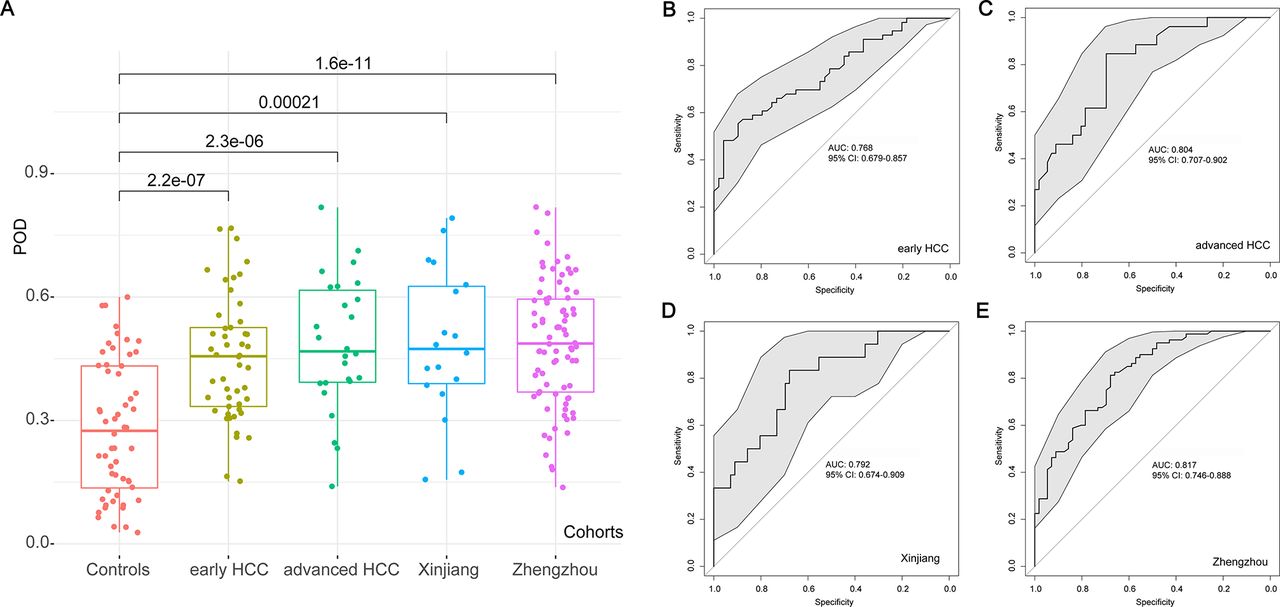
In the validation phase, the 56 controls, 30 early HCC and 45 advanced HCC were used to validate the diagnostic efficacy of the POD for HCC. Each POD of each patient was calculated and the corresponding values are shown in the online supplementary table S12. The average POD value was significantly increased in the 30 patients with early HCC versus 56 controls (p=2.2×10⁻⁷, figure 5A), and the POD achieved an AUC value of 76.80% (95% CI 67.90% to 85.70%) between early HCC and controls (figure 5B), which validated a significant diagnostic potential for early HCC. To illustrate the specificity of the POD on HCC, we further enrolled patients with advanced HCC to validate the diagnostic potential. The result indicated that the POD value was significantly higher in the 45 patients with advanced HCC than that in the 56 controls (p=2.3×10⁻⁶, figure 5A), and the POD achieved an AUC value of 80.40% (95% CI 70.70% to 90.20%) between the advanced HCC and controls (figure 5C), which suggested an obvious diagnosis efficacy for advanced HCC.
Validation and independent diagnosis of microbial markers for HCC. (A) Each POD of each participant from the different cohorts was calculated and the average POD values were compared between the controls and the other HCC cohorts in the validation phase and the independent diagnosis phase. (B) The POD achieved an AUC value of 76.80% (95% CI 67.90% to 85.70%) between early HCC and controls in the validation phase. (C) The POD achieved an AUC value of 80.40% (95% CI 70.70% to 90.20%) between the advanced HCC and controls in the validation phase. (D) The POD achieved an AUC value of 79.20% (95% CI 67.40% to 90.90%) between the 18 HCC from Xinjiang and controls in the independent diagnosis phase. (E) The POD achieved an AUC value of 81.70% (95% CI 74.60% to 88.80%) between the 80 HCC from Zhengzhou and controls in the independent diagnosis phase. AUC, area under the curve; HCC, hepatocellular carcinoma; POD, probability of disease.
In addition, to further confirm the diagnosis potential and subject range of the POD, 18 patients with HCC from Xinjiang (Northwest China) and 80 patients with HCC from Zhengzhou (Central China) were served as independent diagnostics to verify the POD reliability. The average POD value was significantly increased in the 18 HCC from Xinjiang (p=0.00021) and 80 HCC from Zhengzhou (p=1.6×10⁻¹¹) versus 56 controls (figure 5A), and the POD achieved an AUC value of 79.20% (95% CI 67.40% to 90.90%) between the 18 HCC from Xinjiang and controls (figure 5D) and an AUC value of 81.70% (95% CI 74.60% to 88.80%) between the 80 HCC from Zhengzhou and controls (figure 5E). These results indicated a powerful diagnostic efficacy of the POD based on microbial markers for patients with HCC from Northwest China and Central China.
Stool moisture is a key covariate in microbiome space and marker construction,24 33 thus we further combined the stool moisture with the 30 OTUs markers as key variables to construct the final POD model and compared the diagnosis potential of the two POD models among the different cohorts. In the discovery phase, the AUC values of the POD based on the 30 OTUs markers with or without moisture between early HCC and non-HCC cohorts presented no significant difference (online supplementary figure S8A). Notably, the POD values based on the 30 OTUs markers with or without moisture showed no obvious difference in the different cohorts from the discovery phase, validation phase or independent diagnosis phase (online supplementary figure S8B and figure S9). These results may be attributed to the uniform and consistent character of the tailed stool.
Furthermore, we compared diagnostic efficacy of our microbial markers for HCC between female and male participants, and the results indicated no significant difference in the POD values between females and males from the different cohorts (online supplementary figure S10), suggesting that this model is still valid when focus on males or females.
Discussion
Our study is the first to report the successful diagnostic model establishment and cross-region validation of microbial OTUs markers for HCC, notably including large cohort data from three different regions of China. The concept of the gut microbiome serving as a tool towards targeted non-invasive biomarkers for specific diseases or cancer has been established by compelling studies. Qin et al identified and validated 60 000 microbial markers associated with T2D, demonstrating the usefulness of microbial markers for classifying T2D.17 Yu et al presented the metagenomic profiling of CRC faecal microbiomes to discover and validate microbial biomarkers in ethnically different cohorts, indicating an affordable non-invasive early diagnostic biomarkers for CRC from faecal samples.18 Our previous study looked at gut microbial alterations in liver cirrhosis in 98 patients and 83 healthy controls and established an accurate patient discrimination index based on 15 microbial biomarkers, indicating microbiota-targeted biomarkers as a powerful tool for liver cirrhosis diagnosis.19 We previously proposed that gut microbial variation might predict acute rejection in early phase and become an assistant therapeutic target to improve rejection after liver transplantation.22 Based on 16S ribosomal RNA, microbial gene used five OTUs could classify CRC from healthy samples in a cohort from the USA.35 Our recent study also demonstrated that based on 40 genera associated with PC, gut microbial markers achieves a high classification power by 16S rRNA Miseq sequencing, suggesting microbial markers as a non-invasive diagnosis tool for PC.20
In our study, a total of 486 faecal samples from different regions of China were collected, and finally 419 samples were analysed using 16S rRNA Miseq sequencing. The optimal 30 specific OTUs markers for early HCC were identified by random forest models, and the POD based on the 30 OTUs markers achieved powerful classification potential for distinguishing early HCC from non-HCC cohort. Importantly, the POD based on microbial markers validated significant diagnostic potential for early HCC and even advanced HCC. More importantly, the POD successfully achieved a cross-region validation of patients with HCC from Northwest China and Central China. The shared microbial markers between cohorts from East China, Central China and Northwest China suggest that even though different regional populations may have different microbial community structures, signatures of HCC-associated microbial dysbiosis could have universal features, which present a similar trend to the gut microbial distribution and characteristics of CRC.18 These results indicated that gut microbiota-targeted biomarkers may become potential non-invasive tools for early diagnosis of HCC.
Recent studies have reported that gut microbiota could promote HCC development through the microbiota-liver axis in animal models,15 16 while probiotics could suppress HCC growth by modulating gut microbiota in mice.36 This study is the first report to illustrate gut microbial characteristics in patients with early HCC. We found that faecal microbial diversity was decreased from healthy controls to cirrhosis, but it was increased from cirrhosis to early HCC with cirrhosis. These results indicated a significant global shift in gut microbiota from cirrhosis to HCC and the altered microbial community might play an important role during HCC initiation and development. During the development along the colorectal adenoma–carcinoma sequence, the gut microbiome richness was increased in colorectal carcinoma versus adenoma.32 Thus, greater richness or diversity in the bacterial community is not a sign of a healthy gut microbiota in our cohort, but likely suggested the overgrowth of various harmful bacteria or archaea in patients with HCC.
Gut microbial alteration in chronic diseases including T2D,17 inflammatory bowel diseases,37 38 colorectal adenoma–carcinoma sequence32 and liver cirrhosis23 is unique for each disease. Different diseases display relatively characteristic microbial profile.19 Gut microbiota presented a moderate dysbiosis, presenting a decrease of butyrate-producing bacteria and an increase in various opportunistic pathogens in patients with T2D.17 In patients with early HCC in our study, the genera Ruminococcus, Oscillibacter, Faecalibacterium, Clostridium IV and Coprococcus, belonging to butyrate-producing bacterial families39 were decreased, while Klebsiella and Haemophilus, producing lipopolysaccharide (LPS), were increased compared with controls. As the major energy source of the intestinal mucosa, butyrate is considered an important regulator of gene expression, inflammation, differentiation and apoptosis in host cells and plays a key role in bacterial energy metabolism and gut health.40 Thus, the decrease in butyrate-producing bacteria may promote intestinal mucosal destruction, thereby contributing to HCC development. The increase in LPS initiates various pathophysiological cascades.41 High levels of LPS activate NF-κB pathway, produce proinflammatory cytokines (TNF-α, IL-6 and IL-1) and lead to liver inflammatory and oxidative damage,42 thereby promoting HCC development.15 Notably, the decrease of Verrucomicrobia is likely attributed to the decrease of Akkermansia in the early HCC. Akkermansia muciniphila is a Gram-negative anaerobic commensal that uses host-derived mucins as carbon and nitrogen source43 and promotes barrier function partly by enhancing mucus production. Akkermansia muciniphila is decreased during obesity and diabetes,44 45 and its daily administration can counteract the development of high-fat diet-induced obesity and gut barrier dysfunction.44 Plovier et al further indicate that a purified membrane protein from Akkermansia muciniphila or the pasteurised bacterium improves metabolism in obese and diabetic mice.46 Recovery of ethanol-induced Akkermansia muciniphila depletion ameliorates alcoholic liver disease.47 In short, the decrease of bacteria protecting intestinal mucosa and barrier function (butyrate-producing bacteria, Akkermansia and so on), and the increase of LPS-producing bacteria in the early HCC, together contributed to HCC development. These data imply that the changed gut microbiota may represent a potential target to monitor and prevent HCC development by the gut-microbiota-liver axis.
We have demonstrated characteristic changes in the gut microbiota in early HCC across a large clinical cohort, illustrated crucial bacterial candidates that may contribute to HCC development, identified specific microbial markers and validated their diagnostic efficacy in the three cohorts from three different regions of China. Thus, we propose that gut microbiota-targeted biomarkers may become potential non-invasive tools for early diagnosis of HCC. Systematic investigation of the key bacterial genus or species by metagenomic sequencing may further improve the diagnostic value for HCC. The combination of microbial markers and currently used diagnostic approaches may further benefit HCC populations. The validation of gut microbial markers in much larger cohorts from different ethnic populations or different countries may further promote the efficacy and stability of HCC diagnosis. The ultimate goal would be to identify faecal microbial markers with strong diagnostic power to detect early HCC, which may further achieve early diagnosis and early therapy for HCC.
Acknowledgments
We thank Dr Nan Qin and Zhongwen Wu (the First Affiliated Hospital, School of Medicine, Zhejiang University), Dr Juan Li and Qingmiao Shi (the First Affiliated Hospital of Zhengzhou University) for help in samples collection and thank Dr Hongyan Ren (Shanghai Itechgene Technology Co. Ltd., China) for Miseq sequencing. We also thank clinical doctors from the First Affiliated Hospital, School of Medicine, Zhejiang University, the First Affiliated Hospital of Zhengzhou University and the First Affiliated Hospital of Xinjiang Medical University. We also thank the generous volunteer subjects who enrolled in the study.
References
Footnotes
ZR, AL, JJ, LZ and ZY contributed equally.
Contributors Study concept and design: SZ, LL and QK. Acquisition of data: ZR, JJ, LZ, ZY, HL, XC, RZ, SX, HZ, XC and GC. Analysis and interpretation of data: AL, LS and RS. Technical and material support: LZ, HX, ZY and HW. Drafting of the manuscript: ZR, GC and JL.
Funding This study was sponsored by grants from National S&T Major Project of China (2017ZX10203205 and 2018ZX10301201), Innovative Research Groups of National Natural Science Foundation of China (81721091), National Natural Science Foundation of China (81600506, 81672422, 81702757 and 81702346), Major program of National Natural Science Foundation of China (91542205) and China Postdoctoral Science Foundation (2017464 and 20182814), Open Project in State Key Laboratory for Diagnosis and Treatment of Infectious Disease (2015KF03), Natural Science Foundation of Zhejiang Province (LY15H160033), Zhejiang Province Health Department Program (2014KYB081 and 2017KY322), Youth innovation fund of First Affiliated Hospital of Zhengzhou University (YNQN2017032 and YNQN2017031), Joint research fund of First Affiliated Hospital of Zhengzhou University and Dalian Institute of Chemical Physics, Chinese Academy of Sciences (RZG and SRR).
Disclaimer The funding sources had no role in the design of this study nor any role during its execution, analyses, data interpretation or decision to submit results.
Competing interests None declared.
Patient consent Obtained.
Ethics approval This study was approved by the Institutional Review Board of the First Affiliated Hospital, School of Medicine, Zhejiang University (2014-334), the First Affiliated Hospital of Zhengzhou University (2017-XY-002) and the First Affiliated Hospital of Xinjiang Medical University. The study was performed in accordance with the Helsinki Declaration and Rules of Good Clinical Practice. All participants signed written informed consents after the study protocol was fully explained.
Provenance and peer review Not commissioned; externally peer reviewed.
Data sharing statement The raw Illumina read data for all samples were deposited in the European Bioinformatics Institute European Nucleotide Archive database under the accession number PRJEB8708.