Article Text

Abstract
Objectives The interaction between the immune system and tumor cells is an important feature for the prognosis and treatment of cancer. Multiplex immunohistochemistry (mIHC) and multiplex immunofluorescence (mIF) analyses are emerging technologies that can be used to help quantify immune cell subsets, their functional state, and their spatial arrangement within the tumor microenvironment.
Methods The Society for Immunotherapy of Cancer (SITC) convened a task force of pathologists and laboratory leaders from academic centers as well as experts from pharmaceutical and diagnostic companies to develop best practice guidelines for the optimization and validation of mIHC/mIF assays across platforms.
Results Representative outputs and the advantages and disadvantages of mIHC/mIF approaches, such as multiplexed chromogenic IHC, multiplexed immunohistochemical consecutive staining on single slide, mIF (including multispectral approaches), tissue-based mass spectrometry, and digital spatial profiling are discussed.
Conclusions mIHC/mIF technologies are becoming standard tools for biomarker studies and are likely to enter routine clinical practice in the near future. Careful assay optimization and validation will help ensure outputs are robust and comparable across laboratories as well as potentially across mIHC/mIF platforms. Quantitative image analysis of mIHC/mIF output and data management considerations will be addressed in a complementary manuscript from this task force.
- image analysis
- oncology
- immunology
- tumors
This is an open access article distributed in accordance with the Creative Commons Attribution Non Commercial (CC BY-NC 4.0) license, which permits others to distribute, remix, adapt, build upon this work non-commercially, and license their derivative works on different terms, provided the original work is properly cited, appropriate credit is given, any changes made indicated, and the use is non-commercial. See http://creativecommons.org/licenses/by-nc/4.0/.
Statistics from Altmetric.com
Background
The tumor microenvironment (TME) represents a complex interaction between elements of the host and tumor cells. It includes a variety of immune cells (T-lymphocytes and B-lymphocytes, natural killer cells, dendritic cells, and different myeloid cell types like macrophages and granulocytes), characterized by specific immunoactive protein expression patterns (e.g. immune checkpoints such as programmed cell death protein-1 (PD-1)/programmed cell death ligand 1 (PD-L1), cytokines such as interferon gamma), and stromal cells (blood vessels and fibroblasts), each representing a potentially unique niche. Early characterization of some of these elements, such as PD-L1 expression by tumor and/or immune cells or density of pre-existing CD8+, T cell infiltrates in pretreatment tumor specimens, have been correlated with responses to immune checkpoint blockade.1–4 Additionally, studies of on-treatment specimens have helped characterize how immunotherapy exposure can remodel the tumor immune microenvironment, providing important insights into the mechanism of action of these agents and early markers of therapeutic efficacy.3 5–10 Based on these early successes, there is great interest in characterizing an expanded number of TME features, with the aim of identifying new robust biomarkers that can be used to drive precision medicine approaches.
The biomarkers with greatest clinical utility currently are derived from profiling cells that are directly associated with the tumor.11 Characterization of peripheral blood immune cells correlates poorly with the composition of cells in the TME and as such, studies on peripheral blood have provided limited value to date in selecting patients likely to benefit from cancer immunotherapy. Studies of tumor specimens are also associated with their own challenges, including: limited tissue availability, variation in tissue handling prior to paraffin embedding, spatial heterogeneity of marker expression, and challenges surrounding the detection of complex or rare cell phenotypes in situ. Flow cytometry is a robust approach to cellular phenotyping, but the requirement for fresh tissue, the low cell yield, and the loss of spatial information limits the routine application of such methods.12
Multiomic DNA and RNA approaches such as those used in the TCGA project have provided large datasets for explorations of tumor taxonomy as well as the prognostic significance of immune infiltrates.13 14 The input for these assays is heterogeneous, in that the samples include all the TME cells in addition to some proportion of non-tumor tissue. Although bioinformatic/computational approaches have been used to deconvolute mRNA expression data, so that individual cell types can be virtually profiled in silico,15 16 much information about spatial context is lost with these methods. Similarly, single-cell RNA-seq allows for the characterization of the expression profile of individual cells and lacks spatial information. In contrast, immunohistochemistry (IHC) can distinguish between different cell types expressing the same protein and can characterize the density and spatial distribution of specific cells within the TME. IHC can also provide a semi-quantitative assessment of marker intensity. Immunofluorescence (IF) has the additional benefit of being able to characterize a large dynamic range of expression on a cell-by-cell basis. A recent meta-analysis comparing tumor mutational burden, gene expression profiling for interferon-gamma gene signatures, PD-L1 IHC, and multiplex IF (mIF)/multiplex IHC (mIHC) approaches showed that mIF/mIHC had significantly higher performance than the other approaches for predicting objective response to anti-PD-(L)1 therapies.17 These findings underscore the potential biomarker value of co-expression and spatial distribution metrics.
The key component of both IHC and IF assays are specific antibodies that detect a single protein of interest. This antibody is typically visualized via enzyme-mediated indirect labeling or through a direct conjugate of a chromogen or fluorophore to the primary antibody. The most widely used approach for both clinical and research settings is an IHC assay designed to identify a single protein in a section from formalin-fixed paraffin-embedded (FFPE) tissue that is then interpreted by a pathologist using brightfield microscopy. Newer technologies allow for the simultaneous targeting of multiple proteins in a single assay, commonly referred to as mIHC or mIF.
Multiplexing approaches can analyze the cells of a tissue and demonstrate 2–50 markers expressed on a single cell level with high precision and accuracy.18–20 mIHC can be performed by either adding multiple labels (e.g., Ventana-RocheTM or Biocare MedicalTM) to the slide at one time, or by using a stain and strip or cycling approach. Multiple platforms exist for mIF techniques, including standard IF scopes which can support 4–5 plex assays, and multispectral technologies (Vectra 3.0TM/PolarisTM), which can support 6–8-plex assays. Higher-order plex approaches include multiplex ion beam imaging, by time of flight (MIBI-TOF), imaging mass cytometry (IMC), and digital spatial profiling (DSP), among others. The basic principles underpinning these different approaches will be discussed here, as will the advantages and disadvantages of each (summarized in table 1). Importantly, each approach requires optimization and validation.21 Here, we present general recommendations that represent current consensus opinions for minimum best practice requirements to ensure quality data results. Importantly, the data generated by these approaches represent the end product of the assay, and of the imaging and associated analysis of the quantitative data, as all these methods typically require the use of digital images analysis. Imaging, image analysis, and related topics will be covered in a separate publication.
Summary of current multiplex IHC/IF technologies
Antibody selection
The most critical component of any IHC/IF assay is the primary antibody targeting the biomarker of interest. Monoclonal antibodies are often preferred due to their higher specificity and reproducibility, and because they are almost always generated to unique peptides of the target antigen, that is, peptides that are generally located in regions less affected by formalin fixation (as in cytoplasmic tails and linear loops, avoiding secondary structures).
When evaluating which primary antibody could be leveraged in an IHC/IF assay, the potential impact of antibody sensitivity and specificity must be considered. These characteristics may be provided by the antibody suppliers; however, the accuracy of vendor recommendations for antibody use should be verified by the user. The importance of understanding antibody specificity has been widely discussed in the scientific community. Journal editorials have been written alerting readers to the limited characterization of antibodies that were utilized in many prior publications.22–25
Antibody specificity may be established using a variety of methods. Cell lines that are transfected with the biomarker or are known to spontaneously express the target provide essential controls to determine, as a first pass, the specificity of the antibody. Ideally, the antibody should be tested on cells transfected with the target of interest, in cell line knockdowns to remove target expression, and in cells that are transfected with different molecules of the same family to further demonstrate specificity (e.g. an antibody to PD-L1 should identify cells transfected with PD-L1 but not with PD-L2 or B7-H4). However, pure cell line preparations do not contain the multitude of proteins that are encountered in the intended-for-use sample (e.g. a tumor biopsy, with tumor cells, stroma, blood vessels, inflammatory cells, secreted proteins, extracellular matrix, etc.). The specificity of antibodies needs to be further tested in tissues, ideally in a range of normal and diseased tissues. Unexpected staining in particular cells can be confirmed with an orthogonal method, such as in situ hybridization, to confirm the RNA expression of the target on the same cells as those identified by the antibody. If there is a disconnect, it is mostly likely due to nonspecific binding of the antibody to some other molecule in the tissue. Further specificity may be demonstrated by replacing the primary antibody with an isotype control used at the same concentration. This highlights any potential non-specific background of the assay system. The best method to prove specificity is using two monoclonal antibodies to adjacent but non-overlapping epitopes. Then, IHC testing of both antibodies on tissue microarrays (TMAs) with 30–50 tissues of interest is followed by quantitative measurement and regression. This method controls for all potential tissue cross-reactivity, but is often prohibitively expensive.
Antibody sensitivity is best established using cell lines that express the target at different levels (ideally with the number of molecules per cell determined by flow cytometry). This approach can also help define the dynamic range of the assay. In practice, such resources are not always available for the marker of interest. Alternate approaches including testing multiple antibodies to ensure robust performance and/or comparison to previously reported or anticipated staining patterns are commonly used, although not ideal. One strategy for maximizing target signal is through pooling of various antibodies for the detection of a target, such as the pooling of various anticytokeratins to detect total cytokeratin. This can also be used to conduct broad phenotyping. For example, if one were interested in the quantification of macrophages, one could pool CD68, CD163, and CD11b into one fluorescent marker, and effectively one fluorescent channel. Sensitivity may also be assessed by orthogonal methods.25
Finally, a key issue in antibody validation is reproducibility. Vendors frequently provide monoclonal antibodies at different concentrations and sometimes without specifying concentration, as if they were polyclonal. The antibody concentration of polyclonal antibodies is unknown, which led to the practice of using a given dilution, rather than an absolute protein concentration. When using monoclonal antibodies, methods sections should specify antibody concentrations (in µg/mL) for better reproducibility. Additionally, assay development for multisite clinical trials and/or routine clinical use should include quantitative reproducibility studies using different lots of the antibody from the vendor and different operators. This is often performed on a small index TMA of 30–50 cases.
Controls for assay development and performance
At a minimum, positive and negative controls for a given marker should be run with each staining batch, and Clinical Laboratory Improvement Amendments (CLIA) recommendations include positive controls that are on the same slide as the tissue being tested.26 In many cases, a single piece of tissue, for example, normal tonsil, can serve as both a positive and negative control, by studying anticipated staining patterns. For example, PD-L1 expression is expected in the crypt epithelium, tingible-body macrophages and other follicular histiocytes, and scattered interfollicular macrophages and rare lymphocytes, while other cells are expected to be negative.
TMAs also provide an opportunity to use a number of different normal and tumor tissues as assay controls, potentially representing a range of expression for the marker of interest. Normal tissues are often preferentially employed, as they can be procured easily in large amounts from surgical specimens. Some groups have also developed approaches whereby these two strategies are combined, for example, TMA cores embedded in spleen or tonsil tissue (online supplementary figure 1). Batch-to-batch quantitation of expression for a given marker in the control tissue can provide an early indication of reagent degradation as well as an opportunity for normalization of quantitative read-outs across batches.
Supplemental material
As described above, cell lines are useful in determining optimal antibody concentration but should also be tested alongside FFPE tissues with cells known to be positive and negative in expression. This is because cell lines are designed to overexpress the protein of interest, and it is possible that if assays are only optimized to cell lines, the assay may not be sensitive enough to detect potentially lower levels of expression observed in tissue.
Standard chromogenic IHC (single marker and mIHC)
Assay principles and workflow
Standard chromogenic IHC methods have been widely used in pathology laboratories for decades. Despite some drawbacks, it has been extremely useful in diagnostic and research settings, and pathologists are very familiar with the methodology, staining characteristics, and interpretation. In addition, companion diagnostic tests have been developed based on standard chromogenic IHC tests, such as those for HER2/neu and PD-L1. While most chromogenic IHCs tend to be single stains, it is possible to perform multiple chromogenic IHCs on the same slide with different chromogens, that is, chromogenic mIHC.
The critical first step in any IHC assay in FFPE tissues is developing proper assay conditions that expose antigens often affected by formalin fixation, to improve their detection by the antibody. A variety of these ‘epitope retrieval’ conditions have been developed over the years and have been reviewed elsewhere.27–30 The methods generally revolve around applying energy to the tissue (typically in the form of heat) in the presence of a solution of buffers that denature the proteins, remove methylene bridges caused by formalin, and reducing chemical forces that could potentially interfere with the antibody binding to the target antigen. In most automated staining platforms, antigen retrieval conditions have been standardized—most platforms offer two standard options of buffers to be tested (typically one based on a citrate buffer, and the other on a high pH buffer containing EDTA). In any method development process, a variety of antigen retrieval conditions can be tested to identify the optimal conditions for a given target.
Once the epitope of interest is properly exposed, two blocking steps are performed to prevent non-specific staining. The first, in horseradish peroxidase (HRP)-based detection systems, is a peroxidase block. Peroxidase blocking is especially important on tissues with abundant red blood cells or numerous myeloid cells like bone marrow and spleen, and organs like the kidney that express abundant endogenous peroxidase that can potentially catalyze peroxidase-driven chromogenic reactions on non-specific targets. Some authors have noted that the concentration of peroxidase block should be decreased for some antibodies like anti-CD4 and anti-CD45, due to potential loss of stain intensity.31 The second blocking step is the application of serum-free protein, which prevents non-specific binding of antibodies to a tissue or Fc receptor.
After blocking, the antibody of interest is added. The primary antibody should be titrated to an appropriate concentration that retains the specificity of the stain, while removing any background signal or non-specific staining (‘blush’) of the tissue. Antibodies used at too high of a concentration can result in off-target staining.32–35 While determination of signal to noise ‘by eye’ is often used, to be rigorous, this should be done quantitatively.33 Signal-to-noise maxima can be identified by assessing a small series of tumors across multiple primary antibody concentrations. Use of antibodies at that optimal concentration results in better accuracy and reproducibility.34
The visualization of the primary antibody’s labeling of tissue is accomplished through a secondary antibody link, with or without amplification, followed by a detection system. The most commonly used amplification systems currently are polymer-based. They are typically anti-mouse and/or anti-rabbit polymer with several HRP enzymes bound to the polymer. These have the potential to significantly amplify signal without the background staining observed historically with avidin-biotin systems. The drawback to polymers is that their formula is proprietary, so they are often different lengths with varying numbers of bound HRPs. Care should be taken in selecting the appropriate polymer as different polymers can affect assay sensitivity. Additionally, steric hindrance may affect the performance of some of the larger polymers, depending on antigen size and location.
For chromogenic assays, the traditional detection system is 3,3′-diaminobenzidine, which is oxidized by hydrogen peroxide, and precipitates as a brown color on the tissue. 3-Amino-9-ethylcarbazole (AEC) is also commonly used. It precipitates as a red color and can be removed using organic solvents. There has been a surge of new chromogens recently, which are substrates of either HRP or alkaline phosphatase, enzymes typically used in detection systems. These colors include purple, red, teal, yellow, green, blue, and silver, and they offer an opportunity to perform multiplexing using chromogenic IHC, especially in those cases where the biomarkers of interest are not on the same cells (figure 1). In some instances, unique combinations of these chromogens even allow for identification of co-expression of biomarkers in a single cell due to color shifts when the two chromogens are superimposed (e.g. yellow chromogen on top of a purple chromogen yields an orange color that can be differentiated from the pure yellow and purple colors).

Light microscopy multiplex chromogenic immunohistochemistry staining. Representative image of triplex FOXP3/CD8/KRT staining with purple (Discovery HRP, Ventana, Roche Tissue Diagnostics), yellow (Discovery AP, Ventana, Roche Tissue Diagnostics) and teal (Discovery HRP, Ventana, Roche Tissue Diagnostics) chromogens and a hematoxylin counterstain.
The final steps involve counterstaining and coverslip application. Hematoxylin is the most routinely used counterstain. If the detection system is alcohol soluble, it is important to choose a hematoxylin and an acid rinsing/blueing protocol that does not contain ethanol, for example, Gill’s and Mayer’s hematoxylin. Similarly, the mounting media used for coverslipping should be compatible with the detection system. For example, routinely used mounting media usually requires xylene, however, xylene can alter aqueous chromogens such as AEC.
Assay optimization and validation
In addition to selection and optimization of the primary antibody, as described above, conditions that need to be optimized include antibody incubation times and the amplification method. The overarching theme of all assay optimization is to increase the signal-to-noise ratio. This may be achieved in a number of ways, for example, by extending the antibody incubation time, which may allow for a lower primary antibody concentration while maintaining the stain specificity. If the signal is too low or the assay is not sensitive enough, extending the antigen retrieval time and/or time of exposure to the polymer amplification may be of benefit, although care must be taken to avoid non-specific staining. If signal-to-noise ratio becomes an issue for a low-level expressing marker, a tyramide signal amplification (TSA) approach may help (see ‘Multiplex immunofluorescence’ section). All these conditions need to be tested and optimized for a single assay, and one frequently adopted approach is the use of a ‘matrix system’ to cover multiple conditions in one assay run, thus eliminating any variation that may be seen between runs. When the aim is to combine multiple single chromogenic IHCs into an mIHC, it is important to optimize assay conditions to facilitate the multiplex combination, for example, having common epitope retrieval conditions for all targets.
Clinical assay validation recommendations have been extensively reviewed and are covered in guidelines from the College of American Pathologists (CAP).36–38 Generally, for an IHC assay to be considered validated, at a minimum, it needs to be shown to be accurate (specific and sensitive) and precise, and reproducible from an analytic perspective (intrarun, inter-run, interinstrument, interlot, and interoperator variability), and from a pathologist interpretation perspective (interpathologist scoring reproducibility). Ultimately, the assay needs to be shown to be reproducible between different laboratories (interlaboratory reproducibility). Known factors affecting epitope integrity, and therefore intralaboratory and interlaboratory reproducibility for a given marker, also include preanalytical variables such as tissue ischemia, fixation time, and storage conditions (temperature, duration, and format, e.g. whether stored as a tissue block or slide). There are less well-cataloged requirements for non-clinical assays in the research setting.
Advantages
The advantages to chromogenic IHC are that it is a relatively easy, inexpensive, and established technique that has defined standards and guidelines, for example, the National Institute of Health Cancer Therapy Evaluation Program39 and CAP guidelines. Multiple reagents and automated platforms are available, and their performance has been well characterized. The stains are most often read using light microscopy, which allows for easier quality oversight than many fluorescent methods, since most pathologists are more familiar with light microscopy, including the handling and storage of the slides. Additionally, high-throughput brightfield digital image acquisition platforms are available, and in some instances are being integrated into routine clinical workflows.
Disadvantages
Multiplexing is relatively difficult using chromogenic approaches. This is because when multiple chromogenic stains are performed simultaneously on a single slide, there are only a few existing chromogens that are very effective in allowing for the study of marker co-expression. The dynamic range of marker intensity is also limited, and thus chromogenic stains are most often used to simply assess expression as positive versus negative, or a semi-quantitative H-score.40
Multiplexed immunohistochemical consecutive staining on single slide
Assay principles and workflow
Multiplexed immunohistochemical consecutive staining on single slide (MICSSS), as the name suggests, relies on iterative cycles of immunostaining on a single slide and shares many steps with single chromogenic IHC stains.41 42 In brief, a whole-slide scanner scans the slide after each staining cycle, followed by manual coverslip removal, chromogenic enzyme substrate removal, and proper blocking steps, before another single IHC stain is applied (figure 2).
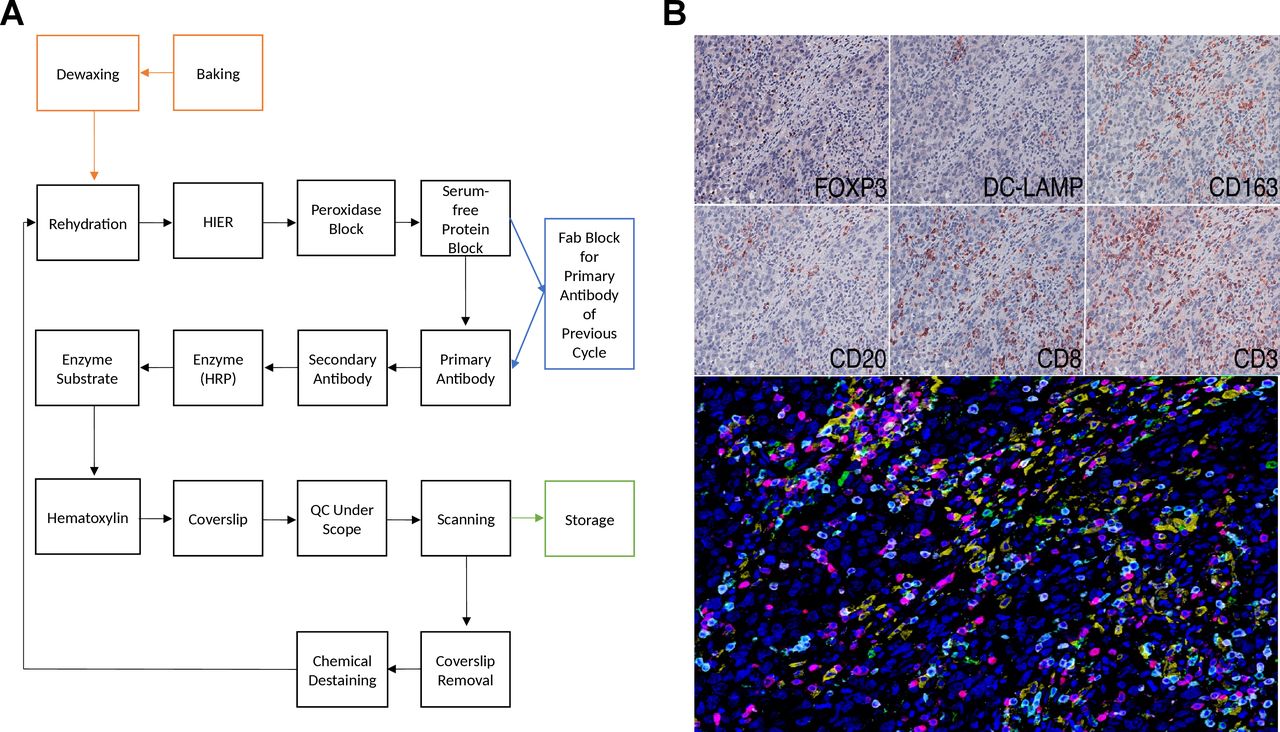
Light microscopy multiplexed immunohistochemical consecutive staining on single slide (MICSSS). (A) As the name suggests, MICSSS uses iterative cycles of tagging, image scanning, and destaining of chromogenic substrate on a single slide to generate a multiplex image. (B) Representative triple negative breast cancer tissue specimen stained for FOXP3, DC-LAMP, CD163, CD20, CD8 and CD3. Upper panels show each individual chromogenic stain. The lower panel shows the resultant composite image that has been pseudo-colored for fluorescence. HIER, Heat-induced epitope retrieval; HRP, horseradish peroxidase; QC, quality control.
MICSSS has some specific requirements beyond those for single IHC staining. First, the enzyme substrates must be soluble, for example, in ethanol, in order to be able to remove the chromogen for the next staining cycle. AEC is often used for this purpose, since it is compatible with HRP, however there are many other options with different colors available. Before each immunostaining cycle, chemical destaining is used to strip the chromogen and the antigen retrieval is repeated. Additional steps and associated reagents may also be required to ensure that the primary antibody is either completely removed or blocked. Several methods have been described including glycine-sodium dodecyl sulfate (SDS), potassium permanganate (KMnO4), and Fab blocking for eluting antibodies in sequential immunostaining approaches.43 Fab fragment blocking (e.g. donkey anti-mouse Fab fragment in order to block primary antibodies raised in mouse) is the primary antibody block of choice for the MICSSS method in order to prevent any staining interference when a primary antibody raised in the same species is used in previous immunostaining cycles.44
Assay optimization and validation
Despite the fact that most of the antibodies in a validated and optimized MICSSS antibody inventory allow them to be performed in different orders in a selected multiplex panel, new markers require an extensive and labor-intensive validation testing process.45 Each new marker must be optimized as a single IHC marker, that is, a ‘singleplex’ stain, and they must be tested in different orders to demonstrate qualitative and quantitative antigen signal preservation. Some epitopes preserve their antigen signal even after 10 immunostaining cycles, whereas some are sensitive to the stripping process and should be prioritized so as to be exposed to only a few or no antibody stripping steps. Whenever a new marker is added or substituted in an MICSSS panel, a de novo comparison of all markers to their IHC single stain as well as permutations of order testing is essential to ensure the assay’s sensitivity and specificity is maintained. This is sufficiently subtle that quantitative assessment is required for accuracy.
Advantages
Like other chromogenic IHC approaches, MICSSS is relatively simple and affordable. It requires a brightfield microscope and scanner, which are more commonly available than IF-based instrumentations. The fact that each marker is labeled individually on the slide reduces some of the risks of steric hindrance and other types of staining or signal interference (see ‘blocking’/’umbrella effect’ and ‘bleed-through’ in ‘Multiplex immunofluorescence’ section). MICSSS also allows for the whole slide to be studied for each marker. This is a key distinction from other multiplex methods like multiplex spectral imaging,46 IMC,47 and DSP, whereby only a few selected regions of interest (ROIs) are typically studied (figure 3).

Imaging area varies by the multiplex immunohistochemistry (mIHC)/multiplex immunofluorescence (mIF) approach. Representative slide from a malignant melanoma showing the relative area of regions of interest (ROIs) acquired for analysis by each technology. It is possible to acquire adjacent ROIs such that the entire tumor is profiled using mIF, digital spatial profiling (DSP), or mass spectrometry. This latter approach currently requires consideration for acquisition time, data management, and analysis. For example, chromogenic IHC with light microscopy requires approximately 2–4 min to acquire a whole slide image, while each ROI for mass spectrometry requires 15–120 min, depending on the platform used and desired resolution (see online supplementary table 1). MICSSS, multiplexed immunohistochemical consecutive staining on single slide.
Supplemental material
Disadvantages
The major disadvantages to MICSSS are that it is a time-consuming technique when compared with other high-throughput/multiplexing methods, and that it requires careful handling over many immunostaining and scanning cycles. For example, a 10-marker MICSSS panel requires 10 cycles of immunostaining/scanning, with each cycle taking 1–2 days. Although it is rare, the repeated coverslip removal can potentially contribute to tissue artifacts. Such alterations have downstream effects on all subsequent staining cycles and during image analysis. It can also be challenging to manipulate the order of staining so that antigens sensitive to cycling are measured first.
Merging individual MICSSS whole slide images in order to create a multiplex whole slide image for analysis is another challenge. Software is used for image alignment/registration of the sequential tissue scans48–52 to minimize and correct for potential microscopic changes on the tissue section that occur after each cycle and/or movement of the slide within the scanner rack. Image analysis will be discussed in a separate manuscript, but in brief, MICSSS whole-slide images are red-green-blue (RGB)-type, and they cannot be merged in their original RGB format. Image processing steps are needed to create a multiplexed multicolor image after image registration, including color deconvolution, color inversion (pseudofluorescence), and a final merging of images.
Multiplex immunofluorescence
Assay principles and workflow
The basic principle of mIF (a.k.a. QIF, for quantitative immunofluorescence) is that multiple protein targets can each be stained by specific antibodies labeled with distinct fluorophores. When excited, the fluorophores emit at a characteristic wavelength. A microscope with specific bandpass filter sets is used to collect signal from these well-defined emission spectra. The IF fluorophores have a large dynamic range, and thus IF staining of tissue has the power to phenotypically characterize cells, akin to flow cytometry. Yet, unlike flow cytometry, the signal is captured in situ, facilitating spatial studies. Importantly, the intrinsic fluorescence spectra from FFPE tissue can overlap with the antibody-reporter systems, meaning that antibody-specific signal needs to be distinguished from FFPE tissue autofluorescence. Autofluorescence was historically thought to prevent fluorescent imaging on FFPE tissue, but antigen retrieval methods combined with the selection of fluorophores with peak emission away from the autofluorescence peak (around 490 nm) allowed immunofluorescence studies as early as the late 90s.53
Primary antibody visualization in mIF can be achieved through direct or indirect fluorophore labeling, both of which use wavelengths between ~350 nm and ~750 nm (primarily in the visible light spectrum). Antibodies can be labeled using quantum dots,43 44 DNA barcodes,54 and reactive fluorophores, among others. One of the most widely used approaches for mIF is an indirect approach that employs TSA.19 This method provides signal amplification through a polymer-HRP detection system combined with activation of tyramide fluorophores. The activated tyramide covalently binds to tyrosine residues on and surrounding the epitope of interest. Heat is then used to remove the non-covalently bound primary antibody for that target and polymer-HRP, while the tyramide-linked fluorophore remains deposited on the tissue. Another primary antibody to the next target can then be applied to the tissue and visualized by a different tyramide-linked fluorophore. The cyclical staining and amplification is then repeated, as necessary, with consideration given to the order of antigen measurement to ensure optimal epitope detection. Using this approach, it is possible to create a protocol that can allow researchers to use antibodies raised in the same species and create panels that can accommodate simultaneous detection of up to six to eight individual targets (figure 4). Emerging studies suggest that it may be possible to increase this number to ~30–60 individual mIF targets using a cyclic staining approach where non-TSA-based, low-plex fluorescence assays are cycled on the same sample and then assembled using image analysis algorithms,54–56 similar to what is done for MCISSS.

Multiplex immunofluorescence (IF) using tyramide signal amplification (TSA)-based detection methods and multispectral imaging. Representative non-small cell lung carcinoma stained with six markers (cytokeratin (CK), programmed death-ligand 1 (PD-L1), programmed cell death protein-1 (PD-1), CD68, CD8, FOXP3). The image acquisition of all markers occurs simultaneously. Individual markers (or select combinations of markers) can then be displayed.
The number of targets that can be visualized simultaneously using mIF is limited by the number of wavelength band passes and paired excitation/emission filter sets. If the spectral profiles of the fluorophores are too close in wavelength, the risk is so-called ‘crosstalk’ or ‘bleed-through’ of signal, that is, a false-positive reading in an adjacent channel. In general, four or five different colors can be imaged unambiguously with a general IF microscope equipped with appropriate filters aligned with the peak absorption wavelengths. If more than four targets are to be imaged simultaneously, a multispectral imaging system that can conduct linear unmixing of signals is often required to separate the signals.5 Such systems can also have the advantage of subtracting both spectral overlap and tissue autofluorescence; however, they also require the preparation of a spectral library or the use of a synthetic library, as per manufacturer’s recommendation.
Assay optimization and validation
mIF panel development is essentially the consolidation of multiple singleplex IF protocols into a single protocol that shows an equivalent staining pattern relative to the optimized singleplex IF and IHC staining.5 Switching from the singleplex to multiplex format can lead to an increase or decrease of individual marker signals, potentially requiring additional optimization of the antigen retrieval conditions (pH and temperature), reagent titration (primary antibody, secondary antibody, fluorophores, etc), incubation conditions (time and temperature), and blocking of non-specific binding. The sequential order of the targets to be tested can also impact assay performance. This is an important consideration when designing mIF panels and trouble-shooting any potential deviations from singleplex IHC or IF.5
In general, it is recommended to label more highly expressed targets with lower intensity fluorophores and vice versa. As a general recommendation and based on the expected kinetics of antibodies in solution, the starting incubation time for any primary antibody workup is generally for ~30 min between 18°C and 22°C (i.e. ambient temperature), while starting TSA fluorophore dilutions are typically around 1:100. These two independent variables should be tested separately. Between cycles of primary antibody application, it is important to ensure complete antibody stripping from the previous cycle as well as complete antigen retrieval for the next cycle’s target of interest.
Because TSA reagents covalently bind to sites surrounding the antigen, they can potentially inhibit the binding of a subsequent primary antibody through steric hindrance. This is commonly termed ‘blocking’ or an ‘umbrella effect’. This tends to occur in situations where multiple markers reside in a single cell compartment, such as a CD3+, CD8+, PD-1+ T cell, where all three markers are expressed on the cell membrane. It is possible that, if CD3 and/or CD8 come before PD-1 in the panel, sufficient tyramide will be deposited to block the PD-1 antigen. If present, this phenomenon can be identified when the comparison to singleplex IHC/IF is performed. A useful approach to determine antibody/fluorophore interference or blocking is the drop controls method described by Surace et al., to find which one is causing the interference.57 Potential corrective actions then include increasing the primary antibody concentration(s), reducing TSA fluorophore concentration(s), and/or changing the order of targets in the panel, among others.
Multispectral technologies require additional considerations during optimization, such as the generation of a spectral library and balancing of signal intensities. The spectral library facilitates capture using the correct spectra from each fluorophore, thus allowing the discrimination of individual signals.19 Generating an appropriate spectral library requires imaging single samples stained with only one fluorescent dye at a time with a primary antibody directed against well-known and highly prevalent antigens (e.g. CD20, cytokeratins, vimentin, CD3, etc). In multiplex panels, there is risk of bleedthrough from a high-intensity signal into the channel for a neighboring low-intensity signal, leading to false positives. After the library is established, signal from exogenous and endogenous autofluorescence may also be extracted using these technologies.5
Panel development should ideally be performed using tissues with a full range of known expression patterns for the targets of interest. Once the panel is developed and validated, these same tissues can be run with each batch as additional controls. Final validation requires the performance of intrasite reproducibility studies. Intersite reproducibility studies will also be required as these technologies are employed in multi-institutional studies39 58 and prior to clinical use.
Advantages
There are currently hundreds of commercially available purified fluorophores for which detection hardware is commonly available and, as such, fluorescence-based multiplex staining techniques are widely available. In general, four to five different carefully selected fluorophores may be applied, and interrogation of the entire slide can be performed in a single round of imaging. When multispectral microscopes are used, the number of fluorophores applied to a single slide can be increased up to eight, and tissue autofluorescence can also be subtracted from the image. Most publications to date using this technology have reported 5–10 select ROIs per slide. ROIs can be tiled or stitched together to image the whole slide; however, this is currently time- and data-intensive, though technological advances in imaging whole slides in this manner are anticipated in the near future. In contrast to the chromogenic IHC approaches discussed above, IF has a larger linear dynamic range, facilitating studies of marker intensity. Cycled marker labeling approaches for mIF are also now being explored,54–56 which substantially increase the number of markers that could be quantified on a single slide.
Disadvantages
Imaging approaches that do not use multispectral technologies may be limited in their quantitative ability in some circumstances by tissue autofluorescence, while those that are multispectral require expensive, dedicated instrumentation and currently only image select ROIs. Many mIF approaches currently use TSA-based reagents, which, while quantitative, are driven by enzymatic amplification. Amplification has the advantage of boosting signal intensity, however, there is also the risk of overactive tyramide deposition, potentially contributing to an umbrella effect and/or signal bleed-through. Newer approaches that could potentially overcome this limitation include conjugating primary antibodies to DNA barcodes with subsequent detection using in situ-based polymerization and incorporation of fluorescent dNTP analogs.54 mIF is also considerably more time consuming compared with bright field in terms of assay development and subsequent digital pathology-related steps.
Tissue-based mass spectrometry
Assay principles and workflow
Tissue-based mass spectrometry, also known as elemental mass spectrometry immunohistochemistry (EMS-IHC), or simply mass spectrometry immunohistochemistry (MS-IHC) is emerging as an important method to characterize the spatial organization of proteins within biological samples.59–62 EMS-IHC has been used in recent work to shed light on autoimmune mechanisms in type 1 diabetes,62 to define expressional features of marginal zone B cells,63 and to relate single cell phenotypes to tissue histology in the tumor microenvironment.61 In contrast to optical methods that quantify immunofluorescence or immunoperoxidase via fluorescent or chromogenic reporters, EMS-IHC detects elemental mass tags attached to primary antibodies directly in the tissue of interest. A single mastermix of all conjugated antibodies is used to stain a tissue section using a modified workflow similar to conventional IHC. After sample staining, the slide is introduced into the mass spectrometer. After a ROI is selected, the tissue within the selected region undergoes pixel-by-pixel ionization, where each portion of the ROI corresponding to a pixel in the final image is ionized in sequential fashion. The ions generated from each of these pixel measurements are subsequently analyzed using TOF mass spectrometry. The abundance of each elemental reporter extracted from the TOF spectra for each pixel is used to generate an image of the tissue. For a 40-marker staining panel, the resultant data would comprise 40 greyscale images where the pixel intensity in a given image corresponds to the abundance of the targeted antigen (figure 5).
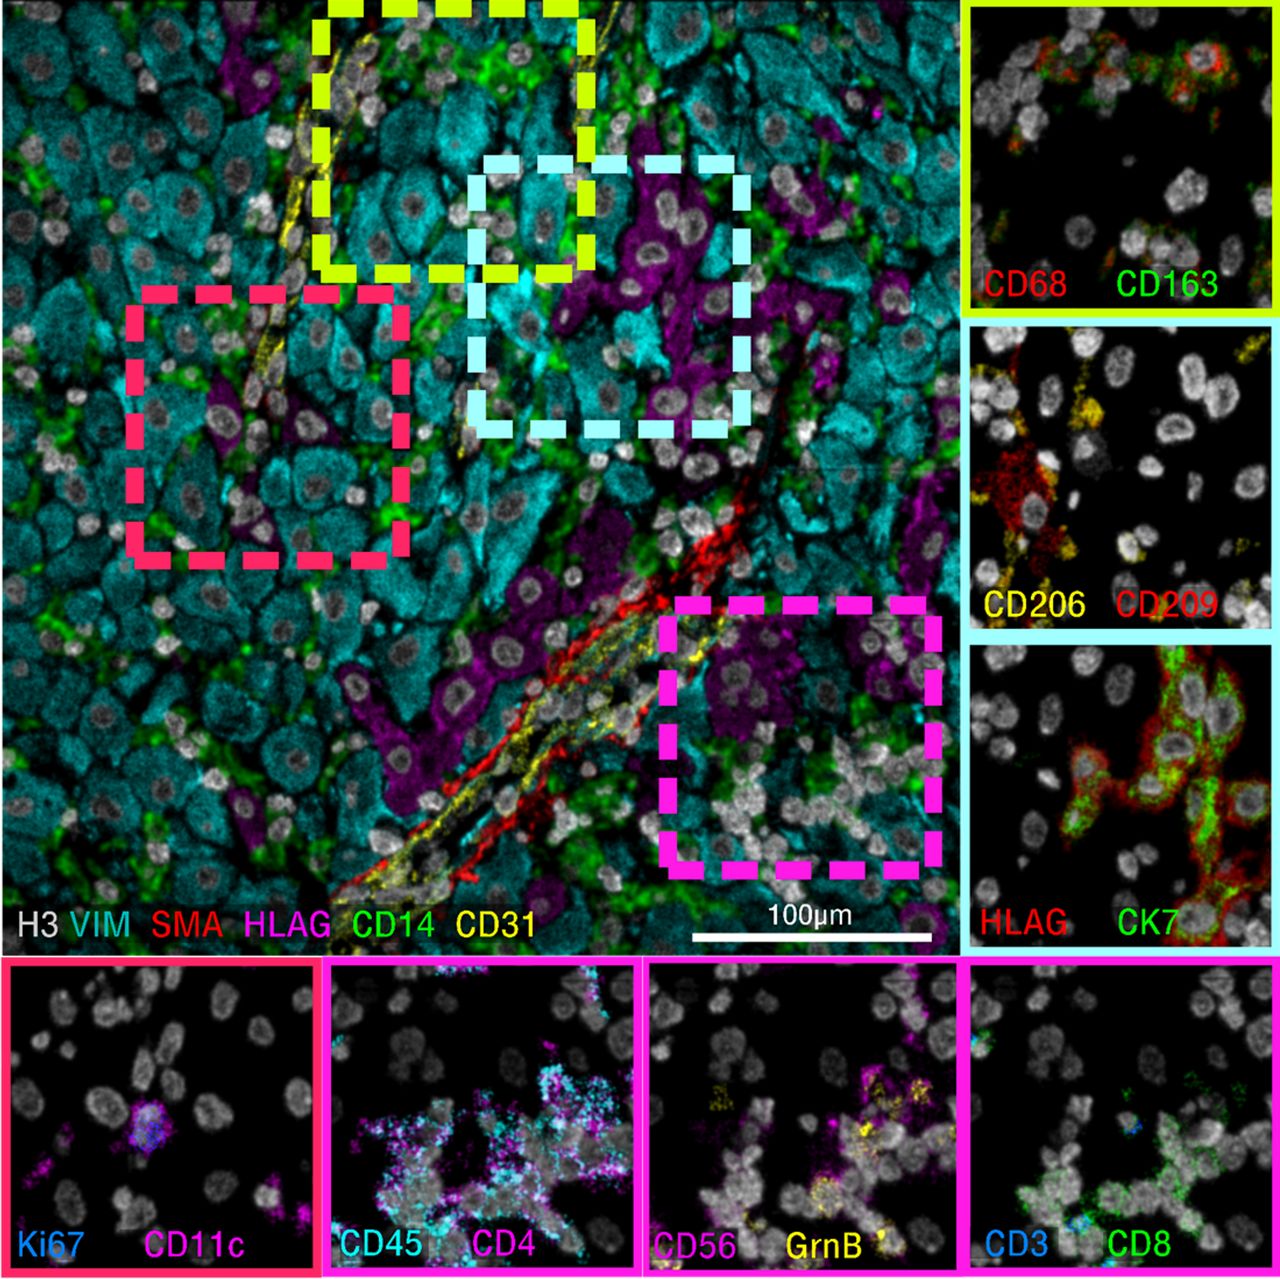
Tissue-based mass spectrometry. Representative images from a 40-marker panel applied to human decidua and acquired using multiplexed ion beam imaging by time of flight. Six-color overlay (top left) and enlarged two-color insets (border) of a representative sampling of the simultaneously acquired markers.
There are currently two related approaches to perform EMS-IHC. The first is MIBI-TOF.1 In this approach, a charged ion beam (usually composed of O2 +) is directed at the sample in a vacuum chamber to generate secondary ions from the tissue. These secondary ions are extracted with an electric field and injected into the TOF for measurement. Imaging resolution with MIBI-TOF is an adjustable parameter where acquisition time and resolution can be traded with one another depending on the specific application. For example, an imaging resolution of 260 nm can be achieved, but the imaging time for 1 mm2 of tissue is 27 hours. The fraction of the total tissue bulk that is consumed when imaging with MIBI-TOF is also adjustable, which permits a single field to be rescanned multiple times. The second approach is IMC.62 Although IMC also uses TOF to quantify the identified proteins, the ionization mechanism is distinct. In particular, it employs a high-intensity pulsed laser of fixed diameter to ablate the tissue in a single pass over the sample. The vaporized tissue is subsequently transported via helium carrier gas to an argon inductively coupled plasma where the material is ionized prior to TOF analysis. Differences in how the sample is ionized result in corresponding differences in technical performance (Hyperion Imaging System, FluidigmTM), summarized in online supplementary figure 1.64 Since a laser is used for ablation, the resolution is limited to about 1 μm.
Assay optimization and validation
The EMS-IHC workflow for reagent preparation and tissue staining is similar in many ways to other immunoassays. The epitope retrieval steps are the same as for traditional IHC (see ‘Standard chromogenic IHC’ section). The protein blocking step is also the same. However, EMS-IHC workflows do not use HRP for target visualization. Thus, a peroxidase block is not necessary. Following blocking, slides are incubated with metal-conjugated primary antibodies. However, rather than staining with a single primary antibody, the entire mastermix of up to 40 distinct antibodies is applied in one simultaneous step. Additionally, because the primary antibodies are directly conjugated with their respective metal isotopes, amplification with enzymatic secondary antispecies antibodies is not required. The sensitivity of this technology compared with the benchmark of routine chromogenic IHC staining has yet to be determined.
Advantages
The spectral separation between reporter channels and the large number of unique elemental mass tags permits EMS-IHC to image dozens of proteins simultaneously in a single tissue section with minimal channel crosstalk.59 60 This is in contrast to conventional IF, where tissue autofluorescence and spectral overlap typically limit these assays to five to eight channels in routine use.35 65
Disadvantages
Thus far, both MIBI-TOF and IMC have been used primarily as research tools. Staff training and reagent optimization for both platforms require significant time and expertise in IHC. Channel contamination with hydrides, oxides, hydroxides, and cyanides, as well as other isotopic impurities is possible, and needs to be recognized and compensated for. Before EMS-IHC can transition to more routine use, a few key technological advances will be necessary. Specifically, commercial availability of preformulated mastermixes containing a full antibody staining panel will be required to mitigate batch effects and permit tissue staining to be performed with existing autostainer platforms. Increased automation, including real time image autofocusing, sample autoloading, and more streamlined field selection will simplify operation and repeatability. Lastly, technical improvements that will increase the rate of pixel acquisition and efficiency of ion extraction are expected to increase sample throughput by an order of magnitude or more, permitting shorter turnaround times.
Digital spatial profiling
Assay principles and workflow
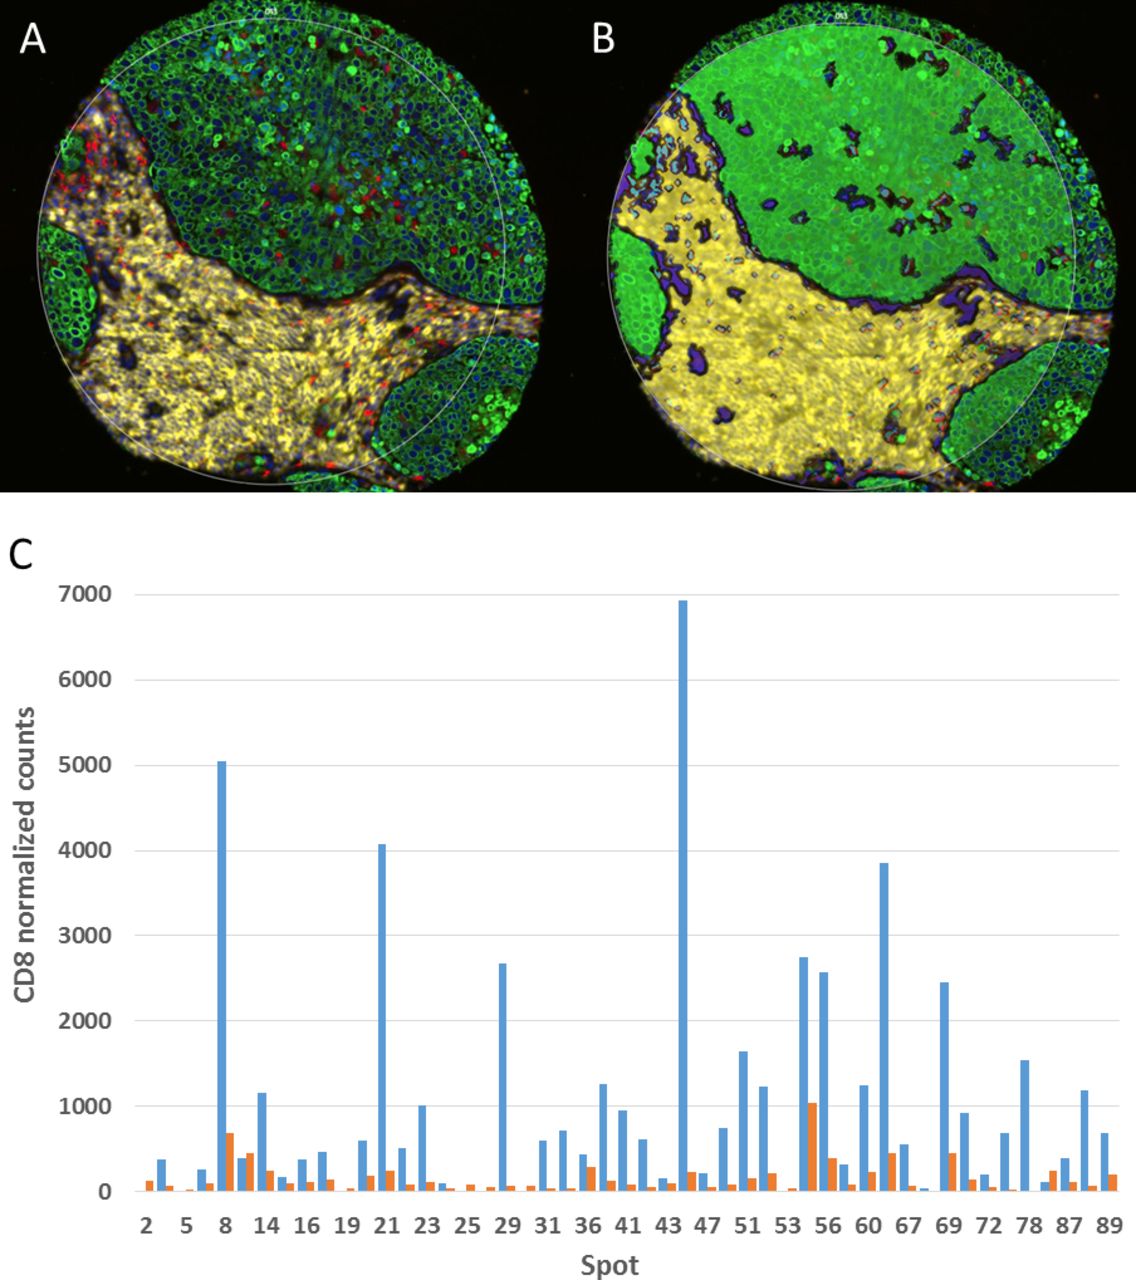
DSP is served on a novel platform (GeoMxTM) that offers non-destructive, simultaneous high-plex quantitative measurement of proteins within specific ROIs. Two types of primary antibodies are used in this workflow: (1) high-plex primary antibodies linked to a DNA bar code tag via a UV-cleavable linkage for target interrogation; (2) primary antibodies conjugated with fluorophores to define up to four compartments to help select morphological regions for analysis. These antibodies are all applied to a FFPE slide following antigen retrieval, similar to other IHC-based methods. Using the GeoMx DSP, a whole slide image of the fluorescent antibodies is acquired. The fluorescent signal from this first step is strong enough that tissue autofluorescence is not a significant analytic concern. The user then selects ROI(s) within these compartments. A UV laser is then focused using a dual micro-mirror device, cleaving the tags from selected areas of the slide. Then, a small pipet is robotically directed to the ROI and it samples (or ‘sips’) 1–2 µL of liquid above the ROI that contains all of the cleaved DNA tags. These tags are transferred by a robot to a multiwell plate and counted using the NanoStringTM method with six fluorescent barcodes.66 67 For example, a user could collect 50 UV-tagged antibodies within a CD68-labeled compartment. If there were three other fluor-labeled compartments within the same ROI (e.g. CD8, cytokeratin, and DNA), the user could create 200 variables per ROI. While the user cannot see and count the number of macrophages or T cells, average levels of 50 proteins within the CD68+ macrophage compartment or CD8+ T cell compartment in the ROIs can be defined. Figure 6 illustrates the concept of molecular compartmentalization and shows how counts collected in each compartment are measured as independent variables and inform an understanding of spatial relationships, even though no associated image is produced.

Digital spatial profiling. (A) A multiplex immunofluorescence image is first used to create molecular compartments. (B) The molecular compartments (green=CK, yellow=CD45, blue=CD68) are used to guide the UV laser and subsequent sipping process in this representative spot on a non-small cell lung carcinoma tissue microarray (TMA). (C) The amount of signal for a given marker is then assessed within a given compartment. Shown here is normalized CD8 signal in the CD45 compartment (blue) and the remainder of the tissue, that is, non-CD45 compartment, (red) by tumor tissue spot number on the TMA.
Assay optimization and validation
Similar to previously discussed modalities, each antibody must be validated prior to selection. The antibodies used for DSP have to then be validated again after DNA tag labeling. Antibody validation as well as optimization (titration) of each antibody in the vendor-designed multiplex kits is conducted by the vendor (NanoStringTM). As with the aforementioned technologies, final multiplex assay performance should be assessed for potential deviations of marker detection from singleplex IHC or quantitative IF.68
Advantages
To date, DSP has been executed in the 40-plex range (limited by validated antibodies), but there are 800 unique NanoStringTM barcodes, making it theoretically possible to perform an 800-plex assay. Perhaps even more interesting is the application of the technique for mRNA in situ detection. While there is little publicly available data on assessing mRNA in situ using DSP, the high-plex capability, using mRNA probes with some level of redundancy, could easily exceed 800.
Disadvantages
Unlike other methods of IHC or high-plex analysis of tissue, DSP cannot generate an image. Heat maps can be generated based on the ROIs selected, but the resolution of the heat map becomes prohibitively expensive if very small ROIs are used to tile a whole slide. The smallest region that can be selected is about 10 μm, so it is theoretically possible to select a single cell. More commonly, a ROI is selected representing an architectural region on a whole slide or a TMA spot. Although no image can be created, spatial definition can be achieved by manual or molecular selection of ROI, and then heat maps or ROI/TMA spot calculations can be made that use the spatial localization as a variable. This results in spatially informed quantitative measurements.
Conclusions
In summary, there are a number of potential approaches to performing mIHC/IF on FFPE, each with distinct advantages and disadvantages. Many of these approaches may be considered complementary to each other. It is anticipated that some of the higher-plexing approaches will remain discovery tools for some time, while some of the relatively lower-plex approaches may be applied sooner in the clinic. Here, we present initial standards for both research scientists and laboratory experts focused on early clinical development. The fundamental principle for validating and optimizing each of the approaches described is that single chromogenic IHC assays are the starting point and reference for mIHC/mIF method development. In this principle, the final multiplex assay should be able to recapitulate the results obtained with each single IHC assay. This often takes considered optimization, with panel design requiring 1–4 months of effort, depending on the markers being interrogated. Key steps in mIHC/mIF assay development that are recommended for inclusion in peer-reviewed manuscripts are provided in box 1. Adherence to standards for mIHC/mIF assay will facilitate the development of biomarkers for immunotherapeutic regimens and ensure these emerging technologies achieve their diagnostic potential.
Checklist for multiplex immunohistochemistry (IHC)/immunofluorescence (IF) assay optimization and validation: recommended information for inclusion in peer-reviewed manuscripts
Optimization of single stain IHC method for each target
Primary antibody selection.
Use and description of positive and negative controls for assay development. Ensure that for non-polymer-based amplification methods, concentration-matched isotype controls are negative.
Primary antibody and secondary reagent titrations to determine optimal signal-to-noise while maintaining sensitivity.
Combine all single IHC/IF assays into a multiplex panel and ensure staining levels of individual markers are still comparable to single stain IHC.
Perform and report reproducibility studies across multiple batches and multiple days.
Positive and negative controls for each marker should be run with each staining batch.
When switching the order of targets in mIF/mIHC panel, switching an antibody to a different fluorophore, or adding/removing an antibody from the panel, revalidation of the panel to singleplex IHC/IF should be performed.
Acknowledgments
The authors acknowledge SITC staff for their contributions including Hiromi Sato, PhD and Ben Labbe, PhD for medical writing and editorial support, and Lionel Lim and Angela Kilbert for project management and assistance. Additionally, the authors wish to thank the society for supporting the manuscript development.
References
Footnotes
GA, MA, ELE, SG, SG, NFG, CVH, TJH, JJ, ERP, MCR, DLR, JR-C, KAS and ECS contributed equally.
Correction notice Since the online publication of this article, the authors have noticed an error in the title as well as some formatting errors in the main text. The title has now been updated from 'The Society for Immunotherapy in Cancer statement on best practices for multiplex immunohistochemistry (IHC) and immunofluorescence (IF) staining and validation' to 'The Society for Immunotherapy of Cancer statement on best practices for multiplex immunohistochemistry (IHC) and immunofluorescence (IF) staining and validation'.
Contributors JMT, CBB led and organized the SITC Pathology Task Force, and managed the manuscript development activities. JMT, GA, MA, ELE, SG (Gnjatic), SG (Greenbaum), NFG, CVH, TJH, JJ, ERP, MCR, DLR, JR-C, KAS, ECS, and CBB participated in the drafting of the manuscript, and/or coordinated the writing of their corresponding section. All the authors read, revised and approved the manuscript. JMT and CBB contributed equally to this work as the Chairs of SITC Pathology Task Force.
Funding Not applicable
Competing interests JMT has served on an advisory board, consulting and received research funding from Bristol-Myers Squibb; is a consultant and an advisory board member for Merck and Co., Inc., Kenilworth, New Jersey, USA, Amgen and AstraZeneca. MA is a founder, consultant and board member of IONpath. SG (Gnjatic) is a co-inventor on an issued patent that is filed through Icahn School of Medicine at Mount Sinai (ISMMS) and non-exclusively licensed to Caprion; reports consultancy/advisory fees from Merck and Co., Inc., Kenilworth, New Jersey, USA, Neon Therapeutics and OncoMed Pharmaceutical; and has received research funding from Agenus, Bristol-Myers Squibb, Genentech, Immune Design, Janssen R&D, Pfizer, Regeneron and Takeda Pharmaceutical. CVH is a stockholder of Bristol-Myers Squibb. TJH has received research support from Bristol-Myers Squibb and General Electric. JJ is an employee of Merck Sharp & Dohme, a subsidiary of Merck & Co., Inc., Kenilworth, New Jersey, USA and stockowner of Merck & Co., Inc., Kenilworth, New Jersey, USA; and a stockholder of Regeneron Pharmaceuticals, Illumina and Google. MCR is an employee and stockholder of AstraZeneca. DLR is a consultant, advisor, or serves on a scientific advisory board for Amgen, AstraZeneca, Biocept, Bristol-Myers Squibb, Cell Signaling Technology, Cepheid, Daiichi Sankyo, GlaxoSmithKline, Invicro Konica Minolta, Merck and Co., Inc., Kenilworth, New Jersey, USA, NanoString, PerkinElmer, Ultivue and Ventana; is a founder and equity holder of PixelGear; has received research support or instrument support from AstraZeneca, Cepheid, Eli Lilly, Navigate BioPharma/Novartis, NextCure, Ultivue, Akoya Biosciences/PerkinElmer, NanoString and Ventana; and has received royalty from Rarecyte. JRC is an employee and unvested stock options holder of AstraZeneca. KAS has received consultant honoraria from Clinica Alemana de Santiago, Celgene, Moderna Therapeutics, Pierre-Fabre Research Institute, Shattuck Labs, AbbVie, AstraZeneca, EMD Serono, Ono Pharmaceuticals, Dynamo Therapeutics and Takeda Pharmaceutical; speaker honoraria from Merck & Co., Inc., Kenilworth, New Jersey, USA, Takeda Pharmaceutical, The PeerView Institute and Fluidigm; and research funding from Genoptix/Navigate BioPharma (Novartis), Tioma Therapeutics (formerly Vasculox), Tesaro, Moderna, Takeda Pharmaceutical, Surface Oncology, Pierre-Fabre Research Institute, Merck & Co., Inc., Kenilworth, New Jersey, USA, Bristol-Myers Squibb, AstraZeneca and Eli Lilly. ECS is an employee of Jounce Therapeutics. CSF is an employee of Roche Diagnostics GmbH. KK is an employee and shareholder of Roche. SJR receives research grant support from Bristol-Myers Squibb, Merck and Co., Inc., Kenilworth, New Jersey, USA, Kite/Gilead and Affimed Inc. ES is an employee of AstraZeneca. KES is an employee and stockholder of AstraZeneca; and a spouse of an employee of Arcellx. MJS is an employee and stockholder of AstraZeneca. MTT has served on an advisory board for Myriad Genetics, Seattle Genetics and Novartis; and has presented as a speaker for NanoString. IIW has served on an advisory board for as well as received research support from Genetech/Roche, Bayer AG, Bristol-Myers Squibb, AstraZeneca, Pfizer, HTG Molecular Diagnostics and Merck and Co., Inc., Kenilworth, New Jersey, USA; has served on an advisory board for Asuragen, GlaxoSmithKline, Guardant Health and Merck Sharp & Dohme, a subsidiary of Merck & Co., Inc., Kenilworth, New Jersey, USA; has received research support from DEPArray/Menarini Silicon Biosystems, Adaptive Biotechnologies, Adaptimmune, EMD Serono, Takeda Pharmaceutical, Amgen, Karus Therapeutics, Johnson & Johnson, Iovance Biotherapeutics, 4D pharma, Novartis, Akoya Biosciences; and has presented as a speaker for Genetech/Roche, Pfizer and Merck Sharp & Dohme, a subsidiary of Merck & Co., Inc., Kenilworth, New Jersey, USA. CBB has served on the scientific advisory boards at Bristol-Myers Squibb, Roche, PrimeVax and Halio DX; is a stockholder of PrimeVax and holds the patent US20180322632A1.
Patient consent for publication Not required.
Provenance and peer review Not commissioned; externally peer reviewed.