Article Text

Abstract
Background Because multiple sclerosis (MS) is a chronic disease causing disability over decades, it is crucial to know if the short-term effects of disease-modifying therapies reported in randomised controlled trials reduce long-term disability. This 10-year prospective observational study of disability outcomes (Expanded Disability Status Scale (EDSS) and utility) was set up, in conjunction with a risk-sharing agreement between payers and producers, to investigate this issue.
Methods The outcomes of the UK treated patients were compared with a modelled untreated control based on the British Columbia MS data set to assess the long-term effectiveness of these treatments. Two complementary analysis models were used: a multilevel model (MLM) and a continuous Markov model.
Results 4862 patients with MS were eligible for the primary analysis (mean and median follow-up times 8.7 and 10 years). EDSS worsening was reduced by 28% (MLM), 7% (Markov) and 24% time-adjusted Markov in the total cohort, and by 31% (MLM) and 14% (Markov) for relapsing remitting patients. The utility worsening was reduced by 23%–24% in the total cohort and by 24%–31% in the RR patients depending on the model used. All sensitivity analyses showed a treatment effect. There was a 4-year (CI 2.7 to 5.3) delay to EDSS 6.0. An apparent waning of treatment effect with time was seen. Subgroup analyses suggested better treatment effects in those treated earlier and with lower EDSS scores.
Conclusions This study supports a beneficial effect on long-term disability with first-line MS disease-modifying treatments, which is clinically meaningful. However the waning effect noted requires further study.
This is an open access article distributed in accordance with the Creative Commons Attribution Non Commercial (CC BY-NC 4.0) license, which permits others to distribute, remix, adapt, build upon this work non-commercially, and license their derivative works on different terms, provided the original work is properly cited, appropriate credit is given, any changes made indicated, and the use is non-commercial. See: http://creativecommons.org/licenses/by-nc/4.0/
Statistics from Altmetric.com
Introduction
Multiple sclerosis (MS) is a major cause of serious physical disability in adults of working age. The majority of patients start with a relapsing remitting phase (RRMS), which then becomes secondary progressive (SPMS) with or without superimposed relapses at a median disease duration of 20 years.1 It is during this latter phase that the majority of the disability is manifest.
The first randomised controlled trials (RCT) of MS disease-modifying treatments (DMTs) were reported in the 1990s.2–5 These led to the licensing of three formulations of interferon beta (Betaferon/Betaseron, Rebif and Avonex) and of glatiramer acetate (Copaxone) for RRMS. The licences of Betaferon and Rebif were subsequently extended in Europe to include patients with relapsing SPMS.6–8
All four treatments were shown, over the period of 2–3 years of the trials, to be efficacious in reducing relapses (by approximately 30%) and in reducing MRI activity, with less robust evidence on disability. The most important outcome, that is, the long-term effect of treatment on disability, could not be addressed within this timescale, and the predictive value of short-term treatment outcomes on longer term disability remains unproven. Only longer term follow-up data can provide information on the sustainability of treatment effects and on delaying time to loss of independent ambulation.
Because of the uncertainty of the long-term benefit, the UK’s National Institute for Health and Care Excellence (NICE) in 2002 concluded that it was unable to recommend the use of these DMTs within the UK National Health Service,9 but recognised that these drugs could be cost-effective over the longer term if early treatment effects on disability persisted. Consequently a novel risk-sharing scheme (RSS) was set up between the UK Department of Health, the pharmaceutical companies, professional and patient groups to deliver these DMTs cost-effectively10 (see online supplementary appendix 1 for details).
Supplemental material
A key feature of the scheme was the monitoring of disability progression in a cohort of patients to test whether observed outcomes were in line with those required for cost-effectiveness. This observational study recruited over 5000 UK patients prescribed the interferon-βs and glatiramer acetate between 2002 and 2005 and followed them up over a 10-year period in order to measure the long-term effectiveness of the drugs when compared with a modelled natural history cohort. Two yearly analyses were performed and if observed outcomes deviated from target by more than an agreed margin, the price of the drugs would be adjusted to restore cost-effectiveness.
At 2 years the initial Ontario natural history data set was deemed not suitable to model the untreated control group because the disability scores had been smoothed,11 and the British Columbia MS database was selected and validated.12 13 A second independent analysis model (a multilevel model (MLM)) was added14 to corroborate results from the Markov model specified in the RSS.15
After 6 years of follow-up,13 the drugs in aggregate showed a 40% reduction in the rate of deterioration in disability on the MLM in patients with relapsing remitting disease (24% on the Markov model); this translated into a reduction of 43% (multilevel) or 42% (Markov) in the rate at which utility worsened, which was on track for the cost-effective target.10
The scientific analysis plan for this 10-year analysis16 was further revised in line with intention-to-treat principles, with additional analyses of (1) subgroups, (2) the influence of time on treatment effectiveness and (3) the effect of treatment on the time to loss of unaided ambulation. Here we report the final results of this study, focusing on the longer term effect of DMTs on disability progression.
Methods
The detailed protocol can be found elsewhere12–14 and the following is a summary.
Patient recruitment and follow up
Between May 2002 and July 2005, 72 sites across the UK recruited patients with RRMS or SPMS fulfilling the Association of British Neurologists (ABN) 2001 criteria for treatment (Expanded Disability Status Scale (EDSS) ≤6.5; ≥18 years old; two relapses in the last two calendar years).17 Drug selection reflected clinical practice and was led by individual patient and physician choice within the licensed indications in the UK. Ten-year follow-up was planned with the annual EDSS18 scores, whether treatment was continued or not. Telephone assessments were permitted for EDSS values over 6.19
For this final analysis the main outcome was an ‘intention to treat’ analysis which included all recruited patients, both RRMS and SPMS at baseline, and all follow-up scores including those from patients switching to non-scheme DMTs. However, subgroup analysis also focused on the RRMS at baseline patients, since this was the cohort for which the price adjustment scheme was set up.
Natural history comparator
The British Columbia MS data set is a population-based database, established in 1980, with the EDSS scored by the MS neurologist at outpatient visits.1 Patients (n=978) were identified who, between 1980 and 1995, fulfilled similar eligibility criteria to the RSS cohort. The ‘baseline’ for these patients was taken as the first clinic visit at which they fulfilled the criteria. Patient information was included only up to the end of 1995, after which DMTs were widely available in Canada.
Outcomes
For scientific purposes, our primary interest was to compare the rate of disability worsening (ie, disease progression) of patients treated with DMTs, as observed in the RSS, with that in an untreated modelled comparator control group (‘comparison against control’). Disease progression was modelled in the patients in the British Columbia data set adjusting for differences in prognostic factors (EDSS at baseline, age at onset) between the two data sets. The technical details are explained below. Disease progression was measured in terms of the accumulation of disability (as measured by EDSS) and worsening of quality of life (expressed as utility, derived from the EDSS score—see online supplementary appendix 2), for eligible and treated patients with at least one EDSS score after baseline. Outcomes were expressed both as absolute differences between progression observed in the RSS treated group and the comparator control group, and the relative difference in progression (expressed as a percentage).
The secondary outcomes included the area under the curve (a cumulative measure of reduction in disability using the absolute value of area under EDSS–time curve calculated using the trapezoid rule) and the delay in the median time required for sustained progression to the clinically relevant milestone of EDSS 6.0 (needing a stick to walk 100 m), confirmed at least 6 months with no subsequent lower scores.20
Supplementary analyses
A wide range of prespecified sensitivity analyses (online supplementary table 1 and 2) were conducted to assess assumptions related to modelling and loss to follow-up. Prespecified subgroup analyses allowed us to examine treatment effect by sex, EDSS and disease course (RRMS/SPMS) at baseline, disease duration and recruitment date. (Patients recruited later in the scheme may be more typical of normal clinical practice than those recruited earlier, many of whom had been waiting for treatment and had more advanced disease.) We also used a variety of methods to explore the apparent changes in the treatment effect over time (online supplementary appendix 3).
Supplemental material
Statistical design
In order to calculate the expected progression for untreated patients, two independent models were developed, a Markov model and an MLM—for further details see online supplementary appendix 4. Both models used data from the natural history comparator data set and these were validated in previous studies12 14 as being reliable methods for predicting the untreated outcome. The essential role of the modelling is to adjust for the (relatively slight) differences in baseline characteristics between the natural history and RSS data sets.
Markov model
The Markov model uses the annual probabilities of moving between EDSS scores (or remaining on the same score) from the untreated values derived from the British Columbia data set. These probabilities are then applied to the baseline EDSS scores of the RSS cohort and to subsequent modelled EDSS states over 10 years to give the expected EDSS progression for untreated patients. The difference between the expected untreated and observed RSS treated mean EDSS score represents the treatment effect.
Estimation was by the Jackson continuous time method21 using age at onset dichotomised at the median as a predetermined covariate.12 Because the assumption in the Markov model is that the transition probabilities from one specific EDSS score do not vary over time (and this assumption is unlikely to be precise), we used a ‘time-varying’ model, with separate transition matrices estimated for the first 2 years after baseline and for the rest of the follow-up period, as a sensitivity analysis. CIs on projections using the Markov model are derived by bootstrapping.
Multilevel model
The MLM22 23 uses the mean trajectory for the whole population, the variation of individual trajectories about this mean and the fluctuation of individual EDSS scores about the trend for each individual. The untreated values were again derived from the British Columbia data set. The model is applied to the baseline data for patients in the RSS data set to predict the EDSS progression without treatment for each individual. The projections are then combined across all individuals to produce a predicted untreated mean EDSS progression for the whole RSS cohort. This is then compared with the observed data in the RSS (the ‘comparison against control’) to estimate the absolute treatment effect.
For consistency with the Markov model,12 age at onset (binary variable) was included as the only covariate after previous covariate modelling found this to be sufficient. Validation of the model14 24 was undertaken on the British Columbia cohort (internal validation) and also using a natural history data set from the University Hospital of Wales (external validation). Bootstrapping was used to derive 95% CIs.
Time to sustained EDSS 6.0
To estimate the time to sustained EDSS 6.0, a parametric (Weibull) model was fitted to the British Columbia Multiple Sclerosis (BCMS) data, with gender and baseline EDSS as covariates. A similar model was fitted to the RSS data. To adjust for differences in baseline distributions, the strata were combined using as weights the proportion of patients at baseline in the RSS data set (see online supplementary appendix 5 for details).
Governance of the study
An independent Scientific Advisory Group consisting of Pelham Barton, Yoav Ben-Shlomo, Richard Gray and chaired by Richard Lilford developed and approved the statistical analysis plan. Representation from the authors, NICE, the MS Trust and the Department of Health attended the Scientific Advisory Group meetings. The representatives from each company were observers at the Scientific Advisory Group meetings but had no role in the data collection, analysis or preparation of the manuscript.
Results
Patient disposition and characteristics
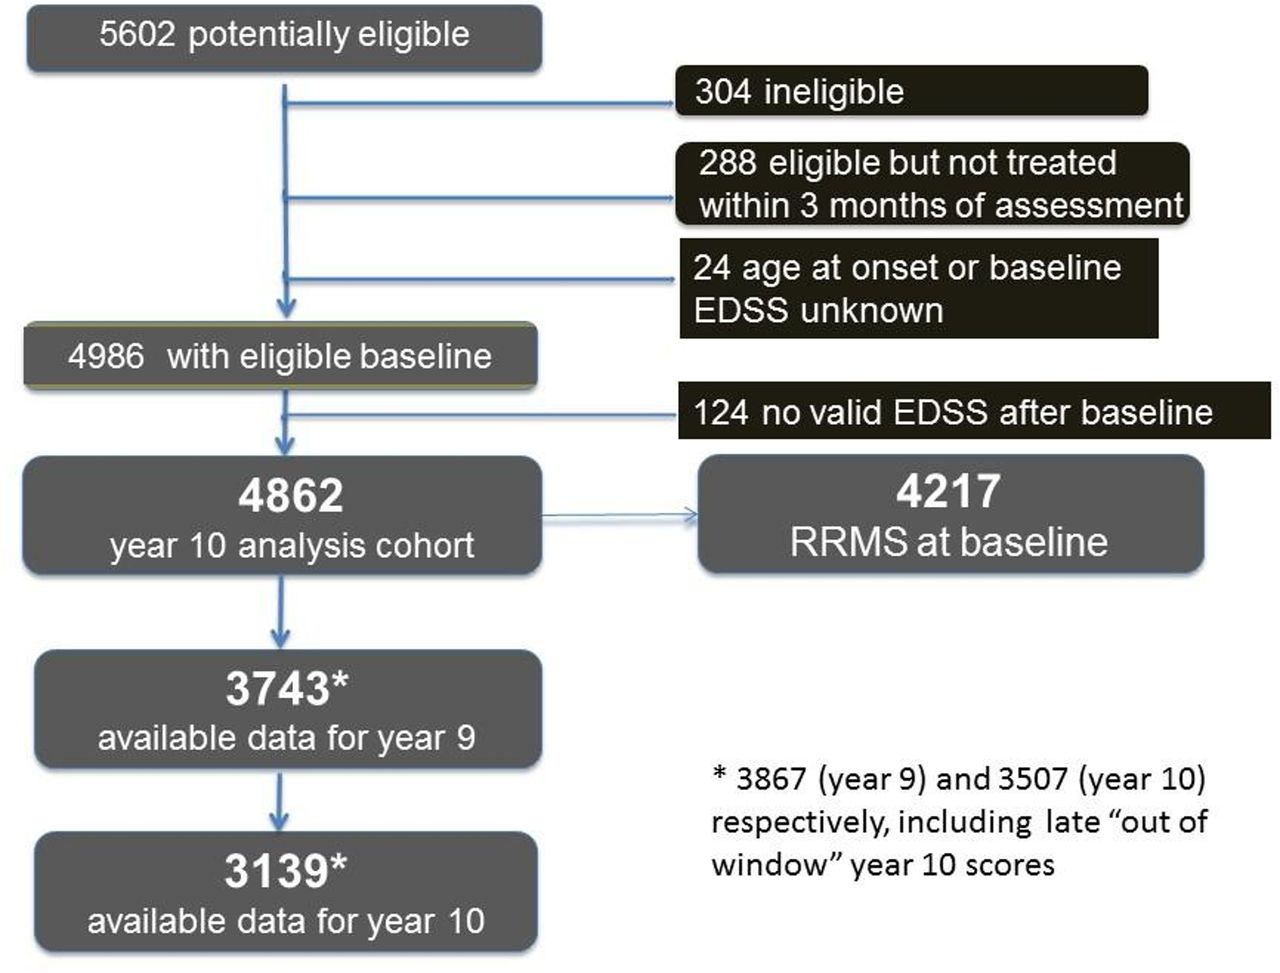
Out of 5602 patients registered for recruitment, 4986 were consented and eligible for treatment, began treatment, and had baseline assessments. Of these 4986, 4862 (97.5%) had at least one follow-up EDSS score and were included in the primary analysis. Of these, 17% switched to non-scheme drugs during follow-up, with the majority using natalizumab or fingolimod, and 18% discontinued treatment during the study. The Consolidated Standards of Reporting Trials diagram is shown in figure 1 (details in online supplementary table 2). The median follow-up was 10 years, the mean follow-up was 8.7 years and 77% of the primary analysis group had a minimum of 9 years of follow-up data. An additional 2.6% had late year 10 data collected, used in the sensitivity analysis.

Consolidated Standards of Reporting Trials diagram for all patients in the UK MS risk-sharing scheme. EDSS, Expanded Disability Status Scale; MS, multiple sclerosis; RRMS, relapsing remitting MS.
The baseline characteristics for the analysis cohort were similar to those in the British Columbia data set (online supplementary table 3), although RSS patients had on average slightly higher EDSS and age at onset and thus slightly longer disease duration on first assessment; however, the models adjust for baseline EDSS scores and age of onset.
Primary outcomes
The primary outcomes are shown in table 1. The absolute 10-year treatment effect was a reduction of 0.61 using the MLM (95% CIs 0.55 to 0.66) and of 0.12 in mean EDSS using the Markov model (95% CIs 0.07 to 0.17). The corresponding relative reduction in progression was 28% (95% CIs 26% to 31%) for the MLM and 7% (95% CIs 4% to 10%) for the Markov model. However, using the time-varying Markov model, the effect size closely mirrors the MLM results (see below). In utility terms, the reduction in progression was 23% (95% CIs 20% to 26%) on the MLM and 24% (95% CIs 21% to 27%) on the Markov model. Figure 2A,B shows how the observed disability progression deviates over the 10-year period from that expected for untreated patients (the comparator control group) for the MLM.
Outcomes of the primary analysis: primary analysis cohort, including patients with SPMS at baseline (n=4862; average follow-up 8.7 years)
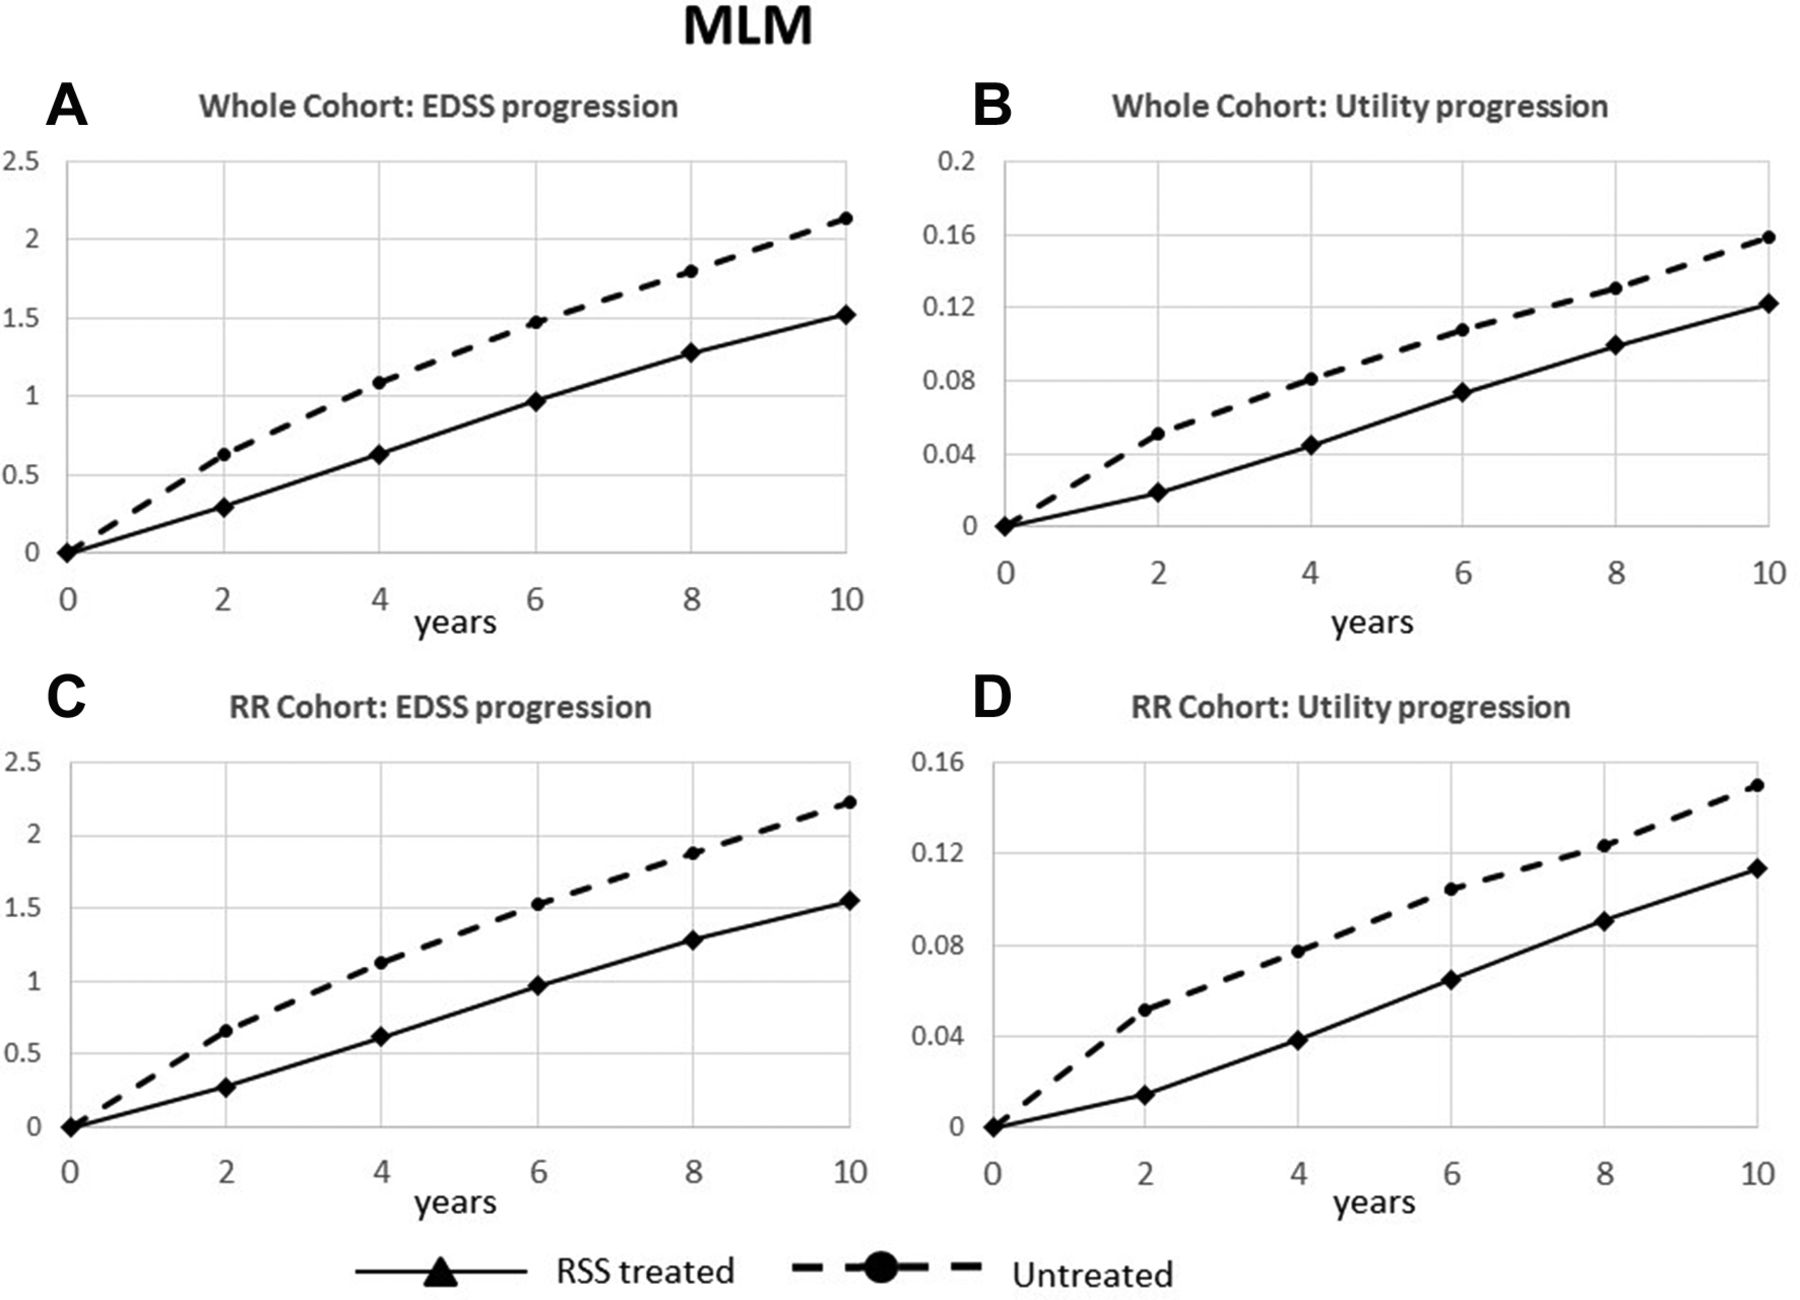
Comparison against control results using the MLM model: disability outcomes over 10 years in RSS patients and in the untreated comparator control group, for the whole cohort (A) EDSS progression and (B) utility progression, and for the patients with RRMS at baseline (C) EDSS progression and (D) utility progression. EDSS, Expanded Disability Status Scale; MLM, multilevel model; RRMS, relapsing remitting multiple sclerosis; RSS, risk-sharing scheme.
Secondary outcomes
The cumulative benefit accrued over the first 10 years of treatment for the whole cohort (the area under the curve for the full period) was 1.3 EDSS years (95% CIs 0.9 to 1.6—estimates available only for the Markov model). The estimated median time for the whole cohort to reach sustained EDSS 6.0 using the Weibull model was 12.5 years (95% CIs 11.8 to 13.3); this compares with 8.4 years (95% CIs 7.4 to 9.6) for untreated patients (figure 3), indicating that treatment is associated with a delay of 4.0 years (95% CIs 2.7 to 5.3) in reaching this relevant disability endpoint.

Time to sustained EDSS 6.0 in RSS treated patients and in the untreated comparator control group. EDSS, Expanded Disability Status Scale; RSS, risk-sharing scheme.
Sensitivity analyses
The results of the sensitivity analyses are shown in table 2 and online supplementary table 4. As expected, excluding EDSS scores after patients switched to alternative treatments—effectively censoring later data from patients on a worse trajectory—makes the results appear more favourable to the DMTs. Imputing missing values in the RSS data set makes relatively little difference to the outcomes, except in the deliberately extreme case (greater than a standard worse case scenario) in which we added 0.5 EDSS points to each imputed value (on average, doubling the imputed progression since the last available score), where the magnitude of the treatment effect on EDSS was reduced by roughly a quarter. In contrast, a variant in which we ‘enriched’ the British Columbia data set by imputing additional values for patients with relatively sparse follow-up and re-estimated the transition probabilities resulted in a substantially greater treatment effect. Finally, using variant of the Markov model with time-varying transition probabilities resulted in a greater treatment effect, with a much closer agreement for the EDSS results to those from the MLM. Online supplementary appendices 6 and 7 provide further details.
Sensitivity analyses (EDSS basis)
Subgroup analyses
Estimated treatment effects were rather larger for the subset of patients with RRMS at baseline (table 3, figure 2C,D; MLM), with 31% and 14% reduction in EDSS worsening and 24% and 31% reduction in utility worsening (MLM and Markov models, respectively).
Main outcomes, patients with RRMS at baseline: subgroup of patients with RRMS at baseline (n=4217; average follow-up 8.9 years)
Other prespecified subgroup analyses using the Markov model (tables 4 and 5, and online supplementary table 5) suggest that greater treatment effects are associated with a lower EDSS score at baseline, patients with shorter time from disease onset, women rather than men, patients on treatment throughout rather than those who come off treatment, and patients recruited later in the scheme. The MLM however did not find evidence of a reduction in treatment effect with increasing baseline EDSS.
Subgroup analyses by type of MS, date of baseline assessment and baseline EDSS (both models): EDSS outcomes
Other subgroup analyses (Markov model only)
Changes over time
Table 6 shows how the main outcomes using the MLM model change when the primary analysis is repeated with years 2, 4, 6, 8 and 10 as the end year. The results suggest that, although the treatment effect continues throughout the follow-up period, it becomes progressively smaller. We explored this through a number of prespecified supplementary analyses using both models, including the version of the Markov model with time-variant transition probabilities. The results (online supplementary appendix 8) confirm this trend of a large initial effect—in the first year or two after treatment initiation—followed by a smaller continuing effect. A sensitivity analysis using year 1 as the baseline (table 2 and online supplementary table 4) also showed a positive but smaller treatment effect.
Variation of the treatment effect with year of analysis (MLM)
Discussion
Main findings
Our findings show a clinically significant treatment effect maintained at 10 years, on both EDSS and quality of life outcomes, with a meaningful delay to sustained loss of unaided ambulation of around 4 years in an already impaired cohort at treatment onset (median EDSS 3.5).
Our analysis also highlighted a gradual attenuation of the treatment effect over time, or perhaps a large initial effect followed by a more modest continuing effect. The treatment effects appeared larger for patients with RRMS, those who start treatment earlier in their disease course and for women. The evidence for the effect of baseline EDSS on the treatment effect is less clear.
Methodological issues
This unique study addresses an important issue related to the long-term impact of the first-generation DMTs, which was not possible to address by a conventional RCT. By establishing a novel RSS between the manufacturers and payers, we were able to collect high-quality long-term data on disease progression on a treated cohort and use historical data on untreated patients to construct a comparison control group.
Given the inevitable limitations of observational data, our study has important strengths. The RSS cohort is one of the largest cohorts ever used in a study of this type, with over 42 000 patient years of data, with 9 years or more of data for nearly 80% of patients—a dropout rate over a decade comparable with that seen in recent 2-year treatment trials.25 26 Moreover these results reflect the ‘real world’ performance of the DMTs and include the effects of patients discontinuing treatment, and may be more generalisable than estimates from highly selected short-term RCT populations. Our natural history comparator, from the British Columbia data set, is also the largest and most complete data set of untreated patients available for MS research.1 We used two completely independent modelling techniques, with complementary strengths and weaknesses: the multilevel repeated measures model can more easily take account of variations in the rate of disease progression between individual disease trajectories, whereas the Markov model predicted more accurately the number of patients at high EDSS levels which largely determine changes in mean utility (see (online supplementary appendix 4). A third model, used for the survival analysis, confirmed the finding of a clinically significant treatment effect on time to loss of unaided ambulation.
We have implemented ‘intention to treat’ principles, adapting the methods of our 6-year study13 to include all eligible and consented patients with MS prescribed these DMTs, including those with SPMS as well as RRMS at baseline, and data from patients who switched to different DMTs—including non-scheme DMTs—during follow-up. We believe therefore that we have mitigated an important source of potential bias. Naturally, the possibility of bias from incomplete follow-up remains, but we have tested this by extensive sensitivity analyses with imputation of missing values. In addition, the patterns of follow-up seem broadly similar between the RSS and the British Columbia cohorts,13 so any residual biases are likely to offset one another (see online supplementary appendix 7). If anything, our results may be biased against a treatment effect because we used telephone questionnaires in the UK cohort to capture data from patients with high EDSS scores who were unable to attend clinic, whereas there was no equivalent for the BCMS cohort. Our models are designed to adjust for the (relatively small) difference in baseline characteristics between the British Columbia and RSS data sets, but if this adjustment is imperfect this would be expected to bias the results against the treatment effect since RSS patients had on average marginally worse prognostic factors than British Columbia patients.
There are several other potential biases that must be considered before assuming a causal explanation for the DMTs that may have resulted in differences in the natural history of the two cohorts unrelated to treatment.
Geographical differences
Could our UK patients have a milder form of MS than the natural history British Columbia patients? Although British Columbia is more ethnically diverse, MS still predominates in Europeans there.27 More direct evidence demonstrated similar untreated trajectories by using our Canadian data set to reproduce accurately 10-year outcomes in a Welsh untreated MS cohort.24
Temporal differences
Could untreated patients with MS have a slower disease progression than they used to? This concept has been supported by the observation that the relapse rates in the placebo arms of RCTs have been reducing. This is likely to be due to other reasons however. Now DMTs are widely available, ethical considerations make it likely that patients with more active disease are prescribed MS drugs rather than risk being allocated to a placebo arm. Additionally the later trials introduced early rescue therapy options and stricter relapse definitions, which would also reduce relapse rates recorded.28 Population-based cohorts are less likely to be biased by selection, and there is no evidence for a better prognosis in recent MS cohorts from British Columbia29 nor Wales (Neil Robertson, personal communication).
Confounding by indication
Could treatment decisions and clinical outcomes be confounded by variables such as disease severity and comorbidity, as seen in contemporary treated and untreated comparisons? This is not relevant in this study because there was no treated versus untreated comparison from within a single cohort. The BCMS patients were selected using the same inclusion criteria applied to the UK patients. Additionally both analysis methods adjusted for baseline EDSS and age at entry, and adding other covariates made little difference to the outcomes.12 Previous results from the British Columbia data20 30 demonstrated that indication bias may be important when comparing with contemporary untreated patients,20 because untreated patients differed, having a milder disease even though fulfilling the same baseline criteria for treatment. When the authors compared treated patients with historical controls as in our study, they showed a trend towards a treatment benefit on time to reach EDSS 6.0 (relative risk 0.77, CI 0.58 to 1.02), which is comparable with our results considering they had a much smaller treated cohort (n=868 vs 4986) with shorter follow-up time (mean 5.2 and median 5.1 years vs 8.7 and 10 in our study). The use of marginal structured Cox modelling (which included the contemporary untreated patients) did not change interpretation of findings.30
Selection bias
UK patients eligible for DMTs prior to 2002 but who progressed rapidly so they were no longer eligible would have been excluded. This bias would favour a treatment effect. Working against a treatment effect is the exclusion of those who were previously eligible but were no longer active enough to be included. A bias against a treatment effect might have occurred due to the presence of prevalent as well as incident ABN eligible patients, which would have included patients with later disease being treated, and it is possible that DMTs may be less effective later on in the disease course. Indeed our results suggested a greater treatment effect when excluding patients recruited in the first 18 months (once the backlog of prevalent patients had been entered). It is also reassuring that disease duration at study entry was almost identical for both data sets (table 3).
Other methodological issues worth considering are the use of the EDSS as the main outcome measure and the requirements for the EDSS scoring. Although the EDSS is not sensitive to change over the shortterm and focuses on mobility, it is the most widely used and accepted measure of disability in MS. Using this measure also allows us to convert the outcome to quality of life measures for cost-effectiveness calculations and to assess whether our results are plausible by comparing the results with other studies. The clinicians in our study did not undergo formal EDSS training as is required in clinical trials, rather the EDSS was collected within the routine clinical setting. Sites were instructed to use the same clinician to perform the EDSS over time where possible, and it was performed mainly by neurologists with expertise in MS. This was similar to the way the British Columbia natural history data set EDSS measurements were performed and thus comparable. The interobserver variability in our study was previously reported31 to have a kappa value of 0.59, 0.71 and 0.85: for full agreement, within 0.5 and within 1.0 EDSS scores, respectively, and it is expected that the intraobserver variability is even better.
On balance, therefore, we consider that there are sound reasons for believing that these results represent a true treatment effect. These reasons include the good agreement between our estimates of the absolute treatment effect at year 2 of a mean EDSS difference of 0.2213 and those derived from a meta-analysis of RCTs which gave a mean EDSS difference of 0.2532; the generally good agreement between two very different modelling approaches (particularly when the Markov models allows time to be included in the model); the adjustments included in each model to allow for the (relatively small) differences in baseline characteristics between the British Columbia and RSS data sets; and the use of a wide range of sensitivity analyses to test for possible residual sources of bias.
Implications for the treatment of MS
Assessing the longer term effectiveness of treatment is vital in considering the cost-effectiveness of expensive treatments for chronic conditions, but RCTs have not and cannot address this in MS where disability is acquired over many years. We have performed the only prospective long-term study of the treatment effect of MS DMTs, and have managed to recruit and retain a very large cohort (with higher levels than many short-term RCTs). Our results show that the benefits seen in the short term for these drugs are maintained over a 10-year period, although the treatment effect appears to decrease over time and may not justify the prices for these drugs in some healthcare systems particularly where the drug costs are higher.33 This apparent waning effect would be consistent with the recent meta-analysis34showing an inverse age-dependent association with efficacy. Because age, disease duration and EDSS scores are all inter-related and the latter two were associated with the treatment effect size in our study, it is not clear what is the driving factor. Although newer treatments are now available and are often preferred because of greater efficacy or ease of administration, their cost-effectiveness has in turn been assessed by NICE using incremental comparison with these first-generation drugs and more recently in direct head-to-head studies now that placebo studies are regarded as unethical. Thus the results of the MS RSS will have important consequences for assessing the cost-effectiveness of subsequent currently licensed and future drugs for MS.
Our finding that the treatment effect of these drugs is attenuated over time could have important implications for clinical practice, both for MS and perhaps for other longer term conditions. It might now be ethical to conduct an RCT to determine whether dicontinuation of treatment—after a given period on treatment, or after reaching a given level of disability—offers any disadvantage over continuing treatment. An RCT is currently under way to assess the effects of withdrawing treatment in older patients with MS who have had no relapses or new brain lesions for at least 5 years.35 Future trials of treatments for MS could be designed so that one arm receives treatment for an initial period and then discontinues treatment. On the basis of our findings, it might be more cost-effective—and ultimately in the interests both of patients with MS and of patients with other conditions—to intervene earlier in the disease course, rather than to persist with treatment for long periods.
Acknowledgments
We acknowledge the input of Pelham Barton and Richard Gray, who were members of the SAG, and Nicola Russell and Tracy Nicholson, who represented the MS Trust throughout this project. The multilevel modelling project was funded by the NIHR Health Technology Assessment programme (HTA project 10/55/01) and has been published in full in the Health Technology Assessment journal series.23 Visit the HTA programme website for more details (http://www.nets.nihr.ac.uk/projects/hta/105501). 72 centres have participated in the collection of data for the risk-sharing scheme from across the UK. Data have been collected over a 10-year period, and thus changes have been seen within the clinical teams at the centres. The authors are grateful to all the clinicians, nurses and administrators for the work undertaken at the centres, which made the RSS possible. A list of the centres can be found at http://www.mstrust.org.uk/research/risksharingscheme. The MS Trust has performed an administrative coordinating role in the risk-sharing scheme, and PAREXEL has performed the data collection from the sites and undertaken the analytical work. The British Columbia MS database has been maintained over the years by grants from various sources, including the MS Society of Canada, the MS/MRI Research Group, the US National MS Society and the Canadian Institutes of Health Research. We gratefully acknowledge the BC MS Clinic neurologists who contributed to the study through patient examination and data collection (current members listed on https://www.mstrust.org.uk/risk-sharing-scheme -BC-clinic-neurologists). RL and YB-S are supported by the NIHR Collaboration for Leadership in Applied Health Research and Care, West Midlands and West, respectively.
References
Footnotes
YB-S and RL contributed equally.
Contributors JP, MD and MB were the clinical leads for the study involved in the day-to-day running of the study. JP and MD were responsible for writing the paper and advising on the interpretation of the results. MB was responsible for revising the paper. ML, KT and YB-S performed the MLM, revised the paper and interpreted the results; in addition YB-S was on the scientific advisory committee. BP and TB were responsible for the Markov model analysis, revising the paper and advising on interpretation of the results. NR supplied the Welsh natural history data set and was involved in the validation of the MLM and revising the paper. HT, FZ and JO oversaw the use of their BC natural data set, revised the paper and interpreted the results. RL was the chair of the scientific advisory board, advised on the analysis and interpretation of the results, and revised the paper. CD was responsible for the oversight of the study, the analysis and interpretation of both models, and writing and revising the paper.
Funding The administration costs of the risk-sharing scheme were split equally five ways among the UK health departments and the four manufacturers of the DMTs (Biogen Idec, Merck Serono, Bayer, Teva UK). Additional funding from the UK Health Technology Assessment programme was obtained for the development of the MLM model (HTA Project: 10/55/01)The views and opinions expressed therein are those of the authors.
Competing interests None declared.
Patient consent Obtained.
Ethics approval Ethical approval for the RSS was given by the South East Medical Research Ethics Committee (MREC 2/01/78). The University of British Columbia's Clinical Research Ethics Board approved the study.
Provenance and peer review Not commissioned; externally peer reviewed.
Data sharing statement The data storage governance is under review to assess who will store the data on behalf of the MS Trust, the four pharma companies and the Department of Health. Also the oversight committee to give permission for access to data is being discussed currently.
Linked Articles
- Editorial commentary