Article Text

Abstract
After decades of basic research with many setbacks, artificial intelligence (AI) has recently obtained significant breakthroughs, enabling computer programs to outperform human interpretation of medical images in very specific areas. After this shock wave that probably exceeds the impact of the first AI victory of defeating the world chess champion in 1997, some reflection may be appropriate on the consequences for clinical imaging in rheumatology. In this narrative review, a short explanation is given about the various AI techniques, including ‘deep learning’, and how these have been applied to rheumatological imaging, focussing on rheumatoid arthritis and systemic sclerosis as examples. By discussing the principle limitations of AI and deep learning, this review aims to give insight into possible future perspectives of AI applications in rheumatology.
- magnetic resonance imaging
- outcomes research
- rheumatoid arthritis
- systemic sclerosis
This is an open access article distributed in accordance with the Creative Commons Attribution Non Commercial (CC BY-NC 4.0) license, which permits others to distribute, remix, adapt, build upon this work non-commercially, and license their derivative works on different terms, provided the original work is properly cited, appropriate credit is given, any changes made indicated, and the use is non-commercial. See: http://creativecommons.org/licenses/by-nc/4.0/.
Statistics from Altmetric.com
Key messages
There is a long history of artificial intelligence (AI) in imaging in rheumatology, using classical AI methods, but most of them did not make it into clinical practice.
Recently a subgroup of AI methods, called deep learning, has shown the potential to automatically interpret images beyond human-level accuracy.
AI and deep learning have, however, practical and theoretical limitations, that may complicate a rapid and widespread use in clinical practice.
AI will unlikely replace rheumatologists or radiologists in interpreting images, instead a hybrid solution will probably develop that benefits from both artificial and human intelligence.
Introduction
Currently, artificial intelligence (AI) receives much attention, in which it may sometimes be perceived as an obscure technology that may elusively affect our society. It is however also very clear, that AI can be used less controversially to improve efficacy and efficiency in medical care and research, with a special focus on medical imaging. This narrative review gives an overview of the background of AI and its use in clinical imaging in rheumatology, together with a discussion on its strengths and limitations, and an outlook on future applications.
What is AI?
Although it has become well-known to the general public only recently, AI is by no means new. The first attempts to mimic human reasoning by electrical circuits dates back to the 1940s.
AI can be defined loosely as the capability of a computer system to perform a task that usually or traditionally would require human intelligence. In the AI domain there are different subcategories (see figure 1). AI can include systems that simply execute tasks that would not require the system to learn at all. In medical imaging, for example, AI can be applied to detect anatomical structures using handcrafted algorithms that simply implement the idea of a software engineer. The vast majority of methods that have been developed during the past decades fall within this general category (blue area in figure 1). On the other hand, a subgroup of AI techniques, called ‘machine learning’ (ML), is able to learn automatically from the data it is presented with, mostly using ground truth data as training sets (ie, supervised learning). This collection of methods again consists of many different algorithms to automatically recognise patterns, also developed during the past decades, of which ‘deep learning’ is a subgroup. Deep learning is based on the concept of artificial neural networks, that mimic human learning capacity using mathematical representations of neurons and their interconnections. These neural networks exist already a couple of decades but obtained revolutionary results only in the past few years. AI has conquered many obstacles during its development, as overestimation of AI capabilities in those days (and maybe still today) and a lack of major breakthroughs led to several setbacks.

Different subgroups of artificial intelligence methods.
Within the domain of each of the above AI categories, there is a wide range of applications using different types of data. If AI methods mimic the way, in which humans use their sense organs to interpret their environment (eg, speech recognition), this is called ‘Machine Perception’. If these senses are visual, it is called ‘Computer Vision’.
Artificial neural networks
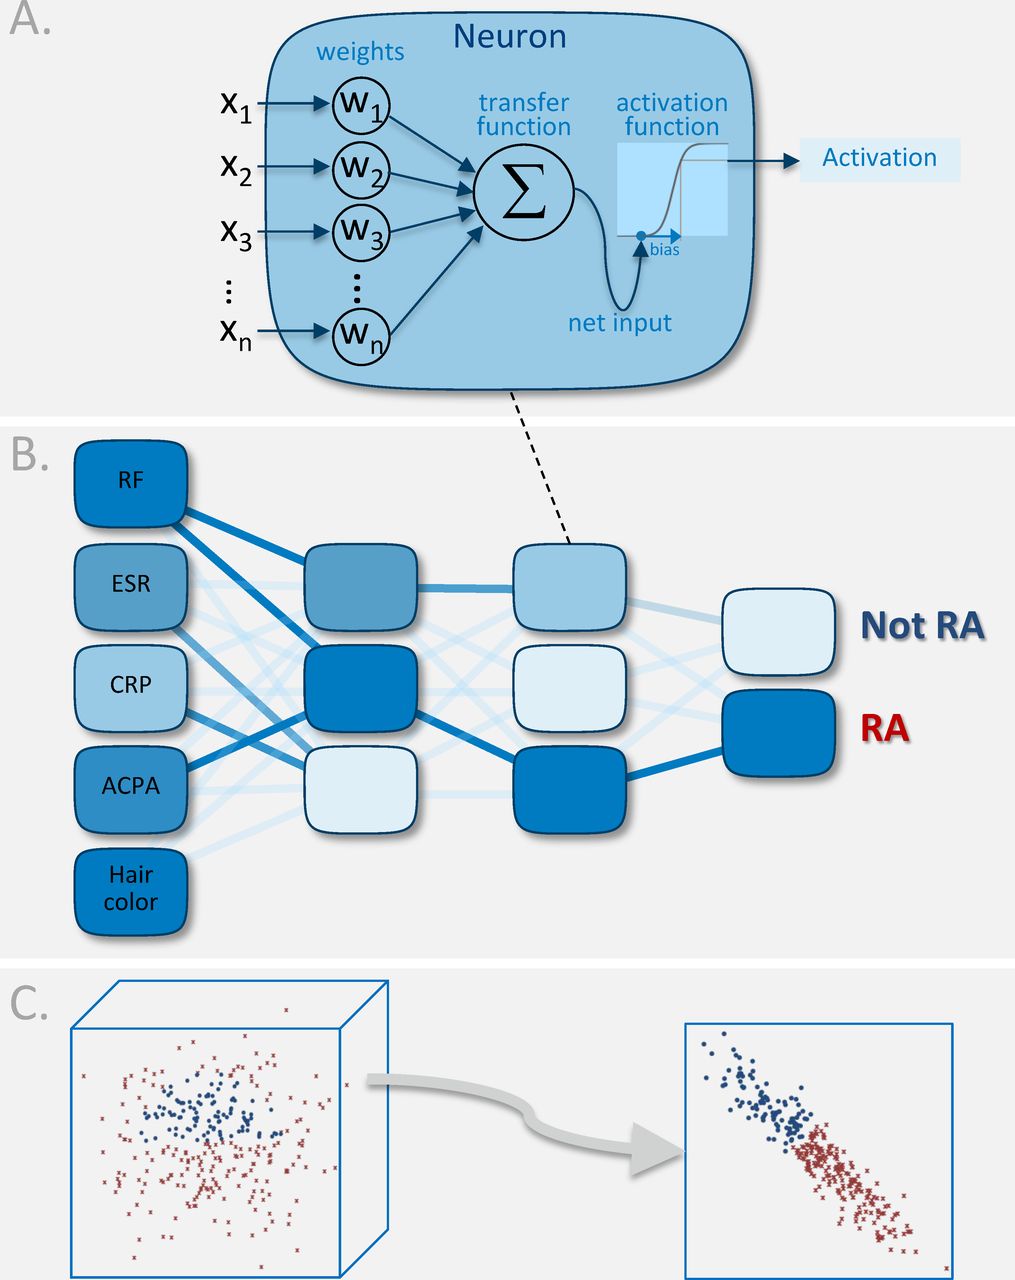
The basic building block of an artificial neural network (ANN) is a mathematical model of a neuron (see figure 2A). An artificial neuron can learn to give an output signal only if a certain combination of inputs occurs. In order to do this, it takes a number of input values, x1, …, xn, multiplies each with its corresponding weight, w1, …, wn, and accumulate them into a net input for an activation function. This activation function then produces the output ‘activation’ value, after applying a shift (‘bias’) to the net input value. The weights and bias are then the parameters that need to be set (‘learnt’) in order to produce the proper activation.

Diagram of an artificial neural network. (A) an artificial neuron takes a number of input values x1, …, xn, multiplied by the corresponding weights, w1, …, wn. The inputs, summed by the transfer function, is then input for the activation function that produces the output signal after applying a bias (or threshold). (B) A multi-layered network of artificial neurons could for example be trained to distinguish RA from non-RA, based on blood markers. since irrelevant biomarkers like hair colour obtain small weights, these input values are neglected. (C) The working of an artificial neural network can be considered a consecutive deformation of the feature space such that the last layer makes a clear distinction between RA and not-RA, based on only two values, that are non-linear combinations of the input values. RA,rheumatoid arthritis.
To tackle more complex problems, a network of neurons can be constructed containing many different layers of neurons, hence the term ‘deep’ learning. There can be millions of parameters of weights and biasses that then need training. In a hypothetical example of automatically diagnosing rheumatoid arthritis (RA), presented in figure 2B, the first layer may contain input values and the final layer may then provide the outcome of the classification (RA vs not-RA). The input values may represent relevant measurements, such as rheumatoid factor, erythrocyte sedimentation rate, C-reactive protein and anti-citrullinated protein antibodies, but also irrelevant biomarkers (hair colour). For a single subject, the set of input values can be considered a coordinate in a multidimensional ‘feature space’ (see figure 2C). Applying consecutive layers in an ANN can then be considered transformations of these coordinates, followed by non-linear scaling. If input values turned out to be irrelevant, the dimension of this space will be reduced by setting the corresponding weights to zero. In the end, an ANN therefore repeatedly deforms the feature space in such a way that in the final layer there are (in this example) only two dimensions left, in which the two groups of patients can be distinguished by taking the label with the highest output value.
Convolutional neural networks
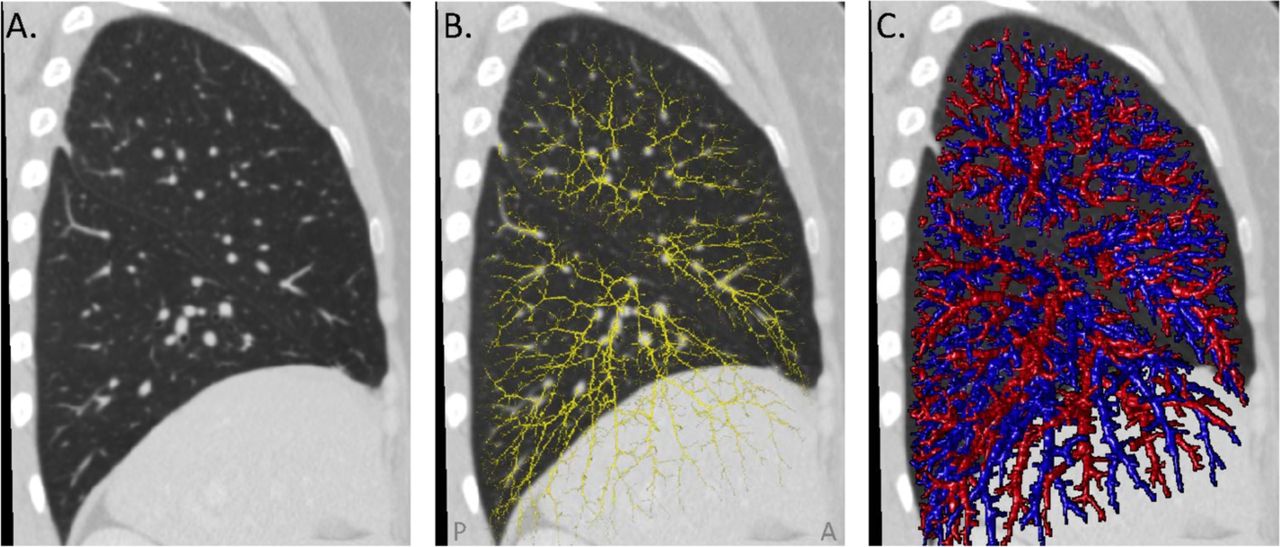
A special type of ANNs are convolutional neural networks (CNNs) that mimic biological vision by taking an image as input layer and adding layers that process images by filters (defined by convolution kernels, the weights of which are trainable). After training, these weights take values such that certain structures (like edges) are enhanced in the images, which are needed to recognise more complex structures by deeper layers in the network. Remarkably, this mechanism resembles the way, in which images are perceived in biological vision. In the human retina, the output of the receptors are preprocessed by retinal ganglion cells in a similar way.1 Therefore, a CNN not only models learning mechanisms but also seems to mimic evolution of human vision into ‘hard-wired’ circuits, for example, in the retina (see figure 3, for an example of a CNN for detecting anatomical structures in the wrist).2 3

An axial MRI image of the wrist2 (A), processed by a CNN. The neural network decomposes the image into different so-called ‘feature maps’.3 The CNN apparently learnt to apply low level filters first, by, for example, enhancing transitions from dark to bright in the vertical direction (B), or enhancing bright spots surrounded by a dark area (C). In the deeper layers of the network, it highlights higher level patterns, that seem to represent, for example, bony structures (D) and skin (E). In the final layers, the network combines all information into one output image that consists of labels for skin (yellow), bones (green), vessels (pink) and the different tendon groups (in separate colours) (F). ACPA,anti-citrullinated protein antibodies; CNN, convolutionalneural network; CRP, C-reactive protein; ESR, erythrocytesedimentation rate; RA, rheumatoid arthritis;RF, rheumatoid factor.
One of the most important steps of developing CNNs for a particular task, is not only designing the network architecture and their settings (hyperparameters), but also collecting and defining the proper data sets. Generally, three separate data sets are used: (1) for training the neural network, in order to set the proper weights and biasses; (2) for validation of the performance of a trained network using separate data, in order to determine the appropriate architecture and hyperparameters and to prevent overfitting and (3) for testing the ultimate network, since usually the design of a network is adapted after a couple of training-validation cycles. If a neural network is successful, a fourth data set may be needed for external validation, in order to prove its general applicability for other scanner manufacturers, imaging protocols or study populations.
Image interpretation
To analyse images with greater efficacy and efficiency, considerable effort has been put into the development of AI methods to perform image processing. It is only recently, however, that these automated methods have gained the accuracy that matches or even surpasses human performance in specific areas, that is, in classifying skin lesions4 and detecting diabetic retinopathy.5
Ever since the advent of digital imaging in the 1970s, human interpretation of images gradually started to rely on image processing techniques. This may even go unnoticed, but digital images are nowadays always fully automatically enhanced or reconstructed first, before they are presented to the observer. Thus, human interpretation is now fully dependent on computerised image processing. But there are other levels, at which a computer can help the physician to subsequently interpret the resulting images (see figure 4). Dependent on the level of automation, these methods are divided into fully-human, semi-automatic and fully-automatic interpretation.
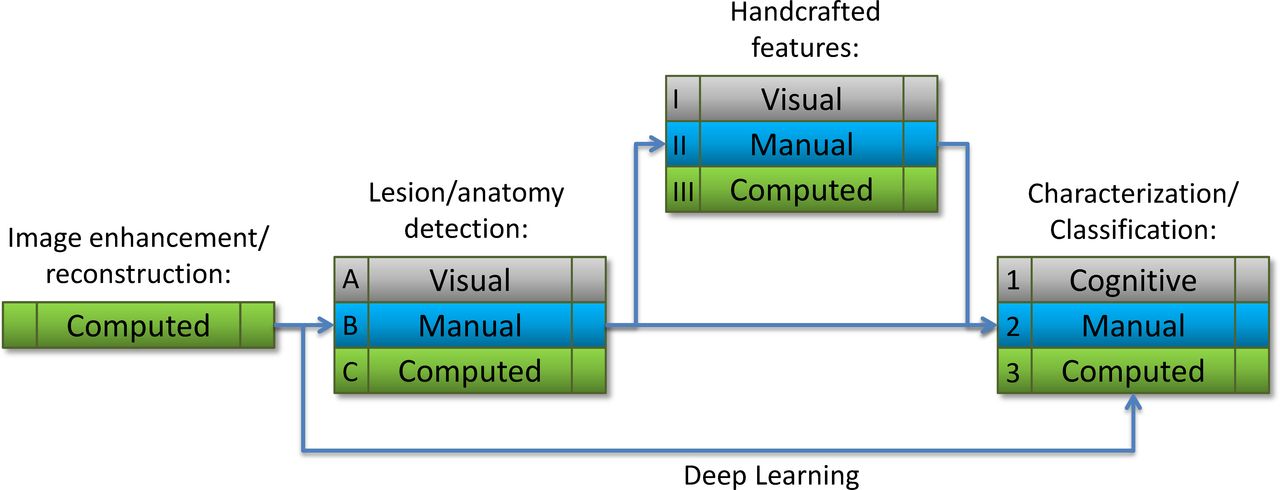
Possible pathways for classifying diseases based on imaging. Each phase (lesion detection, feature selection and classification) can be performed in three different ways: (1) By an observer using her/his knowledge, experience or ‘gut feeling’ (indicated by grey labels, A, I and 1, respectively); or (2) by an observer who manually annotates, measures and classifies (blue labels B, II and 2, respectively) or (3) by computer (green labels, C, III and 3, respectively).
Fully-human interpretation
As performed mostly in daily clinical practice, a physician interprets the digital image by visually detecting lesions and directly classify them (route A-1 in figure 4, from visual detection to cognitive characterisation). Alternatively, in order to come to a semi-quantitative interpretation, the severity of the detected lesion can be scored visually, based on visually estimating handcrafted features (such as joint space narrowing or image intensities that indicate inflammation). Based on this visual score the lesion can be classified (route A-I-2). These features can also be obtained from manual calliper measurements (route A-II-2). An example of the latter approach is using measurements of the joint space width in mm’s from X-rays (for assessing joint space narrowing in hand and feet joints), or the extent of inflammatory region around a tendon from MRI also in mm’s (to measure tenosynovitis in RA).
Semi-automatic interpretation
In a hybrid or ‘computer-aided’ approach, the computer can facilitate parts of the detection, quantification and classification tasks, in different ways:
The detection of lesions or anatomical structures is done manually, after which quantification is done automatically by computer. The subsequent classification can then be done either manually (route B-III-2) or automatically (route B-III-3). Early examples of the latter approach is the manual annotation of the synovial membrane in MRI scans, followed by an automatic calculation of the synovial volume to quantify synovitis in RA.6
Both detection and quantification of a lesion is performed automatically by AI methods, followed by a manual classification in order to come to a diagnosis (route C-III-2). Since the quantification is usually based on clearly defined (handcrafted) features, the quantification is performed automatically.
Fully-automatic interpretation
Here one can take one of two approaches.
In the ‘classical’ image processing approach, the lesions or anatomical structures are first detected automatically, followed by quantification of handcrafted features, and subsequently classification (route C-III-3); or
By using machine (deep) learning the handcrafted features are replaced by automatically learnt features. This means that detection, quantification and classification are performed in one step.
Applications of AI in imaging in rheumatology
In most publications, the goal of developing and applying AI in medical imaging is described along the same pattern. Sometimes, automation is required as an alternative to visual scoring, because automation would be less expensive, time-consuming and/or subjective, producing less interobserver and intraobserver variability; and it may require less extensive training and/or specific examiner skills. This goal is especially relevant for clinical trials, where subtle changes or treatment effects are expected that need to be detected accurately. Other reasons for automation are that these measurements could be more specific than visual scoring because a computer program is more consistent and less distracted by other image information.7
In some situations however, automatic quantification is not an alternative to visual scoring but a measurement on its own, because the imaging modality is already quantitative by nature (eg, CT densitometry or compositional MRI). The same applies when an automated method can quantify features that are impractical or impossible to assess by humans, because of the sheer amount of imaging data, or limitations in the human visual system, for example, difficulties in detecting subtle differences in absolute intensities.
The next three paragraphs give some examples of automatic quantification or classification in two distinct rheumatic disorders, RA and systemic sclerosis (SSc), representing primarily joint disorders and typical multiorgan diseases, respectively, followed by a special AI topic on comparative imaging.
Rheumatoid arthritis
As imaging of RA is mainly focused on (teno)synovitis, bone marrow oedema, bone erosions and cartilage loss, the developed automated image analysis methods are aimed to detect and assess these manifestations. Synovitis and bone marrow oedema can be assessed directly, as they invoke an increase or decrease in image intensity. In other words, the lesion creates its own signal; if there is no signal, there is no pathology. Bone erosions and cartilage loss would require a slightly different approach where bone or cartilage is first detected, followed by a comparison with an estimated original (or normal) volume of bone or cartilage. In other words, there is always a signal, but the question is whether its volume has decreased after disease onset. If a comparison with the original situation is not possible, the bone/cartilage measurement can only be used for monitoring disease progression, for example by quantifying changes in bone lesions over time.8
(Teno)synovitis
One of the first attempts to generally quantify inflammation in contrast-enhanced MRI scans of the hand was made in 2007, by classifying the image intensities into normal and inflamed using ML (Fuzzy clustering).9 Alternatively, dynamic contrast enhanced (DCE-)MRI of the hand and wrist have been used to quantify synovitis. These methods have been developed to align the time sequence of images through automatic image registration and subsequently classify the intensity versus time curves of each voxel into different patterns. The resulting perfusion maps can be used to detect synovitis and quantify their extent.10 As both of the above approaches may produce false positives outside the synovium, research has also been focussed on separately detecting and quantifying the synovium, based on prior segmentation of the bones, in, for example, the wrist.11 Deep learning has not been applied yet to classify MR images in terms of synovitis.
In ultrasound (power Doppler), the amount of available automated methods to quantify synovitis is relatively small compared with other imaging modalities, probably because of the technical challenges in analysing these images, due to image noise. Using classical image processing and ML, a method has been presented to automatically detect skin, bones and synovitis regions, the latter of which was quantified by their area.12 As in MRI, efforts have been made to detect bones as a preprocessing step for accurately defining the synovium, with classical AI methods13 and deep learning.14 Recently, applications of deep learning have been proposed to directly quantify synovitis from the entire image, by training a CNN with visual scoring as ground truth.15
Similarly to synovitis, quantification of tenosynovitis requires an automatic segmentation of tendons, in order to define the surrounding synovium and quantify inflammation in contrast-enhanced MRI. Our group has developed such an automatic framework in order to quantify tenosynovitis in the wrist.2 Next steps in our research are to apply deep learning in order to detect tendons (see figure 3) and quantify tenosynovitis, but also to classify the entire image by a single CNN.
Bone lesions
In order to quantify bone marrow oedema (BME), the first classical AI methods were based on DCE-MRI of the wrist.16 Using static postcontrast MRI scans of the wrist, BME could also be assessed automatically, specifically in early RA.17 So far, however, deep learning has not been investigated yet in measuring BME.
Early AI developments for automatically quantifying bone erosion use fractal analysis to characterise the texture of trabecular bones in the radius, based on plain radiographs.18 This type of analysis has only been employed in research, probably because measures from fractal analysis may be difficult to interpret clinically, especially if there are no normal values.
An alternative method detects the bones from hand radiographs and compare their shape with a statistical shape model from healthy bones and determine deviations from that model to detect and quantify erosions.19 More recently, deep learning has been employed to detect bone erosions from radiograph of hands.20 Using peripheral CT of the hand, classical AI-based21 and CNN-based22 methods were able to detect bone erosions.
Cartilage loss
Of the different RA features, most effort has been put into automatic quantification of cartilage loss, probably because of the wide availability of radiographs and because cartilage loss is also relevant for osteoarthritis.
From plain radiographs, cartilage loss can be assessed only indirectly, by measuring the joint space, since cartilage itself is not visible. Early AI development to quantify joint space width in the hand23 and knee24 date back to 1989. More recently, classical AI methods have been proposed to automatically measure joint spaces within the wrist.25
In MRI scans, cartilage thickness and volume have been measured using a wide variety of classical AI methods.26 Deep learning has been used to detect knee cartilage,27 which has been developed further more recently in order to classify cartilage lesions.28 Similarly, CNNs have also been applied to detect cartilage in the wrist joints.29
Systemic sclerosis
As SSc involves multiorgans, research on automated imaging biomarkers for vasculopathy and fibrosis has been focussed on different anatomical sites, such as skin, heart and lungs.
Vasculopathy
Nailfold capillaroscopy is an established modality to distinguish and classify sequential patterns of capillary abnormalities that are considered representative to the general microvascular involvement of SSc. With early computerised tools, the observer was able to perform calliper measurements (capillary dimensions and density) on screen, based on completely manually drawn contours30 or manually defined landmarks.31 Initially, the developed image processing methods closely followed the way, in which human observers would recognise morphological abnormalities (loop width, capillary density, etc), but researchers have also designed morphological features that are less obvious to quantify by hand, such as tortuosity32 and texture,33 followed by automated classification by ML.
Using chest CT, vasculopathy can be quantified with AI by detecting pulmonary vessels that can be resolved by CT (ie, down to ~0.5 mm in diameter) and subsequently quantifying their morphology to produce imaging biomarkers.34 These biomarkers estimate the number of small vessels and the difference in occurrence between small vessels and large vessels, which are found to be correlated with functional impairment of the lungs, in the absence of lung fibrosis. This is a typical example where a method is intended to be complementary to visual scoring, since it is practically impossible to measure all vessels in the lungs by hand or score them visually. Currently, our research group is working on applying neural networks to automatically distinguish pulmonary arteries from veins,35 so that it becomes feasible to measure the pulmonary vasculature separately, to increase its specificity (see figure 5).
Deep learning-based detection of the arterial and venous pulmonary vascular.35 (A) Sagittal cross-section of a right lung on chest CT; (B) detection of all centre lines of the pulmonary vessels; (C) classification into arteries (red) and veins (blue) by deep learning.
Cardiac complications of SSc can be quantified automatically from imaging by methods that rely on a long history of general applications in cardiology. ML methods have already been able to automatically quantify left and right ventricular function, based on ultrasound,36 MRI37 and CT.38,35
Fibrosis
In estimating fibrosis as manifested in changes in skin thickness, the modified Rodnan Skin Score methods based on palpation is the gold standard. Fully-quantitative alternatives have been proposed to measure skin thickness more directly from imaging.39 These methods employ for example ultrasound, MRI or optical coherence tomography (OCT) to determine skin thickness and other characteristics. AI-based image analysis methods have been introduced, to fully automatically measure skin thickness40 and other (epi)dermal characteristics41 from ultrasound images, and MRI42 and OCT.43 These automated imaging biomarkers, however, still need to be evaluated because the relatively new imaging techniques require further optimisation and standardisation, and have not yet been applied in SSc.
In chest CT, fibrosis has also been assessed automatically in the lungs, as an objective and more reproducible alternative to the visual Goh scoring system. Lung densitometry may be used to quantify interstitial lung disease, since lung tissue mass is expected to increase over time, which has been proven to correlate with a decline in lung function.44
With the success of deep learning in classifying images, an obvious next step is to develop neural networks that can distinguish different patterns for differential diagnosis and SSc staging from the different image modalities.
Comparative imaging
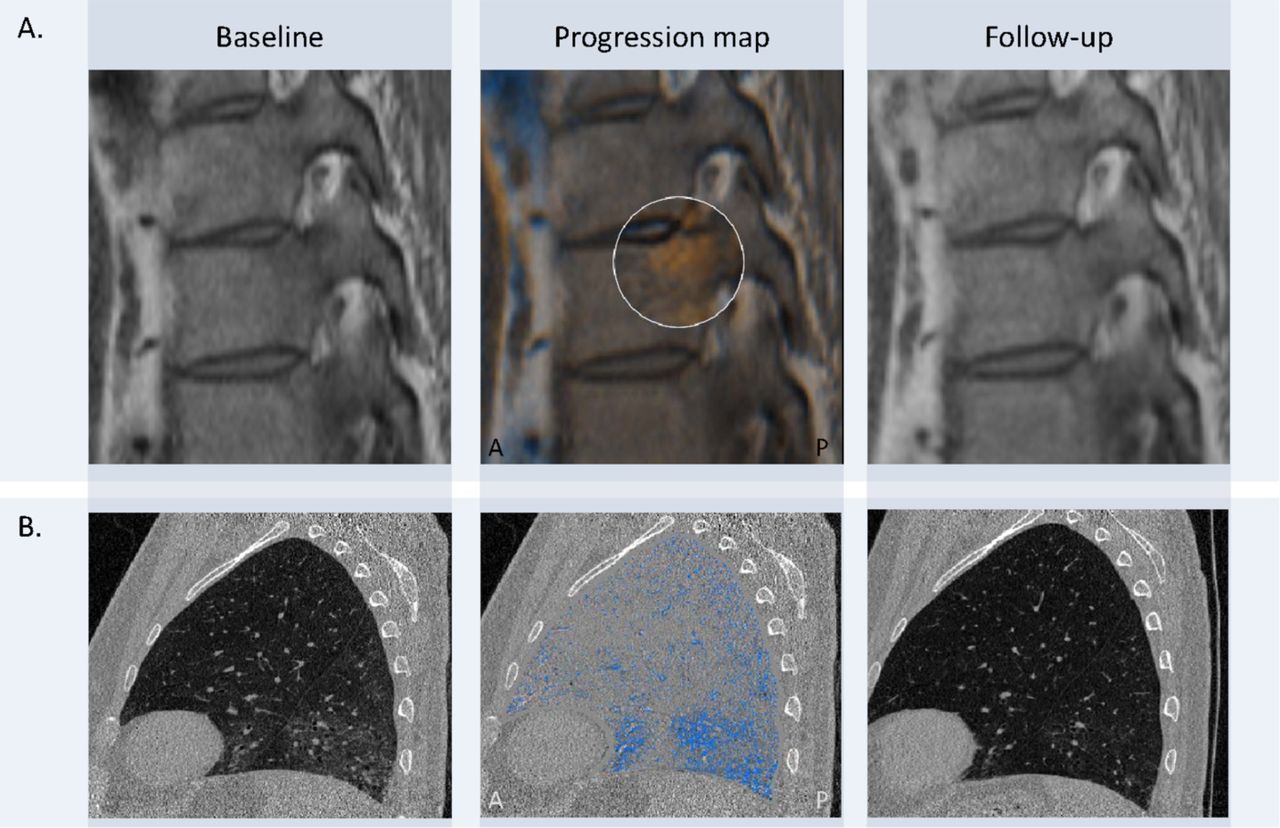
Whenever the question arises whether RA has progressed or not, a specific task is to basically ‘spot the differences’ in consecutive images. The evolution of the human visual system has however not been optimised to look for differences between two images (this is probably the reason why ‘spot the difference’ is a popular children’s game). On the other hand, computer vision is better equipped for detecting differences in image intensities. Therefore, a separate field of AI research, called ‘comparative imaging’ is focussed on providing difference images to the radiologist/rheumatologist to help find locations of RA progression or regression. In our research group for example, software has been developed to show inflammatory changes in vertebral lesions in axial spondyloarthropathy by matching baseline and follow-up MRI scans through image registration and subsequently display the changes over time by image subtraction and colour coding45 (see figure 6A). For SSc we have developed software to map the local changes in lung density over time (figure 6B). Other researchers have developed similar comparative imaging techniques to display changes in joint spaces in sequential hand radiographs46 and in bone lesions8 in MRI of the hand. It is very likely that deep learning methods will also enter this area of research, where CNNs could learn to distinguish relevant from irrelevant changes in image intensity over time.44 45 47

Two examples of comparative imaging. (A) Baseline (left panel) and follow-up (right) sagittal T1-weighted turbo spin echo (TSE) MRI scan of three thoracic vertebrae of a patient with suspected axial spondyloarthritis. Change in low signal intensity at the posterior vertebral body (high on stir – not shown) consistent with bone marrow oedema is appreciated. The middle panel shows the progression map, where a decrease in intensity is displayed in orange, and an increase in blue.45 (B) Baseline (left) and follow-up (right) CT scan of a patient with diffuse systemic sclerosis44 (left lung). The progression map in the middle panel shows the local density changes, with the same colour code; blue: decrease in density, orange: density increase. The map demonstrates that the ground glass densities were partly resolved by treatment. These two examples show clear changes in the images as an illustration, but more subtle difference that are less obvious to the human eye can also be displayed in this manner.47
Future perspectives
From the above overview, it is clear that there is extensive literature on imaging biomarkers in rheumatology, mostly using classical AI methods (using separate segmentation, feature extraction and classification steps). Applications of deep learning in rheumatology is sparse, but this will grow rapidly.
Until recently radiologists and rheumatologists were the only interpreters of clinical rheumatological images, and these images were digital solely because of their ease of archiving and transferring data. Recently, however, neural networks started to outperform human interpretation of images in very specific tasks.4 5 It is however unlikely that AI will replace humans, since generalisation of computerised image interpretation is much more difficult than in very narrow areas of expertise. A more likely scenario would be the development of a hybrid solution, which benefits from both artificial and human intelligence. As humans are less capable of analysing large amounts of multidimensional data, AI may help reducing the dimensionality or recognising patterns that are not apparent to the human eye and brain. This is especially true when image data is combined with other clinical data, producing even more big data, which cannot be handled with human power only.
Predicting the future of AI is tempting but difficult, as the time scale at which developments will occur is very difficult to estimate, considering the many setbacks AI experienced during its development. Since overestimation of AI’s capabilities is lurking, we need to be critical and be aware of the drawbacks and limitations of AI and deep learning.
Limitations of deep learning
All deep learning methods presented in this paper are examples of supervised learning, meaning that large amounts of ground truth data are needed to train the system. If these ground truth data can only be obtained from human interpretation, we are actually back to square one. Therefore, much effort needs to be put into manually annotating anatomical structures and lesions in images or classifying them (in consensus), in order to provide an accurate ground truth. Without a proper quality control, however, deep learning will learn to copy human mistakes. Furthermore, visual scoring may not be considered ground truth anymore, if our goal were to surpass human interpretation. Therefore alternative reference outcome measures will be needed, for example from longitudinal data, where the task will shift towards prediction of clearly defined outcomes instead of static assessment of disease severity.
Neural networks are certainly not off-the-shelf solutions, as there is not a generic network that solves all possible problems, like the human brain does. Therefore, today human expertise is still needed to design a neural network, including its settings, and to perform proper training, validation and testing. Evolutionary algorithms may, however, help designing networks in the future, in order to find the optimum architecture and hyperparameters automatically.
Much like humans may sometimes rely on their experience or ‘gut feeling’ without being able to clearly explain their decision, neural networks can also be considered ‘black boxes’. There are developments towards opening the ‘black box’ by providing so-called class-discriminating attention maps,48 which may give at least an indication of where the network had focussed on, in order to come to a certain classification. When it has been proven irrefutably that a neural network outperforms humans in a certain task, we will probably need to adapt and trust these systems in much the same way we would need to trust human experts. Legal and ethical issues are still open, however, especially on liability of machine-based clinical decisions and in collecting large amounts of confidential data.
It is unlikely that deep learning will completely replace all classical AI algorithms. For simple problems, deep learning may be too complex and non-linear to produce the proper solution. Furthermore, deep learning invents and extracts its own features from the images to come to a classification, whereas classical AI uses man-made features to measure. In many cases, however, there is a need for measurements, of which the physical meaning is clear. For example, the dimensions of a vessel is much more informative than a classification of this vessel by a neural network. In those cases, deep learning can still be very useful in the first part of the process, where the vessels need to be detected first.
Similar to the education and certification of a biological neural network (ie, the rheumatologists), an artificial neural network also needs to be trained and validated extensively, before it can be applied in the clinic. There is, however, an imbalance between the amount of published technical innovations, as described above, and the amount of techniques that actually make it into clinical practice. Due to publication bias, a large part of the innovations simply does not pass external validation, or only works on very specific data sets. But it also seems that performing validation studies is a limiting factor in itself. Researchers may only be interested in the purely technical innovation without aiming for a clinical application (‘hit and run’ research), and software validation is less interesting to basic researchers because of the amount of administration needed to obtain clearance from regulatory organisations for such a medical device. Software validation is therefore mostly performed by commercial companies, but still only if there is clear market viability for this product. Thus, a closer collaboration between universities and industry may be needed, as well as between technical and clinical researchers. For these types of collaborations, interdisciplinary university studies are essential to bridge this gap further. There are already several initiatives from the different professional organisations to create new training programme in the use of AI in medical imaging.
Dependency on image acquisition and reconstruction
Although this may sound trivial, it is good to keep realising that AI – as any assessment – is bounded by the somewhat denigrating concept of ‘garbage in, garbage out’. The accuracy of AI in image analysis is in the end limited to the accuracy of the image modality it takes as input. In cases where human image interpretation is the limiting factor, AI can help improving sensitivity and specificity of a particular assessment, by extracting additional information from the images. If not, the best AI can do is to improve reproducibility and time-efficiency and cost-efficiency. But even then, overall reproducibility may be limited by physiological variations (respiration or perfusion, for example, in pulmonary vascular imaging), or by operator dependency, for example, in ultrasound imaging.49 But even for the latter, CNNs may help reducing variability by automatic selection of the most informative frame.50 It is therefore important for AI experts to be on the watch for new image acquisition and reconstruction methods that may be more tailored to detect the specifics of a disease with higher reproducibility, and continuously adapt their AI methods to these new modalities or imaging protocols.
Dependency on image acquisition settings can also be more subtle, especially in follow-up analysis. As image analysis becomes more and more quantitative and sensitive, these methods may also pick up subtle changes in the imaging modality itself instead of the study subjects. In lung CT densitometry for example, the measured densities may shift or drift, simply by an update of the scanner’s reconstruction software or due to ageing of the X-ray tube. Therefore, quantitative analysis will put stricter requirements on the constancy of imaging devices. Moreover, so far image acquisition protocols have been optimised primarily for human interpretation. It could well be, however, that the optimal settings for image acquisition and reconstruction are fundamentally different for AI methods. Therefore, this has opened a new field of research aimed at formalising these image quality requirements and developing standardisation to guarantee stable diagnostic accuracy of AI.
Conclusions
Artificial intelligence has already been applied in imaging in rheumatology for a long time. In clinical practice however, only few of these methods have been adopted. The recent successes of deep learning will dramatically change this, where AI will be supplementary to human image interpretation and clinical reasoning.
Acknowledgments
The author would like to thanks Denis Shamonin, Evgeni Aizenberg, Zhiwei Zhai, Irene Hernández-Girón and Marius Staring for their technical contributions to this review paper, and Anne Schouffoer and Monique Reijnierse for reviewing the clinical aspects.
References
Footnotes
Contributors BCS performed the literature search and wrote the manuscript.
Funding Parts of the presented illustrations originate from the APPEAR project and ESMIRA project, both funded by the Dutch Technology Foundation (currently TTW) as part of the Netherlands Organization for Scientific Research (NWO), under grant number LPG. 07998 and 13329, respectively, and from support by China Scholarship Council scholarship number 201406120046.
Competing interests None declared.
Patient consent for publication Not required.
Provenance and peer review Commissioned; externally peer reviewed.
Data availability statement Not applicable