


Abstract
Receptor tyrosine kinase (RTK) signaling plays a key role in the development of breast cancer. Defining the genes and pathways in the RTK signaling network that are important regulators of tumorigenesis in vivo will unveil potential candidates for targeted therapeutics. To this end, we used microarray comparative genomic hybridization to identify and compare copy number aberrations in five mouse models of breast cancer induced by wild-type and mutated forms of oncogenic ErbB2 or the polyomavirus middle T antigen (PyMT). We observed distinct genomic alterations among the various models, including recurrent chromosome 11 amplifications and chromosome 4 deletions, syntenic with human 17q21-25 and 1p35-36, respectively. Expression of oncogenic Erbb2 (NeuNT) under control of the endogenous Erbb2 promoter results in frequent (85%) amplification at the Erbb2 locus with striking structural similarity to the human amplicon, resulting in overexpression of at least two of the genes, Erbb2 and Grb7. Chromosome 11 amplicons distal to Erbb2 arise in a model (DB) overexpressing a mutant variant of PyMT (Y315/322F) unable to activate phosphatidylinositol 3-kinase. These amplicons are not observed in DB hyperplasias or in tumors overexpressing wild-type PyMT and result in overexpression of Grb2 and Itgb4. Distal chromosome 4 deletions occur in a significantly higher proportion of Erbb2 than PyMT tumors and encompass 14-3-3σ (Stratifin), which is expressed at low or undetectable levels in the majority of NeuNT tumors. Our studies highlight loci and genes important in the regulation of tumorigenic RTK signaling in mammary epithelial cells in vivo.
Introduction
Deregulation of receptor tyrosine kinase (RTK) signaling is now recognized as important in the genesis and progression of human epithelial cancers, including breast cancer. For example, the RTK ERBB2 is genomically amplified and overexpressed in ∼30% of breast cancers, and overexpression correlates with poor clinical prognosis (1). As such, inhibitors of ERBB2 signaling, such as Herceptin (trastuzumab), have been developed and are presently used to treat ERBB2-positive breast cancer (2, 3). Unfortunately, response to Herceptin varies dramatically, even between patients that overexpress the target receptor. Indeed, only ∼30% of patients that overexpress ERBB2 respond to Herceptin therapy (2, 3). To understand why this is the case, it is necessary to improve our understanding of the molecular mechanisms that contribute to tumor formation in response to ERBB2 overexpression and activation of RTK signaling.
Mouse models of breast cancer have provided critical insights into the relative importance of candidate cancer genes in breast tumorigenesis and provide ideal experimental systems with which to dissect the genetic and biological complexities of the human disease. Genetic background and environment, factors known to influence the onset and progression of cancer, are much more homogeneous in mouse models than in humans, and cooperative genetic and molecular oncogenic mechanisms can be assessed within the context of a single initiating oncogenic event. One experimental approach has been to define cooperative oncogenic mechanisms by characterization of molecular alterations that develop in tumors induced by well-established oncogenes, such as ERBB2. In such tumors, genetic alterations of the ERBB2 transgene itself (4–6) and known cancer genes, such as Tp53 (7), have been observed. It is likely that other unidentified genes are also involved as recurrent copy number aberrations (CNA), such as deletions and amplifications, have been observed in ERBB2-induced and other transgenic models (6, 8, 9). Because recurrent CNAs encode potent tumor suppressors, such as TP53 and RB1 (10), and oncogenes, such as MYC, CCND1, and ERBB2 (11–13), it is likely that assessment of recurrent CNAs not definitively associated with known cancer genes will lead to the identification of new and important genes that regulate tumorigenesis.
To further elucidate the mechanisms of oncogenic RTK signaling, we used high-resolution array comparative genomic hybridization (CGH) to characterize and compare CNAs that emerge in breast cancer mouse models that express wild-type or mutated forms of the potent oncogenes ERBB2 and polyomavirus middle T (PyMT) in the mammary epithelium. Erbb2 and PyMT contain several tyrosine residues that, when phosphorylated, bind proteins that transduce signals to tumorigenic RTK pathways. For example, PyMT activates the RAS-mitogen-activated protein kinase (MAPK) pathway by binding Shc at tyrosine residue 250 (14). Neu tyrosine residue Y1144 (YB), which binds Grb2, and residue Y1227 (YD), which binds Shc, both activate RAS-MAPK (15). Interestingly, exclusive signaling from either YB or YD in mouse mammary epithelium results in tumors with differential rates of metastasis, indicating that signaling from these sites is redundant but not identical (16). The phosphatidylinositol 3-kinase (PI3K) pathway is also activated by PyMT and oncogenic Erbb2 by recruitment of the p85 regulatory subunit of PI3K to phosphorylated tyrosines; in the case of Erbb2, this occurs primarily through heterodimerization with Erbb3. Our array CGH analyses of CNAs that emerge in ERBB2- and PyMT-induced mouse breast tumors point to several additional loci and genes that likely play an important role in oncogenic RTK signaling. The CNAs characterized in this study are syntenic to recurrently altered loci in human breast tumors, illustrating the utility of this approach for interrogation of loci and genes altered in human breast cancer.
Materials and Methods
Genomic DNA extraction. Genomic DNA was extracted from fresh frozen mammary tumor tissue as described (17). For formalin-fixed, paraffin-embedded tumor samples, four to six 10-μm-thick serial sections were placed on glass slides. One slide was H&E stained; the remaining slides were soaked in xylene (two 5-minute treatments) to remove the paraffin, rehydrated in an ethanol series (100%, 95%, 70%, 50%, and 0%), and air dried. Using the H&E-stained slide as a guide, tumor tissue from the deparaffinized slides was manually dissected away from normal breast using a dissecting microscope. Scrapings were placed in a 1.5 mL Eppendorf tube and incubated twice with 1 mL xylene (15 minutes, 55°C) followed by two incubations with 1 mL of 100% ethanol (15 minutes, room temperature); samples were spun at 14,000 rpm for 10 minutes between incubations. Scrapings were air dried for 10 minutes after the final ethanol treatment and incubated overnight at 50°C in 200 to 400 μL DNA extraction buffer [50 mmol/L Tris (pH 8.0), 1 mmol/L EDTA, 0.5% SDS, 1 mg/mL proteinase K]. The samples were then cleaned using a phenol/chloroform extraction, ethanol precipitated, washed, and resuspended in 20 to 30 μL TE (pH 7.6).
Array comparative genomic hybridization. Array CGH was done essentially as described (17–19). Briefly, 500 ng each of strain matched tumor and reference (FVB/N mouse spleen) DNA were respectively labeled with Cy3-dUTP and Cy5-dUTP (Amersham, Piscataway, NJ) using the Bioprime DNA Labeling kit (Invitrogen, Carlsbad, CA) following the manufacturer's recommendations. We eliminated predigesting our genomic DNA with DpnII before labeling because we observed no difference in array CGH performance when this step was eliminated. We substituted the deoxynucleotide triphosphate (dNTP) mix in the labeling kit with our own mix (400 μmol/L each of dCTP, dATP, and dGTP and 300 μmol/L dTTP). Labeling reactions were run for 6 hours to overnight, cleaned up with Sephadex G50 columns, and used immediately or frozen at −20°C. Toward the latter stages of our study, DNA labeling and cleanup was done using the array CGH genomic labeling module (Invitrogen) using our own dNTP mix. Labeled test and reference DNAs were ethanol coprecipitated with 50 μg mouse Cot-1 DNA (Invitrogen), washed, and resuspended in hybridization buffer. We eliminated yeast tRNA from the hybridization buffer with no obvious change in array CGH performance. Following hybridization, TIFF images were acquired using a CCD camera and spot statistics was calculated using custom software (20). Analysis of array CGH data and multivariate statistical analysis were done as described (18, 19). Raw experimental data and sample and array platform information can be accessed through the Gene Expression Omnibus data repository4
using accession no. GSE3012.Quantitative reverse transcription-PCR. Fresh frozen tissue (∼10 mg) was homogenized using a Tissue-Tearor homogenizer (Fisher Scientific, Pittsburgh, PA) and total RNA was purified using the RNeasy mini kit (Qiagen, Valencia, CA). RNA quality was checked using a Bioanalyzer (Agilent, Palo Alto, CA) and quantitated using a NanoDrop instrument (NanoDrop Technologies, Montchanin, DE). RNA was reverse transcribed using the iScript cDNA synthesis kit (Bio-Rad, Hercules, CA) following the manufacturer's recommendations. Quantitative reverse transcription-PCR (RT-PCR) analysis was done on all samples in triplicate using an ABI Prism 7900 sequence detection system. “No reverse transcriptase” controls were done on all samples. The following forward and reverse PCR primers and probes (tagged with a 5′-FAM dye and 3′-BHQ1 quencher) were used for quantitative RT-PCR: Grb2, forward 5′-CCAGCAGATATTCTTACGGGACA, reverse 5′-CTCGCCATCCTCCTGGG, and probe 5′AGATGCCACAGCAGCCAACCTACGTC; Itgb4, forward 5′-CCCAGCACAACCACCGTTAT, reverse 5′-GGAGGCGATGAAAGTGTTTGA, and probe 5′-TCGGTGAGCACGATGAAACCGACA; Gus, forward 5′-CTCATCTGGAATTTCGCCGA, reverse 5′-GGCGAGTGAAGATCCCCTTC, and probe 5′-CGAACCAGTCACCGCTGAGAGTAATCG; and L19, forward 5′-CCAAGAAGATTGACCGCCATA, reverse 5′-GTCAGCCAGGAGCTTCTTGC, and probe 5′-CATCCTCATGGAGCACATCCACAAGC;
Immunoblotting. Fresh frozen tumor tissue (∼10 mg) was ground in liquid N2 using a pestle and mortar and placed in 1.5 mL Eppendorf tube. Tissues were then incubated on ice for 15 minutes with occasional mixing in 400 μL protein extraction buffer containing 50 mmol/L HEPES (pH 7.4), 150 mmol/L NaCl, 25 mmol/L NaF, 5 mmol/L EGTA, 1 mmol/L EDTA, 1% Ipegal, 1× Complete Protease Inhibitors (Roche, Indianapolis, IN), and 1× Phosphatase Inhibitor Cocktails I and II (Sigma, St. Louis, MO). Samples were spun at 20,000 × g at 4°C for 15 minutes, and the supernatant was stored at −80°C or immediately quantitated using a protein assay (Bio-Rad). Protein (20 μg) was used for Western blotting using the following antibodies (following the manufacturers' recommendations): total AKT and Grb2 (Cell Signaling Technology, Beverly, MA); 14-3-3σ, 14-3-3β/ζ, and Tyr1248 p-ErbB2 (Upstate Biotechnology, Lake Placid, NY); ErbB2/Neu and Grb7 (Santa Cruz Biotechnology, Santa Cruz, CA); β-actin (Sigma); and Ser473 pAKT (21).
Results
Copy number aberrations differ between Erbb2 and PyMT models. To compare genomic CNAs among various models of breast cancer, we did array CGH on 110 primary mouse breast tumors derived from five different models (5, 16, 22–24) summarized in Table 1. The number of tumors assessed in each model is provided in Fig. 1. Tumors were screened by array CGH using one of three different microarrays containing either 864, 1,056, or 1,344 BAC clones as described (17–19). Assessment of primary tumors revealed the presence of a broad range of genomic CNAs, including single-copy losses, single-copy gains, and focal high-level amplifications (Fig. 1A and B). To compare the frequencies of CNAs among the different models, we compared 644 BAC clones that were common to all three arrays and for which we had reliable genome mapping information. We first determined the frequencies of recurrent CNAs observed in the ErbB2-based models as a group (Fig. 1C) and in the PyMT-based models as a group (Fig. 1D). Regions of recurrent gain included chromosomes 2, 11, and 15, and recurrent losses were observed on chromosome 4, consistent with previous observations (6, 25). Interestingly, a comparison of the CNAs between ErbB2- and PyMT-based tumors revealed significant differences in the frequencies of change at certain loci (Fig. 1E). Distal chromosome 4 deletions were more frequent in ErbB2-induced tumors (P < 0.01), whereas distal chromosome 11 gains/amplifications were more frequent in PyMT-induced tumors (P < 0.01). These data suggest that differing oncogenic stimuli in mammary epithelial cells alter the spectrum of recurrent CNAs in resultant mammary tumors and that selection for distinct loci/genes depends on the initiating oncogenic event.
Transgenic mouse mammary tumor models assessed in this study
| Model | Promoter | Transgene | Description of transgene | Reference |
|---|---|---|---|---|
| TM | Endogenous Erbb2 | Activated Erbb2 | Knock-in model in which one copy of exon 1 of the endogenous Erbb2 gene is replaced with a Cre-inducible activated Erbb2 cDNA (NeuNT).* Expression of this cDNA is induced in mammary epithelium when crossed with MMTV-Cre–expressing mice. | 5 |
| YB | MMTV | Activated Erbb2 | Transgenic model expressing an activated erbb2 allele† containing point mutations (tyrosine to phenylalanine) at all five intracellular tyrosine autophosphorylation sites, except site 1,144 (YB). | 16 |
| YD | MMTV | Activated Erbb2 | Transgenic model expressing an activated erbb2 allele† containing point mutations (tyrosine to phenylalanine) at all five intracellular tyrosine autophosphorylation sites, except site 1,226/1,227 (YD). | 16 |
| MT | MMTV | PyMT antigen | Transgenic model expressing the PyMT oncogene, which possesses tyrosine kinase activity that stimulates a variety of signaling pathways, including PI3K and Ras-MAPK. | 22 |
| DB | MMTV | PyMT antigen | Transgenic model expressing a PyMT oncogene that contains point mutations (tyrosine to phenylalanine) at tyrosine phosphorylation sites 315 and 322, rendering it unable to activate the PI3K signaling pathway. | 24 |
Transforming activity induced by point mutation (valine to glutamic acid) in the ErbB2 transmembrane domain that induces ligand-independent receptor oligomerization.
Transforming activity induced by an in-frame 12–amino acid extracellular deletion (NDL1) that causes receptor dimerization and constitutive tyrosine phosphorylation (21).

Array CGH analysis of primary mouse breast tumors. A, copy number analysis of a YB tumor reveals the presence of single-copy losses (interstitial deletion on chromosome 4), low-level whole chromosome gains (chromosomes 1, 6, 14, and 17), and focal high-level amplifications (chromosome 5). B, copy number analysis of a second YB tumor reveals a distal 4 deletion, a distal 6 gain, and whole chromosome plus focal gains on chromosome 9. C, frequency of CNAs for 80 ErbB2-induced tumors (YD, n = 32; YB, n = 39; TM, n = 9). D, frequency of CNAs for 30 PyMT-induced tumors (MT, n = 14; DB, n = 16). E, statistical comparison of CNAs from ErbB2 versus PyMT tumors reveals that chromosome 4 deletions are observed more frequently in ErbB2 models (P < 0.01) and chromosome 11 gains/amplifications are observed more frequently in PyMT models (P < 0.01). F, frequency of CNAs in 39 YB tumors. G, frequency of CNAs in 32 YD tumors. H, multivariate statistical comparison of CNAs from YB versus YD tumors reveals that proximal chromosome 4 deletions are observed more frequently in the poorly metastatic YD model (P < 0.05) and focal chromosome 9 gains are observed more frequently in YB tumors (P < 0.01). Ps for all comparisons were corrected for testing multiple loci. A-H, the genomic position for each clone is plotted based on NCBI Build 33 of the mouse genome assembly. Gray vertical bars delimit chromosome boundaries. The bottom and top dashed horizontal bars in E and H represent 0.05 and 0.01 significance levels, respectively.
Array CGH analysis of primary mouse breast tumors. A, copy number analysis of a YB tumor reveals the presence of single-copy losses (interstitial deletion on chromosome 4), low-level whole chromosome gains (chromosomes 1, 6, 14, and 17), and focal high-level amplifications (chromosome 5). B, copy number analysis of a second YB tumor reveals a distal 4 deletion, a distal 6 gain, and whole chromosome plus focal gains on chromosome 9. C, frequency of CNAs for 80 ErbB2-induced tumors (YD, n = 32; YB, n = 39; TM, n = 9). D, frequency of CNAs for 30 PyMT-induced tumors (MT, n = 14; DB, n = 16). E, statistical comparison of CNAs from ErbB2 versus PyMT tumors reveals that chromosome 4 deletions are observed more frequently in ErbB2 models (P < 0.01) and chromosome 11 gains/amplifications are observed more frequently in PyMT models (P < 0.01). F, frequency of CNAs in 39 YB tumors. G, frequency of CNAs in 32 YD tumors. H, multivariate statistical comparison of CNAs from YB versus YD tumors reveals that proximal chromosome 4 deletions are observed more frequently in the poorly metastatic YD model (P < 0.05) and focal chromosome 9 gains are observed more frequently in YB tumors (P < 0.01). Ps for all comparisons were corrected for testing multiple loci. A-H, the genomic position for each clone is plotted based on NCBI Build 33 of the mouse genome assembly. Gray vertical bars delimit chromosome boundaries. The bottom and top dashed horizontal bars in E and H represent 0.05 and 0.01 significance levels, respectively.
Association of genomic copy number aberrations with metastasis. Previous studies on the YB and YD ErbB2 models revealed that YD tumors are less likely to develop lung metastases than YB tumors despite possessing a higher primary tumor burden (16). To determine whether any genomic changes were associated with the metastatic phenotype, we compared the frequencies of CNAs between YB (Fig. 1F) and YD (Fig. 1G) primary tumors. This revealed two significantly different loci (Fig. 1H). Proximal chromosome 4 was deleted more frequently in YD tumors than YB tumors (P < 0.05); YD tumors tended to lose the whole chromosome, whereas YB tumors harbored many partial losses involving only the distal portion of the chromosome. We also observed that focal low-level gains on chromosome 9 occurred more frequently in YB than in YD tumors (P < 0.005). This gain most often encompassed a small ∼290-kb region [National Center for Biotechnology Information (NCBI) Build 33:chr9:99,992,612-100,283,457] and encodes three small mRNAs. The gains seemed to be restricted to a single YB line (YB2), as we did not observe focal chromosome 9 gains in five other YB lines (n = 12 tumors).
To further assess whether particular CNAs were associated with metastases in these models, we assessed 11 lung metastases from Erbb2-based models. Intriguingly, we did not observe any new CNAs in the metastases compared with CNAs seen in primary tumors, including three matched tumor-metastasis pairs (data not shown). These data suggest that acquisition of additional CNAs is not required for metastasis in these models and that the metastatic phenotype is an inherent property of the primary tumor itself. This observation is consistent with recent microarray expression analyses of human breast tumors, which revealed that the metastatic potential of a tumor can be predicted based on the expression signature of the primary tumor alone (26, 27).
Chromosome 11 amplifications develop in DB tumors, are associated with a hyperplastic-tumor switch, and do not involve Erbb2. Our preliminary assessment of MT and DB primary tumors using the genome scanning arrays revealed low-level copy number increases (log2 ratio < 1.0) on distal chromosome 11 in ∼43% of tumors (7 of 16 DB tumors and 6 of 14 MT tumors). In addition, we detected high-level amplifications (log2 ratio > 1.0; >2 copies) distal to the Erbb2 locus in 44% of the DB tumors (7 of 16). These amplifications were not observed in MT tumors. Because the DB variant of PyMT is unable to bind and activate the p85 subunit of PI3K, our data suggested that these amplifications encode genes that play important roles in regulating tumorigenic processes otherwise regulated by PI3K.
To investigate these amplifications in further detail, we generated a DNA microarray containing a contig of 190 BAC clones across the distal 28 Mb of mouse chromosome 11. The array also contained 95 clones distributed evenly across the remaining chromosomes to facilitate genome normalization. The contig included the Erbb2 locus to facilitate detailed study of the Erbb2 amplicon in TM tumors, in which Erbb2 is amplified (6). We did array CGH on all MT and DB samples originally screened using the lower-resolution genome scanning arrays. Consistent with the scanning arrays, the contig arrays revealed low-level gains in both DB and MT tumors, whereas amplifications (log2 ratio > 1.0) were exclusive to DB tumors. The frequencies of change were similar between genome scanning and contig arrays, with some minor exceptions. We detected additional low-level gains in one MT tumor and one DB tumor using the contig arrays that were not obvious from the genome scanning arrays. We also detected amplified clones in a DB tumor in which only low-level changes had been observed previously. Strikingly, although some amplifications in DB tumors encompassed broad regions of distal 11 akin to low-level gains (Fig. 2A), most amplifications were highly complex, with six of eight amplified tumors showing multiple (≥3) peaks (Fig. 2B-D). Several of these peaks were observed in multiple tumors, suggesting that multiple genes mapping to distal 11 play an important role in tumor development. We observed amplicons throughout the distal ∼23 Mb of distal chromosome 11 (chr11: 98,779,599-121,648,857; NCBI Build 33), all of which were at least 0.6 Mb distal to Erbb2.
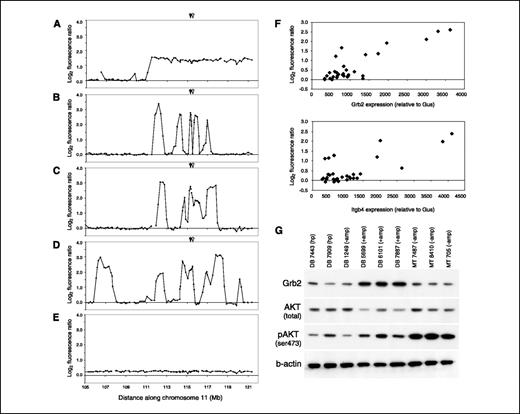
Chromosome 11 amplifications in DB tumors are associated with a hyperplastic to tumor switch and result in gene overexpression. A-E, copy number assessment of the distal ∼16 Mb of chromosome 11 in DB tumors and hyperplasias. Some amplifications (log2 fluorescence ratio > 1.0) covered a broad region of distal 11 (A), whereas most amplifications contained multiple distinct peaks throughout (B-D). Hyperplasias derived from DB mice did not contain amplifications, but some contained low-level gains (E) on chromosome 11, which clearly emerged as high-level changes in primary tumors derived from the same mouse (D). The genomic locations of candidate genes Grb2 (closed arrowhead) and Itgb4 (open arrowhead) are indicated. F, quantitative RT-PCR assessment of Grb2 and Itgb4 in DB hyperplasias, DB tumors, and MT tumors shows strong correlations of gene expression with gene copy number. mRNA levels were determined for each gene relative to control gene Gus and plotted against the fluorescence ratio for BACs that encode these genes; for Grb2, the average ratio of BACs RP23-368N3 and RP23-268J22 was used; for Itgb4, the ratio of BAC RP23-168C9 was used. The respective Pearson's correlations for Grb2 and Itgb4 were 0.85 and 0.73. The same Pearson's correlations were obtained when L19 was used as a control gene for quantitative RT-PCR. G, Western blot analysis shows that Grb2 protein is overexpressed in DB tumors with amplifications (+amp) relative to DB hyperplasias (hp), a nonamplified DB tumor (−amp), and MT tumors in which no amplifications were observed. Tumors with Grb2 amplification and overexpression show elevated pAKT and lower total AKT levels.
Chromosome 11 amplifications in DB tumors are associated with a hyperplastic to tumor switch and result in gene overexpression. A-E, copy number assessment of the distal ∼16 Mb of chromosome 11 in DB tumors and hyperplasias. Some amplifications (log2 fluorescence ratio > 1.0) covered a broad region of distal 11 (A), whereas most amplifications contained multiple distinct peaks throughout (B-D). Hyperplasias derived from DB mice did not contain amplifications, but some contained low-level gains (E) on chromosome 11, which clearly emerged as high-level changes in primary tumors derived from the same mouse (D). The genomic locations of candidate genes Grb2 (closed arrowhead) and Itgb4 (open arrowhead) are indicated. F, quantitative RT-PCR assessment of Grb2 and Itgb4 in DB hyperplasias, DB tumors, and MT tumors shows strong correlations of gene expression with gene copy number. mRNA levels were determined for each gene relative to control gene Gus and plotted against the fluorescence ratio for BACs that encode these genes; for Grb2, the average ratio of BACs RP23-368N3 and RP23-268J22 was used; for Itgb4, the ratio of BAC RP23-168C9 was used. The respective Pearson's correlations for Grb2 and Itgb4 were 0.85 and 0.73. The same Pearson's correlations were obtained when L19 was used as a control gene for quantitative RT-PCR. G, Western blot analysis shows that Grb2 protein is overexpressed in DB tumors with amplifications (+amp) relative to DB hyperplasias (hp), a nonamplified DB tumor (−amp), and MT tumors in which no amplifications were observed. Tumors with Grb2 amplification and overexpression show elevated pAKT and lower total AKT levels.
To gain insight into the stage of tumor development at which chromosome 11 amplifications develop in the DB model, we assessed six DB hyperplasias derived from mice for which we had array CGH data from a primary tumor. None of the hyperplasias showed high-level amplifications. However, low-level gains were observed in three of six hyperplasias, which manifested more obvious gains or high-level amplifications in the matched primary tumor (Fig. 2D and E). These data suggest that chromosome 11 gains begin to emerge during the hyperplastic stage of DB tumorigenesis and provide a selective advantage to cells that subsequently proceed to form the bulk of the tumors.
To determine whether genomic amplification results in gene overexpression, we assessed mRNA expression using quantitative RT-PCR of Grb2 and Itgb4. Both genes mapped to recurrent amplicon peaks in DB tumors and have been implicated in regulating PI3K. α6β4 Integrins have been shown to activate PI3K and induce formation of lamellae in breast carcinoma cells (28). Grb2 has been shown to bind and activate PIK3-C2β and is widely known to activate the Ras oncogene, which suppresses c-Myc-induced apoptosis via PI3K activation (29). We determined mRNA expression levels relative to two control genes, Gus and L19, and correlated expression with gene copy number (Fig. 2F). Both Grb2 and Itgb4 showed strong correlations between expression and copy number; the respective Pearson's correlations for Grb2 and Itgb4 were 0.85 and 0.73 relative to both Gus and L19.
To further assess whether amplification and increased RNA expression results in increased protein expression, we did Western analyses using antibodies raised against Grb2 (Fig. 2G). We determined that Grb2 protein levels were clearly higher in tumors with amplification relative to DB hyperplasias, DB tumors without amplification, and MT tumors in which no amplifications were detected. To determine whether increased Grb2 expression was associated with enhanced PI3K activity, we measured total and phosphospecific (Ser473) levels of AKT, a well-established target of PI3K. Levels of pAKT were visibly higher in DB tumors with Grb2 amplification and overexpression relative to hyperplasias and nonamplified DB tumors but lower than in tumors expressing wild-type PyMT. Intriguingly, we observed that total AKT levels were lower in Grb2-amplified DB tumors. Therefore, AKT phosphorylation (i.e., activation) seems more pronounced in Grb2-amplified tumors when the relative levels of pAKT to total AKT are considered. These data suggest that amplification and overexpression of Grb2 contributes to the phosphorylation and activation and AKT in breast tumors and plays an important role in promoting tumor formation.
The Erbb2 amplicon in TM mouse tumors is highly similar to the human amplicon. Detailed mapping studies of the ERBB2 amplicon in human breast tumors revealed a core 280-kb common region of amplification, in which multiple genes in addition to ERBB2 show a highly significant association between amplification and expression (30). This suggests that multiple genes within the ERBB2 amplicon play a role in breast tumorigenesis. Because genomic amplifications of the activated Erbb2 allele have been reported previously in TM tumors (5, 6, 31), we tested whether mouse breast tumors similarly amplify a group of genes in concert with activated Erbb2. We characterized the genomic structure of the Erbb2 amplicon in 20 TM tumors using the chromosome 11 contig arrays; this included an additional 11 tumors not included in the studies with the genome scanning arrays. A total of 19 of 20 tumors showed increased copy number at the Erbb2 locus; 17 of 20 tumors had high level amplifications (4- to 37-fold) and 2 of 20 had single-copy gains (Fig. 3A). Unlike the complex amplifications observed in DB tumors, the TM amplifications were highly structured. We observed at most two amplicon peaks in any one tumor, with the majority of amplified tumors (13 of 17) showing a single peak encompassing Erbb2. Strikingly, the minimally defined amplicon identified in this set of TM tumors was highly similar to the core 280-kb amplicon defined in human breast cancers (30). All but 1 of the 17 tumors with Erbb2 amplifications coamplified ∼290 kb (chr11:97,971,270-98,259,979) of genomic sequence flanking Erbb2 (∼112 kb proximal and ∼152 kb distal). One tumor (TM298) had a more refined 130-kb amplicon (chr11:97,971,270-98,106,458) in which the distal 150 kb encompassing Grb7 was gained (single copy) but not amplified. All genes encoded within the 290-kb mouse amplicon (Table 2) are included in the core human amplicon (30).
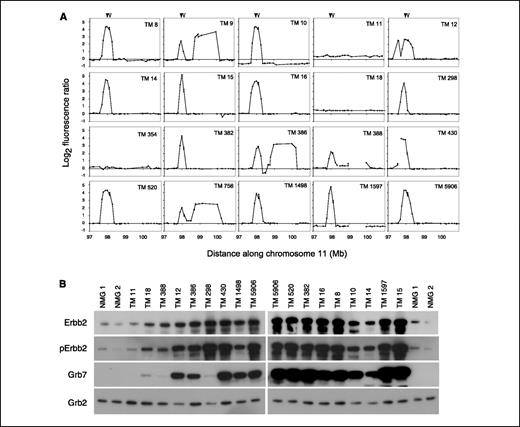
Assessment of ErbB2 amplicon structure and gene expression in TM tumors. A, copy number analyses of a 4-Mb region surrounding the Erbb2 locus in 20 TM breast tumors. The genomic positions of Erbb2 and Grb7 are indicated by closed and open arrowheads, respectively. Fluorescence ratios have been normalized such that the median ratio of all non–chromosome 11 clones equals 0. Genomic coordinates are based on NCBI Build 33 of the mouse genome sequence assembly. B, Western blots comparing expression among normal FVB/N mouse mammary gland (NMG) and 17 TM tumors. A strong correlation exists between copy number and protein expression for Erbb2, phospho-Erbb2 (Tyr1248), and Grb7. Tumor TM 298 has amplified Erbb2 but not Grb7, which is reflected in the protein levels. Grb2 is included as a loading control. Samples are loaded from left to right with increasing ErbB2 copy number (based on the log2 fluorescence ratio of BAC clone RP23-100L19, which encodes Erbb2). Because samples were loaded on two separate gels, TM tumor 5906 and the normal breast samples are included on both gels to facilitate normalization between gels.
Assessment of ErbB2 amplicon structure and gene expression in TM tumors. A, copy number analyses of a 4-Mb region surrounding the Erbb2 locus in 20 TM breast tumors. The genomic positions of Erbb2 and Grb7 are indicated by closed and open arrowheads, respectively. Fluorescence ratios have been normalized such that the median ratio of all non–chromosome 11 clones equals 0. Genomic coordinates are based on NCBI Build 33 of the mouse genome sequence assembly. B, Western blots comparing expression among normal FVB/N mouse mammary gland (NMG) and 17 TM tumors. A strong correlation exists between copy number and protein expression for Erbb2, phospho-Erbb2 (Tyr1248), and Grb7. Tumor TM 298 has amplified Erbb2 but not Grb7, which is reflected in the protein levels. Grb2 is included as a loading control. Samples are loaded from left to right with increasing ErbB2 copy number (based on the log2 fluorescence ratio of BAC clone RP23-100L19, which encodes Erbb2). Because samples were loaded on two separate gels, TM tumor 5906 and the normal breast samples are included on both gels to facilitate normalization between gels.
Comparison of genes mapping to the human and mouse ERBB2 amplicons
| Mouse gene | Mouse RefSeq ID | Human gene | Human RefSeq ID | Description |
|---|---|---|---|---|
| Neurod2 | NM_010895 | NEUROD2 | NM_006160 | Transcription factor; neuronal differentiation |
| Ppp1r1b | NM_144828 | PPP1R1B | NM_032192 | Protein phosphatase |
| Stard3 | NM_021547 | STARD3 | NM_006804 | STAR-related lipid transfer; sterol transport |
| Tcap | NM_011540 | TCAP (MLN64) | NM_003673 | Telethonin; sarcomere assembly |
| Pnmt | NM_008890 | PNMT | NM_002686 | Phenylethanolamine N-methyltransferase |
| BC030368 | — | PERLD1 (MGC9753) | NM_033419 | Per1-like domain containing protein |
| Erbb2 | NM_001003817 | ERBB2 | NM_004448 | Oncogenic RTK |
| 1810046J19Rik | NM_025559 | C17orf37 (MGC14832) | NM_032339 | Open reading frame of unknown function |
| Grb7 | NM_010346 | GRB7 | NM_005310 | Growth factor receptor bound protein 7 |
| AF001293 | — | ZNFN1A3 | NM_012481 | Zinc finger transcription factor |
| 1700017D11Rik | NM_027061 | ZPBP2 | NM_198844 | Zona pellucida binding protein |
| Ormdl3 | NM_025661 | ORMDL3 | NM_139280 | Orosmucoid (ORM1) like; plasma drug transport |
NOTE: Genes in boldface are common to the mouse amplicon defined in this study and the human amplicon defined in ref. 30.
To determine the relationship between gene amplification and protein expression for genes mapping within the amplicon, we did Western blot analyses to detect Erbb2 and Grb7 in 17 TM tumors for which we had array CGH data. Consistent with previous observations on small subsets of TM tumors (5, 31), we observed that both Erbb2 and Grb7 were overexpressed in tumors relative to normal mammary gland (Fig. 3B). In addition, we observed a strong concordance between Erbb2, phospho-Erbb2 (Tyr1248), and Grb7 gene copy number and protein expression levels. These results, in conjunction with the highly similar structure and gene content of the mouse and human ERBB2 amplicons, strongly suggest that at least two genes when amplified and overexpressed act in concert to drive breast tumor formation in ERBB2-amplified tumors. Further, these results argue that the TM breast cancer mouse model is an ideal system in which to study the relative contribution of these genes to breast tumor formation in vivo.
14-3-3σ maps to a region of minimal deletion and is expressed at low levels in ERBB2-amplified tumors. Numerous genetic studies on human breast tumors have implicated the 1p35-36 locus in breast cancer development. This locus exhibits recurrent loss of heterozygosity (LOH) and deletion in human breast tumors and is associated with aggressive tumor behavior, such as large tumor size, presence of lymph node metastasis, and decreased survival (32–34). However, identification of tumor suppressor genes within this region has been proven difficult. Previous chromosome CGH and fluorescence in situ hybridization (FISH) studies on TM tumors revealed recurrent deletions of distal mouse chromosome 4 (6), syntenic with human 1p32-36, suggesting that this model would be of value in identifying tumor suppressor genes at this locus. Because we observed whole and partial chromosome 4 deletions in all three ErbB2-based models in this study, we did detailed characterization of the deletions in all 80 ErbB2 to define the minimal region of recurrent loss. We found two tumors with partial deletions that helped refine a 1.88-Mb locus of particular interest (Fig. 4A) defined by genome coordinates chr4:130,409,484-132,292,040 (NCBI Build 33). This region was deleted in all tumors in which we detected chromosome 4 losses and also maps within the broadly defined locus identified by chromosome CGH and FISH (6).
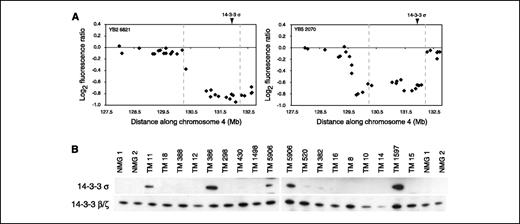
Partial chromosome 4 deletions point to 14-3-3σ as a candidate tumor suppressor gene. A, array CGH data from the two most informative Erbb2-based tumors delimit a 1.88-Mb region of recurrent deletion. Markers AZ110506 (T7 end sequence of BAC RP23-8M7) and AZ0805267 (Sp6 end sequence of BAC RP23-31L13) define the proximal and distal breakpoints (dashed, gray vertical lines), respectively, of the commonly deleted region. The genomic locus of 14-3-3σ is indicated. B, Western blot analyses show that 14-3-3σ expression is low or undetectable in the majority of TM tumors and in normal breast tissue, whereas family members 14-3-3β/ζ are expressed ubiquitously.
Partial chromosome 4 deletions point to 14-3-3σ as a candidate tumor suppressor gene. A, array CGH data from the two most informative Erbb2-based tumors delimit a 1.88-Mb region of recurrent deletion. Markers AZ110506 (T7 end sequence of BAC RP23-8M7) and AZ0805267 (Sp6 end sequence of BAC RP23-31L13) define the proximal and distal breakpoints (dashed, gray vertical lines), respectively, of the commonly deleted region. The genomic locus of 14-3-3σ is indicated. B, Western blot analyses show that 14-3-3σ expression is low or undetectable in the majority of TM tumors and in normal breast tissue, whereas family members 14-3-3β/ζ are expressed ubiquitously.
We next assessed the known or putative functions of the genes encoded within the minimally defined region using public databases to identify putative tumor suppressors. The locus encodes 34 RefSeq genes, which is a likely underrepresentation, as additional known genes and transcripts that are not currently part of the RefSeq database map to the region. Of particular interest is the G2-M inhibitor 14-3-3σ (Stratifin), which is expressed at low levels in human breast cancer (35, 36). To assess whether 14-3-3σ was similarly expressed at low levels in mouse breast tumors, we did Western blot analyses on 17 primary TM tumors. We observed that the majority of TM tumors (13 of 17) expressed low or nondetectable levels of 14-3-3σ (Fig. 4B). We did not detect protein expression of 14-3-3σ in eight normal FVB/N mouse breast samples tested (Fig. 4B; data not shown). Expression of 14-3-3 family members β/ζ was ubiquitous among the samples. These data suggest that suppression of 14-3-3σ expression is important in the development of tumors initiated by expression of oncogenic Erbb2.
Discussion
We have used array CGH to define and compare genomic CNAs in mouse models of breast cancer and identify genes that may be important in regulating RTK signaling. The observed chromosome 4 deletions and chromosome 11 gains/amplifications are consistent with previous genomic studies that used lower-resolution (chromosome CGH and spectral karyotyping) or lower-throughput (FISH) techniques on the TM (6) and MT (25) models. However, by performing array CGH with microarrays containing contigs of clones across these loci of interest, we were able to rapidly and accurately define small regions of recurrent CNA, thus greatly facilitating gene discovery. One notable discrepancy between our results and those of Montagna et al. (25) is that we did not observe high-level chromosome 11 amplification or frequent chromosome 4 deletions in MT tumors. Because we directly assessed tumor samples, whereas Montagna et al. assessed cultured cell lines derived from primary tumors, these genomic differences may be explained by different selective pressures in vitro and in vivo.
Our comparative genomics approach on mouse models of breast cancer show that this represents a powerful approach for dissecting the genetic and biological complexities of human breast cancer. First, the loci identified in this study are syntenic with loci recurrently altered in human breast tumors. Distal chromosome 4 is syntenic with human 1p35-36, which shows frequent LOH and deletion (32–34), and distal chromosome 11 is syntenic with human 17q21-25, which is frequently gained and amplified (37, 38). It is therefore likely that functional assessment of the genes encoded within these mouse loci will point to tumor suppressors (chromosome 4) and oncogenes (chromosome 11) important in human breast tumor development. Second, comparative assessment of CNAs in various mouse models enabled us to associate CNAs with particular tumor-related phenotypes, an exercise that is difficult in human breast tumors given the high degree of genetic and environmental heterogeneity in human populations. For example, we identified loci associated with metastasis by comparing CNAs in primary tumors from mice with high (YD) versus low (YB) metastatic potential. Similarly, we associated chromosome 11 amplifications with regulation of PI3K or PI3K-like signaling by comparing CNAs in tumors expressing wild-type (MT) or mutated (DB) PyMT. Finally, we established that distal chromosome 4 deletions were much more frequent in Erbb2-induced tumors compared with PyMT-induced tumors, suggesting that a gene(s) mapping to distal 4 acts to abrogate Erbb2-mediated transformation.
The occurrence of recurrent genomic gains and amplifications throughout distal mouse chromosome 11 in mouse breast tumors strongly suggests that this locus plays an important role in RTK signaling in breast tumorigenesis. Our data indicate that multiple oncogenic loci exist throughout the region and their relative importance to tumorigenesis depends on the initiating oncogenic event. For example, amplification of the Erbb2 locus seems critical for TM tumor development but is not required for development of PyMT-based tumors. Further, our data suggest that the magnitude of genomic change also depends on the initiating tumorigenic event. For example, low-level gains seem to provide a sufficient selective advantage for MT tumorigenesis, whereas high-level amplifications across the same region are required for DB tumor formation. One hypothesis to explain this observation is that low-level expression increases of multiple genes in wild-type MT tumors collectively shift cells into a tumorigenic state, whereas more dramatic changes, such as amplification and gross overexpression, are required in the PI3K-impaired DB tumors. We determined that expression of at least two candidate genes, Grb2 and Itgb4, is dramatically increased in amplified tumors. However, it is likely that additional genes are involved. Indeed, apoptotic regulators Sept9 (MSF) and Birc5 (survivin), which have been shown to be overexpressed in human and mouse breast tumors and cell lines (25, 39, 40), and map to recurrent gains and amplicon peaks in our cohort of PyMT and DB tumors. Further, we observed other amplicon peaks in DB tumors for which no obvious candidates were noted, suggesting the presence of novel breast cancer genes. Determining which genes are consistently up-regulated in response to genomic gain/amplification and defining their molecular and biological relationships may help define networks of genes that, when coordinately up-regulated (even at low levels), tip normal cellular processes toward tumorigenic processes. Coordinated up-regulation of multiple biologically related genes may explain the appearance of frequent, broad, low-level CNAs in tumors, such as 1q gains in breast cancer (41, 42) and 17q gains in medulloblastomas (43).
Our high-resolution chromosome 11 contig arrays permitted a detailed assessment of the Erbb2 amplicon in TM tumors. These analyses revealed that the structure and gene content of the human (30) and mouse amplicons are remarkably similar. This suggests that multiple genes within the amplicon in addition to Erbb2 are coselected and actively participate in promoting tumor formation. The signaling adapter protein Grb7 is a strong candidate as we observed a strong correlation between copy number and protein expression levels. However, although Grb7 may actively contribute to tumorigenesis and RTK signaling, it may not be absolutely required in all tumors as we observed an amplicon in one tumor (TM298) that excluded Grb7. Of particular interest are the 15% of tumors that did not amplify the Erbb2 locus at all. We were able to assess protein expression in two tumors with single-copy gains and found that one (TM18) had visibly higher Erbb2 expression compared with normal mammary gland, whereas expression in the other (TM11) was not visibly altered. Clearly, the latter tumor found alternate tumorigenic mechanisms that do not involve overexpression of ErbB2. Rampant genomic instability and selection of multiple cooperative CNAs does not seem to be involved as single-copy gain of distal chromosome 11 was the only aberration we detected using our genome scanning arrays. The TM model therefore provides a powerful system in which to functionally assess in vivo the relative contributions of genes encoded within the Erbb2 amplicon to breast tumorigenesis as well as unveiling potentially novel mechanisms that result in breast tumor formation. Further, the structural similarities between human and mouse amplicons suggest that the mechanisms leading to amplicon formation in rodent and human tumors are highly similar and are conserved over millions of years of evolution. Therefore, it is likely that the TM mouse model will also be of considerable value in studying the fundamental molecular and genetic mechanisms that underlie amplicon formation in vivo.
Our studies revealed that chromosome 4 deletions were common in tumors induced by expression of ErbB2 but rare in PyMT-induced tumors. Frequent in vivo chromosome 4 deletions or LOH have been reported previously in a variety of mouse breast cancer models, including those induced by Erbb2 (6), Ras (44), and Myc (45). This suggests that a gene(s) mapping to distal 4 suppresses tumorigenesis via a mechanism common to all aforementioned oncogenes. For example, loss of a gene that suppresses cell cycle progression or promotes apoptosis would provide a cooperative tumorigenic event within the context of ErbB2, Ras, or c-Myc activation. However, it is also possible that multiple breast tumor suppressor genes map to distal 4, each of which specifically abrogate the tumorigenic activities of distinct oncogenes. In support of this hypothesis are genetic studies in human breast tumors that implicate multiple loci across 1p32-36 (33, 46). Regardless, it is apparent that these mouse models represent a useful resource for breast tumor suppressor gene identification, and detailed functional investigation of candidate genes in vivo will shed light on their mechanisms of suppression.
One candidate breast tumor suppressor gene to emerge from these studies is the G2-M inhibitor 14-3-3σ. 14-3-3σ maps to a 1.88-Mb recurrent region of deletion in Erbb2-induced mouse breast tumors, and the majority of TM tumors express relatively low or undetectable protein. The low expression levels are consistent with observations in human breast tumors (35, 36). The fact that we did not detect 14-3-3σ protein expression in normal mouse breast tissue paradoxically suggests that its expression is induced at some point during Erbb2-mediated breast tumorigenesis. This induction may be an inherent antiproliferative safeguard against oncogenic signaling in mammary epithelial cells and may involve p53, which transcriptionally up-regulates 14-3-3σ when activated (47). Because Erbb2 is known to up-regulate p53 (48, 49) and NeuNT has been shown to induce cell cycle arrest in breast cancer cells (50), Erbb2-activated mammary epithelial cells with an attenuated p53/14-3-3σ response would have a selective advantage due to an attenuated G2-M arrest and would proceed to form the bulk of the tumor. Indeed, abrogated p53 function seems to enhance Erbb2 oncogenicity, as TP53 mutations are observed frequently in Erbb2-positive human breast tumors (51, 52), and breeding mutated p53 into a mouse mammary tumor virus (MMTV)-Neu mouse background accelerates tumorigenesis (7). We postulate that chromosome 4 deletions involving 14-3-3σ contribute to a diminished p53/14-3-3σ response in mammary epithelial cells and are therefore selected during breast tumorigenesis. However, it is likely that other mechanisms in addition to deletion are involved as we did not observe any homozygous deletions in our set of tumors. Methylation of 14-3-3σ gene regulatory sequences is one possible mechanism, as this is a highly frequent event in human breast tumors (35, 36). In the case of PyMT-based tumors, chromosome 4 deletion and suppression of 14-3-3σ expression may be of no selective advantage because PyMT itself is known to bind 14-3-3 proteins at Ser257 (53), which may result in abrogation of 14-3-3σ function in mammary epithelial cells.
We have defined in detail recurrent genetic lesions in mouse breast tumors and identified genes whose altered expression may affect tumor progression and RTK signaling within the context of other initiating oncogenic events. Defining cooperative tumorigenic events in vivo and understanding their biological basis will provide much needed insight into mechanisms of breast tumorigenesis and may help address questions related to breast cancer therapy. Comprehensive gene expression studies at the aberrant loci described in these mouse models will define genes or gene networks most likely involved in RTK signaling in breast cancer. Breeding the models included in this study with existing or newly developed transgenic models that alter expression of candidate genes will definitively test their functional importance to breast tumorigenesis in vivo.
Note: J.G. Hodgson and S. Hariono are currently at the Department of Neurological Surgery, University of California-San Francisco, San Francisco, California. T. Malek is currently in the Molecular and Cellular Biology Program, University of Washington, Seattle, Washington. S. Bornstein is currently in the M.D.-Ph.D. Program, Oregon Health Sciences University, Portland, Oregon. D.G. Ginzinger is currently at Applied Biosystems, Foster City, California. J.W. Gray is currently at the Life Sciences Division, Lawrence Berkeley National Labs, Berkeley, California.
Acknowledgments
Grant support: U.S. Army Medical Research and Materiel Command grant DAMD17-01-1-0187 and NIH grant K01 CA101777-01A1 (J.G. Hodgson); Canadian Institutes of Health Research operating grant (W.J. Muller); and U.S. Department of Energy, Office of Science, Office of Biological and Environmental Research contract DE-AC03-76SF00098 and NIH, National Cancer Institute P50 grants CA 58207 and CA78601 (J.W. Gray).
The costs of publication of this article were defrayed in part by the payment of page charges. This article must therefore be hereby marked advertisement in accordance with 18 U.S.C. Section 1734 solely to indicate this fact.