


Abstract
Purpose: We examined a cohort of patients with alveolar soft part sarcoma (ASPS) treated at our institution and showed the characteristic ASPSCR1-TFE3 fusion transcript in their tumors. Investigation of potential angiogenesis-modulating molecular determinants provided mechanistic and potentially therapeutically relevant insight into the enhanced vascularity characteristic of this unusual tumor.
Experimental Design: Medical records of 71 patients with ASPS presenting at the University of Texas M.D. Anderson Cancer Center (1986-2005) were reviewed to isolate 33 patients with formalin-fixed paraffin-embedded material available for study. RNA extracted from available fresh-frozen and formalin-fixed paraffin-embedded human ASPS tumors were analyzed for ASPSCR1-TFE3 fusion transcript expression using reverse transcription-PCR and by angiogenesis oligomicroarrays with immunohistochemical confirmation.
Results: Similar to previous studies, actuarial 5- and 10-year survival rates were 74% and 51%, respectively, despite frequent metastasis. ASPSCR1-TFE3 fusion transcripts were identified in 16 of 18 ASPS samples. In the three frozen samples subjected to an angiogenesis oligoarray, 18 angiogenesis-related genes were up-regulated in tumor over adjacent normal tissue. Immunohistochemistry for jag-1, midkine, and angiogenin in 33 human ASPS samples confirmed these results. Comparison with other sarcomas indicates that the ASPS angiogenic signature is unique.
Conclusion: ASPS is a highly vascular and metastatic tumor with a surprisingly favorable outcome; therapeutically resistant metastases drive mortality. Future molecular therapies targeting overexpressed angiogenesis-promoting proteins (such as those identified here) could benefit patients with ASPS.
Alveolar soft part sarcoma (ASPS) is a malignancy of uncertain histogenesis, first described in 1952 (1). A rare soft tissue sarcoma (STS) subtype, it has a uniquely indolent growth pattern combined with unexpectedly high metastatic (particularly pulmonary) activity. Unlike other STS, ASPS also metastasizes to the brain (2–7). Interestingly, whereas the metastatic rates in this disease are high, prior large series indicate prolonged survival with metastatic disease. Surgery is the therapeutic mainstay for localized and metastatic disease; chemoresistance frequently precludes meaningful systemic intervention. A characteristic translocation in ASPS results in a novel fusion of the ASPSCR1 (previously designated ASPL) and TFE3 genes (chromosomes 17q25 and Xp11.2, respectively), resulting in a functional transcription factor with altered target gene activation (8). This creates a novel ASPSCR1-TFE3 fusion protein that seems to acts as an aberrant transcription factor that induces unregulated transcription of TFE3-regulated genes.
Histologically, ASPS has a distinctive appearance, usually consisting of nests of epithelioid to polygonal cells arranged in nests or bundles, sometimes with a central lack of cohesion that is reminiscent of pulmonary alveolar structures. Intracellular periodic acid-Schiff's–positive, diastase-resistant crystals composed of monocarboxylate transporter-1 and CD147 are characteristic (9). The neoplastic cells are accompanied by striking associated capillary vascularity, often intimately associated with the small cellular clusters or nests. Little is known of the factors underlying the rich vascular nature of ASPS. As vasculogenesis is important for both tumor survival and possibly for metastasis, we decided to directly address this ASPS knowledge deficit. We defined a large ASPS patient cohort in order to (a) confirm the clinical findings of other studies, (b) isolate tumor tissue for gene expression and immunohistochemical study, and (c) correlate the clinical and molecular features of these tumors. We confirmed the histologic and immunohistochemical diagnosis of ASPS when possible using reverse transcription-PCR to show the ASPSCR1-TFE3 fusion transcript. Because of the prominent, exuberant ASPS vascularity, a possible determinant of ASPS biology, expression of ASPS proangiogenic genes was examined via angiogenic gene oligoarray. Immunohistochemistry of a large ASPS cohort confirmed the overexpression of protein products from 3 of 18 up-regulated genes (angiogenin, midkine, and jag-1). This unusual milieu of proangiogenic factors was unique when compared with other STSs at both the genetic and protein levels. Currently, we lack effective ASPS systemic therapy; further investigation of relevant molecular markers as potential therapeutic targets might benefit afflicted patients.
Materials and Methods
Selection of ASPS and other STS cases. Institutional review board approval and a waiver of consent for use of medical records and patient samples were obtained from The University of Texas M. D. Anderson Cancer Center. Eighty-two patients with ASPS, seen at the University of Texas M. D. Anderson Cancer Center between January 1986 and December 2005, were identified from a prospective STS database. Only patients having sufficient demographic and clinical data available from the time of initial tissue diagnosis were included (n = 71). Thirty-three of these patients had formalin-fixed paraffin-embedded (FFPE) material with tumor present from procedures done at our institution and appropriate tumor blocks were selected. Of these cases, 17 were primary tumors and 16 were metastatic. Fresh-frozen tumor and adjacent non–tumor tissue (skeletal muscle or fibroadipose tissue) from the three cases with available material in the University of Texas M. D. Anderson Cancer Center Sarcoma Tumor Bank were used for RNA extraction. RNA was also extracted from two cases each of malignant fibrous histiocytoma, synovial sarcoma, and myxoid liposarcoma. Seventeen additional FFPE blocks of sarcoma samples were obtained for comparison: malignant fibrous histiocytoma (9), rhabdomyosarcoma (3), well-differentiated liposarcoma (3), and leiomyosarcoma (2).
Tissue microarray construction. For tissue microarray construction, H&E-stained sections were reviewed from each of the 33 FFPE ASPS tumor blocks to define areas of homogeneous, viable tumor. Using an automated tissue microarray apparatus (ATA-27, Beecher Instruments), 0.6 mm punch samples were obtained from donor ASPS blocks. The selected tissue cores were formatted into a standard 4.5 × 2 × 1 cm recipient block. Two tissue cores were taken for each case. One tissue microarray block containing a total of 66 cores of ASPS tumor tissue was constructed. Sections (4 μm) were cut, and one standard H&E-stained slide was examined to verify the presence of viable tumor.
RNA extraction of patient samples. For frozen tissue, total RNA was extracted using TRIzol Reagent (Invitrogen). RNA quality was assured spectrographically and by denaturing agarose gel. For FFPE tissue, total RNA extraction was accomplished using the Optimum FFPE RNA Isolation Kit (Ambion Diagnostics), according to the manufacturer's instructions.
Detection of ASPS fusion transcripts. Reverse transcription was done using a SuperScript III First-Strand Synthesis System (Invitrogen). End point PCR was done using previously established primers to detect the ASPSCR1-TFE3 fusion product and to determine the presence or absence of the reciprocal fusion product TFE3-ASPSCR1, for both type 1 and type 2 fusion events (8). Thermocycling conditions were slightly modified (35 cycles at 95°C for 30 s, 54°C for 1 min, and 72°C for 1 min). PCR products were run on a 2% agarose gel to visualize the presence of a fusion product using ethidium bromide staining. Positive bands were sequenced with the corresponding primers in the forward and reverse directions using the ABI PRISM Dye Terminator Cycle Sequencing Ready Reaction kit (Applied Biosystems), with detection on an ABI PRISM 3100-Avant Genetic Analyzer. The exon domain structure of TFE3 has been altered since the original fusion transcript exon-protein domains were published (8), the most current exonic structure information available from GenBank reference sequence NM_006521 were used. These changes do not affect the PCR amplification strategy, only the exon labeling scheme.
Microarray hybridization. Total RNA was in vitro transcribed to produce biotin-labeled cRNA using TrueLabeling-AMP linear RNA amplification kit (SuperArray Bioscience Corporation). Labeled cRNA was purified using SuperArray ArrayGrade cRNA cleanup kit and quantified by spectrophotometry; labeling efficiency was established by serial dilutions on nylon membrane with chemiluminescent detection. Gene expression profiling was done using Oligo GEArray Human Angiogenesis Microarray (OHS-024; SuperArray Bioscience Corporation) which detects 113 key genes involved in angiogenesis.7
For list of genes see http://www.superarray.com/gene_array_product/HTML/OHS-024.html.
Prehybridization (2 h) and hybridization (overnight) was done in a hybridization oven (60°C) using 6 μg of labeled cDNA target. High-stringency washing at 60°C (0.1× SSC, 0.5% SDS) was followed by chemiluminescence detection. Array images were recorded using X-ray film and a flatbed desktop scanner to create grayscale (16 bit) files, then analyzed by GEArray Expression Analysis Suite online software.8
Immunohistochemistry of CD-31, TFE3, angiogenin, jag-1, and midkine. Commercially available antibodies against TFE3 (affinity-purified goat polyclonal, P-16; Santa Cruz Biotechnology), CD31 (JC70A monoclonal, dil. 1:20; Dako) angiogenin (affinity-purified goat polyclonal IgG, AF265, dil. 1:100; R&D Systems), jag-1 (rabbit polyclonal IgG, H-114, dil. 1:100; Santa Cruz Biotechnology), and midkine (rabbit polyclonal IgG, dil. 1:200; 5479-100; BioVision, Inc.) were used for immunohistochemistry. Briefly, 4-μm-thick unstained slides cut from FFPE ASPS tumors (tissue microarray section for TFE3 and whole sections for the other markers) were heated in a microwave for 20 min in Target Retrieval Solution High-pH (Dako) and incubated overnight at 4°C with primary antibody. Appropriate secondary antibodies (AEC substrate-chromagen; Dako) were used for detection. Positive and negative controls were done in parallel. The labeling intensity was graded by a soft tissue pathologist (A.J.F. Lazar) as none, weak, moderate, or strong for both the cytosolic and nuclear compartments, and the percentage of positive tumor cells was estimated. Microvessel density was calculated using CD31-stained slides by counting total vessels in three high-power (200×) fields of tumor tissue in hotspots and expressed as an average per field as previously described (10).
Statistical analysis. Patient demographic and clinical characteristics were summarized using medians or proportions as applicable. Survival was estimated using the Kaplan-Meier method with 95% confidence intervals. Actuarial analysis end point was overall survival.
Results
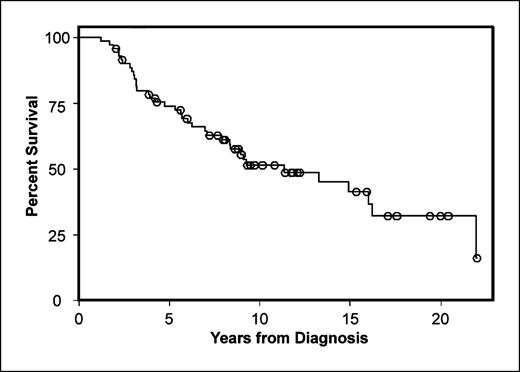
ASPS, although highly metastatic, manifests prolonged survivorship. To compare our ASPS cohort to other studies and to have the ability to correlate our laboratory studies with clinical outcome, a limited clinical review was done. The seventy-one patients, 43 (61%) male and 28 (39%) female, had a median age of 28 years at initial diagnosis. Median follow-up from initial diagnosis was 8 years. Only 15 patients (21%) did not develop metastases during follow-up, whereas 56 (79%) incurred at least one metastasis, primarily to the lung. Brain and bone metastases were also observed. Twenty-three patients developed metastasis only once, whereas others suffered up to five episodes of metastasis to different sites or to the same site multiple times. Thirty-seven patients (52%) died during follow-up, all attributed to ASPS. Estimated median survival time for all patients after initial ASPS diagnosis was 11.4 years; actuarial overall survival was 74% and 51% at 5 and 10 years, respectively (Fig. 1).
Detection of the ASPSCR1-TFE3 fusion transcript and TFE3 Immunohistochemistry. The molecular signature of ASPS is a specific der(17)t(X;17)(p11.2;q25), which results in the fusion of either exon 6 (type 1) or exon 5 (type 2) of the TFE3 transcription factor gene (Xp11) with ASPSCR1 (17q25), usually in a nonbalanced manner although reciprocal translocations have rarely been described (refs. 8, 11; Fig. 2A and B). These exons were previously indicated as exons 4 (type 1) and 3 (type 2) prior to the latest TFE3 reference sequence (GenBank NM_006521). The breakpoint in ASPSCR1 is between exons 7 and 8 and is invariable; this event results in the fusion of the NH2-terminal portion of the protein encoded by exons 1 to 7 of ASPSCR1 to the COOH terminus of the TFE3 protein (Fig. 2B). The fusion transcript is then under the control of the ASPSCR1 promoter. More recently, this same fusion transcript has also been described in a rare subset of pediatric renal tumors in which the chromosomal translocation is reciprocal rather than unbalanced, and genes other than ASPSCR1 can be employed (such as PRCC, NonO, and PSF) to form alternative fusion genes with TFE3 (12, 13). It is possible that the chimeric ASPSCR1-TFE3 protein acts as a transcription factor to regulate downstream genes, including expression of angiogenesis-related genes, in ASPS. Reverse transcription-PCR confirmed the expression of a fusion transcript in the three ASPS cases from frozen tumors analyzed by angiogenic expression array (Fig. 2C–E). All three frozen tumor samples contained the fusion transcript; interestingly, the entire reported repertoire of ASPSCR1-TFE3 translocations seen in ASPS were identified in these three specimens, including a nonreciprocal type 1 fusion as well as reciprocal and nonreciprocal type 2 fusion products. In contrast, no control normal tissues or non-ASPS sarcoma samples contained the fusion transcript. Reverse transcription-PCR was also used to examine the 33 FFPE ASPS tumor samples. Of these, 15 had a sufficient quality of RNA (as determined by spectrographic assessment of RNA concentration and ability to robustly amplify β-actin RNA). In general, it was not possible to obtain RNA of sufficient quality from older cases. The fusion transcript was shown in 13 of these 15 samples: 8 samples were type 1 and 7 samples were type 2. All were nonreciprocal. There was no difference in clinical features or outcome between these two groups with variant fusion transcripts. Immunohistochemistry for TFE3 using a polyclonal antibody binding to the COOH-terminal portion of TFE3 downstream of the fusion points showed strong nuclear staining (Fig. 2F) in all 33 samples on the ASPS tissue microarray. Intense nuclear TFE3 expression was seen in tumor cells, but not in capillary endothelial cells, perhaps suggesting capillary induction by tumor cells. Nuclear expression of TFE3 is characteristic of tumors having the ASPSCR1-TFE3 translocation (14).

A, chromosomal idiotype illustrating balanced and unbalanced t(x;17)(p11.2;q25) events. B, schematic diagram of TFE3, ASPSCR1, and type 1 and 2 fusion transcripts (UT, untranslated region; bHLH, basic helix-loop-helix; LZ, leucine zipper), adapted from ref. 8. C, reverse transcription-PCR of active fusion transcripts, the silent fusion transcript in 375T implying a reciprocal translocation (D), and β-actin controls (E). F, immunohistochemistry for TFE3 shows uniform nuclear reactivity in tumor cells, but not capillaries (arrows).
A, chromosomal idiotype illustrating balanced and unbalanced t(x;17)(p11.2;q25) events. B, schematic diagram of TFE3, ASPSCR1, and type 1 and 2 fusion transcripts (UT, untranslated region; bHLH, basic helix-loop-helix; LZ, leucine zipper), adapted from ref. 8. C, reverse transcription-PCR of active fusion transcripts, the silent fusion transcript in 375T implying a reciprocal translocation (D), and β-actin controls (E). F, immunohistochemistry for TFE3 shows uniform nuclear reactivity in tumor cells, but not capillaries (arrows).
ASPS expresses a unique array of angiogenesis-promoting genes. ASPS is a highly vascular tumor (15, 16). At times, a bruit or thrill can be detected at the tumor site, large draining veins are usually encountered during excision, and there is marked microscopic neovascularity, findings suggesting enhanced angiogenesis in ASPS. Perhaps such enhanced angiogenesis/vascularity could facilitate the early and frequent metastases observed by us and others (5–7). Consequently, we sought to identify possible molecular determinants driving ASPS angiogenesis. Three available frozen primary human ASPS specimens from patients who eventually developed lung metastasis were each studied using a focused angiogenesis cDNA oligoarray (Fig. 3A). The significance threshold was set at 1.5-fold increase/decrease relative to baseline; only genes that were so expressed in each of the three ASPS samples were included. Eighteen genes were consistently overexpressed (>1.5-fold) in ASPS compared with autologous normal controls (Fig. 3B; Table 1). Based on proposed function, these overexpressed genes could be further classified into five groups: (a) growth factors and receptors (ECGF1, Jag1, KDR, TGFα, and TGFβ), (b) cytokines and chemokines (CXCL1, CXCL10, IL1B, midkine, and pleiotropin), (c) adhesion molecules (EDG1, LAMA5, and neuropilin 1); (d) proteases and their inhibitors (LECT1 and TIMP2); and (e) transcription factors (EPAS1, HIF1α, and angiogenin). As a prerequisite, all the array genes have been previously shown to affect angiogenesis induction; however, those identified as consistently up-regulated in ASPS are unique as a gene panel, and do not include angiogenic genes commonly up-regulated in many cancers including other STSs (e.g., vascular endothelial growth factors, fibroblast growth factors, platelet-derived growth factors, angiopoietins, or matrix metalloproteases; ref. 17). These more commonly encountered angiogenic factors were also represented on the angiogenic oligoarray but were not up-regulated in our ASPS samples. Two frozen tumor samples each from malignant fibrous histiocytoma, synovial sarcoma, and myxoid liposarcoma were also studied using the angiogenesis oligoarray. The angiogenic profiles of these tumors varied from ASPS and between the various histologies, but did not show overexpression of the same consistent, but unusual, subset of genes shown in Fig. 3 for ASPS (data not shown).

A, angiogenic oligoarray highlighting JAG1 (○), MDK (★), and angiogenin (▿) in autologous normal (left) and tumor (right) tissues. B, fold increase over autologous normal tissue with standard deviation of the transcripts increased in all three tumors characterized. Additional information on these transcripts consistently increased is presented in Table 1.
A, angiogenic oligoarray highlighting JAG1 (○), MDK (★), and angiogenin (▿) in autologous normal (left) and tumor (right) tissues. B, fold increase over autologous normal tissue with standard deviation of the transcripts increased in all three tumors characterized. Additional information on these transcripts consistently increased is presented in Table 1.
Transcripts found to be consistently up-regulated >1.5-fold on the angiogenic oligoarray are listed with complete name and GenBank (NCBI) accession number
| Functional gene group | GenBank accession no. | Gene symbol/description | Fold increase (±SD) |
|---|---|---|---|
| Cytokines and chemokines | NM_001511 | CXCL-1/chemokine (C-X-C motif) ligand 1 | 1.58 (±0.03) |
| NM_001565 | CXCL-10/chemokine (C-X-C motif) ligand 10 | 2.24 (±0.26) | |
| NM_000576 | IL1B/interleukin 1β | 1.53 (±0.02) | |
| NM_002391 | MDK/midkine (neurite growth-promoting factor) | 5.87 (±1.35) | |
| NM_002852 | PTN/pleiotropin (heparin-binding growth factor 8, neurite growth-promoting factor 1) | 1.83 (±0.13) | |
| Growth factors and receptors | NM_001953 | ECGF1/endothelial cell growth factor 1 | 1.66 (±0.04) |
| NM_000214 | JAG1/jagged 1 (allagille syndrome) | 3.84 (±0.67) | |
| NM_002253 | KDR/kinase insert domain receptor, VEGFRII | 1.74 (±0.26) | |
| NM_003236 | TGFA/transforming growth factor-α | 2.74 (±0.65) | |
| NM_000660 | TGFB1/transforming growth factor-β1 | 4.06 (±2.3) | |
| Adhesion molecules | NM_001400 | EDG1/Endothelial differentiation, sphingolipid G protein–coupled receptor-1 | 1.8 (±0.36) |
| NM_005560 | LAMA5/laminin-α5 | 2.83 (±0.87) | |
| NM_003873 | NRP1/neuropillin | 2.3 (±0.46) | |
| Transcription factors | NM_001430 | EPAS1/endothelial PAS domain protein 1 | 2.4 (±0.28) |
| NM_001530 | HIF1A/hypoxia inducible factor-1α subunit | 4.11 (±1.2) | |
| NM_001145 | RNASE4/ribonuclease, RNase A family 4, angiogenin | 6.9 (±2.3) | |
| Matrix proteins, proteases, andinhibitors | NM_007015 | LECT1/leukocyte cell derived chemotaxin 1 | 2.05 (±0.32) |
| proteases, and inhibitors | NM_003255 | TIMP2/tissue inhibitor of metalloproteinase 2 | 2.58 (±0.67) |
Improved understanding of the function of the gene panel protein products and their possible association with TFE3 might yield insight into the unusual clinical behavior of ASPS. Only one of these genes, TGFβ1, has been previously associated with the transcription factor TFE3, which has been implicated in TGFβ1 signaling by synergizing with SMAD3 and SMAD4 to activate target genes (18). We selected the five most up-regulated genes in our array (midkine, angiogenin, jag-1, HIF1α, and TGFβ) and analyzed the first 4 kb of their promoters (promoter sequences available on NCBI-GenBank) for the presence of TFE3 E-box consensus binding sites (CA[C/T]GTG; ref. 19) using EditSeq software (DNASTAR Inc.). We found one E-box consensus sequence (CATGTG at −79 to −74) in the midkine promoter, two in the angiogenin promoter (CATGTG −888 to −883 and CACGTG at −2550 to −2545), one on the jag-1 promoter (CATGTG at −2437 to −2432), one in the HIF1α promoter (CACGTG at −276 to −271), and three CATGTG sites on the TGFβ1 promoter (−782 to −777, −1458 to −1453, and −3307 to −3302). Further investigation is needed to validate these regions as functional TFE3-binding sites, and is beyond the scope of this current report.
We selected angiogenin, midkine (MDK), and jag-1 genes for array confirmation using immunohistochemistry to evaluate protein expression because these proteins have not been previously characterized carefully in STS and well-characterized, commercially produced antibodies were available. To further show the vascular nature of these tumors, 17 primary FFPE ASPS and 16 metastases were immunostained for CD31, demonstrating a high mean microvascular density index of 29.4 ± 10.8 (primary, 30.9 ± 8.08; metastatic, 27.81 ± 13.17; Fig. 4B). Confirming the expression oligoarray data, angiogenin was expressed in all samples at varying levels; 29 samples expressed medium to high levels and 4 samples expressed low levels, and protein expression was often observable in tumor cells adjacent to blood vessels and also in tumor-associated endothelial cells and blood vessel walls (Fig. 4C and D). Jag-1 was expressed in all specimens, especially in tumor cells, but not in the surrounding normal cells; 32 samples expressed high levels and only 1 sample exhibited low expression (Fig. 4E and F). Similarly, midkine was expressed in all ASPS specimens, at moderate to high levels in 26 tumors and low levels in 7 specimens, and was often most intense in tumor cells adjacent to highly vascular tumor septa (Fig. 4G and H). Increased expression of all three proteins in ASPS compared with their expression in surrounding normal tissues further validates the assay results; perhaps these proteins or other array-identified overexpressed gene products may have relevance as potential molecular ASPS therapeutic targets. As only a subset of tumors were available for staining, and comparisons between groups such as metastatic versus nonmetastatic primaries were limited and no significant differences were shown. This result is not surprising as expression of these three angiogenic proteins seems to be generally uniformly present in virtually all of the ASPS cases tested.

A, H&E staining of a case of ASPS. B, immunohistochemistry for CD31 highlighting tumor-associated capillaries; staining of ASPS tumor cells with angiogenin (C and D), jag-1 (E and F), and midkine (G and H). Some cases showed accentuation of staining for angiogenin (D) and midkine (H) in the tumor cells lining the capillaries.
A, H&E staining of a case of ASPS. B, immunohistochemistry for CD31 highlighting tumor-associated capillaries; staining of ASPS tumor cells with angiogenin (C and D), jag-1 (E and F), and midkine (G and H). Some cases showed accentuation of staining for angiogenin (D) and midkine (H) in the tumor cells lining the capillaries.
We also examined 17 additional FFPE sarcomas of four histologic types (malignant fibrous histiocytoma, rhabdomyosarcoma, well-differentiation liposarcoma, and leiomyosarcoma) for these three proteins (Jag-1, midkine, and angiogenin) by immunohistochemistry and although they were expressed, they were present at low to moderate levels and never were all three simultaneously expressed to a significant (at least moderate level) degree as characteristically seen in ASPS (data not shown). In addition, the accentuated staining in perivascular tumor cells often seen in ASPS was not encountered in any of these other STSs.
Discussion
ASPS is rare, and most of our knowledge regarding its natural history is based on small retrospective clinical series. This study is one of only four from the past 20 years examining ASPS cohorts of >50 patients (5–7). Differing study designs and data analyses notwithstanding, all four show that ASPS behaves differently than other STS histologic subtypes. ASPS has a distinctive histology, specific molecular characteristics, and unique clinical behaviors. Compared with other STSs as a whole, ASPS generally develop in younger patients and occur more frequently in the lower extremity (5–7), and have a much lower incidence of local recurrence (20, 21). It should be noted that most sarcomas associated with known gene fusions generally occur in younger patients and ASPS is no exception to this observation. The high rate of ASPS metastasis (79% in this series) is much higher than the 50% overall rate of metastasis for all STS patients (22, 23), 10% of whom present with metastases, as compared with 20% to 65% of ASPS patients who are stage IV at presentation (5–7). The pattern of ASPS metastasis is also distinctive: as with other STS, the lung is the most common metastatic locus but brain and bone metastases, which rarely occur in other STSs, commonly occur in ASPS.
Our actuarial overall survival was similar to that previously published (5–7). It is encouraging that most patients with metastatic ASPS can survive long-term, however, these patients are not cured and many eventually succumb to ASPS, as suggested by the continuous decrease in survival even 20 or more years after metastasis. This is a crucial consideration for patients with ASPS, as most are in their 20s when initially diagnosed.
Currently, we lack effective systemic molecularly targeted therapies. There is limited knowledge of the biological processes and molecular determinants driving ASPS. The highly vascular nature of ASPS (8), possibly relevant to metastasis, combined with an emerging awareness that a specific molecular defect causes overexpression of the ASPSCR1-TFE3 chimeric transcription factor in ASPS (8, 14), merits focused attention. This chimeric protein seems to act as an aberrant transcription factor binding TFE3 promoter sites and causing dysregulation of gene expression. We showed that the ASPSCR1-TFE fusion transcript could be found in virtually all cases of ASPS in which high-quality RNA was obtained. The two negative cases could be false-negatives due to poor-quality RNA. It is possible that an abundant transcript such as β-actin may be detectable but the ASPSCR1-TFE3 fusion transcript, which is presumably less abundant, may escape amplification and detection in such cases. Some support to this idea of the universal presence of the fusion gene is supplied by the fact that all 33 FFPE ASPS cases in this series, including the 2 cases negative by PCR, expressed strong and diffuse nuclear staining for TFE3 following immunohistochemistry. This finding is strongly indicative of the diagnosis of ASPS and the presence of the fusion transcript (14). Our finding of only one reciprocal fusion product out of 16 fusion transcripts identified is consistent with previous results (8, 11, 24). Our results indicate that the fusion product is present in most ASPS cases and significantly expands our knowledge of the prevalence of the type 1 and 2 fusion transcripts. There is experimental data that the rarity of the balanced translocations may be due to the translocation occurring during the G2 phase of the cell cycle, with perhaps a selective advantage for tumor cells with gain of the telomeric p-arm of X or loss of the telomeric q-arm of 17 chromosomal material (11).
The ASPSCR1-TFE3 fusion transcript may underlie the expression of angiogenic factors in ASPS. The expression oligoarrays revealed a panel of angiogenesis-promoting genes that are reproducibly overexpressed in human ASPS, and interestingly, did not include those angiogenic molecules such as vascular endothelial growth factors, fibroblast growth factors, platelet-derived growth factors, angiopoietins, or matrix metalloproteases more commonly encountered in other malignancies and other sarcomas as well. It is tempting to postulate that the angiogenic profile is induced by the action of the ASPCR1-TEF3 fusion transcript and this idea is buttressed by our finding that several of the genes in our discovered angiogenic profile have putative TFE3 binding sites in their promoter regions. A recent report (15) described the effect of antiangiogenic, anti–vascular endothelial growth factor therapy in a patient with metastatic ASPS; although tumor regression was observed initially, disease progression occurred after 6 months. Based on our results, it is conceivable that inhibiting combinations of array-demonstrated overexpressed angiogenic factors might result in more sustained responses. It is noteworthy that three of the identified factors (neuropilin, midkine, and pleiotropin) are also associated with neuronal cells (25–27), perhaps of relevance to ASPS brain metastasis and meriting further investigation.
To validate our expression oligoarray results, we selected three protein products of the up-regulated genes (jag-1, midkine, and angiogenin), demonstrating that they were consistently up-regulated in an expanded cohort of human ASPS specimens. Although a regulatory role for TFE3 regarding any of the genes found in our array has not been previously shown, we were able to identify potential TFE3-binding sites in the promoters of the above three up-regulated genes. It is possible that the unique angiogenic gene profile of ASPS is related to this characteristic ASPS translocation, resulting in unregulated TFE3 overexpression. When these three factors were examined in additional sarcomas of other histologic types by both immunohistochemistry and expression oligoarrays, the proteins and the RNAs encoding them were present but lacked the simultaneous significant expression of all three factors characteristic of ASPS. It seems that ASPS is characterized by the ASPSCR1-TFE3 fusion transcript that likely induces the unique angiogenic profile. Overall, there seemed to be little variation in the overall angiogenic profile identified by oligoarray and expression of the three associated angiogenic proteins examined here in the larger ASPS tumor cohort. Although not shown for ASPS, data is emerging from other sarcoma mouse and other models that the characteristic fusion transcripts may sometimes be sufficient for the development of tumors when expressed at the right time and in the correct cellular compartment, although other genetic changes may also be required (28–34). Developing personalized molecular therapeutic strategies that might potentially block ASPS angiogenic promotion directly or indirectly via ASPSCR1-TFE3 inhibition (i.e., via TFE3-blocking short interfering RNA, or a combination of downstream effectors such as the angiogenic proteins identified here) may hopefully lead to increased curability for these all too young patients burdened by this unique and rare disease.
Grant support: Metastasis Research Fund, University of Texas M. D. Anderson Cancer Center (D. Lev) and the Physician-Scientist Program, University of Texas M. D. Anderson Cancer Center (A.J.F. Lazar).
The costs of publication of this article were defrayed in part by the payment of page charges. This article must therefore be hereby marked advertisement in accordance with 18 U.S.C. Section 1734 solely to indicate this fact.
Acknowledgments
We appreciate the expert assistance provided by Paul Cuevas in the preparation and submission of this manuscript; Kim Vu and Kayuri Patel are thanked for valuable aid in figure preparation.