


Abstract
Purpose: This study is aimed to identify genes within the KRAS genomic amplicon that are both coupregulated and essential for cell proliferation when KRAS is amplified in lung cancer.
Experimental Design: We used an integrated genomic approach to identify genes that are coamplified with KRAS in lung adenocarcinomas and subsequently preformed an RNA interference (RNAi) screen to uncover functionally relevant genes. The role of lactate dehydrogenase B (LDHB) was subsequently investigated both in vitro and in vivo by siRNA and short hairpin RNA (shRNA)–mediated knockdown in a panel of lung adenocarcinoma cells lines. LDHB expression was also investigated in patient tumors using microarray and immunohistochemistry analyses.
Results: RNAi-mediated depletion of LDHB abrogated cell proliferation both in vitro and in xenografted tumors in vivo. We find that LDHB expression correlates to both KRAS genomic copy number gain and KRAS mutation in lung cancer cell lines and adenocarcinomas. This correlation between LDHB expression and KRAS status is specific for lung cancers and not other tumor types that harbor KRAS mutations. Consistent with a role for LDHB in glycolysis and tumor metabolism, KRAS-mutant lung tumors exhibit elevated expression of a glycolysis gene signature and are more dependent on glycolysis for proliferation compared with KRAS wild-type lung tumors. Finally, high LDHB expression was a significant predictor of shorter survival in patients with lung adenocarcinomas.
Conclusion: This study identifies LDHB as a regulator of cell proliferation in a subset of lung adenocarcinoma and may provide a novel therapeutic approach for treating lung cancer. Clin Cancer Res; 19(4); 773–84. ©2012 AACR.
This article is featured in Highlights of This Issue,
There are many molecular subsets of cancer that have historically been difficult to target, leaving patients with few therapeutic options. One such example of this is lung adenocarcinomas that exhibit aberration in the KRAS oncogene. KRAS is altered, through activating mutation and copy number gain, in nearly 30% of lung adenocarcinomas. Using an RNA interference (RNAi) screen to knockdown genes within the KRAS amplicon, we find that lactate dehydrogenase B (LDHB) is upregulated and essential in KRAS-driven lung cancers. Targeting LDHB with small-molecule inhibitors may provide a therapeutic option for lung cancer patients with KRAS aberration.
Introduction
Lung cancer is one of the most prevalent cancer forms, responsible for more than one million annual deaths worldwide. In the clinical setting, lung cancer is classified according to two main histologic types, small-cell lung cancer (SCLC) and non–small cell lung carcinoma (NSCLC; ref. 1). Eighty-five percent of all lung cancers are attributable to NSCLC, of which lung adenocarcinoma is the most frequent histologic subtype (1). On a molecular level, lung adenocarcinomas frequently harbor mutations in the KRAS oncogene (25%) and the tumor suppressor protein p53 (33%; ref. 1). The importance of these mutations is highlighted by the development of genetically engineered mouse models that harbor KRAS and p53 mutations and are able to drive lung adenocarcinoma initiation and progression (2). In recent years, molecular and cancer genomic approaches have increased our understanding of the pathogenesis of NSCLC and have led to therapies that directly target the precise genetic alterations that drive tumor growth.
The molecular genotyping of NSCLC into discrete molecular classes has redefined therapeutic approaches. Oncogenic alterations in the kinases EGF receptor (EGFR) and anaplastic lymphoma kinase (ALK) are found in 15% to 25% of NSCLC (3, 4). Patients with tumors harboring the activated EGFR and ALK kinase respond to the tyrosine kinase inhibitors gefitinib and erlotinib (5, 6) and crizotinib (7), respectively. Importantly, ALK and EGFR activation is mutually exclusive of KRAS mutation, underscoring the need for identifying and characterizing therapeutic options for KRAS-driven lung cancer.
KRAS is one of the most commonly mutated oncogenes in lung cancer (1), exhibiting activating alterations in about 25% to 30% of lung adenocarcinomas. While point mutations in codon 12 or 13 account for the majority of KRAS mutations (8), recent studies have reported that KRAS also undergoes copy number gain at chromosome 12p12 in 11% to 15% of lung tumors (9, 10). RAS genes are members of the small GTPase super family (11) and function to propagate growth factor signaling through activation of c-RAF and phosphoinositide-3-kinase (PI3K) pathways. Despite concerted efforts, KRAS mutation defines a genetic subtype of lung cancer that is currently not amenable to therapeutic intervention (12). Recent studies have used high-throughput chemical and genetic screens to identify synthetic lethal phenotype in the context of KRAS mutations (13–16). These screens have yielded promising kinases and other cellular machinery. Significant work is required to determine whether these interactions will translate into therapies for KRAS-driven tumors.
While previous studies have mostly focused on identifying synthetic interactions in KRAS-mutant cell lines, here we set out to identify genes within the KRAS genomic amplicon that are both coupregulated and critical for cell proliferation when KRAS is amplified. We characterized the 12p11/12 amplicon where KRAS resides, and report the presence of 18 additional genes that are coamplified and overexpressed in lung adenocarcinomas. Using a loss of function RNA interference (RNAi) screen on these 18 genes, we identified lactate dehydrogenase B (LDHB) as being specifically required in KRAS amplified lung cancer for cell proliferation. We find that LDHB expression significantly correlates to both KRAS copy number gain and KRAS mutation in lung adenocarcinoma cell lines and tumors. LDHB knockdown reduced cell growth in KRAS-mutant lung cancer both in vitro and in vivo. Finally, LDHB was a prognostic indicator of poor outcome in lung adenocarcinomas. Our work identifies LDHB and more broadly, lactate metabolism, as a potential therapeutic target for KRAS-driven lung cancer.
Materials and Methods
Cell lines and antibodies
The following lung cell lines were used: adenocarcinoma (ALK fusion): NCI-H2228; adenocarcinoma (EGFR mutant): NCI-H1650, NCI-H1975, HCC827, NCI-H820, HCC2279, HCC2935, HCC4011, HCC4006; adenocarcinoma (KRAS amplified): NCI-H322T, NCI-H838; adenocarcinoma (KRAS mutant): HOP-62, NCI-H2122, NCI-H1573, A427, NCI-H1734, NCI-H2030, NCI-H2009, A549, NCI-H2126, NCI-H23; bronchioalveolar adenocarcinoma (KRAS mutant): NCI-H358; non–small cell (KRAS mutant): SW1573; adenocarcinoma (Met amplification): NCI-H1993; squamous cell carcinoma (Met amplification): EBC1; adenocarcinoma: NCI-H1793, RERF-LC-OK, NCI-H1568, VMRC-LCD, ABC-1, RERF-LC-KJ, NCI-H2126; bronchioalveolar adenocarcinoma: NCI-H1666; adenosquamous carcinoma: NCI-H596; large cell carcinoma: HOP-92. The following colon cell lines were used: SW48, SW1417, RKO, KM-12, HT55, HCA-7, C2BBe1, SW948, SW837, SW620, SW1463, SK-CO-1, LS1034, HCT-15, DLD-1, COLO 678, CL-40. Cell lines were cultured in RPMI-1640 or Dulbecco's modified Eagle's medium (DMEM; high glucose) medium, 10% FBS, and 1% penicillin–streptomycin (Invitrogen).
The following antibodies were used for immunoblot analysis: LDHA (Santa Cruz Biotechnology; sc-133123), LDHB (Epitomics; 2090-1), TUBULIN (Sigma; T6074), and HRP-conjugated anti-mouse and anti-rabbit secondary antibodies (Jackson ImmunoResearch).
siRNA screen
An RNAi screen for genes that regulate lung cancer growth was carried out in 4 lung adenocarcinoma cell lines, 2 with chromosome 12p KRAS amplification (NCI-H838, NCI-H322T) and 2 without KRAS amplification (RERF-LC-KJ, NCI-H1568). Genes were selected on the basis of 2 main criteria: (i) they reside within the KRAS amplicon on chromosome 12p (analysis completed with Tumorscape; http://www.broadinstitute.org/tumorscape) and (ii) their gene expression and copy number were significantly upregulated in 10% or more of lung adenocarcinoma tumors and were correlated (P < 0.05; analysis completed with The Cancer Genome Atlas Data Portal; http://tcga-portal.nci.nih.gov). The heatmap of 735 NSCLC tumors and cell lines was made with Integrative Genomics Viewer using data from Tumorscape.
Dharmacon siGENOME siRNAs were individually reverse transfected using DharmaFECT 4 (Dharmacon) in 96-well format in triplicate. Four independent siRNAs were used for each gene. Cell number was determined with CellTiter-Glo (Promega) 6 days after transfection. Values were normalized to a nontargeting control siRNA, and then Z scores were calculated using the following formula: (gene value − plate average)/plate SD. To reduce the Z scores for each gene to a single comparable value, a ΔZ score was calculated: average of the Z scores from the two 12p-amplified cell lines −average Z scores of the nonamplified cell lines. Genes with a ΔZ score less than −1 were considered hits in the 12p-amplified cell lines. Only genes with two or more siRNA oligos with a ΔZ score less than −1 were considered further. Two independent siRNAs from the siGENOME pool were used for subsequent LDHB knockdown analysis (Dharmacon D-009779-01 and D-009779-02).
Gene expression analysis
For cell lines, RNA was harvested from 96-well plates 3 or 4 days after siRNA transfection using the TaqMan Gene Expression Cells-to-CT kit (Applied Biosystems). For mouse tissues/tumors, RNA was harvested using Qiagen RNeasy kit. Quantitative RT-PCR was carried out with the TaqMan One-Step RT-PCR Master Mix Reagents kit using Taqman Gene Expression Assays according to manufacturer protocol (Applied Biosystems). All samples were normalized to a glyceraldehyde-3-phosphate dehydrogenase (GAPDH) control.
Xenograft tumors
NCI-H2122 cells with doxycycline-inducible LDHB knockdown were constructed using the lentivirus pHush-shRNA system (17). Two independent short hairpin RNAs (shRNA) sequences were cloned for LDHB knockdown (shLDHB-1 target sequence: GGATATACCAACTGGGCTA and shLDHB-2 target sequence: GTACAGTCCTGATTGCATC). Hairpins were cloned into the pSHUTTLE-H1 vector and then Gateway (Invitrogen) recombined into a puromycin-selectable lentiviral vector (17). A nontargeting shRNA (pHush-shNTC) was used for control experiments and was obtained from David Davis (Genentech). Lentivirus production and infections were carried out as previously described (18). Cells were selected for stable integration with 2 μg/mL puromycin.
For each shRNA cell line, 5 × 10⁶ cells were injected subcutaneously into the backs of female NCr nude mice (Taconic) to initiate tumor growth. After tumors reached 200 to 300 mm3 in size, the animals from each cell line were split into 2 groups and fed either 5% sucrose or 5% sucrose + 1 mg/mL doxycycline to induce hairpin expression. Tumors with a starting volume less than 200 mm3 at the time of treatment were excluded from further analysis. After 7 days, 3 mice from each group were euthanized and the tumors were harvested for LDHB knockdown analysis. Tumor measurements were carried out on the remaining mice every 3 to 4 days until day 18 postdoxycycline administration. Mouse body weight was also recorded and showed no major changes (data not shown). Tumor growth inhibition values (TGI) were determined with the following calculation: 100 × 1 − [(tumor volumefinal − tumor volumeinitial for doxycycline treated group)/(tumor volumefinal − tumor volumeinitial for sucrose treated group)].
Data analysis of lung adenocarcinoma microarray data
Previously published microarray data of lung adenocarcinomas was used (Gene Expression Omnibus GSE31210; ref. 19). For Figs. 2D, 5B, and 5D, we used the previously defined signature of RAS activation (20). Tumors (n = 226) were separated on the basis of high or low expression of LDHB, separated by mean LDHB expression across all tumors. The expression level of all RAS signature genes was averaged in each group of tumors. For Fig. 5A, we used a defined glycolytic gene signature that was adapted from the Broad Institute Molecular Signatures Database (MSigDB) gene sets for Glucose Metabolic Process (21). The expression level of all glycolysis signature genes was averaged in each tumor and either separated by KRAS gene mutation status or directly compared with the average expression of the RAS signature genes in the same tumor.
Survival analysis
A lung adenocarcinoma tumor microarray was obtained from the Leeds collection. Patient samples were collected with approval from the Yorkshire and Humber East Ethics Committee (approval number: NRES 05/Q1206/147). In total, 170 formalin-fixed, paraffin embedded (FFPE) lung adenocarcinomas were stained by immunohistochemistry for LDHB and correlated to clinical outcome. Kaplan–Meier survival curves were plotted for survival until death or censored from the study and for 5-year survival or censored. P values were calculated by a log-rank test. Fitting the data with a Cox proportional hazards model lead to nearly identical P values (data not shown). For survival analysis of LDHB gene expression, LDHB expression and survival data were previously published (Gene Expression Omnibus GSE11969; ref. 22). LDHB expression was mean-centered across all tumors then separated by above or below the mean. All patients were censored from the study after more than 5 years of follow-up, thus the 5-year survival is shown. P value was calculated by a log-rank test.
Immunohistochemistry
Immunohistochemistry was conducted on 4 μm thick FFPE tissue sections mounted on glass slides. All immunohistochemistry steps were carried out on the Ventana Discovery XT autostainer (Ventana Medical Systems). Pretreatment was done with Cell Conditioner 1 with the standard time. Primary antibodies were used at the following concentrations: MCT1 (Santa Cruz Biotechnology; sc-365501) at 1 μg/mL, MCT4 (Santa Cruz Biotechnology; sc-50329) at 0.1 μg/mL, LDHA (Cell Signaling Technologies; 3582) at 0.081 μg/mL, and LDHB (Epitomics; 2090-1) at 0.04 μg/mL. Slides were incubated with primary antibody for 60 minutes at 37ºC. Ventana Mouse or Rabbit OmniMap was used as the detection system. Ventana DAB and Hematoxylin II were used for chromogenic detection and counterstain. Immuohistochemical (IHC) analyses were conducted by a board certified pathologist (R. Firestein).
Results
Oncogenic activation of KRAS is typically achieved through single residue point mutations that generate a constitutively active form of the protein. In lung adenocarcinomas, the KRAS locus is amplified in 10% to 15% of lung tumors, suggesting an alternative mechanism of KRAS activation in this tumor type (Supplementary Table S1; ref. 9). To further characterize the KRAS locus in lung adenocarcinoma, we conducted a GISTIC analysis on copy number data derived from 735 NSCLC tumors and cell lines. While KRAS is the most significantly amplified gene (Q value = 10−22), the region of copy number gain is relatively broad and harbors 18 additional genes that are both amplified and overexpressed (Fig. 1A and B).

RNAi screen for genes coamplified with KRAS that regulate lung cancer cell growth. A, Heatmap of 735 NSCLC tumors and cell lines showing copy number of a 12 Mb region of chromosome 12 surrounding the KRAS gene. B, shown are Q values (significance of gene amplification in NSCLC data from A) of eighteen genes coamplified with KRAS. These genes had increased copy number and expression in primary lung tumors. C, RNAi screen of genes coamplified with KRAS. Black and red bars represent effects on cell growth for each individual siRNA oligos, as measured by ΔZ score (Z score KRAS amplified cell lines −Z score disomic cell lines). Red bars indicate individual siRNA oligos that had a stronger growth inhibition in KRAS-amplified lung cancer cell lines compared with nonamplified lung cancer cell lines. Genes with 2 or more individual siRNAs specifically inhibiting growth in KRAS-amplified lines are highlighted in red.
RNAi screen for genes coamplified with KRAS that regulate lung cancer cell growth. A, Heatmap of 735 NSCLC tumors and cell lines showing copy number of a 12 Mb region of chromosome 12 surrounding the KRAS gene. B, shown are Q values (significance of gene amplification in NSCLC data from A) of eighteen genes coamplified with KRAS. These genes had increased copy number and expression in primary lung tumors. C, RNAi screen of genes coamplified with KRAS. Black and red bars represent effects on cell growth for each individual siRNA oligos, as measured by ΔZ score (Z score KRAS amplified cell lines −Z score disomic cell lines). Red bars indicate individual siRNA oligos that had a stronger growth inhibition in KRAS-amplified lung cancer cell lines compared with nonamplified lung cancer cell lines. Genes with 2 or more individual siRNAs specifically inhibiting growth in KRAS-amplified lines are highlighted in red.
To functionally interrogate the candidate genes residing in the 12p12 region of copy number gain, we conducted a loss of function RNAi screen in lung adenocarcinoma cell lines that harbored either 12p amplification (NCI-H838, NCI-H322T) or were disomic at this region (RERF-LC-KJ and NCI-H1568). Gene expression and knockdown for all genes in the screen was confirmed by quantitative RT-PCR in NCI-H838 cells (Supplementary Fig. S1). Comparing the Z scores between the amplified and disomic cell lines, genes with a differential cell proliferation effect were identified (Fig. 1C). In addition to KRAS, 2 additional genes, LDHB and MED21, met our significance criteria of at least 2 independent siRNAs scoring at a ΔZ score of −1 or below (Z score chromosome 12p-amplified lines − Z score disomic lines). MED21 (hSrb7) is a member of the mediator complex and is a general regulator of transcription (23). LDHB is a metabolic enzyme that catalyzes the interconversion of lactate and pyruvate (24, 25).
Because LDHB and MED21 are frequently coamplified with KRAS, we first examined whether expression of these genes also correlate to KRAS mutation status. We assessed LDHB and MED21 gene expression in both KRAS wild-type and mutant lung cancer cell lines and found that both genes are upregulated in KRAS-mutant cell lines (Fig. 2A, B). The correlation was significantly stronger for LDHB, which prompted us to look further into LDHB expression and function in the context of KRAS activity. LDHB protein and RNA are overexpressed in KRAS-mutant human lung tumors as well as in 2 mouse lung adenocarcinoma models driven by mutant KRAS (ref. 2; Fig. 2C–E). Consistent with this finding, we also observed that LDHB was upregulated in lung cancers that contain a “RAS activated” gene expression signature (ref. 20; Fig. 2F). To determine whether the relationship between KRAS activation and LDHB extended to other tumor types, LDHB expression was also examined in colon cancer, which frequently harbors KRAS mutations (26). LDHB was not differentially expressed in colon cancer cell lines harboring KRAS mutation, suggesting that the correlation between LDHB and KRAS may be specific to lung adenocarcinomas (Supplementary Fig. S2). We conclude that LDHB is upregulated in lung cancer cell lines and tumors that are characterized by RAS pathway activation.

LDHB is upregulated in KRAS-mutant lung adenocarcinomas. A and B, box plot of relative MED21 (A) and LDHB (B) log2 mRNA expression in KRAS wild-type or KRAS-mutant NSCLC cell lines. P values are Student t test. C, average LDHB IHC score ± SD in KRAS wild-type (n = 31) or KRAS-mutant (n = 24) lung adenocarcinoma tumors. P value is a Student t test. D, Relative Ldhb mRNA expression is shown for normal mouse lung or transgenic mouse models of lung cancer with KRASG12D-activating mutation with or without p53Δlox/Δlox deletion. P values between normal and each tumor type are Student t tests. E, Representative images of LDHB IHC protein staining in normal lung or KRASG12D; p53Δlox/Δlox lung cancer mouse model. F, average log2 expression RAS signature genes (20) ± SEM in lung adenocarcimoma tumors with low (n = 97) or high (n = 129) LDHB expression (below or above mean LDHB expression across all tumors, respectively). P value is a Student t test.
LDHB is upregulated in KRAS-mutant lung adenocarcinomas. A and B, box plot of relative MED21 (A) and LDHB (B) log2 mRNA expression in KRAS wild-type or KRAS-mutant NSCLC cell lines. P values are Student t test. C, average LDHB IHC score ± SD in KRAS wild-type (n = 31) or KRAS-mutant (n = 24) lung adenocarcinoma tumors. P value is a Student t test. D, Relative Ldhb mRNA expression is shown for normal mouse lung or transgenic mouse models of lung cancer with KRASG12D-activating mutation with or without p53Δlox/Δlox deletion. P values between normal and each tumor type are Student t tests. E, Representative images of LDHB IHC protein staining in normal lung or KRASG12D; p53Δlox/Δlox lung cancer mouse model. F, average log2 expression RAS signature genes (20) ± SEM in lung adenocarcimoma tumors with low (n = 97) or high (n = 129) LDHB expression (below or above mean LDHB expression across all tumors, respectively). P value is a Student t test.
To determine whether LDHB is required for the proliferation of KRAS-mutant cancer cells, we examined a panel of 24 lung adenocarcinoma cell lines for LDHB expression. Consistent with our expression data in lung tumors, LDHB was specifically upregulated in both KRAS-amplified and KRAS-mutant lung cancer cell lines when compared with KRAS wild-type cell lines (Fig. 3A and Supplementary Table S2). In contrast, LDHA, the main LDH isoform, was ubiquitously expressed in all lung cell lines examined. To explore the functional consequences of LDHB expression in KRAS aberrant cell lines, we used 2 independent siRNAs to knockdown LDHB in KRAS amplified, mutant, or wild-type lung adenocarcinoma cell lines. Both KRAS-mutant and KRAS-amplified cell lines were generally more sensitive to LDHB knockdown (Fig. 3B). To ensure that these effects were not due to technical differences in knockdown levels, loss of LDHB was confirmed by immunoblot in each cell line tested. Moreover, no changes in LDHA protein levels were observed upon LDHB knockdown (Fig. 3B). Because KRAS mutation does not always confer dependence on KRAS for growth (27), we examined the sensitivity of each cell line to KRAS RNAi-mediated knockdown (Fig. 3B and Supplementary Fig. S3). With minor exception, KRAS-mutant cell lines were dependent on KRAS for growth. These results show that KRAS-dependent cell lines express elevated LDHB levels and are highly dependent on its expression for proliferation.

LDHB is required for lung cancer cell line proliferation when highly expressed. A, immunoblot analysis of LDHB and LDHA in lung adenocarcinoma cell lines that are KRAS wild-type, mutant, or amplified. B, relative cell proliferation (using CellTiter-Glo assay) of lung adenocarcinoma cell lines using 2 independent LDHB siRNA oligos compared with siNTC control. Immunoblot analysis of LDHB and LDHA are shown below each cell line. KRAS status refers to the mutation or amplification status of KRAS. KRAS-dependent cells (denoted as +) have reduced cell proliferation after KRAS RNAi (see Supplementary Fig. S3). C, cell lines were categorized as either high or low LDHB expressers following mean centered normalization (cell lines above the mean were considered high and below the mean considered low). Plot shows relative cell growth (using CellTiter-Glo assay) of each cell line following LDHB knockdown (values were normalized to an siNTC control for each cell line and represent the average of 2 independent siLDHB oligos). Each dot or square denotes an individual cell line and error bars represent SD. Colored circles and boxes highlight oncogenic mutation associated with each particular cell line. P value indicates a statistically significant difference in cell growth between the 2 groups, Student t test.
LDHB is required for lung cancer cell line proliferation when highly expressed. A, immunoblot analysis of LDHB and LDHA in lung adenocarcinoma cell lines that are KRAS wild-type, mutant, or amplified. B, relative cell proliferation (using CellTiter-Glo assay) of lung adenocarcinoma cell lines using 2 independent LDHB siRNA oligos compared with siNTC control. Immunoblot analysis of LDHB and LDHA are shown below each cell line. KRAS status refers to the mutation or amplification status of KRAS. KRAS-dependent cells (denoted as +) have reduced cell proliferation after KRAS RNAi (see Supplementary Fig. S3). C, cell lines were categorized as either high or low LDHB expressers following mean centered normalization (cell lines above the mean were considered high and below the mean considered low). Plot shows relative cell growth (using CellTiter-Glo assay) of each cell line following LDHB knockdown (values were normalized to an siNTC control for each cell line and represent the average of 2 independent siLDHB oligos). Each dot or square denotes an individual cell line and error bars represent SD. Colored circles and boxes highlight oncogenic mutation associated with each particular cell line. P value indicates a statistically significant difference in cell growth between the 2 groups, Student t test.
To determine whether LDHB itself is a downstream KRAS target, we examined LDHB gene expression after KRAS knockdown. We observed that LDHB gene expression did not directly change after KRAS knockdown (Supplementary Fig. S3B), implying that LDHB is required in KRAS-mutant cells, but is not directly regulated by KRAS activity.
Because LDHB expression does not seem to be directly regulated by KRAS, we considered whether LDHB is upregulated in lung cancers that contain mutations in other oncogenic drivers (i.e., EGFR mutation, c-Met amplification, and ALK fusion). Therefore, we immunoblotted a panel of cell lines that were annotated for mutation status (Supplementary Fig. S4A). LDHB was also upregulated in other lung cancer subtypes, in particular those driven by c-MET (2/2 cell lines) and EGFR (3/8 cell lines). The level of overexpression was similar to that observed in KRAS-mutant cancers. To functionally test whether LDHB overexpression reflected a cellular dependence on LDHB, we knocked down LDHB with 2 independent siRNA oligos in a subset of these cell lines (Supplementary Fig. S4B and S4C). We find that cell lines with high levels of LDHB are statistically more sensitive to loss of LDHB (P = 0.00005) than LDHB low-expressing lines (Fig. 3C). Taken together these data suggest that targeting LDHB may provide a broad therapeutic option for patients with lung cancer that specifically overexpress LDHB.
The metabolic and growth requirements of a three-dimensional tumor can be starkly different from cancer cells grown in vitro. To test whether LDHB knockdown affects tumor growth in vivo, we used an inducible shRNA lentiviral system to acutely deplete endogenous LDHB in fully formed tumors. Two independent shRNAs to LDHB (shLDHB) and a nontargeting control (shNTC) were introduced into a human KRAS-mutant lung cancer cell line (NCI-H2122) and subsequently grown as xenografted tumors in mice. Doxycycline-induced LDHB knockdown in fully formed tumors led to significant tumor growth inhibition when compared with the uninduced shLDHB tumors or shNTC controls (Fig. 4A). LDHB knockdown in the tumors was confirmed by immunohistochemistry and immunoblot at day 7 after doxycycline administration (Fig. 4B and C). These observations indicate that LDHB is required for growth of KRAS-mutant lung tumors in vivo.

LDHB is required for lung tumor growth in vivo. A, tumor volumes from xenografted NCI-H2122 cells were measured over time (n = 5–6 mice/group). shRNA expression was induced with doxycycline (sucrose was used as control). TGI values were determined for each shRNA (shLDHB-1 TGI = 46%; shLDHB-2 TGI = 77%). Error bars represent SEM. B, IHC staining for LDHB in representative shLDHB xenograft tumors after 7 days of sucrose or doxycycline treatment. C, immunoblot of LDHB and LDHA in xenograft tumors at day 7 postdoxycycline treatment.
LDHB is required for lung tumor growth in vivo. A, tumor volumes from xenografted NCI-H2122 cells were measured over time (n = 5–6 mice/group). shRNA expression was induced with doxycycline (sucrose was used as control). TGI values were determined for each shRNA (shLDHB-1 TGI = 46%; shLDHB-2 TGI = 77%). Error bars represent SEM. B, IHC staining for LDHB in representative shLDHB xenograft tumors after 7 days of sucrose or doxycycline treatment. C, immunoblot of LDHB and LDHA in xenograft tumors at day 7 postdoxycycline treatment.
KRAS-Mutant lung cell lines and adenocarcinomas are dependent on glycolysis
The “Warburg effect” is named after the observation that many cancer cells generate energy using a high rate of glycolysis, instead of oxidative phosphorylation (28). The high rate of glycolysis occurs regardless of oxygen supply and produces an excess of pyruvate, which gets converted to lactate by LDHA or LDHB and subsequently exported from the cell. We hypothesized that LDHB upregulation may be associated with a more general shift in cellular metabolism toward glycolytic dependence. Because LDHB is overexpressed in KRAS-mutant tumors, we analyzed and compared the expression of a defined glycolytic gene signature (see Methods) between KRAS wild-type and KRAS-mutant lung tumors. Consistent with our hypothesis, KRAS-mutant tumors exhibited an elevated expression of the glycolytic gene signature compared with KRAS wild-type tumors (Fig. 5A). Moreover, lung tumors that have increased expression of the RAS gene signature also show increased expression of the same glycolysis genes (Fig. 5A). This effect seems to be specific to lung cancer, as a correlation between RAS signature expression and glycolytic signature expression was not observed in colon tumors (Supplementary Fig. S2C). This suggests that lung tumors with KRAS mutation and RAS pathway activation are associated with a dependence on glycolysis.
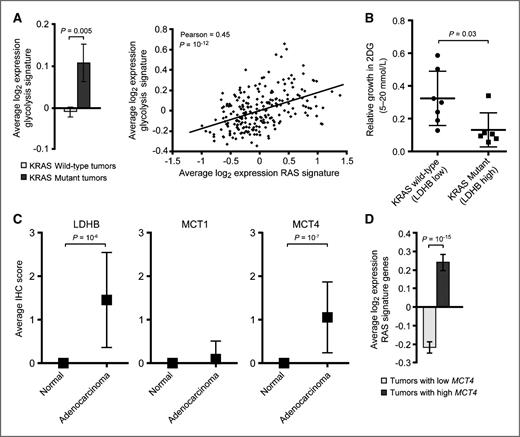
Activated RAS is associated with increased glycolysis in lung adenocarcinomas. A, average log2 expression glycolysis signature genes ± SEM is shown for lung adenocarcimoma tumors (left) that are KRAS wild-type (n = 206) or KRAS-mutant (n = 20). P value is a Student t test. Correlation analysis between the average log2 expression of glycolysis signature genes and RAS signature genes in individual lung adenocarcinomas (right). P value for Pearson correlation is a one-tailed t test. B, sensitivity of 7 KRAS wild-type and 6 KRAS-mutant cell lines to 2-deoxyglucose (2-DG). Each dot or square denotes an individual cell line and error bars represent SD. P value indicates a statistically significant difference in cell growth between the 2 groups, Student t test. C, average IHC scores ±SD for LDHB, MCT1, and MCT4 are shown for normal lung tissue or adenocarcinomas. P values are Student t tests. D, average log2 expression RAS signature genes (20) ± SEM in lung adenocarcimoma tumors with low (n = 118) or high (n = 108) MCT4 expression (below or above mean MCT4 expression across all tumors, respectively). P value is a Student t test.
Activated RAS is associated with increased glycolysis in lung adenocarcinomas. A, average log2 expression glycolysis signature genes ± SEM is shown for lung adenocarcimoma tumors (left) that are KRAS wild-type (n = 206) or KRAS-mutant (n = 20). P value is a Student t test. Correlation analysis between the average log2 expression of glycolysis signature genes and RAS signature genes in individual lung adenocarcinomas (right). P value for Pearson correlation is a one-tailed t test. B, sensitivity of 7 KRAS wild-type and 6 KRAS-mutant cell lines to 2-deoxyglucose (2-DG). Each dot or square denotes an individual cell line and error bars represent SD. P value indicates a statistically significant difference in cell growth between the 2 groups, Student t test. C, average IHC scores ±SD for LDHB, MCT1, and MCT4 are shown for normal lung tissue or adenocarcinomas. P values are Student t tests. D, average log2 expression RAS signature genes (20) ± SEM in lung adenocarcimoma tumors with low (n = 118) or high (n = 108) MCT4 expression (below or above mean MCT4 expression across all tumors, respectively). P value is a Student t test.
To explore the functional significance of these gene expression changes, we tested the sensitivity of 7 KRAS wild-type (low LDHB expressing) and 6 KRAS-mutant (high LDHB expressing) cell lines to the glycolysis inhibitor 2-deoxyglucose (2-DG). KRAS-mutant cell lines were significantly more sensitive to 2-DG inhibition than KRAS wild-type cells (Fig. 5B), suggesting that KRAS-mutant cells are more addicted to glycolysis. Taken together, these data imply that KRAS-mutant tumors are associated with a shift in tumor metabolism that is characterized by increased dependence on glycolysis for energy demands.
The dependence of KRAS-mutated lung tumors on glycolysis and LDHB implies that these tumors are sensitive to perturbations in the end-stage of glycolysis, namely lactate production. In addition to LDH isoforms, which generate lactate, the monocarboxylate transporters (MCT1-4) are key transmembrane proteins that regulate the import/export of lactate (29). While MCT1-4 all have similar structure and function, MCT1 and MCT4 are differentially upregulated in various tumor types and have garnered the most attention in cancer (30). Therefore, we examined the expression of MCT1 and MCT4 in lung adenocarcinomas. IHC analysis revealed that MCT4, but not MCT1, was overexpressed in lung adenocarcinomas (Fig. 5C). Similar to LDHB, MCT4 expression was associated with RAS pathway activation (Fig. 5D). We suggest that KRAS-mutant adenocarcinomas have upregulated components of the lactate machinery to accommodate an increased dependence on glycolysis.
LDHB expression in lung adenocarcinomas correlates with poor clinical outcome
We next examined whether the expression of LDHB in lung cancer correlated with clinical outcome. We scored and analyzed LDHB protein levels by immunohistochemistry on a cohort of 383 lung adenocarcinomas (Fig. 6A and B), of which nearly half (n = 170) had associated survival data (Supplementary Table S3). In Kaplan–Meier analysis, 5-year patient survival was significantly lower in LDHB high (2 or 3 staining) as compared with LDHB low (0 or 1) tumors (33% vs. 48%, log-rank P = 0.005). When we assessed the independent prognostic effect of LDHB using a multivariate Cox model that adjusted for additional predictors of survival, such as sex, age, and tumor grade, high LDHB expression was associated with reduced 5-year survival [HR = 1.67; 95% confidence interval (CI), 1.06–2.62; P = 0.027; Fig. 6C and D; and Supplementary Fig. S5]. Because we observed that LDHB is upregulated in a subset of cancers containing other oncogenic drivers, we also examined if LDHB expression is predictive of lifespan in KRAS wild-type tumors using a microarray dataset that contained associated outcome data. Interestingly, KRAS wild-type lung tumors with high expression of LDHB mRNA trended with a poorer clinical outcome (Supplementary Fig. S5C). These data indicate that LDHB is upregulated in a significant fraction of lung adenocarcinomas and is associated with poor patient outcome.

Patients with lung tumors expressing high LDHB protein have a poor clinical outcome. A, representative IHC photomicrographs show LDHB protein expression in lung adenocarcinoma tumors. IHC score is indicated in parenthesis. B, IHC score breakdown for a panel of normal lung tissue (n = 126) and lung adenocarcinoma tumors (n = 383). C and D, Kaplan–Meier survival data for patients with lung adenocarcinoma, separated by LDHB IHC score. Patients with high LDHB expression (n = 99; IHC score 2 or 3) had a worse overall survival compared with patients with low LDHB expression (n = 71; IHC score 0 or 1) for a 5-year survival (C) or overall survival, as measured by death or being censored from the study (D).
Patients with lung tumors expressing high LDHB protein have a poor clinical outcome. A, representative IHC photomicrographs show LDHB protein expression in lung adenocarcinoma tumors. IHC score is indicated in parenthesis. B, IHC score breakdown for a panel of normal lung tissue (n = 126) and lung adenocarcinoma tumors (n = 383). C and D, Kaplan–Meier survival data for patients with lung adenocarcinoma, separated by LDHB IHC score. Patients with high LDHB expression (n = 99; IHC score 2 or 3) had a worse overall survival compared with patients with low LDHB expression (n = 71; IHC score 0 or 1) for a 5-year survival (C) or overall survival, as measured by death or being censored from the study (D).
Discussion
In this study, we characterized the KRAS amplicon at 12p12 and found 18 genes that are coamplified with KRAS in NSCLC tumors. Using a loss of function RNAi screen, we subsequently knocked down all 18 genes and identified LDHB as an essential regulator of lung cancer. LDHB was upregulated and required for the growth of KRAS-mutant and amplified lung cancers both in vitro and in vivo. Gene expression and functional analyses indicate that KRAS-mutant lung tumors, compared with KRAS wild-type tumors, have a greater predilection for using glycolysis for their energy demands. Consistent with such a role, we find that in addition to LDHB, the lactate transporter MCT4 is also upregulated in KRAS-mutant lung cancer, suggesting a more global shift in metabolic requirements upon KRAS mutation. Finally, we show that LDHB overexpression in patients with lung adenocarcinoma have a poorer prognosis.
Carcinogenesis is a complicated, multistep process that involves combinatorial alterations in oncogenes, tumor suppressors, and metabolic pathways. It is important to note that these alterations in intracellular signaling pathways are a type of evolution that conforms to the changing tumor microenvironment and bioenergetic requirements that allows uncontrolled cell growth. Since Warburg's observation more than 50 years ago, in which tumor cells shift from oxidative phosphorylation to aerobic glycolysis, we are only now beginning to understand the molecular details of this transformation.
In the last decade, there has been accumulating evidence that oncogenes, such as PI3K, AKT, mTOR, EGFR, KRAS, MYC, along with hypoxia-inducible factor 1 (HIF1) stimulate the transcription of key genes that mediate glycolysis and related metabolic pathways (31). For example, PI3K/AKT activation facilitates cellular glucose uptake by upregulating glucose transporters and boosting glycolysis through increasing hexokinase levels and stimulating phosphofructokinase activity (32). Likewise, genes involved in the metabolism of glutamine, which tumor cells need for the production of various metabolic intermediates, are downstream targets of the MYC oncogene (33, 34). Direct regulatory inputs on metabolism are not restricted to oncogenes, as deletion of tumor suppressors, such as p53 and PTEN, also contribute to the metabolic shift (31). Taken together, the concerted upregulation of oncogenes and downregulation of tumor suppressors directly alters the transcriptional controls of the metabolic circuitry.
The direct role of KRAS in regulating tumor metabolism is less well defined. Tumors with oncogenic RAS correlate with numerous metabolic aberrations, including increased consumption of glucose and glutamine, increased production of lactic acid, altered expression of mitochondrial genes, and reduced mitochondrial activity (35–38). Our findings, that a glycolysis gene signature is specifically upregulated in KRAS-mutant lung tumors and that KRAS-mutant cells are more sensitive to the glycolysis inhibitor 2-DG, are consistent with such changes in tumor metabolism. Moreover, a recent report showed that KRAS can also regulate glycolysis and glucose metabolism in a pancreatic cancer mouse model (39). Our observations, however, show that in other cancer types, such as colon cancer, KRAS-mutant tumors do not display elevated dependence on glycolysis. Cumulatively, these studies suggest that examining the effect of KRAS on cellular metabolism should be conducted in a tumor-specific context.
Lactate dehydrogenase enzymes have important roles in aerobic glycolysis, as they are required to convert the surplus of pyruvate generated by a high rate of glycolysis into lactate (25). The LDHA isoform has received the most attention because it is ubiquitously expressed in tumors and is a downstream target of HIF1. While an essential function of LDHA in tumor metabolism has been described (40), the role of LDHB is less clear. One report has shown that the mTOR pathway controls LDHB expression, whereas another report has shown that LDHB transcription is shut off by promoter methylation in bladder, colon, and prostate cancers (41–44). In the context of lung adenocarcinoma, we observed that LDHB is upregulated in KRAS aberrant tumors and in a subset of cell lines containing other oncogenic drivers. Importantly, LDHB is required to maintain cell growth in this context. While our data does not support that LDHB transcription is downstream of KRAS signaling, we hypothesize that a pathway functioning in parallel with KRAS activity might drive LDHB expression. In normal tissues, LDHB is expressed in liver, red blood cells, kidney, and heart, raising concern that its inhibition may have deleterious consequences (45, 46). Intriguingly, however, patients with complete loss of LDHB expression due to a hereditary recessive trait have no significant phenotypic impairment (47, 48). This suggests that an LDHB small-molecule inhibitor may have minimal off-target affects in normal tissue. Future studies are necessary to identify signaling pathways that act upstream of LDHB.
Our data showing that LDHB inhibition reduced cell growth, even in the presence of LDHA, raises an important question about the biochemical activity of the LDHB isoform. Because the LDH enzymes function as both homo- and heterotetramers (46), it is possible that reducing LDHB somehow affects LDHA activity and the forward reaction. However, an alternative explanation is that LDHB has an exclusive function from LDHA. While biochemical data indicates that LDHA and LDHB can run in both the forward and reverse direction, LDHB has a biochemical predilection for the reverse direction (45). Perhaps LDHB functions in certain contexts to oppose LDHA or act as a governor to LDHA function. In this scenario, LDHB would at the very least slow down the conversion of pyruvate to lactate. Future work is necessary to test these hypotheses, but is beyond the scope of this work.
In conclusion, our work identifies LDHB as a promising new therapy target for lung adenocarcinomas that overexpress LDHB and supports the notion that KRAS-driven lung cancers develop a dependence on glycolysis for their metabolic demands.
Disclosure of Potential Conflicts of Interest
All authors are employed by Genentech, Inc.
Authors' Contributions
Conception and design: M.L. McCleland, L. Deming, E.M. Blackwood, R. Firestein
Development of methodology: M.L. McCleland, L. Deming, W.F. Forrest
Acquisition of data (provided animals, acquired and managed patients, provided facilities, etc.): M.L. McCleland, A.S. Adler, L. Deming, E. Cosino, L. Lee, E.M. Blackwood, M. Solon, J. Tao, E. Jackson
Analysis and interpretation of data (e.g., statistical analysis, biostatistics, computational analysis): M.L. McCleland, A.S. Adler, L. Deming, E. Cosino, L. Lee, E.M. Blackwood, L. Li, D. Shames, E. Jackson, W.F. Forrest
Writing, review, and/or revision of the manuscript: M.L. McCleland, A.S. Adler, L. Deming, E.M. Blackwood, L. Li, D. Shames, W.F. Forrest, R. Firestein
Study supervision: E.M. Blackwood, R. Firestein
Acknowledgments
The authors thank Laura Corson, Tom Hunsaker, Anna Hitz, David Shames, Marie Evangelista, and Georgia Hatzivassiliou for helpful comments and discussion, David Davis for reagents, and Pete Haverty for assistance in creating gene signatures.
The costs of publication of this article were defrayed in part by the payment of page charges. This article must therefore be hereby marked advertisement in accordance with 18 U.S.C. Section 1734 solely to indicate this fact.