


Abstract
The relative risk for the development of malignancies following solid organ transplantation seems to be decreased in patients treated with the immunosuppressive agent mycophenolic acid (MPA). However, the molecular mechanisms of the antineoplastic effects of MPA are not completely understood. Here, we report that human endothelial cells and fibroblasts are highly sensitive to MPA treatment. We found that U87 glioblastoma cells were resistant to MPA treatment in vitro. However, U87 tumor growth was markedly inhibited in vivo in BALB/c nude mice, suggesting that MPA exerted its antitumor effects via modulation of the tumor microenvironment. Accordingly, microvascular density and pericyte coverage were markedly reduced in MPA-treated tumors in vivo. Using functional in vitro assays, we showed that MPA potently inhibited endothelial cell and fibroblast proliferation, invasion/migration, and endothelial cell tube formation. To identify the genetic participants governing the antiangiogenic and antifibrotic effects of MPA, we performed genome-wide transcriptional analysis in U87, endothelial and fibroblast cells at 6 and 12 h after MPA treatment. Network analysis revealed a critical role for MYC signaling in endothelial cells treated with MPA. Moreover, we found that the antiangiogenic effects of MPA were organized by coordinated communications between MYC and NDRG1, YYI, HIF1A, HDAC2, CDC2, GSK3B, and PRKACB signaling. The regulation of these “hub nodes” was confirmed by real-time quantitative reverse transcription-PCR and protein analysis. The critical involvement of MYC in the antiangiogenic signaling of MPA was further shown by gene knockdown experiments. Together, these data provide a molecular basis for the antiangiogenic and antifibrotic effects of MPA, which warrants further clinical investigations. [Mol Cancer Ther 2008;7(6):1656–68]
Introduction
Mycophenolic acid (MPA) is a potent uncompetitive inhibitor of inosine monophosphate dehydrogenase (IMPDH), the rate-limiting enzyme in the de novo synthesis of guanosine nucleotides (1, 2). Guanine nucleotides are crucial prerequisites for cell proliferation and many cellular functions including transmembrane and intracellular signaling, DNA replication, and RNA and protein synthesis (1, 2). Mycophenolate mofetil (MMF; CellCept®), the morpholinoethyl ester prodrug of MPA, is approved for the prevention of acute graft rejection in kidney, heart, and liver transplantation (3).
As newer immunosuppressive regimens have steadily reduced the incidence of acute rejection and have extended the life expectancy of allograft recipients, post-transplant malignancy has become an important cause of mortality (4). Unlike other immunosuppressants such as calcineurin inhibitors and azathioprine, the relative risk for the development of post-transplant malignancies seems to be decreased in MPA-treated patients (4, 5). In contrast to other immunosuppressive agents, MMF appears to convey a dose-dependent protective effect against malignant transformation, with patients maintained on 3 g/d MMF manifesting a lower relative risk for skin cancer than those on 2 g/d (5). These clinical observations have led to a renaissance in investigating nonimmunologic and more specifically the antitumor activities of MPA (4, 6–8).
The mechanisms discussed for the potential anticancer effects of MPA include inhibition of DNA synthesis and cell cycle arrest at the G1-S boundary, induction of differentiation in a variety of human tumor cell lines, suppression of glycosylation and expression of several adhesion molecules relevant in tumor metastasis process (4, 6–8).
Until recently, the testing of potential anticancer agents was almost solely based on investigating direct effects of a compound on tumor cells. However, tumor microenvironment consisting of tumor interstitial cells (e.g., fibroblasts and extracellular matrix) and tumor vasculature (e.g., endothelial cells recruited by tumors) are increasingly recognized as critical targets of conventional as well as novel cancer therapeutics (9, 10).
Here, we aimed to uncover the cellular and molecular effects of MPA particularly on the tumor microenvironment compartment. First, we did a comparative analysis to detect the sensitivity of tumor versus microenvironmental cells to MPA-mediated antimitotic effects. Human endothelial cells and fibroblasts were among the most MPA sensitive cells in vitro. Interestingly, we found a large discrepancy between in vitro (resistant) and in vivo (sensitive) response of human brain tumor cells (U87) to MPA, suggesting the tumor microenvironment as a potential target for MPA. Accordingly, we found here that microvascular density and pericyte coverage were markedly reduced in MPA-treated U87 tumors in vivo. Next, we investigated the antiangiogenic activity of MPA in functional angiogenesis assays such as endothelial cell tube formation and endothelial cell migration/invasion. We analyzed the transcriptional response to MPA in microvascular endothelial cells as the effector cells of tumor angiogenesis and interstitial fibroblasts as the effector cells of tumor fibrogenesis. A comprehensive analysis of transcriptome data and functional confirmation of critical signaling patterns and pathway components was done to identify the molecular mechanisms of MPA-induced antiangiogenic effects. Our data suggest a novel strategy to identify and classify compounds with potential antiangiogenic property based on combined functional and integrative transcriptome analysis.
Materials and Methods
Reagents and Cell Culture
Primary isolated human dermal microvascular endothelial cells (HDMVEC) and human dermal fibroblasts were maintained under standard culture conditions in serum reduced (5% FCS) modified Promocell medium (Promocell) as described previously (11–13). Human prostate carcinoma (PC3), non-small cell lung cancer (A549), and glioblastoma (U87) cell lines (Tumorbank DKFZ) were maintained in culture at 37°C with 5% CO2 and 95% humidity in DMEM (10% FCS; Biochrom). For expression profiling and real-time quantitative reverse transcription-PCR (RT-PCR) assessments, HDMVEC, fibroblasts, and U87 cells were treated with 0 and 1 μmol/L MPA (Sigma) for 6 and 12 h, respectively, and processed for RNA isolation.
In vitro Angiogenesis Assays
All in vitro assays were done as described previously (9, 11–14). For proliferation assay, cells were harvested by trypsinization at 37°C and neutralized with trypsin-neutralizing solution. A suspension of 50,000 cells in modified Promocell medium/DMEM was added to 25 cm2 flasks (Becton Dickinson). After 24 h, cells were incubated with MPA at the indicated dose and incubated for another 72 h and then counted. For the tube formation assays, 24-well plates were coated with 300 μL Matrigel (Becton Dickinson), cells were plated, and after 12-h incubation, cells were fixed and stained with Diff-Quick II reagents (Dade Behring). For invasion/migration assay, Matrigel-coated (0.78 mg/mL) Transwells with 8 μm pore size (Becton Dickinson) were used. The HDMVEC or fibroblasts were added to the Transwells (upper compartment). Chemoattractant medium containing 2 ng/mL vascular endothelial growth factor and 4 ng/mL basic fibroblast growth factor (500 μL) was added to 24-well plates (lower wells). The Transwells were transferred to the 24-well plates, and after 18 h of incubation, cells that had invaded the underside of the membrane were fixed and stained with Diff-Quick II solution (Dade Behring), sealed on slides, and counted by microscopy (number of migrated cells per eight optical fields at ×40 objective and ×10 oculars). Experiments were done at least in quadruplicates.
Animal Studies and Immunohistology
The animal experiments were conducted according to the guidelines of the German Animal Protection Law and approved by the state agency supervising animal experimentation (Regierungspraesidium). For tumor growth experiments, athymic 8-week-old, 20 g BALB/c nu/nu mice were obtained from Charles River Laboratories. Human U87 glioblastoma cells (5 × 10⁶ in 100 μL PBS) were injected s.c. into the right hind limb of the mice. Tumor volume was determined by caliper measurements using the formula: volume V = length × width × width × 0.5. Animals were treated with 120 mg/kg b.i.d. oral gavage MMF (CellCept®; Roche), the morpholinoethyl ester prodrug of MPA. Treatment started 45 h after s.c. tumor cell injection. For histologic analysis, tumors were excised and snap frozen in isopentane, cooled by liquid nitrogen, and kept at −80°C. Frozen tissues were sectioned (6 μm), mounted on silan-coated slides, and fixed in ice-cold methanol (1 min) and acetone (2 min). After washing with 1× PBS (pH 7.2), the sections were incubated with Image-iT FX signal enhancer (Invitrogen) for 30 min. Nonspecific binding was blocked with 0.25% casein in PBS (DAKO Protein Block Serum-Free; DAKO) for 30 min. To detect microvascular density, sections were incubated with primary rat anti-mouse CD31 monoclonal antibody (BD Biosciences PharMingen) and secondary Alexa Fluor 555 goat anti-rat IgG (Invitrogen) at room temperature for 30 min each. Pericyte coverage was assessed by costaining for α-smooth muscle actin–positive cells using primary rabbit anti-α-smooth muscle actin polyclonal antibody (Abcam) and secondary Alexa Fluor 488 donkey anti-rabbit IgG (Invitrogen). Visualization and quantification of vessel density was done in at least 10 random high-power field at ×200 magnification using a Nikon fluorescence microscope (Eclipse E600) and digital camera (Nikon Super Coolscan ED 4000).
Expression Profiling
Genome-wide expression profiling was done using 51K Human Unigene III cDNA microarrays. The microarrays were designed, generated, and hybridized as described previously with minor modification (11, 13). Linear amplification from 2 μg total RNA was done using the MessageAmp II aRNA Amplification Kit (Ambion). Amplified RNA (5 μg) was used for direct labeling (LabelStar Array Kit; Qiagen) by incorporation of Cy3- or Cy5-UTP (Perkin-Elmer; NEL578 and NEL579). The corresponding Cy3- and Cy5-labeled probes and competitor DNA (5 μg human Cot-DNA, Invitrogen; 5 μg poly-dA; Amersham) were combined, diluted in hybridization buffer to the final volume of 80 μL (50% formamide, 6× SSC, 0.5% SDS, 5× Denhardt's solution), and denatured for 5 min at 95°C before hybridization. Prehybridization was done at 42°C for 20 min in 6× SSC, 0.5% SDS, and 1% bovine serum albumin. Slides were rinsed in H2O and spotted probes were denatured by incubating the slide for 2 min in 90°C H2O. Hybridization probe was added and static hybridization was done at 42°C for 16 h. Excess of probe was removed by washing in 2× SSC, 0.5% SDS at 42°C for 5 min then in 0.2× SSC, 0.5% SDS at 42°C for 15 min and finally in isopropanol for 30 s at room temperature. Slides were scanned with Agilent Microarray Scanner and image processing was done using the “Chipskipper” software. Data were stored in MO-MEX database Bloader that enables direct submission of large batches of MIAME complaint expression profiling data to the ArrayExpress database. Microarray data are available online at ArrayExpress (http://www.ebi.ac.uk/arrayexpress) under the accession no. E-TABM-315.
Array Data and Pathway Analysis
Generation of expression matrices, data annotation, filtering, and processing were done using our in-house TableButler software package. All microarray statistics including t-test with permutation analysis (n = 1000), significance analysis of microarrays, Pavlidis template matching, and cluster analysis were done using the CSPAM software package. Pathway analysis was done based on information available on cellular signaling processes (protein-protein interaction, gene ontology, involvement in specific signaling pathway, cellular localization, etc.) using PubMed/Entrez gene (National Center for Biotechnology Information; http://www.ncbi.nlm.nih.gov/entrez), Human Protein Reference Database (http://www.hprd.org), Gene Ontology Consortium (http://www.geneontology.org), Kyoto Encyclopedia of Genes and Genomes (http://www.genome.jp/kegg), natural language processing (ResNet database, Pathway Assist; Ariadne Genomics), and a curated database on signaling networks and systems biology package (Metacore; Genego; http://www.genego.com) as sources. Metacore manually annotated database was derived from literature publications on proteins and small molecules (MetaCore; GeneGo). This was developed with an Oracle version 9.2.0.4 Standard Edition (Oracle)–based architecture for the representation of biological functionality and integration of functional, molecular, or clinical information. To construct the network, we searched and analyzed direct interactions among the selected significantly regulated genes in endothelium after MPA treatment.
Real-time Quantitative RT-PCR and Western Blot
Expression levels of RNA transcripts were quantitated by real-time PCR as described (11, 13, 14). Total RNA from HDMVEC was isolated using RNeasy Kit (Qiagen). RNA quality was insured by lab-on chip technology. SYBR Green assay and the ABI Prism 7900HT Sequence Detection System (Applied Biosystems) were used for the real-time quantitation of the RNA. A consensus sequence, derived from Entrez Gene database (National Center for Biotechnology Information) accession nos.: GSK3B, glycogen synthase kinase 3β, Gene ID: 2932, mRNA sequence NM_002093; MYC, c-myc myelocytomatosis viral oncogene homologue, Gene ID: 4609, mRNA sequence NM_002467; CDC2, cell division cycle 2, G1-S and G2-M, Gene ID: 983, mRNA sequence NM_001786; YY1, Yin Yang 1 transcription factor, Gene ID: 7528, mRNA sequence NM_003403; PRKACB, protein kinase, cyclic AMP dependent, catalytic, β, Gene ID: 5567, mRNA sequence NM_002731; HIF1A, hypoxia-inducible factor 1, α subunit, Gene ID: 3091, mRNA sequence NM_001530; HDAC2, histone deacetylase 2, Gene ID: 3066, mRNA sequence NM_001527; NDRG1, N-myc downstream regulated gene 1, Gene ID: 10397, mRNA sequence NM_006096, was used to design the forward and reverse primers to the sequences using ABI Primer Express software (Cytomyx). The primers were as follows: GSK3B: forward (5′-ACTCCACCGGAGGCAATTG-3′) and reverse (5′-GCACAAGCTTCCAGTGGTGTT-3′), MYC: forward (5′-CTCCCTCCACTCGGAAGGA-3′) and reverse (5′-GCATTTTCGGTTGTTGCTGAT-3′), CDC2: forward (5′-AAGCCTAGCATCCCATGTCAA-3′) and reverse (5′-CAGTGCCATTTTGCCAGAAA-3′), YY1: forward (5′-CGAAGGCTGTGGGAAACG-3′) and reverse (5′-ACATAGGGCCTGTCTCCGGTAT-3′), PRKACB: forward (5′-TGGATTGGTGGGCATTAGGA-3′) and reverse (5′-TGGTTGGTCTGCAAAGAATGG-3′), HIF1A: forward (5′-CCAGTTACGTTCCTTCGATCAGT-3′) and reverse (5′-TTTGAGGACTTGCGCTTTCA-3′), HDAC2: forward (5′-GCTCTCAACTGGCGGTTCA-3′) and reverse (5′-CCAGCCCAATTAACAGCCATA-3′), and NDRG1: forward (5′-TACATGCCCTCGGCTAGCAT-3′) and reverse (5′-AGAGAAGTGACGCTGGAACCA-3′).
After RNA isolation contaminating genomic DNA was removed by DNase I treatment (DNA-free; Ambion). First-strand cDNA was reverse transcribed from total RNA using the cDNA Archive Kit (MultiScribe Reverse Transcriptase; Applied Biosystems) and stored at −20°C until use. cDNA were mixed with SYBR Green PCR master mix (Applied Biosystems) and primers, and real-time PCR was done. In addition to profiling all samples for the target sequence, samples were profiled for 18S (rRNA) expression as endogenous control. For each single-well amplification reaction, a threshold cycle (CT) was observed in the exponential phase of amplification and the quantitation of relative expression levels was achieved using standard curves for both target and endogenous controls. Western blot analysis was done from endothelial cell lysates after 18-h treatment with MPA at dose indicated using anti-NDRG1 (sc-30040/sc-19464), anti-MYC (sc-40), and anti-HDAC2 (sc-7899; Santa Cruz Biotechnology) as well as anti-β-actin (Cell Signaling) primary antibodies. All assays were done in triplicates.
Gene Knockdown Experiments
MYC small interfering RNA (siRNA), Silencer validated siRNA (MYCsiRNA), and nonsilencing siRNA, Silencer Negative Control no. 1 siRNA (control) were synthesized by Ambion. IMPDH siRNA (HS_IMPDH1_5_HP validated siRNA) were synthesized by Qiagen. Endothelial cells were transfected at a final siRNA concentration of 100 nmol/L by reverse transfection using siPORT Amine Transfection Agent (Ambion) according to the manufacturer's instruction.
Statistical Analysis for Animal and Functional Data
Statistical evaluation of tumor growth was done by comparisons of tumor volumes in MMF-treated versus control mice at time points after tumor implantation using the Wilcoxon rank-sum test. For multiple comparisons, the Kruskal-Wallis ANOVA was used for nonparametric variables. For parametric variables, ANOVA was used along with Fisher's least significant difference. All analyses were two tailed. P < 0.05 was considered statistically significant.
Results
To characterize potential antiangiogenic or antifibrotic effects of MPA, we first tested the relative sensitivity of the effector cells of these processes, endothelial cells (HDMVEC), and fibroblasts in comparison with different human tumor cell lines (U87, A549, and PC3). We found that endothelial cells were the most sensitive cells to MPA treatment with an IC50 < 500 nmol/L for antimitotic effects (Fig. 1A). Fibroblasts were also prone to MPA-induced cell cycle inhibition but exhibited a higher IC50 (<1 μmol/L) compared with endothelial cells. The two human tumor cell lines A549 non-small cell lung cancer cells and PC3 prostate cancer cells showed intermediate sensitivity with an IC50 >1 μmol/L. Interestingly, U87 glioblastoma cells were resistant against MPA treatment up to 1 μmol/L (P > 0.05). Thus, MPA exhibited preferential antiproliferative activity against the endothelial cells and fibroblasts.

Functional investigation of MPA. MPA exhibited preferential antiproliferative activity against HDMVEC and fibroblasts (A). Whereas U87 glioblastoma cells were resistant to MPA treatment, A549 non-small cell lung cancer and PC3 prostate cancer cells showed intermediate sensitivity (A). The MPA-resistant U87 cells were s.c. injected in BALB/c nude mice and treated with the MPA prodrug MMF 120 mg/kg b.i.d. per oral gavage as described in Materials and Methods (B). U87 tumor growth was significantly inhibited from day 5 after tumor implantation (*, P < 0.05, MMF versus control). Tumor angiogenesis was also markedly inhibited in MMF-treated tumors as determined by CD31 (microvessel density) and α-smooth muscle actin positive (pericyte, α-smooth muscle actin positive) staining (C). MPA inhibited endothelial cell tube formation (D) as well as Matrigel migration/invasion (E) at 1 μmol/L (both >60% inhibition). Likewise, the invasion and migration abilities of fibroblasts were also impaired after MPA treatment (E). Together, these data suggest a potential antiangiogenic and antifibrotic effect for MPA. Columns, mean; bars, SD. *, P < 0.01, versus control unless otherwise indicated.
Functional investigation of MPA. MPA exhibited preferential antiproliferative activity against HDMVEC and fibroblasts (A). Whereas U87 glioblastoma cells were resistant to MPA treatment, A549 non-small cell lung cancer and PC3 prostate cancer cells showed intermediate sensitivity (A). The MPA-resistant U87 cells were s.c. injected in BALB/c nude mice and treated with the MPA prodrug MMF 120 mg/kg b.i.d. per oral gavage as described in Materials and Methods (B). U87 tumor growth was significantly inhibited from day 5 after tumor implantation (*, P < 0.05, MMF versus control). Tumor angiogenesis was also markedly inhibited in MMF-treated tumors as determined by CD31 (microvessel density) and α-smooth muscle actin positive (pericyte, α-smooth muscle actin positive) staining (C). MPA inhibited endothelial cell tube formation (D) as well as Matrigel migration/invasion (E) at 1 μmol/L (both >60% inhibition). Likewise, the invasion and migration abilities of fibroblasts were also impaired after MPA treatment (E). Together, these data suggest a potential antiangiogenic and antifibrotic effect for MPA. Columns, mean; bars, SD. *, P < 0.01, versus control unless otherwise indicated.
Tumor Angiogenesis and Microenvironment In vivo and In vitro
Based on our in vitro screen results, we hypothesized that the antiangiogenic effects of MPA may result in tumor growth inhibition in vivo even if the tumor cells themselves are resistant to MPA therapy. Therefore, we used the MPA-resistant human U87 tumor s.c. xenograft model in BALB/c nude mice. In support of our hypothesis, we found a significant inhibition of tumor growth (∼70% after day 14 after tumor implantation; P < 0.01) in MMF-treated versus control mice (Fig. 1B). Further, microvessel density (CD31 staining) and pericyte coverage determined by α-smooth muscle actin staining were markedly reduced in MMF-treated versus control tumors (44% and 78%, respectively; Fig. 1C). These data emphasize the importance of tumor microenvironment and, in particular, tumor vessels in MPA-induced antitumor effects.
Next, MPA was tested in functional angiogenesis assays such as endothelial cell migration/invasion and tube formation. As shown in Fig. 1D and E, MPA potently inhibited endothelial cell tube formation as well as endothelial cell migration/invasion at 1 μmol/L (both >60% inhibition; P < 0.01). The invasion and migration of fibroblasts were also impaired after MPA treatment (Fig. 1E). Together, these data showed potential antiangiogenic and antifibrotic effects of MPA.
Deciphering the Transcriptional Response to MPA
Next, we sought to investigate the genetic participants of MPA-mediated antiangiogenic and antifibrotic effects by expression profiling 6 and 12 h after treatment. The above-shown cell-based assays exhibited potent activity against both endothelial cells and fibroblasts, whereas glioblastoma cells remained resistant to MPA therapy. Therefore, the transcriptional response to MPA in U87 glioblastoma was used to subtract nonspecific MPA effects and to compare the resulting shift of the transcriptome in sensitive versus resistant cells (Fig. 2A).

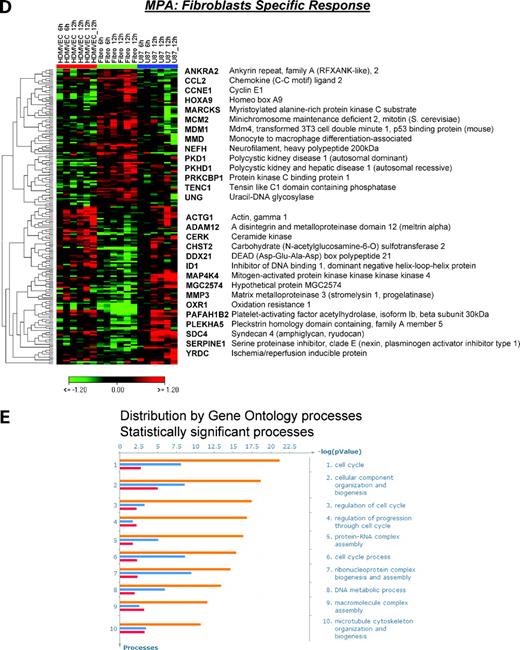
Transcriptional response to MPA. Schematic diagram of cell type–specific versus cell type–independent transcriptional response to MPA (A). Based on the phenomenologic observation of higher sensitivity of endothelial cells and fibroblasts to MPA treatment, the genetic participants of MPA-induced antiangiogenic and antifibrotic effects were identified. The transcriptional response to MPA treatment in resistant U87 cells was used to subtract nonspecific MPA effects and to compare the resulting shift of the transcriptome in sensitive versus resistant cells over time. Three classes of gene regulation were identified: cell type independent (B), endothelial cell specific (C), and fibroblast specific (D) regulation of genes determined at 6 and 12 h after 1 μmol/L MPA treatment. Selected set of genes are presented using hierarchical clustering (HCL) with Euclidean distances and complete linkage analysis (for detailed gene lists, see Supplementary Tables). Each row represents log2 expression ratios of an individual gene (MPA treated versus control) and the columns indicate each respective treatment (two replicates for 6 h and four replicates for 12 h). Expression ratios are colored according to the scale bar: green, >2-fold down-regulation; red, >2-fold up-regulation. E, top 10 functional processes affected by MPA treatment. Data analysis among down-regulated genes from the three selected gene sets resulted in significant enrichment for gene ontology processes related to cell cycle regulation, protein-RNA complex biogenesis and assembly, DNA metabolism, and microtubule/cytoskeleton organization and biogenesis. Columns, -log P values representing the probability for the gene ontology mapping arising by chance and are colored based on the MPA regulation of genes in endothelium (orange), fibroblasts (red), or both sensitive cell types (blue).
Transcriptional response to MPA. Schematic diagram of cell type–specific versus cell type–independent transcriptional response to MPA (A). Based on the phenomenologic observation of higher sensitivity of endothelial cells and fibroblasts to MPA treatment, the genetic participants of MPA-induced antiangiogenic and antifibrotic effects were identified. The transcriptional response to MPA treatment in resistant U87 cells was used to subtract nonspecific MPA effects and to compare the resulting shift of the transcriptome in sensitive versus resistant cells over time. Three classes of gene regulation were identified: cell type independent (B), endothelial cell specific (C), and fibroblast specific (D) regulation of genes determined at 6 and 12 h after 1 μmol/L MPA treatment. Selected set of genes are presented using hierarchical clustering (HCL) with Euclidean distances and complete linkage analysis (for detailed gene lists, see Supplementary Tables). Each row represents log2 expression ratios of an individual gene (MPA treated versus control) and the columns indicate each respective treatment (two replicates for 6 h and four replicates for 12 h). Expression ratios are colored according to the scale bar: green, >2-fold down-regulation; red, >2-fold up-regulation. E, top 10 functional processes affected by MPA treatment. Data analysis among down-regulated genes from the three selected gene sets resulted in significant enrichment for gene ontology processes related to cell cycle regulation, protein-RNA complex biogenesis and assembly, DNA metabolism, and microtubule/cytoskeleton organization and biogenesis. Columns, -log P values representing the probability for the gene ontology mapping arising by chance and are colored based on the MPA regulation of genes in endothelium (orange), fibroblasts (red), or both sensitive cell types (blue).
In agreement with the functional observations, we identified three types of gene regulation reflecting (a) cell type–independent regulation in MPA-sensitive HDMVEC and fibroblasts, (b) endothelial cell-specific MPA response, and (c) fibroblast-specific MPA response (Fig. 2A-D). Detailed lists of selected genes are available online (Supplementary Tables).5
Supplementary material for this article is available at Molecular Cancer Therapeutics Online (http://mct.aacrjournals.org/).
We found 128 unique genes that were differentially regulated in both MPA-sensitive endothelial cells and fibroblasts and MPA-resistant U87 cells (P < 0.01; Pavlidis template matching correlation coefficient > 0.74; Fig. 2B). However, the predominant gene expression pattern after MPA treatment was a gradient of gene regulation from the most MPA-sensitive endothelial cells (up-regulation or down-regulation) to fibroblasts (intermediate regulation) to the resistant U87 glioblastoma (no or inverse regulation compared with HDMVEC). Based on this profile, we selected 634 significantly regulated genes (false discovery rate ≤ 5%, significance analysis of microarray). Whereas 109 genes were up-regulated in endothelial cells, 525 genes were found to be down-regulated after MPA treatment (Fig. 2C; Supplementary Table).5 Next, we selected those genes that were selectively and differentially regulated after MPA treatment in fibroblasts versus other cell types. We found 201 significantly regulated genes (P < 0.01; Fig. 2D; Supplementary Table).5
Enrichment analysis among down-regulated genes from these three selected gene sets resulted in significant enrichments for gene ontology processes related to cell cycle regulation, protein-RNA complex biogenesis and assembly, DNA metabolism, and microtubule/cytoskeleton organization and biogenesis (Fig. 2E). Example genes from the cell cycle and DNA metabolism processes that were down-regulated by MPA in both endothelial and fibroblast cells are the methyl donors (MTHFD1L and MTHFD2) or cell division proteins (CDC20, CCNB1, and CKS2). Further, the cytoskeletal protein γ-actin was down-regulated in fibroblasts, whereas α-tubulin was down-regulated in endothelial cells after MPA treatment. Among the genes involved in matrix remodeling, we found matrix metalloproteinases (e.g., MMP3 and ADAM12) and plasminogen activator inhibitor (PAI1/SERPINE1) to be specifically down-regulated in fibroblasts after MPA treatment. Likewise, the matrix proteins fibronectin (FN1) and Tenascin (TenascinC) were down-regulated in endothelial cells. Moreover, we found that thrombospondin 2 (THBS2), a key endogenous antiangiogenic and “matricellular” protein, was up-regulated after MPA treatment in endothelial cells (Fig. 2C). Together, these genetic regulations support the proposed antifibrogenic and antiangiogenic activity of MPA in microenvironment.
Antiangiogenic Network of MPA
We hypothesized that those genes that were selectively regulated in endothelium might be involved in the antiangiogenic signaling of MPA. We found that a substantial fraction of MPA down-regulated genes directly interact through reciprocal regulation of diverse nature [expression, promoter binding, posttranslational modifications (e.g., phosphorylation), and protein-protein binding]. From these interactions, we constructed a gene regulatory network (Fig. 3A). Interestingly, the network comprised a few number of highly connected genes (“hub nodes”) compared with a large number of less connected genes, reminiscent of scale-free networks. These hub nodes include HIF1A, YYI, HDAC2, CDC2, GSK3B, PRKACB, and MYC. HIF1A is a basic helix-loop-helix transcription factor that plays a key role as hypoxia sensor and regulator of angiogenic genes. The transcription factor YY1 is known to have a fundamental role in biological processes such as embryogenesis, differentiation, replication, and cellular proliferation. Covalent modifications of histone proteins, particularly deacetylation of lysine residues, are important for the regulation of gene transcription in both normal and malignant cells. These processes are controlled by histone acetyltransferases and HDAC. Elevated expression of HDAC2 seems to play an important role in development of cancer. Cyclin-dependent kinases are critical regulators of cell cycle progression and RNA transcription. CDC2 (also known as CDK1) is essential for G1-S- and G2-M-phase transitions of eukaryotic cell cycle. GSK3B is a key downstream target of phosphatidylinositol 3-kinase/AKT survival signaling pathway and involved in the regulation of apoptosis. Protein kinase A (PKA) catalytic subunit β (PRKACB) is a key effector of cyclic AMP–mediated signal transduction. The c-MYC proto-oncogene encodes a transcription factor involved in the control of cell growth and differentiation and is broadly implicated in tumorigenesis. Among the identified hub nodes, the MYC pathway was heavily involved in the network with >50 connections between MYC and other network components (Fig. 3B). For example, MYC was connected with most of the hub nodes (HIF1A, YY1, GSK3B, PRKACB, and HDAC2) and important downstream genes (e.g., interleukin-1β). Of note, in alignment with the down-regulation of MYC after MPA treatment, the NDRG1, a negative target of MYC, was up-regulated after MPA treatment in endothelial cells. NDRG1 is well known as a MYC downstream gene and is involved in cell growth and differentiation process.

Antiangiogenic network of MPA. A substantial fraction of MPA down-regulated genes in endothelium interact directly and constitute a gene regulatory network (A). Network analysis reveals a critical involvement of MYC, YYI, HIF1A, HDAC2, CDC2, GSK3B, and PRKACB in the antiangiogenic signaling of MPA (A, red circles). These data suggest that gene regulatory networks rather than single pathways govern the antiangiogenic effects of MPA. Among the identified hub nodes, MYC pathway shows the highest degree of interconnectedness (>50 connections within the network) and thus represents a critical target of MPA in endothelium (B).
Antiangiogenic network of MPA. A substantial fraction of MPA down-regulated genes in endothelium interact directly and constitute a gene regulatory network (A). Network analysis reveals a critical involvement of MYC, YYI, HIF1A, HDAC2, CDC2, GSK3B, and PRKACB in the antiangiogenic signaling of MPA (A, red circles). These data suggest that gene regulatory networks rather than single pathways govern the antiangiogenic effects of MPA. Among the identified hub nodes, MYC pathway shows the highest degree of interconnectedness (>50 connections within the network) and thus represents a critical target of MPA in endothelium (B).
RT-PCR and Protein Analysis
To confirm the regulation pattern detected from microarray data with another, independent method, the key network components including MYC, NDRG1, YYI, HIF1A, HDAC2, CDC2, GSK3B, and PRKACB were analyzed by real-time quantitative RT-PCR (Fig. 4). In agreement with the array data, all genes exhibited an increase of expression from endothelial cells over fibroblasts to U87 cells at both 6 and 12 h, whereas NDRG1 showed an opposite regulation pattern. The expression data were further confirmed on the protein level by Western blot analysis. In the dose range between 0 and 2 μmol/L MPA, we found a dose-dependent down-regulation of HDAC2 and MYC, whereas NDRG1 was up-regulated 18 h after treatment in endothelium (Fig. 5A).
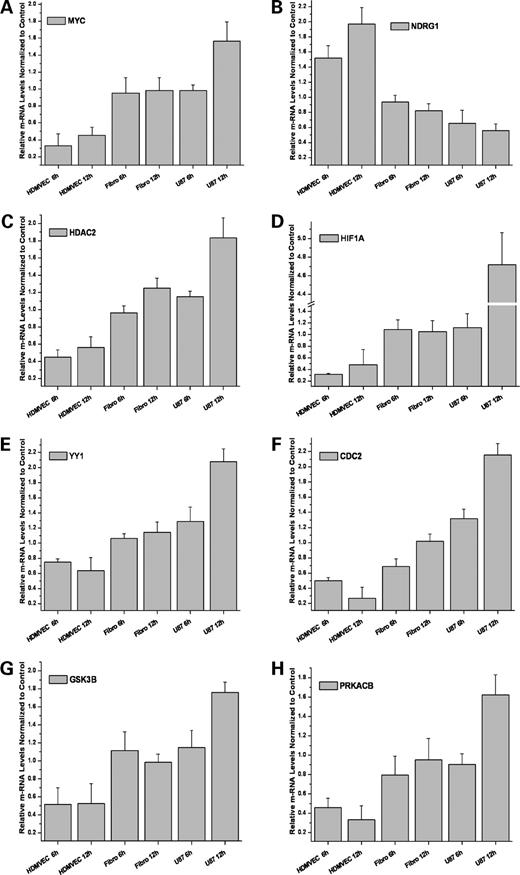
RT-PCR confirmation. The real-time quantitative RT-PCR of MYC, YYI, HIF1A, HDAC2, CDC2, GSK3B, and PRKACB genes paralleled the microarray results. At time points 6 and 12 h after MPA treatment, all genes are down-regulated in endothelium, not or weakly regulated in fibroblasts, and increasingly up-regulated in U87 cells. Accordingly, MYC negatively regulated downstream gene, NDRG1, exhibits the opposite regulation pattern. Columns, mean (n = 3); bars, SD.
RT-PCR confirmation. The real-time quantitative RT-PCR of MYC, YYI, HIF1A, HDAC2, CDC2, GSK3B, and PRKACB genes paralleled the microarray results. At time points 6 and 12 h after MPA treatment, all genes are down-regulated in endothelium, not or weakly regulated in fibroblasts, and increasingly up-regulated in U87 cells. Accordingly, MYC negatively regulated downstream gene, NDRG1, exhibits the opposite regulation pattern. Columns, mean (n = 3); bars, SD.
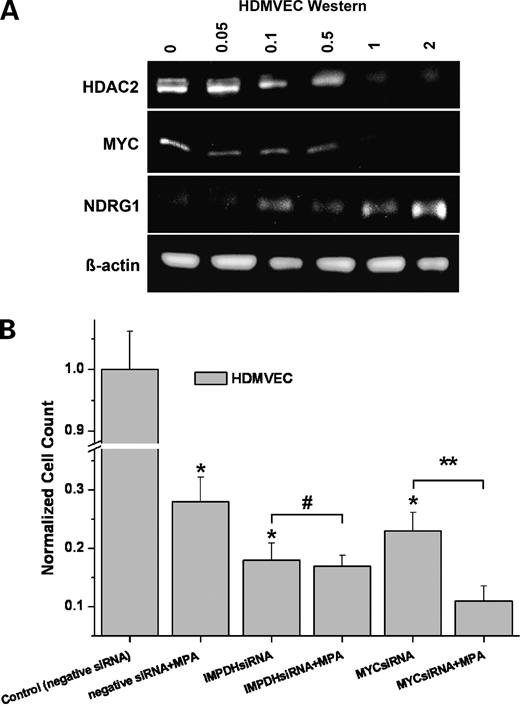
Protein and functional analysis. A, Western blotting showed a dose-dependent regulation of HDAC2, MYC, and NDRG1 in endothelium after 18 h treatment with 0, 0.05, 0.1, 0.5, 1, and 2 μmol/L MPA. B, siRNA silencing of MYC as an example for the highly connected “hub nodes” of MPA. MPA (1 μmol/L) with negative siRNA inhibited endothelial cell proliferation. Treatment of endothelial cells with either MYC siRNA or IMPDH siRNA resulted in a comparable inhibition of endothelial cell proliferation (both >70%; *, P < 0.01), resembling the MPA effect. Addition of MPA to IMPDH siRNA did not further enhance the antimitotic effect of IMPDH siRNA alone (#, P > 0.05). However, addition of MPA to MYC siRNA led to an enhancement of their antiproliferative effects (**, P < 0.02). Columns, mean; bars, SD (n = 3).
Protein and functional analysis. A, Western blotting showed a dose-dependent regulation of HDAC2, MYC, and NDRG1 in endothelium after 18 h treatment with 0, 0.05, 0.1, 0.5, 1, and 2 μmol/L MPA. B, siRNA silencing of MYC as an example for the highly connected “hub nodes” of MPA. MPA (1 μmol/L) with negative siRNA inhibited endothelial cell proliferation. Treatment of endothelial cells with either MYC siRNA or IMPDH siRNA resulted in a comparable inhibition of endothelial cell proliferation (both >70%; *, P < 0.01), resembling the MPA effect. Addition of MPA to IMPDH siRNA did not further enhance the antimitotic effect of IMPDH siRNA alone (#, P > 0.05). However, addition of MPA to MYC siRNA led to an enhancement of their antiproliferative effects (**, P < 0.02). Columns, mean; bars, SD (n = 3).
Functional Validation of MYC in the Antiangiogenic Network of MPA
The strength of a scale-free network architecture is its robustness against random attacks. On the other hand, such networks are vulnerable to the targeted removal of their highly connected hub nodes. If MYC was an essential hub of the MPA-mediated antiangiogenic network, its removal should at least in part mimic the MPA effects in endothelium. Therefore, we treated endothelial cells with MYC siRNA versus negative siRNA as control (Fig. 5B). Indeed, targeted silencing of MYC in endothelial cells by MYC siRNA inhibited endothelial cell proliferation comparable with 1 μmol/L MPA treatment (both >70%; P < 0.01). Likewise, targeted siRNA silencing of IMPDH as the principle pharmacologic target of MPA led to a substantial inhibition of endothelial cell proliferation (>80%; P < 0.01). Addition of MPA to MYC siRNA enhanced the antiproliferative effect of MYC siRNA monotherapy (P < 0.02), suggesting that MPA exerts additional antiangiogenic activities in endothelium besides the inhibition of MYC. In contrast, the addition of MPA to IMPDH siRNA did not further enhance the antimitotic effect of IMPDH siRNA alone (P > 0.05).
Discussion
Tumor angiogenesis and fibrogenesis have emerged as important targets in anticancer therapy (10). Here, we show that the immunosuppressive agent MPA exerts potent antiangiogenic and antifibrotic activity. Moreover, we identified the genetic participants and signaling pathways that govern the antiangiogenic and antifibrotic effects of MPA.
The antiangiogenic activity of the immunosuppressive drug MPA described here together with recent reports of antiangiogenic properties attributed to cytotoxic agents challenge the original conception of an antiangiogenic compound that would ideally act through vascular endothelial specific receptors or ligands.
The angiogenesis process encompasses several critical steps including endothelial cell proliferation, migration/invasion, and differentiation to ultimately form new sprouts and vessels (10, 13). Therefore, it is conceivable that compounds interfering with cellular proliferation, migration, or differentiation may affect the angiogenesis process. Consequently, to classify a certain compound as antiangiogenic, a therapeutic “window” is needed in which the compound preferentially inhibits endothelial cells while sparing other cell types. Interestingly, the successful development of MPA as immunosuppressive agent was based on the observation that immune cells are much more prone to the inhibition of de novo guanosine nucleotides synthesis compared with other cell types that circumvent the MPA-mediated IMPDH inhibition by a salvage pathway (1). Likewise, here we found a preferential sensitivity of endothelial cells and fibroblasts to MPA treatment at the relative low dose of 1 μmol/L compared with three different human tumor cell lines (PC3 prostate cancer, U87 glioblastoma, and A549 non-small cell lung cancer). Although U87 glioblastoma cells were resistant to MPA treatment in vitro, we found that MPA significantly inhibited U87 tumor growth in vivo, suggesting an important role for tumor microenvironment in MPA response. In support of our hypothesis and in vitro data, angiogenesis was markedly impaired in MPA-treated U87 tumors in vivo. Recently, pericytes have gained new attention as functional and critical contributors to tumor angiogenesis and therefore as potential new targets for antiangiogenic therapies. Of note, MPA also significantly reduced the number of tumor microvessels covered by pericytes. Together, we show that even if the tumor cells are resistant to MPA treatment in vitro, tumor growth could be significantly inhibited via the potent antiangiogenic and tumor-stromal effects in vivo of MPA.
We also show functionally that endothelial cell migration/invasion and tube formation are markedly inhibited after 1 μmol/L MPA. Indeed, others have recently shown that much higher concentrations of guanosine are required to completely reverse MPA-mediated inhibition in human umbilical vein endothelial cells compared with T cells, suggesting that de novo nucleotide synthesis might play a more essential role in endothelial cell proliferation than even in T and B cells (15). Further, antiendothelial activity of MPA was detected in two recent pharmacologic screens aimed to identify compounds with antiangiogenic property among the Food and Drug Administration–approved drugs (15, 16). According to the pharmacokinetic data available in kidney transplant patients treated chronically with MMF (1-1.5 g p.o. b.i.d.), a peak plasma level of MPA is achieved at ∼54 μmol/L with an apparent half-life of 17.9 ± 6.5 h. Thus, the immunosuppressive dose achieved in transplanted patients exceeds up to ∼54-fold the antiangiogenic dose of 1 μmol/L proposed here. Together, these data support the hypothesis that the reduced number of post-transplantation malignancies in patients treated with MMF might at least in part result from the antiangiogenic and antifibrotic effects of MPA. These data also suggest further investigations of the Food and Drug Administration–approved drug MMF as an antiangiogenic and antifibrotic agent. Another, still controversial point is whether the immunosuppressive treatment should be continued once a tumor is detected and the transplanted patient needs to be treated with chemotherapy or radiotherapy. Our data would suggest potential antiangiogenic and therefore anticancer benefits from continuing MMF in these patients. This scenario warrants further clinical evaluation as well, but caution is mandatory with respect to unknown MPA interactions with other treatments.
One major focus of this article was to better understand the antiangiogenic activity of MPA on a systems level by constructing a gene regulatory network among the down-regulated genes in endothelium. The generation of networks from transcriptome data is still rudimentary and also biased by the limited number of well-characterized genes and their multifaceted interaction. However, the network approach may be helpful to extract critical pathways and their communication, which otherwise would be hardly visible by studying the long lists of differentially regulated genes generated by microarrays. In fact, we identified several hub nodes within the antiangiogenic signaling network of MPA and confirmed their regulation by quantitative RT-PCR and protein analysis. In particular, MYC signaling was found to be heavily involved (>50 connections within the network) in the antiangiogenic action of MPA. In alignment with our data, down-regulation of MYC signaling had been correlated with antiangiogenic activity of endogenous and synthetic antiangiogenic drugs (11, 13, 17, 18). Moreover, MYC signaling seems to play a pivotal role in the switch to the angiogenic phenotype (13, 19, 20). Very recently, interleukin-1β has been identified as the principal effector downstream of MYC responsible for triggering the rapid onset of angiogenesis in tumors (20). We also found a down-regulation of interleukin-1β after MPA treatment in endothelium (Figs. 2C and 3B). Further, we found a dose-dependent up-regulation of NDRG1, a key negatively regulated MYC downstream gene. This suggested antiangiogenic role for NDRG1 is in agreement with reported data from tumor stroma of pancreatic ductal adenocarcinoma (21). In addition, NDRG1 is also known as a metastasis suppressor gene and is considered to be involved in cellular differentiation (21, 22). Thus, the here identified regulation of MYC-NDRG1 axis by MPA provides a plausible link for the MPA-induced antimetastatic and differentiation effects. The important role of MYC signaling and its high degree of connectivity were further elucidated by its intense interaction with other identified hub nodes. For example, it is known that in tumors MYC and YY1 cooperate in tandem to down-regulate cell adhesion molecules (23). Further, it has been shown that independent of extracellular signals MYC induces the activity of PKA by increasing the transcription of its catalytic subunit β (PRKACB; ref. 24). Overexpression of PKA is correlated with worse clinicopathologic features in several tumor types. Therefore, PKA is considered a promising target for therapeutic cancer interventions (25). Indeed, combined inhibition of PKA with epidermal growth factor receptor and cyclooxygenase-2 inhibitors caused a dramatic cooperative antitumor and antiangiogenic effect (25). PKA seems also to be involved in endothelial cell integrin signaling (26). Together, these data support the view that the MPA-induced down-regulation of PRKACB contributes to its antiangiogenic and anticancer activity.
Other hub nodes in the MPA antiangiogenic network, which are down-regulated by MPA, are CDC2 (CDK1), GSK3B, and YY1. CDC2 inhibition has been shown to cause cell cycle arrest and apoptosis (27). Likewise, CDC2 was found to regulate endothelial cell proliferation required for tumor angiogenesis by phosphorylation of the RUNX2 transcription factor (28). CDC2 activity also affects survival checkpoint responses after exposure to DNA-damaging and microtubule-stabilizing agents (27). GSK3B has been shown to enhance survival and migration of vascular endothelial cells and thus promote angiogenesis and antiapoptotic signaling (29). Interestingly, the PKC inhibitor Enzastaurin is thought to elicit its antitumor and antiangiogenic effects by suppressing AKT/GSK3B survival signaling (30). YY1 overexpression is associated with unchecked cellular proliferation, resistance to apoptotic stimuli, tumorigenesis, and metastatic potential. Further, recent findings implicate YY1 in the regulation of tumor cell resistance to chemotherapeutics and immune-mediated apoptotic stimuli (31). These data underline the multifaceted nature of MPA response and suggest that MPA can favorably be combined with conventional cancer therapies such as radiation or chemotherapy.
Another interesting finding here is the MPA-mediated down-regulation of HDAC2. Increased HDAC2 expression is found in human colon cancer and endometrial stromal sarcoma (31, 32). Therefore, pharmacologic inhibition of the epigenetic modulator HDAC2 is considered to be a potential therapeutic strategy to treat cancer (31, 32). Our data on MPA-induced HDAC2 inhibition thus link MPA with potential epigenetic regulations.
The proangiogenic HIF1A is another important hub node of the antiangiogenic network of MPA. The assumption that depriving tumors of oxygen could lead to compensatory mechanisms, which ultimately enhance the development of more aggressive tumors, was believed to become the Achilles' heel of antiangiogenic therapy. However, it has been shown that certain endogenous and targeted angiogenesis inhibitors might down-regulate HIF1A signaling and thus counteract the compensatory pathways that tumors could use in response to antiangiogenesis-induced hypoxia (11, 13, 17, 33). In alignment with these data, we show that MPA down-regulates HIF1A, indicating that angiogenesis inhibitors can do more than simply deprive a tumor of oxygen.
Among the key functional processes (gene ontology terms) that we found affected by MPA, some are related to MPA-induced inhibition of nucleotide synthesis such as cell cycle or DNA/RNA metabolic processes. Of note is, however, the significant enrichment of genes involved in cytoskeleton organization and biogenesis as well as matrix remodeling after MPA treatment (Fig. 2). Our data on MPA-induced down-regulation of matrix remodeling genes (e.g., MMP3, ADAM12, and PAI1) and extracellular matrix proteins (e.g., fibronection and Tenascin) together with the up-regulation of thrombospondin 2, a key endogenous antiangiogenic and “matricellular” protein, support the idea that MPA exerts antifibrotic activity in the tumor microenvironment.
The integration of comparative transcriptomics data into a system level pathway-driven approach could serve as a useful strategy to dissect the molecular mechanism of action of angiogenic and antiangiogenic compounds (11, 13). Applying this approach to MPA, we identified genetic participants of cell type–independent and cell type–specific responses to MPA. Together, we found that MPA exerts its antiangiogenic activity by down-regulating a regulatory network that consists of high- and low-degree nodes reminiscent of a scale-free network. This finding is in alignment with reports indicating that the angiogenesis process may be organized in gene regulatory circuitries, which can be dynamically turned off and on by proangiogenic and antiangiogenic agents (11, 13). Although scale-free networks are robust against random attacks, they are more vulnerable against targeted removal of their “hub nodes.” Accordingly, we show that targeted removal of one of the highly connected “hub nodes” of MPA, MYC, clearly inhibited endothelial cell proliferation resembling the MPA effect. Thus, the identified hub nodes may represent exploitable targets for the development of novel antiangiogenics. The molecular characterization of the antiangiogenic and antifibrotic effects of MPA merit further preclinical and clinical investigations. Further, our strategy may offer a template for identifying and classifying other agents with potentially antiangiogenic and antifibrotic properties.
Disclosure of Potential Conflicts of Interest
No potential conflicts of interests were disclosed.
Grant support: Deutsche Krebshilfe 106997 (U. Wirkner, P.E. Huber, and A. Abdollahi), DFG National Priority Research Program the Tumor-Vessel Interface SPP1190 (S. Muschal, C. Schwager, P.E. Huber, and A. Abdollahi), National Aeronautics and Space Administration Specialized Center of Research NNJ04HJ12G (P.E. Huber and A. Abdollahi), Tumorzentrum Heidelberg-Mannheim, and Medical Faculty of University of Heidelberg Medical School (A. Abdollahi and P.E. Huber).
The costs of publication of this article were defrayed in part by the payment of page charges. This article must therefore be hereby marked advertisement in accordance with 18 U.S.C. Section 1734 solely to indicate this fact.
Acknowledgments
We thank Thomas Regiert, Nadine Weiss, Thuy Trinh, Christiane Rutenberg, Sebastian Schwager, and Christine Schmitt for indispensable helps with various tasks.