


Abstract
Nonsteroidal anti-inflammatory drugs such as sulindac sulfide have shown promising antineoplastic activity in multiple tumor types, but toxicities resulting from COX inhibition limit their use in cancer therapy. We recently described a N,N-dimethylethyl amine derivative of sulindac sulfide, sulindac sulfide amide (SSA), that does not inhibit COX-1 or -2, yet displays potent tumor cell growth–inhibitory activity. Here, we studied the basis for the growth-inhibitory effects of SSA on human lung adenocarcinoma cell lines. SSA potently inhibited the growth of lung tumor cells with IC50 values of 2 to 5 μmol/L compared with 44 to 52 μmol/L for sulindac sulfide. SSA also suppressed DNA synthesis and caused a G0–G1 cell-cycle arrest. SSA-induced cell death was associated with characteristics of autophagy, but significant caspase activation or PARP cleavage was not observed after treatment at its IC50 value. siRNA knockdown of Atg7 attenuated SSA-induced autophagy and cell death, whereas pan-caspase inhibitor ZVAD was not able to rescue viability. SSA treatment also inhibited Akt/mTOR signaling and the expression of downstream proteins that are regulated by this pathway. Overexpression of a constitutively active form of Akt was able to reduce autophagy markers and confer resistance to SSA-induced cell death. Our findings provide evidence that SSA inhibits lung tumor cell growth by a mechanism involving autophagy induction through the suppression of Akt/mTOR signaling. This unique mechanism of action, along with its increased potency and lack of COX inhibition, supports the development of SSA or related analogs for the prevention and/or treatment of lung cancer. Mol Cancer Ther; 12(5); 663–74. ©2013 AACR.
Introduction
Lung cancer is the leading cause of cancer death in patients older than 40 years, accounting for 226,160 new cancers and 160,340 deaths annually in the United States (1). Lung cancer is usually aggressive and characterized by early progression and metastases, as approximately 60% of patients with small cell lung cancer (SCLC) and up to 40% of patients with non–small cell lung cancer (NSCLC) will present with stage IV disease at the time of diagnosis. The 5-year survival rate for patients with lung cancer is only 15.9%, with most dying from metastasis (2). Early detection of lung cancer can improve outcome as evident from the National Lung Screening Trial (NLST, ACRIN A6654) that showed mortality can be reduced by 20% from screening high-risk patients with low-dose helical computed tomography compared with chest X-ray (3). Similarly, data from the International Early Lung Cancer Action Program (I-ELCAP) showed that stage I lung cancer detected by annual low-dose computed tomography scans improved survival with early treatment (4). With the potential for early detection of lung cancer in high-risk populations, it is important to develop effective new therapeutic strategies.
Epidemiological studies indicate that long-term use of nonsteroidal anti-inflammatory drugs (NSAID) is associated with a significant decrease in cancer incidence and delayed progression in patients with colorectal, breast, lung, and other cancers (5, 6). The use of NSAIDs is also associated with reduced risk from cancer-related mortality and distant metastasis (7–9). With regard to lung cancer, NSAIDs have been shown to reduce the incidence of lung carcinoma by 21%. The reduction in risk is increased to 32% when adjusted for smoking, and the efficacy is greatest in former smokers with a risk reduction of as much as 42% (10). Rodent studies support these observations by showing that NSAIDs inhibit tumor formation in carcinogen-induced models of lung tumorigenesis (11–13). Unfortunately, the long-term use of NSAIDs and COX-2 inhibitors is not recommended because of potentially fatal gastrointestinal, renal, and cardiovascular toxicities associated with the depletion of physiologically important prostaglandins resulting from their COX-1 and -2 inhibitory activity (14, 15).
Because smoking contributes to chronic pulmonary inflammation, it is logical that NSAIDs may inhibit lung cancer development through suppressing inflammatory mediators such as prostaglandins. However, some investigators have implicated alternative mechanisms by which NSAIDs may exert their antineoplastic activity, suggesting that it may be feasible to develop derivatives that do not inhibit COX-1 or -2 and have reduced toxicity (16–19). As support for a COX-independent mechanism, the sulfone metabolite of sulindac, which does not inhibit COX-1 and -2, has been reported to inhibit tumorigenesis in colon, mammary, lung, and bladder models (20–22). In a mouse model of tobacco carcinogen–induced lung tumorigenesis, sulindac sulfone strongly inhibited both tumor incidence and multiplicity (13). Sulindac sulfone also inhibited tumor growth and metastasis that led to increased survival of rats with orthotopically implanted human lung tumors alone or in combination with docetaxel (23–25). Although sulindac sulfone did not receive U.S. Food and Drug Administration approval for human use because of hepatotoxicity, these studies support the development of other non–COX-inhibitory derivatives of sulindac.
We recently described a N,N-dimethylethyl amine derivative of sulindac sulfide referred to as sulindac sulfide amide (SSA) that does not inhibit COX-1 or -2, yet inhibits colon tumor cell growth in vitro and in vivo (26). Because of the strong efficacy of sulindac sulfone in lung cancer models, we conducted additional studies with SSA in human lung cancer cell lines to determine their level of sensitivity and to investigate the underlying mechanism of action. Here, we describe a novel component of SSA-induced cytotoxicity that involves autophagy induction via suppression of Akt/mTOR signaling.
Materials and Methods
Drugs and reagents
SSA was synthesized and characterized as described previously (26). Lipofectamine LTX and PLUS transfection reagents were purchased from Invitrogen. LC3 antibody was purchased from Novus Biologicals. Akt1/2/3 (pan-Akt) antibody was from Santa Cruz Biotechnology, MDM2 antibody was from EMD Biosciences and p62 antibody was from Abgent. All other antibodies were purchased from Cell Signaling Technology. pEGFP-LC3 and ptfLC3 plasmids were provided by Dr. John Shacka (University of Alabama at Birmingham, Birmingham, AL). Constitutively active Akt (Myr-Akt1, Addgene plasmid 9008) and empty vector (pcDNA3, Addgene plasmid 10792) plasmids were purchased from Addgene. Z-VAD-FMK was purchased from EMD Chemicals. All other drugs and reagents were purchased from Sigma-Aldrich unless otherwise stated. All compounds were dissolved in dimethyl sulfoxide (DMSO), and the maximum final concentration of DMSO was 0.1% in all experiments.
Cell culture
The human lung adenocarcinoma cell lines A549, H1299, and HOP-62 were obtained from the American Type Culture Collection (ATCC) and grown under standard cell culture conditions in RPMI-1640 containing 5% FBS at 37°C in a humidified atmosphere with 5% CO2. All ATCC cell lines were expanded upon delivery, and numerous vials of low-passage cells were preserved in liquid N2. No vial of cells was passaged for more than 2 months. Cell line characterization is conducted by ATCC through STR profiling and reauthentication was not conducted.
Cell viability assay
Tissue culture microtiter 96-well plates were seeded at a density of 5,000 cells per well and incubated for 18 to 24 hours before being treated with the specified compound or vehicle control. The inhibition of cell growth caused by treatment was determined as described previously (27).
Apoptosis assays
Cell death was quantified by using the Annexin V Alexa Fluor 488 & Propidium Iodide (PI) Dead Cell Apoptosis kit from Invitrogen. In brief, 2 × 10⁵ to 3 × 10⁵ cells were exposed to SSA or vehicle control in 6-well plates and incubated for 24 hours before analysis. The cells were then harvested and analyzed with a Becton Dickinson FACSCalibur instrument (excitation, 488 nm; emission, 530 nm) according to manufacturer's instructions. The cells that were positive for Annexin V alone, and Annexin V and PI were counted. Activity of caspase-3 and -7 was measured using the Caspase-Glo 3/7 Assay (Promega) as previously described (27). PARP cleavage was measured by Western blotting.
Cell proliferation assay
Cell proliferation was determined by using the Click-iT EdU Alexa Fluor 488 Proliferation Assay (Invitrogen). Cells were seeded at a density of 1 × 10⁶ cells per 10-cm tissue culture dish and incubated with SSA, sulindac sulfide, or vehicle control. Six hours after initial dosing, 5-ethynyl-2′-deoxyuridine (EdU, 10 μmol/L) was added into the cell culture media and cells were incubated for an additional 18 hours. Cells were harvested and analyzed according to the manufacturer's instructions. The percentage of proliferating cells was quantified by using a Becton Dickinson FACSCalibur instrument.
Cell-cycle measurements
Cells (2 × 10⁵ to 3 × 10⁵) were exposed to SSA, sulindac sulfide, or vehicle control in 6-well plates and incubated for 24 hours before analysis. The cells were trypsinized, washed with PBS, and fixed in 1 mL of 70% ethanol at 4°C overnight, followed by incubation with RNase (1 mg/mL) and staining with PI (40 μg/mL). DNA content was determined by flow cytometry using a Becton Dickinson FACSCalibur instrument.
Visualization of intracellular vacuoles
Acidic compartments were visualized by labeling the cells with Lyso-ID Green detection reagent (Enzo) according to the manufacturer's instructions. Nuclei were counterstained with DRAQ5. Images were obtained using an Evotec Opera confocal microscope with a ×20 objective lens. For histologic analysis, cells were harvested by CellStripper (CellGro), resuspended in PBS and smeared on microscope slides. Cells were then immediately fixed in 10% neutral-buffered formalin before being stained with hematoxylin and eosin.
Transmission electron microscopy
Cells were seeded at a density of 1 × 10⁶ cells per 10-cm cell culture dish and treated with SSA or vehicle control for 24 hours. Cells were harvested using CellStripper (CellGro), washed once in PBS, and then fixed with 2% glutaraldehyde in 0.2 mol/L HEPES, pH 7.4, at room temperature for 2 hours. Additional sample processing and transmission electron microscopy (TEM) were conducted as described previously by Shacka and colleagues (28).
Transfections
All plasmid transfections were conducted in OptiMEM reduced-serum medium (Invitrogen) containing 0.3% Lipofectamine LTX transfection reagent, 0.1% PLUS reagent, and 1 μg/mL DNA. Cells were incubated for 24 hours before treatment. For RNA interference experiments, A549 cells (75% confluent) were transfected by using the Amaxa Nucleofector II device protocol (Lonza). Briefly, 1 × 10⁶ cells were pelleted and resuspended in 100 μL of Nucleofactor reagent followed by addition of either control or ATG7 siRNA (200 nmol/L). Transfer of the reaction mixture was completed by electroporation in the Amaxa Nucleofector II Device. X-001 Nucleofector program was used. After transfection, cells were transferred to culture plates for 18 hours before experiments were set up. siRNAs corresponding to the human cDNA sequence for ATG7 and the nonsilencing negative control siRNA were from Dharmacon Research.
Autophagic imaging and flux assays
Cells seeded on coverslips at 50% confluency were transiently transfected with either the eGFP-LC3 or the tfLC3 plasmid. Twenty-four hours after transfection, cell culture media were replaced with fresh and cells were treated with 5 μmol/L SSA or vehicle control. After 24 hours of treatment, cells were fixed in 10% neutral-buffered formalin for 10 minutes, then rinsed with Tris buffer, and counterstained with 4′,6-diamidino-2-phenylindole (DAPI). Slides were mounted using Fluoromount (Sigma). Imaging was conducted on a Zeiss Axio Imager.M2 fluorescence microscope connected to a Zeiss AxioCam MRm camera. Autophagy induction was quantified by counting the number of cells with eGFP-LC3 translocation into dots (a minimum of 700 cells/sample) after treatment. Image processing was conducted by using the NIH ImageJ software.
Western blot analysis
Immunoblotting was conducted as described previously (27). For p-mTOR, a 5% PAGE was used to achieve proper separation.
Experimental design and data analysis
Drug effects on cell growth and IC50 values were determined as described previously (27). All experiments were repeated a minimum of 3 times to determine the reproducibility of the results. All values represent a comparison between drug treatment at the specified concentration and vehicle-treated controls. All error bars represent SEM. Statistical analysis was conducted using Student t test with P < 0.05 deemed as statistically significant.
Results
In vitro tumor cell growth–inhibitory activity of SSA
Previous molecular modeling studies revealed the importance of the carboxylic acid group on sulindac sulfide for inhibition of COX-1 and -2 (26). As depicted in Fig. 1A, SSA was designed by substituting the carboxylic acid on sulindac sulfide for a N,N-dimethylethyl amine moiety to block COX binding. Despite lacking COX inhibitory activity, SSA was found to potently inhibit the growth of human lung adenocarcinoma cell lines, A549, H1299, and HOP-62 with IC50 values ranging from 2 to 5 μmol/L (Fig. 1B). By comparison, the nonselective COX-1/2 inhibitor, sulindac sulfide, was approximately 10 to 20 times less potent with IC50 values ranging from 44 to 52 μmol/L. Next, we examined whether the growth-inhibitory effects of SSA involved apoptosis induction and/or inhibition of proliferation. To assess the induction of apoptosis, cells were treated with SSA for 24 hours and the activation of effector caspase-3 and -7, which are specific biochemical markers of apoptotic cell death, was measured. As shown in Fig. 1C, SSA treatment was not able to induce significant caspase activation at its IC50 value in either cell type. However, caspase activation by SSA was dose-dependent, and higher concentrations were able to lead to significant levels of apoptosis compared with vehicle control. This activation, nonetheless, was low compared with that induced by sulindac sulfide and the apoptosis-inducing agent staurosporine. We also assessed PARP cleavage, which occurs downstream of caspase activation, as an additional specific marker of apoptosis by Western blotting. We were able to detect cleaved PARP after 10 μmol/L SSA treatment but not after 5 μmol/L treatment (Fig. 1D). A dose-dependent increase in PARP cleavage was also observed after sulindac sulfide treatment. As an additional marker of cell death, we measured Annexin-V and PI labeling after SSA treatment by flow cytometry. Interestingly, we observed a significant and dose-dependent increase in the extent of Annexin-V surface staining and PI labeling in all cell lines after 24 hours of SSA treatment at concentrations that suppressed growth and lower than those required for caspase activation (Fig. 1E). SSA was also able to significantly and dose dependently inhibit DNA synthesis in lung tumor cells as measured by EdU incorporation (Fig. 1F). Furthermore, SSA treatment led to a dose-dependent increase in the percentage of cells in the G0–G1 phase of the cell cycle at concentrations that suppressed growth (Fig. 1G). Significant inhibition of DNA synthesis and G0–G1 cell-cycle arrest were also observed after single-dose sulindac sulfide treatment at 100 μmol/L. These results indicate that the growth-inhibitory activity of SSA is associated with inhibition of proliferation but not apoptosis after treatment at its IC50 value, suggesting the involvement of alternative mechanisms of cell death.

Inhibition of growth, induction of apoptosis, and inhibition of cell proliferation in lung adenocarcinoma cells by SSA. A, structures of sulindac sulfide (SS) and SSA. B, dose-dependent growth-inhibitory activity of SS and SSA in A549, H1299, and HOP-62 cells after 72 hours of treatment. C, apoptosis induction as measured by caspase-3 and -7 activation. D, PARP cleavage after 24 hours of treatment with SSA and SS (100 μmol/L; +, 1 μmol/L staurosporine). E, Annexin V/PI labeling after 24 hours of SSA treatment. F, dose-dependent inhibition of DNA synthesis as measured by EdU incorporation. G, induction of G0–G1 cell-cycle arrest in A549, H1299, and HOP-62 cells after 24 hours of treatment with SSA or SS (100 μmol/L).
Inhibition of growth, induction of apoptosis, and inhibition of cell proliferation in lung adenocarcinoma cells by SSA. A, structures of sulindac sulfide (SS) and SSA. B, dose-dependent growth-inhibitory activity of SS and SSA in A549, H1299, and HOP-62 cells after 72 hours of treatment. C, apoptosis induction as measured by caspase-3 and -7 activation. D, PARP cleavage after 24 hours of treatment with SSA and SS (100 μmol/L; +, 1 μmol/L staurosporine). E, Annexin V/PI labeling after 24 hours of SSA treatment. F, dose-dependent inhibition of DNA synthesis as measured by EdU incorporation. G, induction of G0–G1 cell-cycle arrest in A549, H1299, and HOP-62 cells after 24 hours of treatment with SSA or SS (100 μmol/L).
SSA induces autophagy in lung adenocarcinoma cells
SSA-treated cells displayed a striking accumulation of vesicle-like structures within the cytoplasm that was readily apparent by phase-contrast microscopy (Fig. 2A, left). As shown by hematoxylin and eosin staining (Fig. 2A, middle), SSA treatment resulted in extensive intracellular vacuolization characterized by multiple small vesicles (arrowheads) and large vacuoles (arrow) typically observed in cells undergoing autophagy. To determine whether SSA induced an autophagic response in lung cancer cells, we used the Lyso-ID dye, which labels acidic compartments within the cytoplasm including autophagosomes. SSA treatment (5 μmol/L, 24 hours) of A549 cells increased both the number and size of acidic vesicles within the cytoplasm compared with vehicle treatment (Fig. 2A, right). To confirm that the acidic vesicles represented autophagosomes, A549 cells were transfected with a plasmid that expresses GFP-tagged microtubule-associated protein 1 light-chain 3 (LC3), a cytoplasmic protein, which, at the onset of autophagy, is cleaved, lipidated, and incorporated into the membranes of autophagosomes (29). GFP-LC3 can be used to visualize and quantify autophagosomes, which appear as punctate dots within the cytoplasm. After SSA treatment (5 μmol/L, 24 hours), the number of LC3-positive vesicles was significantly increased compared with vehicle control in both A549 and H1299 cells, confirming that SSA-treated cells were undergoing autophagy (Figs. 2B and 2D). SSA treatment also induced dose- and time-dependent cleavage of cytosolic LC3-I to autophagosome-associated LC3-II (Fig. 2C). The concentrations required to induce autophagy were comparable to the concentrations required for the inhibition of growth and proliferation, suggesting that autophagic vacuole accumulation may contribute to the tumor cell growth–inhibitory activity of SSA.

SSA induces autophagy in lung adenocarcinoma cells. A, phase-contrast images (left) and acidic vesicle-specific dye labeling (right) of A549 cells treated with vehicle or 5 μmol/L SSA for 24 hours. Hematoxylin and eosin staining of floating cells after 10 μmol/L SSA treatment for 24 hours (middle). Arrows indicate intracellular vesicles. B, eGFP-LC3 imaging of A549 and H1299 cells after vehicle or 5 μmol/L SSA treatment for 24 hours. Autophagic vacuoles are identified as punctuate dots within the cytoplasm. Scale bars, 10 μm. C, dose- and time-dependent induction of autophagy in A549 and H1299 cells as indicated by LC3-I to LC3-II conversion. Cells were treated either with the indicated concentrations of SSA for 24 hours or with 5 μmol/L SSA for the indicated time periods and subjected to Western blotting. Glyceraldehyde-3-phosphate dehydrogenase (GAPDH) was used as loading control. Results shown are representative of 2 independent experiments. D, quantification of eGFP-LC3–positive puncta in A549 and H1299 cells after 24 hours of SSA treatment. E, representative electron micrographs of A549 cells treated with vehicle or 7.5 μmol/L SSA for 24 hours. Nuclei are labeled N. Arrows indicate autophagic vacuoles. Scale bars, 2 μm. F, magnified image shows detailed autophagic vacuoles structure and residual digested cellular material within their lumen. Scale bars, 500 nm. G, representative electron micrographs of A549 cells at different stages of autophagy after 7.5 μmol/L SSA treatment for 24 hours. Images show progressive autophagic degradation (clockwise) and an absence of morphological features of apoptosis. Scale bars, 2 μm.
SSA induces autophagy in lung adenocarcinoma cells. A, phase-contrast images (left) and acidic vesicle-specific dye labeling (right) of A549 cells treated with vehicle or 5 μmol/L SSA for 24 hours. Hematoxylin and eosin staining of floating cells after 10 μmol/L SSA treatment for 24 hours (middle). Arrows indicate intracellular vesicles. B, eGFP-LC3 imaging of A549 and H1299 cells after vehicle or 5 μmol/L SSA treatment for 24 hours. Autophagic vacuoles are identified as punctuate dots within the cytoplasm. Scale bars, 10 μm. C, dose- and time-dependent induction of autophagy in A549 and H1299 cells as indicated by LC3-I to LC3-II conversion. Cells were treated either with the indicated concentrations of SSA for 24 hours or with 5 μmol/L SSA for the indicated time periods and subjected to Western blotting. Glyceraldehyde-3-phosphate dehydrogenase (GAPDH) was used as loading control. Results shown are representative of 2 independent experiments. D, quantification of eGFP-LC3–positive puncta in A549 and H1299 cells after 24 hours of SSA treatment. E, representative electron micrographs of A549 cells treated with vehicle or 7.5 μmol/L SSA for 24 hours. Nuclei are labeled N. Arrows indicate autophagic vacuoles. Scale bars, 2 μm. F, magnified image shows detailed autophagic vacuoles structure and residual digested cellular material within their lumen. Scale bars, 500 nm. G, representative electron micrographs of A549 cells at different stages of autophagy after 7.5 μmol/L SSA treatment for 24 hours. Images show progressive autophagic degradation (clockwise) and an absence of morphological features of apoptosis. Scale bars, 2 μm.
To determine whether autophagy is contributing to SSA-induced cytotoxicity, the morphologic changes induced by SSA treatment in A549 cells were examined using electron microscopy. Cells treated with SSA (7.5 μmol/L, 24 hours) displayed extensive intracellular vacuolization with multiple vesicles, distorted nuclei, and a reduced number of mitochondria (Fig. 2E). Consistent with autophagy, multiple small autophagosomes distinguished by their characteristic double-membranes could be identified (arrowheads), as well as large single-membraned vacuoles (arrows) containing electron-dense deposits, indicating mature autophagosomes. Higher magnification images clearly show that these autophagic vacuoles contained degrading organelles (Fig. 2F). Similar ultrastructural features were also observed in H1299 cells treated with SSA (data not shown).
Figure 2G shows additional TEM images that capture the progression of autophagic degradation in A549 cells from early to advanced stages (clockwise). These images show a dynamic process from the induction stage with multiple smaller vesicles (top left), to the engulfment of organelles (arrowheads), docking and fusion of mature autophagosomes (arrows) to large autophagolysosomes, and finally the complete degradation of cytoplasmic material (bottom left). Remarkably, even at the most advanced stages, this intense vacuolization was not paralleled by classical signs of apoptosis such as nuclear fragmentation, cell shrinkage, or chromatin condensation. These results indicate that SSA is able to induce a distinct type of cell death involving autophagy with an absence of morphologic features of apoptosis. Furthermore, the Annexin V labeling results are consistent with previous reports indicating that phosphatidylserine exposure on the cell surface may be a common feature of apoptotic and autophagy-associated cell death (30, 31).
SSA increases autophagic flux
The accumulation of autophagic vacuoles in response to SSA treatment could result from either an increase in the synthesis of autophagosomes or from a blockage of lysosomal fusion and degradation. Elevated autophagic flux, whereby there is both active synthesis and degradation of autophagasomes, has to be shown in cells undergoing autophagy-mediated cell death (32). To distinguish these effects, A549 cells were incubated with SSA and bafilomycin A1, a specific inhibitor of vacuolar type H+-ATPase that blocks the last step of autophagic degradation (33). As shown in Fig. 3A, LC3-II levels were higher in cells treated with the combination of drugs compared with cells treated with SSA only, indicating that SSA induces the synthesis of autophagosomes instead of blocking degradation. The 20 nmol/L dose of bafilomycin A1 was included to show that complete blockage of lysosomal fusion was achieved at the 10 nmol/L concentration used for the combination treatment, and higher concentrations were unable to induce further autophagic vacuoles accumulation. Disappearance of the ubiquitin-binding factor p62 (SQSTM1), which targets polyubiquitinated proteins to autophagosomes for degradation, can also be used as a marker of increased autophagic turnover (34). Western blotting showed a time-dependent decrease of p62 after SSA treatment indicating that autophagic flux is increased (Fig. 3B).

SSA increases autophagic flux. A, LC3-II accumulation in A549 cells treated with 5 μmol/L SSA with or without 10 nmol/L bafilomycin A1 (Baf.A1). Cells were pretreated with Baf.A1 for 1 hour and then incubated with SSA for an additional 4 hours. LC3-II levels reached a ceiling effect at 10 nmol/L and higher concentrations (20 nmol/L) did not further increase LC3-II levels. B, time-dependent p62 downregulation after 5 μmol/L SSA treatment in A549 cells. C, effects of SSA on autophagic flux were measured using the ptfLC3 plasmid that simultaneously expresses mRFP- and GFP-tagged LC3 protein. A549 cells were treated with vehicle or 5 μmol/L SSA for 24 hours. Early autophagosomes show GFP-mRFP colocalization whereas late, acidic autophagosomes (arrows) lose GFP and appear red. Scale bars, 10 μm.
SSA increases autophagic flux. A, LC3-II accumulation in A549 cells treated with 5 μmol/L SSA with or without 10 nmol/L bafilomycin A1 (Baf.A1). Cells were pretreated with Baf.A1 for 1 hour and then incubated with SSA for an additional 4 hours. LC3-II levels reached a ceiling effect at 10 nmol/L and higher concentrations (20 nmol/L) did not further increase LC3-II levels. B, time-dependent p62 downregulation after 5 μmol/L SSA treatment in A549 cells. C, effects of SSA on autophagic flux were measured using the ptfLC3 plasmid that simultaneously expresses mRFP- and GFP-tagged LC3 protein. A549 cells were treated with vehicle or 5 μmol/L SSA for 24 hours. Early autophagosomes show GFP-mRFP colocalization whereas late, acidic autophagosomes (arrows) lose GFP and appear red. Scale bars, 10 μm.
The tfLC3 imaging assay was used as an additional marker of increased autophagic flux (35, 36). Overexpression of the tfLC3 plasmid results in tandem expression of both mRFP-LC3 and GFP-LC3. When autophagosomes fuse with the lysosomes, GFP-LC3 fluorescence is quenched because of the acidic environment. However, a compromise in lysosomal function stabilizes GFP-LC3 fluorescence leading to GFP-LC3 and mRFP-LC3 colocalization. Accordingly, earlier autophagosomes would show colocalization of GFP and mRFP but have diminished GFP as they mature and become acidified. Images from cells treated with vehicle show one cell that has lost most of its GFP and a second cell that displays GFP-LC3 and mRFP-LC3 colocalization. While GFP-LC3 and mRFP-LC3–positive vesicles are apparent after SSA treatment (5 μmol/L, 24 hours), many others that have lost GFP (arrows) and can be viewed as fusing with the lysosomes are observed (Fig. 3C). These findings indicate that autophagosomes in SSA-treated cells are able to fuse with the lysosomes and that autophagic flux or turnover is increased.
Autophagy contributes to SSA-induced growth inhibition
The ability of SSA to induce autophagy in lung tumor cells led us to next investigate the precise role of autophagy in its anticancer activity. Cancer cells, including lung cancer cells, can undergo autophagy in response to various anticancer therapies. This autophagic response can serve as a survival mechanism for the cell, or conversely, in some cases, as a nonapoptotic mechanism of programmed cell death (37). To determine whether the autophagy seen in SSA-treated lung cancer cells is involved in cell death, we used siRNA to knockdown Atg7, an essential protein for the induction of autophagy (38). Atg7 siRNA was able to attenuate SSA-induced autophagy in A549 cells compared with scramble siRNA–transfected controls, as measured by Western blotting (Fig. 4A). Furthermore, knockdown of Atg7 resulted in a significant increase in cell viability after SSA treatment for 24 hours (Fig. 4B). To assess the role of apoptotic cell death in SSA-treated lung cancer cells, we used pan-caspase inhibitor Z-VAD-FMK (40 μmol/L) to block caspase activity in A549 and H1299 cells. Blocking caspase activation did not result in an increase in viability in either cell line after SSA treatment (Fig. 4C). In contrast, addition of Z-VAD-FMK was able to reduce cytotoxicity induced by sulindac sulfide and known apoptosis-inducing anticancer drug etoposide in both cell lines. These results suggest that the growth-inhibitory activity of SSA is predominantly mediated through autophagy and that cell death can occur independent of apoptosis.
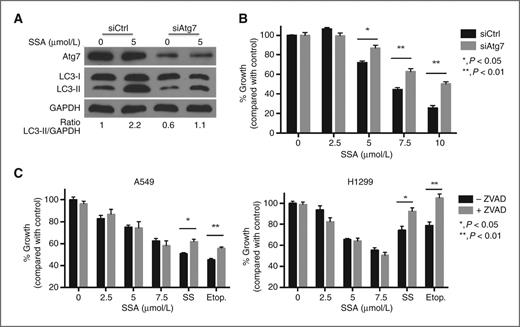
Autophagy mediates SSA-induced cancer cell death. A, modulation of SSA-induced autophagy by knockdown of Atg7. A549 cells were transfected with either Atg7 siRNA or a nonsilencing control siRNA for 24 hours and then treated with 5 μmol/L SSA for 4 hours. Levels of Atg7 and LC3-II were measured by Western blotting. B, knockdown of autophagy can attenuate SSA-induced cytotoxicity. A549 cells were transfected with either Atg7 or control siRNA for 24 hours and then treated with SSA for an additional 24 hours before measuring viability by CTG assay. C, inhibition of apoptosis does not lead to an increase in viability after SSA treatment. A549 and H1299 cells were pretreated with 40 μmol/L of pan-caspase inhibitor Z-VAD-FMK for 1 hour and then further incubated with different doses of SSA, SS (100 μmol/L), and etoposide (100 μmol/L).
Autophagy mediates SSA-induced cancer cell death. A, modulation of SSA-induced autophagy by knockdown of Atg7. A549 cells were transfected with either Atg7 siRNA or a nonsilencing control siRNA for 24 hours and then treated with 5 μmol/L SSA for 4 hours. Levels of Atg7 and LC3-II were measured by Western blotting. B, knockdown of autophagy can attenuate SSA-induced cytotoxicity. A549 cells were transfected with either Atg7 or control siRNA for 24 hours and then treated with SSA for an additional 24 hours before measuring viability by CTG assay. C, inhibition of apoptosis does not lead to an increase in viability after SSA treatment. A549 and H1299 cells were pretreated with 40 μmol/L of pan-caspase inhibitor Z-VAD-FMK for 1 hour and then further incubated with different doses of SSA, SS (100 μmol/L), and etoposide (100 μmol/L).
SSA modulates autophagy and loss of viability, in part, by inhibiting Akt/mTOR/p70S6k signaling
The Akt/mTOR pathway, a known regulator of autophagy and apoptosis, has been reported to be a target for sulindac sulfide (39, 40), as well as the selective COX-2 inhibitor celecoxib (41, 42). In addition, several chemotherapeutic agents have been shown to induce autophagy by inhibiting Akt and mTOR kinases (43). Therefore, we evaluated the effects of SSA treatment on the phosphorylation of these kinases. As shown in Fig. 5A, SSA inhibited the phosphorylation of Akt at the Ser 473 residue in a dose- and time-dependent manner without affecting total Akt levels in both A549 and H1299 cells. The inhibition of Akt phosphorylation became apparent starting at 4 hours and reached maximal levels between 8 and 16 hours of SSA treatment. In the same samples, we also probed for the effects of SSA on mTOR kinase activity by measuring ribosomal protein p70S6 kinase (p70S6k) phosphorylation, a well-known mTOR substrate that is preferentially phosphorylated by mTOR at the Thr389 residue (44). SSA was able to potently suppress p70S6 kinase phosphorylation at the Thr389 in both cell lines (Fig. 5A). The inhibitory effect was apparent after only 2 hours of treatment in A549 and H1299 cells, indicating a relatively rapid suppression of mTOR kinase activity. Similar effects on Akt/mTOR signaling were also observed in HOP-62 cells (data not shown). To determine whether the inhibition of Akt/mTOR signaling by SSA was involved in autophagy induction and growth inhibition, lung cancer cells were transfected with a plasmid expressing the myristoylated and constitutively active form of the Akt1 protein (Myr-Akt; ref. 45). Overexpression of activated Akt was able to prevent the decrease in phosphorylated Akt levels and partially block SSA-induced autophagy in A549 cells (Fig. 5B). We obtained similar results with H1299 cells (data not shown). Furthermore, the addition of Myr-Akt1 significantly inhibited SSA-induced cytotoxicity in both cell lines (Fig. 5C). These results suggest that the induction of autophagy and cell death by SSA is mediated through the Akt pathway. However, it needs to be noted that the blockage of autophagy and the rescue of viability are incomplete and additional mechanisms may be involved.

SSA modulates autophagy and cell death by inhibiting Akt/mTOR/p70S6k signaling. A, dose- and time-dependent downregulation of Akt and p70S6k phosphorylation after SSA treatment. Cells were treated either with the indicated concentration of SSA for 24 hours or with 5 μmol/L SSA for indicated time periods and subjected to Western blotting. Glyceraldehyde-3-phosphate dehydrogenase (GAPDH) was used as loading control. Images are representative of 2 separate experiments. B, inhibition of SSA-induced autophagy by the overexpression of a constitutively active form of Akt (Myr-Akt). Cells were transfected with an Akt overexpression (Myr-Akt) or empty vector (pcDNA3) plasmid for 24 hours and then treated with 5 μmol/L SSA for 4 hours. Levels of phosphorylated Akt, total Akt, and LC3-II were measured by Western blotting. C, inhibition of SSA-induced cell death by Akt ovexpression in A549 and H1299 cells. Cells were transfected with Myr-Akt or pcDNA3 plasmids for 24 hours and then treated with SSA for an additional 24 hours before measuring viability by CTG assay.
SSA modulates autophagy and cell death by inhibiting Akt/mTOR/p70S6k signaling. A, dose- and time-dependent downregulation of Akt and p70S6k phosphorylation after SSA treatment. Cells were treated either with the indicated concentration of SSA for 24 hours or with 5 μmol/L SSA for indicated time periods and subjected to Western blotting. Glyceraldehyde-3-phosphate dehydrogenase (GAPDH) was used as loading control. Images are representative of 2 separate experiments. B, inhibition of SSA-induced autophagy by the overexpression of a constitutively active form of Akt (Myr-Akt). Cells were transfected with an Akt overexpression (Myr-Akt) or empty vector (pcDNA3) plasmid for 24 hours and then treated with 5 μmol/L SSA for 4 hours. Levels of phosphorylated Akt, total Akt, and LC3-II were measured by Western blotting. C, inhibition of SSA-induced cell death by Akt ovexpression in A549 and H1299 cells. Cells were transfected with Myr-Akt or pcDNA3 plasmids for 24 hours and then treated with SSA for an additional 24 hours before measuring viability by CTG assay.
SSA is a more potent and effective inducer of autophagy than sulindac sulfide
We also evaluated sulindac sulfide for its ability to induce autophagy and inhibit Akt/mTOR signaling. Figure 6A shows that while SSA induced autophagy at concentrations equivalent to its IC50 value for growth inhibition (5 μmol/L), sulindac sulfide was unable to induce autophagy at its IC50 value of 50 μmol/L in A549 cells as determined by LC3-I to LC3-II conversion. However, sulindac sulfide caused LC3-II accumulation after 100 μmol/L treatment. These results indicate that induction of autophagy is a common feature among sulindac sulfide and SSA but that higher concentrations are needed in the case of sulindac sulfide, which exceed its IC50 value for growth inhibition.

SSA inhibits the Akt/mTOR pathway and induces autophagy more potently than parent compound sulindac sulfide. A, LC3-II levels after 50 and 100 μmol/L SS treatment in A549 cells. Cells were treated for 24 hours. SSA (5 μmol/L) was included as a control and for comparison. Autophagy activation can be seen after dosing cells with 100 μmol/L SS. B, effects of SSA and SS on additional mediators of autophagy signaling. A549 cells were treated at the indicated concentrations of SSA or 100 μmol/L SS for 24 hours. SSA was able to dose dependently inhibit Akt, mTOR, p70S6k, 4E-BP1, and MDM2 phosphorylation. SSA treatment induced AMPK phosphorylation while downregulating survivin levels. SS was able to mimic SSA effects, albeit with low potency.
SSA inhibits the Akt/mTOR pathway and induces autophagy more potently than parent compound sulindac sulfide. A, LC3-II levels after 50 and 100 μmol/L SS treatment in A549 cells. Cells were treated for 24 hours. SSA (5 μmol/L) was included as a control and for comparison. Autophagy activation can be seen after dosing cells with 100 μmol/L SS. B, effects of SSA and SS on additional mediators of autophagy signaling. A549 cells were treated at the indicated concentrations of SSA or 100 μmol/L SS for 24 hours. SSA was able to dose dependently inhibit Akt, mTOR, p70S6k, 4E-BP1, and MDM2 phosphorylation. SSA treatment induced AMPK phosphorylation while downregulating survivin levels. SS was able to mimic SSA effects, albeit with low potency.
As shown in Fig. 6B, 100 μmol/L sulindac sulfide treatment resulted in an inhibition of Akt phosphorylation comparable to 2.5 μmol/L SSA treatment. Phosphorylation of mTOR kinase as well as its effector p70S6k was also inhibited by sulindac sulfide treatment. Another well-known effector protein of mTOR kinase is the translation repressor protein 4EBP-1. SSA and sulindac sulfide were able to reduce the inactivating hyperphosphorylation of 4E-BP1 indicating that both compounds inhibit global protein translation, a feature of autophagy. A more detailed examination of other regulators of this pathway showed that phosphorylation of AMPK, which suppresses mTOR activity by activating the TSC1/2 complex (46) was induced upon SSA treatment. This induction in AMPK activity was closely mimicked by 100 μmol/L sulindac sulfide treatment.
In addition, SSA inhibited the phosphorylation of MDM2 oncoprotein at the Akt-specific Ser 166 residue, which increases its interaction with p300 allowing MDM2-mediated ubiquitination and degradation of p53 (47). However, the effect of sulindac sulfide on MDM2 phosphorylation was minimal at the 100 μmol/L concentration. Finally, levels of the anti-apoptotic and autophagy-inhibiting protein, survivin, were measured following SSA and sulindac sulfide treatment. We and others have reported that sulindac sulfide can suppress survivin levels leading to apoptosis and in some cases autophagic cell death (27, 48). We found that SSA and sulindac sulfide potently suppress survivin levels in A549 lung tumor cells. These results indicate that SSA is a potent inhibitor of Akt and mTOR effectors and suggest that these activities contribute to its antineoplastic activity.
Discussion
Preclinical, clinical, and epidemiologic studies have shown promising antineoplastic properties for a number of NSAIDs. Unfortunately, toxicity resulting from COX-1 and/or -2 inhibition limits their long-term use for cancer indications. However, several lines of evidence suggest that COX-independent mechanisms may contribute to or be fully responsible for their antineoplastic activity. Perhaps the most compelling evidence for this possibility comes from studies showing that the dose of a given NSAID to suppress tumor cell growth in vitro or in vivo far exceeds those required to inhibit COX-1 or -2 (49, 50). Moreover, NSAID analogs or metabolites that lack COX-inhibitory activity retain or have improved tumor cell growth–inhibitory activity (17, 26, 51). Our results with SSA suggest that it is feasible to chemically modify sulindac for developing safer and more efficacious drugs for lung cancer chemoprevention or therapy.
Despite lacking COX-inhibitory activity, SSA was able to inhibit lung tumor cell growth much more potently than sulindac sulfide. The increase in potency was appreciable with a shift from IC50 values of 44 to 52 μmol/L for sulindac sulfide to IC50 values of 2 to 5 μmol/L for SSA. Although further studies are necessary to determine whether SSA can inhibit lung tumor growth in suitable preclinical models and is sufficiently safe for human use, previous studies using a human colon xenograft mouse model showed in vivo antitumor efficacy at dosages that appeared to be well-tolerated (26).
Similar to previous results with sulindac sulfide, the tumor cell growth–inhibitory activity of SSA was associated with the inhibition of DNA synthesis and induction of cell-cycle arrest. The ability of sulindac sulfide to induce apoptosis has been shown in multiple cell types and is generally associated with the antineoplastic properties of sulindac and other NSAIDs (51–53). However, in contrast to sulindac sulfide, appreciably lower concentrations of SSA equivalent to its IC50 value for growth inhibition caused a distinct type of cell death in lung adenocarcinoma cells involving the surface exposure of phosphatidylserine, as evident by Annexin V labeling, but in the absence of significant caspase cleavage or the classical morphologic features of apoptosis such as nuclear fragmentation. Instead, SSA-induced cell death was characterized by extensive intracellular vacuolization and bulk degradation of cytoplasmic material with an apparently intact nucleus even at late stages. The intracellular vacuoles induced by SSA treatment were confirmed to be autophagic vacuoles due to their acidic nature, translocation of autophagosome-associated LC3-II protein into their membranes, and the presence of digested organelle material within their lumen as shown by TEM. Furthermore, we showed that the increase in autophagic markers was due to an increase in autophagic flux and not associated with the inhibition of lysosomal function. We explored the role of apoptosis and autophagic cell death by using specific caspase inhibitors and knockdown of autophagy through siRNA studies. Our results show that autophagy but not apoptosis participates in SSA-induced loss of cell viability at or around its IC50 value for growth inhibition. Although sulindac sulfide also induced autophagy, higher concentrations were required compared with concentrations required to suppress tumor cell growth.
On the basis of growing evidence suggesting that Akt/mTOR signaling can inhibit drug-induced autophagy, we explored the role of this pathway on SSA-induced autophagy and cell death. SSA was able to potently inhibit the Akt/mTOR/p70S6k pathway at or around its IC50 value for growth inhibition. We were able to show, through the use of a constitutively active Akt overexpression vector, that Akt signaling mediates SSA-induced autophagy and related cytotoxicity. We observed the inhibition of Akt/mTOR signaling after sulindac sulfide treatment as well, albeit at higher concentrations. These results suggest that SSA and sulindac sulfide may share a similar mechanism of action that impinges upon Akt/mTOR signaling. It is therefore plausible that the improved potency of SSA to inhibit Akt signaling may underlie its improved potency to induce autophagy and cell-cycle arrest and hence inhibit growth by dual mechanisms involving increased tumor cell death and the suppression of proliferation. In contrast, the predominant mechanism of cell death after sulindac sulfide treatment appears to be apoptosis.
The role of autophagy in tumor suppression is complex and likely involves several, sometimes paradoxical functions. Established tumors may use autophagy as an adaptive response against metabolic stress such as starvation, hypoxia, oxidative damage, or chemotherapy (54). In contrast, numerous researchers have shown using in vitro and in vivo models that in response to certain chemotherapeutic agents, autophagy can also mediate cell death as a genuine effector mechanism (55, 56). This has been dubbed autophagic cell death or programmed cell death type II. Alternatively, autophagy has been shown to act as an initial response mechanism for other agents, subsequently triggering apoptotic events (57). As autophagy and apoptosis share some common effectors (e.g., Akt, Bcl-2, mTOR), it has been proposed that the nature and intensity of the initial stimulus may determine which form of cell death will arise. In certain contexts of apoptosis resistance, for example, autophagy has been shown to mediate cell death in response to agents that would otherwise lead to apoptosis in naïve cells (58). This suggests that autophagy can function as a distinct cell death modality, which can be exploited for novel anticancer drug strategies to circumvent resistance.
The ability of SSA to induce autophagy has important implications for its development as a therapeutic agent for lung cancer, alone or in combination with standard chemotherapy. Our findings show that SSA can eliminate NSCLC cells through the induction of autophagy. We propose that this is a desirable property especially in the case of lung cancer chemotherapy because drugs commonly used in the clinic such as paclitaxel, gemcitabine, and EGF receptor (EGFR) inhibitors often lead to the development of apoptosis-resistant tumors (59). Recent studies have shown that apoptosis resistance can develop as a result of Akt or Bcl-2 upregulation and that these tumors can be chemosensitized by inducers of autophagy (60–62).
In summary, our findings support the potential of SSA as a novel agent for the prevention and/or treatment of lung cancer. We provide proof-of-concept evidence that the induction of autophagy through the Akt/mTOR pathway may represent a largely unexplored antineoplastic property that could be targeted to develop safer and more efficacious NSAID derivatives. Further studies are therefore warranted to determine the exact mechanism of action of SSA and to evaluate in vivo antitumor efficacy in suitable models of lung cancer. Identifying the specific molecular target(s) has implications not only for the development of SSA and analogs but also can be used to identify additional small molecules to develop more selective and potent clinical candidates.
Disclosure of Potential Conflicts of Interest
No potential conflicts of interest were disclosed.
Authors' Contributions
Conception and design: E. Gurpinar, W.E. Grizzle, J.J. Shacka, N.A. Piazza, A.B. Keeton, G.A. Piazza
Development of methodology: E. Gurpinar, W.E. Grizzle, B.J. Mader, N.A. Piazza, A.B. Keeton
Acquisition of data (provided animals, acquired and managed patients, provided facilities, etc.): E. Gurpinar, W.E. Grizzle, A.B. Keeton
Analysis and interpretation of data (e.g., statistical analysis, biostatistics, computational analysis): E. Gurpinar, W.E. Grizzle, A.B. Keeton
Writing, review, and/or revision of the manuscript: E. Gurpinar, W.E. Grizzle, J.J. Shacka, S. Russo, A.B. Keeton, G.A. Piazza
Administrative, technical, or material support (i.e., reporting or organizing data, constructing databases): E. Gurpinar, W.E. Grizzle, N. Li
Study supervision: W.E. Grizzle, J.J. Shacka, G.A. Piazza
Acknowledgments
The authors thank Drs. Robert Reynolds, Bini Mathew, and Kocharani Jacob from Southern Research for the synthesis of sulindac sulfide amide and UAB Flow Cytometry and High Resolution Imaging Core facilities for their excellent technical assistance.
Grant Support
This research was supported by NIH grants NCI 1R01CA131378 and 1R01CA148817-01A1 (G.A. Piazza).
The costs of publication of this article were defrayed in part by the payment of page charges. This article must therefore be hereby marked advertisement in accordance with 18 U.S.C. Section 1734 solely to indicate this fact.