


Abstract
In clinical practice, an elevated carbon monoxide (CO) transfer coefficient (KCO) and restrictive ventilatory defect are taken as features of respiratory muscle weakness (RMW). However, the authors hypothesised that both pattern and severity of RMW effect gas transfer and lung volumes.
Measurements of CO transfer and lung volumes were performed in patients with isolated diaphragm weakness (n=10), inspiratory muscle weakness (n=12), combined inspiratory and expiratory muscle weakness (n=5) and healthy controls (n=6).
Patients with diaphragm weakness and inspiratory muscle weakness had reduced total lung capacity (TLC) (83.6% predicted and 68.9% pred, respectively), functional residual capacity (FRC) (83.9% pred and 83.6% pred) and transfer factor of the lung for CO (TL,CO) (86.2% pred and 66.2% pred) with increased KCO (114.1% pred and 130.2% pred). Patients with combined inspiratory and expiratory muscle weakness had reduced TLC (80.9% pred) but increased FRC (109.9% pred) and RV (157.4% pred) with decreased TL,CO (58.0% pred) and KCO (85.5% pred).
In patients with diaphragm weakness, the increase in carbon monoxide transfer coefficient was similar to that of normal subjects when alveolar volume was reduced. However, the increase in carbon monoxide transfer coefficient in inspiratory muscle weakness was often less than expected, while in combined inspiratory and expiratory muscle weakness, the carbon monoxide transfer coefficient was normal/reduced despite further reductions in alveolar volume, which may indicate subtle abnormalities of the lung parenchyma or pulmonary vasculature. Thus, this study demonstrates the limitations of using carbon monoxide transfer coefficient in the diagnosis of respiratory muscle weakness, particularly if no account is taken of the alveolar volume at which the carbon monoxide transfer coefficient is made.
N. Hart was funded by the Dorothy Osbourne Legacy/Royal Brompton Hospital Trust Award and A.H. Nickol was funded by the British Lung Foundation.
Transfer factor of the lung for carbon monoxide (CO) (TL,CO) is the product of the CO transfer coefficient (KCO), which indicates the rate constant of CO uptake from the alveoli and the alveolar volume (VA) at which the measurement is made 1. Many studies, including the original study by Krogh 1, have shown that if CO transfer is measured at submaximal VA, the decline in TL,CO is partially offset by an increase in KCO. In clinical practice, CO uptake is measured at total lung capacity (TLC), but many disease states associated with a reduced TLC often have coexistent intrapulmonary disease and, as a consequence, have a reduction in KCO. However, when the cause of the reduced TLC is extrapulmonary, a distinctive pattern may be found in which KCO is increased at full inflation and VA is decreased, so that reductions in TL,CO are smaller than observed in intrapulmonary disease. The most obvious disorder simulating the effects of submaximal inflation is inspiratory muscle weakness without intrapulmonary disease. In an influential study of six patients 2, in which TLC was reduced due to severe isolated diaphragm weakness, a relatively benign disease in the absence of other cardiopulmonary disease 2, there was a reduction in mean TL,CO (65% predicted) but an increase in mean KCO (128% pred). As a result, in clinical practice, a raised KCO associated with a restrictive ventilatory defect is often taken as a feature of respiratory muscle weakness 3.
However, there have been no systematic studies that have examined CO transfer and lung volumes across a range of neuromuscular disorders causing different patterns of respiratory muscle weakness. The current authors hypothesised that since pattern and severity of respiratory muscle weakness can influence the pulmonary complications of neuromuscular diseases 2, 4, this would also affect CO transfer, subdivisions of lung volume and dynamic lung compliance (CL,dyn). To investigate this hypothesis, three groups of patients were studied: isolated unilateral and bilateral diaphragm weakness; generalised inspiratory muscle weakness; and combined inspiratory and expiratory muscle weakness. In addition, CO transfer at TLC and at submaximal lung volumes were measured in six normal subjects, by restricting inspiration and expiration during the manoeuvres to simulate the expected effects of acute combined inspiratory and expiratory muscle weakness in patients.
Methods
Patients
A total of 139 patients were referred to the authors' laboratory for respiratory muscle function assessment over a 28-month period. A standard protocol was followed for all patients 5.
Inclusion criteria
Patients were included if the right and/or left twitch transdiaphragmatic pressure (Pdi,tw) was <3.5 cmH2O (see below for methods). Such patients were further subclassified into isolated unilateral and bilateral diaphragm weakness with: preserved global respiratory muscle strength (maximal sniff oesophageal pressure (Poes,sniff) >50 cmH2O and maximal cough gastric pressure (Pgas,cough) >70 cmH2O); inspiratory muscle weakness with preserved expiratory muscle strength (Poes,sniff <50 cmH2O and Pgas,cough >70 cmH2O); and combined inspiratory and expiratory muscle weakness with inspiratory and expiratory muscle weakness (Poes,sniff <50 cmH2O and Pgas,cough <70 cmH2O).
Exclusion criteria
The authors excluded patients with a current smoking history, a maximum expiratory flow/volume curve indicative of airways disease, a forced expiratory volume in one second (FEV1)/forced vital capacity (FVC) ratio of <0.7, symptoms or signs of cardiac disease or failure, parenchymal lung disease identified on clinical grounds or chest radiography, and patients unable to perform full lung function testing.
Pulmonary function tests
Pulmonary function assessment included FEV1, FVC, TLC, functional residual capacity (FRC) and residual volume (RV) by body plethysmography. TL,CO and KCO were measured by the single-breath method 6 at full inflation (TLC) in the patients and at TLC and submaximal volumes in the normal subjects. TL,CO and KCO were corrected for haemoglobin concentration 7. Spirometry, lung volume and TL,CO predicted values were taken from the European Coal and Steel Community 8. The KCO regression equations used for males and females were (−0.013×age)+2.20 and (−0.007×age)+2.07, respectively 9.
Pressure measurements
Poes and Pgas were measured using appropriately positioned balloon catheters (Ackrad Laboratories, Cranford, NJ, USA). Pdi was obtained by online subtraction of Poes from Pgas. Pressures were measured using differential pressure transducers (Validyne, Northridge, CA, USA) and amplified before passing to a computer (Apple Computer Inc., Cupertino, CA, USA) via an analogue/digital board. Data acquisition and analysis was performed using LabVIEWTM4.1 software (National Instruments, Austin, TX, USA). All signals were sampled at 100 Hz.
Respiratory muscle tests
All participants performed at least 10 sniff and five cough manoeuvres, from FRC and TLC respectively, and maximum sniff Poes and cough Pgas values were recorded. Subjects also performed at least three maximal inspiratory and expiratory efforts against a closed airway at FRC and TLC, and the highest values maintained over 1 s at the mouth were recorded (maximum inspiratory pressure at residual volume (PI,max) and maximum expiratory pressure (PE,max), respectively). Predicted values were calculated for PI,max and PE,max 10. Assessment of unilateral diaphragm function was performed using magnetic phrenic nerve stimulation 11.
Dynamic compliance
CL,dyn was calculated during resting breathing by dividing tidal volume by the difference in Poes at points of zero flow. Age-matched control values for CL,dyn were taken from the laboratory database.
Normal studies
In six normal subjects, the KCO and TL,CO were measured at TLC and at submaximal lung volumes. Subjects mimicked expiratory and inspiratory muscle weakness by expiring to 50% of expiratory reserve volume and inspiring to 50% of inspiratory capacity using visual feedback. This was termed the “simulated combined muscle weakness group”.
Statistical analysis
An analysis of variance (ANOVA) (Fisher's) test was used to evaluate the differences between the groups. Differences between the CL,dyn of age-matched controls and patients were assessed using unpaired t-tests. A p-value of <0.05 was considered statistically significant.
Results
From the 139 patients referred, a total of 27 patients were identified as suitable for analysis. Diagnoses included neuralgic amyotrophy with isolated unilateral and bilateral diaphragm weakness, limb girdle muscular dystrophy, Charcot-Marie-Tooth disease, Becker's muscular dystrophy, myotonic dystrophy and anterior horn cell disease. Six out of 10 patients with isolated diaphragm weakness, six out of 12 patients with inspiratory muscle weakness and three out of five patients with combined muscle weakness were nonsmokers, the remainder were exsmokers.
Respiratory muscle tests
Differences in Poes,sniff between the groups were mirrored in the per cent predicted PI,max. However, per cent predicted PE,max were below the control values in all three patients groups, although the lowest values were in the combined inspiratory and expiratory muscle weakness group, which was the only group with reduced Pgas,cough (table 1⇓).
Invasive and noninvasive tests of respiratory muscle strength
Lung volumes
All patient groups had reduced vital capacity (VC) and TLC (table 2⇓). Patients with unilateral and bilateral diaphragm weakness and inspiratory muscle weakness had a normal RV with reduced FRC. In patients with combined inspiratory and expiratory muscle weakness, RV was increased and FRC preserved. The FEV1/FVC ratio was higher in combined inspiratory and expiratory muscle weakness than inspiratory muscle weakness, probably reflecting the expiratory muscle weakness and increased RV.
Effect of different patterns of respiratory muscle weakness on lung volumes and spirometry
Carbon monoxide gas transfer
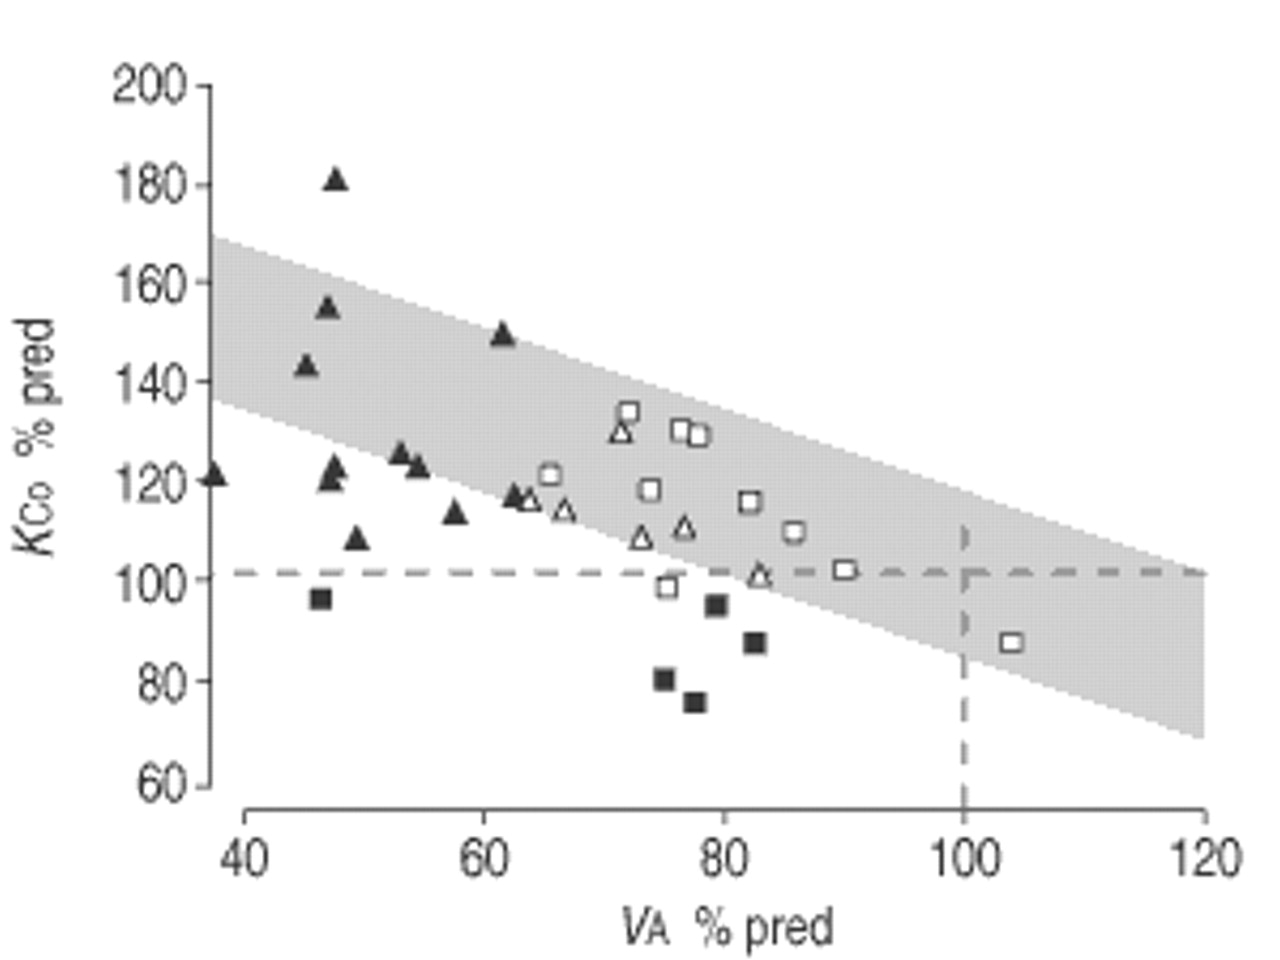
The per cent predicted VA was reduced in all four groups. Mean KCO was increased in inspiratory muscle weakness, unilateral and bilateral diaphragm weakness and simulated combined inspiratory and expiratory muscle weakness groups, but reduced in the combined inspiratory and expiratory muscle weakness group (table 3⇓). As expected, KCO increased as VA declined in the healthy subjects. To accommodate for the effect of VA, the individual values of KCO and VA, expressed as percentages of the standard reference values, were plotted against each other and compared with reference values of KCO adjusted for lung volume 12 (fig. 1⇓). Unilateral and bilateral diaphragm weakness patients and simulated combined inspiratory and expiratory muscle weakness subjects had KCO values close to those predicted at submaximal VA in normal subjects. Inspiratory muscle weakness patients, who had the lowest mean VA, all had elevated KCO values using the standard reference values but in many instances, this increase was less than predicted from the model. In striking contrast, the patients in the combined inspiratory and expiratory muscle weakness group all had normal or even reduced KCO standard reference values.

Plot of carbon monoxide transfer coefficient (KCO) against alveolar volume (VA), both expressed as a percentage of predicted standard reference value (% pred), in patients with inspiratory muscle weakness (▴), combined inspiratory and expiratory muscle weakness (▪), unilateral and bilateral diaphragm weakness (□), and in the normal subjects simulating combined muscle weakness (▵). The shaded area (mean±SD) shows the KCO plotted against VA as a per cent of the VA value at total lung capacity and at different levels of alveolar expansion in healthy middle-aged subjects 12. One-hundred per cent predicted values for KCO and VA are represented as dashed lines.
Effect of different patterns of respiratory muscle weakness on carbon monoxide transfer
Dynamic compliance
CL,dyn values were lower in inspiratory muscle weakness and combined inspiratory and expiratory muscle weakness groups than in the unilateral and bilateral diaphragm weakness group (table 4⇓). Although the values of CL,dyn in inspiratory muscle weakness and combined inspiratory and expiratory muscle weakness were lower than in the age-matched controls, paralleling the reductions in VC, there was no difference between the inspiratory muscle weakness and combined inspiratory and expiratory muscle weakness patients (p=0.75).
Comparison of dynamic lung compliance (CL,dyn) between patients and age-matched controls (AMC)
Discussion
In this study, the authors confirm that KCO is increased, compared to standard reference values, in patients with inspiratory muscle weakness and isolated unilateral and bilateral diaphragm weakness, and that the increase in KCO is inversely related to the decrease in lung volume. However, this increase in KCO is less than would be predicted for the decrease in VA in many of the patients with inspiratory muscle weakness. In the patients with combined inspiratory and expiratory muscle weakness, the KCO is unexpectedly normal or even reduced compared to standard reference values.
Critique of the method
Selection criteria for patients
One limitation of the study is that only 27 patients with “pure” respiratory muscle weakness were eligible for analysis from the 139 consecutive patients studied. This was partly a result of the strict categorisation used to identify specific groups of patients with differing patterns and severities of inspiratory and expiratory muscle dysfunction, and partly because care was taken to avoid confounding variables, such as the presence of smoking-related lung disease, which would influence gas transfer and lung volumes.
Classification of patient groups
A classification system with arbitrary limits was used to subdivide the patients. Measurement of Pdi,tw in response to phrenic nerve stimulation represents the only method for evaluation of diaphragm function, which is independent of the patients' aptitude and volition. All patients had evidence of severe unilateral and bilateral diaphragm weakness, as judged by magnetic phrenic nerve stimulation. The authors could have achieved further subclassification using PI,max and PE,max, but the normal ranges for these tests are wide 13 and a low PI,max or PE,max value does not distinguish between weakness and poor technique, particularly in patients with neuromuscular disease 4. This problem is also demonstrated by a previous study by the current group 14, which reported patients studied prior to those in the present series, where it was found that of 30 patients with low PI,max values, 10 had Poes,sniff values >80 cmH2O, excluding inspiratory muscle weakness. Thus, for the patient population in this study, the authors considered Poes,sniff and Pgas,cough to offer a more accurate subclassification than PI,max and PE,max.
Cough gastric pressure or cough oesophageal pressure?
In the current authors' laboratory, expiratory muscle strength is measured as Pgas,cough because they have previously shown that this has a functional correlate with an effective cough 4, 15. The authors acknowledge that the present hypothesis might have served more usefully by reporting Poes,cough because transpulmonary pressure is the driving pressure for flow and volume changes during a maximal cough. However, unpublished data from the current group suggests that Pdi,cough is <20% of the amplitude of Pgas,cough in 80% of normal subjects, so that Poes,cough is numerically similar to Pgas,cough, and this proportion is likely to be higher in patients with diaphragm weakness. Thus, the authors doubt whether a classification based on Poes,cough would alter the conclusions of the present study.
Significance of the findings
Effect of the pattern of respiratory muscle weakness on carbon monoxide transfer
Many authors, dating back to Krogh 1 in 1915, have shown an increase in KCO in normal subjects with submaximal inflation of the lungs. Stam et al. 12 demonstrated that in healthy subjects, the increase in KCO as lung volume decreases with submaximal inflation is linearly related to the fall in VA. This implies a rise in the ratio between the membrane diffusing capacity (Dm) and VA and/or the pulmonary capillary blood volume (Qc) and VA as lung volume falls. As VA decreases in normal subjects, Dm/VA remains almost constant and the rise in KCO is due to a rise in the Qc/VA ratio 3.
In agreement with earlier studies, the KCO was increased in the normal subjects when lung expansion was restricted to 50% inspiratory capacity. The increase in KCO observed in unilateral and bilateral diaphragm weakness patients was appropriate for the relatively small reductions in TLC and VA, confirming the findings of the original study of Laroche et al. 2. Although a subsequent report of patients with unilateral and bilateral diaphragm weakness showed a smaller increase in KCO (109% pred), there was a greater incidence of positive smoking history and airways obstruction in this study that could have offset the rise in KCO 16. In the current study, patients with combined inspiratory and expiratory muscle weakness had normal or even decreased KCO values (compared to standard reference values), while patients with inspiratory muscle weakness had variable increases in KCO, which was often less than predicted at a similar VA in normal subjects (fig. 1⇑ and table 3⇑). The increase in KCO in normal subjects is dependent on the VA at which the breath is held and the CO transfer measured. Furthermore, provided gas mixing of the inspired CO-helium mixture with resident gas is complete, an increase in RV should itself have no effect on KCO, which was confirmed in the normal subjects simulating combined inspiratory and expiratory muscle weakness. However, in addition to the increase in RV, the patients with combined inspiratory and expiratory muscle weakness had reduced lung compliance with probable unequal distribution of ventilation throughout the lungs, which could contribute to the reduced increase in KCO.
Since the polio epidemics of the 1950s, lung and chest wall compliance have been known to be reduced with chronic neuromuscular weakness, and VC is reduced more than can be accounted for simply by truncation of the inspiratory and/or expiratory extremes of the pressure/volume curve 17, 18. The current authors found that inspiratory muscle weakness and combined inspiratory and expiratory muscle weakness groups had the most impairment of VC and the lowest compliance values. The cause of this decrease in lung compliance remains unknown; changes in alveolar surfactant 19, stiffening of alveolar elastic fibres 20 and microatelectasis 19 have all been proposed, although no evidence of lung atelectasis has been found on high-resolution computerised tomography 20.
Another possible explanation for the reduced increase in KCO is a reduction in Qc in the patients in this study with combined inspiratory and expiratory muscle weakness, all of whom had advanced disease. Four of the five patients had been started on nocturnal ventilation to treat ventilatory failure, and the fifth patient had borderline abnormal arterial oxygen (O2) and carbon dioxide (CO2) tensions. Therefore, the authors speculate that hypoxaemia and hypercapnia could have increased pulmonary vascular tone and induced pulmonary hypertension 21 and possibly reduced Qc. This hypothesis could also explain the difference between the current study and that of Demedts et al. 22, which reported the KCO to be moderately increased in patients with combined muscle weakness. However, the patients in that study had no abnormality of gas exchange and only a moderate reduction in TLC. In addition, the KCO in the asymptomatic patients of the study of Demedts et al. 22 was appropriate for the level of lung inflation and thus, pulmonary vasculature changes would not have been expected to be present. It may be of interest to monitor the KCO of patients after a period of nocturnal ventilation to assess whether changes in KCO follow the improvements in arterial O2 and CO2. This is supported by a recent study by Schönhofer et al. 23, who reported that effective long-term noninvasive mechanical ventilation in patients with restrictive lung disease reduces pulmonary artery pressure. To the current authors' knowledge, there are no other studies of KCO and VA in chronic neuromuscular disease, although a strong relationship exists between the reduction in VA and the increase in KCO in patients with scoliosis 24. Therefore, in clinical practice, a subnormal rise in KCO at reduced VA would only be detected by comparing KCO with values appropriate for the reduced VA, because the values of KCO usually remain within the standard reference range (fig. 1⇑).
Effect of the pattern of respiratory muscle weakness on lung volumes
It is well established that weakness of the respiratory muscles causes a restrictive ventilatory defect with a reduction in TLC. However, the resting end expiratory position (FRC) in patients with respiratory muscle weakness can be decreased 19, 25–27, normal 28, 29 or increased 30, while RV can be normal 19, 27 or increased 22, 28–30. To examine whether these differences could be due to differences in the distribution of respiratory muscle weakness, the current authors analysed values of FRC and RV in eight studies 2, 19, 22, 30–34 that have reported both lung volumes and inspiratory and/or expiratory muscle function. In patients with inspiratory muscle weakness there was a reduction in FRC (mean decrease −21%) with a near normal RV (mean decrease −6.6%), but in patients with combined respiratory muscle weakness, the FRC was near normal (mean decrease −4.8%) and the RV was increased (mean increase +30.9%). This concurs with the data in this study (table 2⇑), suggesting that the pattern of respiratory muscle weakness is a determining factor for the subdivisions of lung volume.
Effect of the severity of respiratory muscle weakness
Patients with isolated diaphragm weakness had near normal lung function and the increase in KCO was appropriate for the reduction in VA (fig. 1⇑). The preservation of sufficient extradiaphragmatic inspiratory muscle function appears to limit the development of parenchymal or pulmonary vasculature abnormalities as judged by a near normal CL,dyn and an elevated KCO.
In conclusion, while patients with inspiratory muscle weakness and reduced total lung capacity have an increase in carbon monoxide transfer coefficient compared to the standard reference values, patients with combined inspiratory and expiratory muscle weakness frequently have carbon monoxide transfer coefficient values that are normal or lower than the standard reference values. In addition, when the carbon monoxide transfer coefficient is normalised for alveolar volume, many patients with inspiratory muscle weakness and all of the present patients with combined inspiratory and expiratory muscle weakness have lower carbon monoxide transfer coefficient values than would be predicted from the alveolar volume. These observations demonstrate the limitation of using carbon monoxide transfer coefficient to support the diagnosis of respiratory muscle weakness and may also indicate subtle abnormalities in the lung parenchyma or pulmonary vasculature. In order to detect such changes, the carbon monoxide transfer coefficient should be compared to values observed in normal subjects at a similar alveolar volume.
Acknowledgments
The authors would like to thank J.M.B. Hughes for his knowledge and insight, which contributed to preparation of this manuscript.
- Received October 16, 2001.
- Accepted January 14, 2002.
- © ERS Journals Ltd
References


