


Abstract
The aim of the present study was to evaluate the influence of ethnicity on the risk of developing obstructive sleep apnoea syndrome (OSAS) using genomic analysis methods to estimate ancestry.
DNA samples were obtained from 1,010 individuals participating in the São Paulo Epidemiologic Sleep Study, who underwent full-night polysomnography. A total of 31 genetic ancestry-informative markers were selected in order to estimate individual admixture proportions.
Of patients with a diagnosis of OSAS, a higher number self-reporting Caucasian ethnicity (65.3%), as well as an increased percentage of European ancestry (78.2±16.7%) and lower percentage of West African ancestry (16.1±15.3%), than among individuals without OSAS (53.6, 73.5±18.1 and 20.1±16.8%, respectively) (p<0.001) was observed. Moreover, after correcting for sex, age, body mass index and socioeconomic status, logistic regression demonstrated that European ancestry was significantly associated with an increased risk of manifesting OSAS (OR 2.80, 95% CI 1.11–7.09). Conversely, West African ancestry was associated with a reduced risk of the OSAS phenotype (OR 0.26, 95% CI 0.09–0.72).
This is the first study to incorporate genomic analysis methods to measure the influence of ethnicity on the risk of OSAS. Since genetically determined ancestry may not capture unmeasured cultural and lifestyle differences, the contribution of environmental factors to the current findings should not be disregarded.
Obstructive sleep apnoea syndrome (OSAS) is a prevalent condition, and has become a growing cause of health concern due to its myriad associated comorbid conditions related to repeated exposure to hypoxia and adverse physiological stresses, such as hypertension, cardiovascular disease, metabolic dysfunction, hypersomnolence and cognitive impairment. The manifestation of OSAS is known to be a result of a complex interaction between developmental, genetic and environmental factors 1. Recognised risk factors include male sex, increasing age, obesity, craniofacial structure, ventilatory control dysfunction, and alcohol and drug use 2.
Population-based surveys, mainly of Caucasian populations from Europe, North America and Australia, and more recently of individuals living in Asia, have demonstrated that the adult prevalence of OSAS ranges 3–7.5% in males and 2–3% in females 3–6. In general, data from outside these populations are surprisingly scarce, and interethnic comparisons are difficult due to divergence in methodological design and objective criteria for OSAS diagnosis. Nevertheless, few studies have described a similar prevalence of OSAS in middle-aged African American individuals and Caucasian Americans 2, 7. Conversely, OSAS appears to be more prevalent and more severe in both younger and elderly African Americans 7, 8, suggesting that ethnicity may be an additional risk factor for the development of OSAS.
Differences among the major ethnic groups in a number of health-related traits have been reported in clinical and epidemiological investigations 9, 10. However, the definition of ethnicity is not always clear in the medical literature, and the majority of studies involving different ethnic groups have relied on self-reported information regarding the national origin of the family or the assumptions of the researcher, normally based on physical appearance. These criteria for racial/ethnic definition have, since the late 1990s, been the subject of much debate 11, 12. Ethnic classifications, such as African American, European American, Latino and Hispanic, are a product of both environmental and genetic components, which may differently influence the estimated prevalence of the disorder under study 13. Therefore, in order to characterise the factors involved in health disparities among ethnically different groups, study designs must incorporate techniques capable of precisely discriminating the different sources of possible variations.
In this context, Brazilians are ethnically, culturally and socioeconomically diverse and provide a precious opportunity to dissect some of the risk factors involved in OSAS manifestation. In the early sixteenth century, when Portuguese colonisation began, the territory of Brazil was inhabited by >2.4 million Native Americans. It is estimated that, during the period 1500–1808, ∼500,000 Portuguese, mostly males, and >4 million African slaves, mainly Angolan, Yoruban, Ewe and Bantu, arrived in Brazil. The intermixing between the three ancestral populations (Native American, European and African) was the origin of contemporary Brazilians, one of the most heterogeneous populations in the world, in which each person is, in the vast majority of cases, highly admixed 14. This complex ancestry is reflected in the individual's genetic background, which is composed of a variable proportion of the three parental populations with diverse patterns of admixture 14. Recently, panels of ancestry-informative markers (AIMs) have become available as a tool for studying the influence of ethnicity on the risk of multifactorial disorders 15–17. AIMs are a specific type of genetic variation that, owing to the large frequency differences among populations, carry information about population structure and can be used to estimate what proportion of ancestry is derived from a particular geographical region. In order to accurately estimate genetic ancestry, each individual is genotyped for a panel of AIMs located throughout the genome, which are normally unlinked to the genes potentially related to the disorder under study. This genotypic information is then used in an admixture model, which assumes that every individual inherited some proportion of their ancestry from each ancestral population and estimates the posterior mean of these proportions 18.
In this sense, when applied in an admixed population, genomic analysis methods may facilitate the interpretation of the putative genetic components of ethnic variation and enable the investigation of associations between genetic ancestry and disease-related phenotypes 15–17. Thus the aim of the present study was to estimate the genetic ancestry of a large epidemiologically based sample from São Paulo (Brazil), and to correlate the findings with OSAS diagnosis, as measured by questionnaires and full-night polysomnography (PSG), using a nasal cannula and thermistor.
METHODS
Subjects
The present study was conducted with individuals participating in the São Paulo Epidemiologic Sleep Study, which was a population-based survey adopting a probabilistic three-stage cluster sample of São Paulo used to represent the population according to sex, age (20–80 yrs) and socioeconomic status. The study was carried out in 2007 in order to establish the epidemiological profile of sleep disorders in the adult population of São Paulo. Questionnaires, actigraphy, PSG and blood sample collection were completed to investigate associations between sleep patterns and disturbances according to sociodemographic status, the activity/rest cycle, physical activity habits, mood disturbances, memory complaints, sexual dysfunction in males, drug addiction, genetic markers, and anthropometric, clinical, biochemical, haematological, endocrine, immunological and inflammatory indicators. More details on the rational design, sampling and procedures utilised are provided elsewhere 19.
The study protocol was approved by the Ethics Committee for Research (CEP 0593/06) of the Federal University of São Paulo (São Paulo, Brazil) and registered with ClinicalTrials.gov (number: NCT00596713; name: epidemiology of sleep disturbances among the adult population of the Sao Paulo city). All volunteers read and signed the informed consent form.
Clinical assessment
Following the International Classification of Sleep Disorders, second edition (ICSD-2) 20, subjects were considered to have OSAS if they had an apnoea/hypopnoea index (AHI) of 5–14.9 events·h−1 and presented with at least one of the following complaints: loud snoring, daytime sleepiness, fatigue, and breathing interruptions observed during sleep. Subjects with an AHI of ≥15 events·h−1 were also considered to have OSAS, regardless of whether or not they had any of the aforementioned complaints.
Loud snoring was assessed using the second question of the Berlin Questionnaire for sleep apnoea 21, with a positive response being snoring “louder than talking” and “very loud – can be heard in adjacent rooms”. Daytime sleepiness was assessed using the Epworth Sleepiness Scale 22 and the eighth question of the Pittsburgh Sleep Quality Index 23. Epworth Sleepiness Scale scores higher than nine and/or frequencies of greater than once a week for the eighth question of the Pittsburgh Sleep Quality Index were considered positive. The former criterion was chosen based on previously published work, in which the Epworth Sleepiness Scale scores in mild, moderate and severe OSAS were found to be 9.5±3.3, 11.5±4.2 and 16±4.4, respectively 22. Fatigue was assessed using the Chalder Fatigue Scale 24. Scores higher than four were considered positive. Breathing interruptions were assessed using the fifth question of the Berlin Questionnaire and were considered positive when the frequency was “higher than once a month”. A complete description of the clinical assessment and the respective outcomes are presented elsewhere 25.
Polysomnography
Complete full-night PSG was performed using a digital system (EMBLA® S7000, Embla Systems, Inc., Broomfield, CO, USA) at the Sleep Institute (São Paulo, Brazil), using the subject's habitual bedtime. The following physiological variables were monitored simultaneously and continuously: four channels for the electroencephalogram; two channels for the electro-oculogram; four channels for the surface electromyogram (submentonian region, anterior tibialis muscle, masseter region and seventh intercostal space); one channel for the electrocardiogram; airflow detection via two channels through a thermocouple (one channel) and by nasal pressure (one channel); respiratory effort of the thorax (one channel) and of the abdomen (one channel) using inductance plethysmography; snoring (one channel) and body position (one channel); and oxyhaemoglobin saturation and pulse rate. All PSGs were performed, and sleep stages visually scored, by four trained technicians according to standardised criteria for investigating sleep 26. Electroencephalographic arousals and leg movements were scored in accordance with the criteria established by The AASM Manual for the Scoring of Sleep and Associated Events 27. Apnoeas were scored and classified following the recommended respiratory rules for adults suggested by this manual, and hypopnoeas were scored in accordance with the alternative rules 27.
Sociodemographic characteristics
General physical measurements were made immediately before preparation for the PSG hook-up, following recommended procedures and utilising precise instruments. The measurements were taken by trained professionals and included body weight (in kilogrammes), height (in metres), calculation of body mass index (BMI) using the formula weight/height2 and the circumferences (in centimetres) of the neck, waist and hip. Socioeconomic class was defined as high, middle or low for annual household incomes of >15,961, 4,561–15,960 and <4,560 US dollars, respectively, according to the Brazilian Economic Classification Criteria 28. Of the 1,500 districts into which São Paulo city is divided, 96 were assessed and individuals were selected proportionally from the four homogeneous socioeconomic regions of the city in an attempt to ensure the representativeness of different levels of wealth.
Characterisation of population structure and admixture
Two types of ethnic definition were used in the present study. Initially, individuals responded to a questionnaire in which ethnicity was coded according to one of the five following official classifications used by the Brazilian Institute of Geography and Statistics: “white”, “black”, “brown” (“mulattos”), “yellow” (Asian) and indigenous, or other for individuals that preferred a term not mentioned above*. After all of the response categories had been read to the responder, a self-classification based solely on personal understanding of the subject regarding their ethnic background was performed. The second approach was based on genetic information, independent of the previously chosen ethnic group or migration history of the family. In this analysis, the proportion of the genetic contribution of three founder populations of modern Brazilians (European, West African and Native American) was estimated for each individual. A total of 1,010 individuals from the 1,042 volunteers who underwent PSG recording at the Sleep Institute had high-quality DNA available for genetic analyses. A set of 31 AIMs that exhibited a high level of allele frequency difference among the three founder populations of Brazilian individuals (Europeans, West-Africans and Native Americans) were selected (table 1 of online supplementary material) 29. The AIMs were all single nucleotide polymorphisms (SNPs) genotyped using allele-specific PCR with universal energy-transfer labelled primers, under contract from Prevention Genetics (Marshfield, WI, USA) 30. PCR reactions were carried out with ArrayTape instrumentation (Douglas Scientific, Alexandria, MN, USA), and allele calls were generated based on the clustering of fluorescent signals. Only genotypes with a level of confidence of ≥90% were included in the analysis. Moreover, a total of 30 duplicate samples were included in an attempt to check for genotyping errors. Primers and PCR conditions are available upon request. Using the genotypic data, the number of ancestral populations (K) among the São Paulo Epidemiologic Sleep Study cohort and individual admixture proportions were estimated using the Bayesian Markov chain Monte Carlo method implemented in the STRUCTURE 2.1 program (University of Chicago, Chicago, IL, USA) 18. The program was run under the admixture model, using correlated allele frequencies and no prior population information, with a burn-in of 100,000 iterations and 1,000,000 iterations after burn-in, for a different number of parental populations (1–5; K).
Statistical analyses
Statistical analyses were performed using SPSS statistical software (version 15.0; SPSS, Inc., Chicago, IL, USA). Hardy–Weinberg equilibrium (HWE) values were determined by calculating a Chi-squared statistic and corresponding p-value. Fisher's exact test was used to compare sex, socioeconomic status, age and BMI strata. Since the distribution of the admixture proportions was not normal, the Mann–Whitney U-test was used to compare European, West African and Native American ancestry between OSAS and non-OSAS groups, whereas the Kruskal–Wallis test, followed by the Mann–Whitney U-test and Bonferroni correction, was used to compare the same variables among the various self-reported ethnic groups. OSAS was the outcome of interest, and logistic regression analyses were performed for the identification of independent risk factors. A p-value of <0.05 was established as significant.
RESULTS
The sample (1,010 subjects) was 44.3% male, with a mean age of 42.4±14.4 yrs. A total of 28.4% of the participants were from a high socioeconomic class, whereas 61.9 and 9.7% were classified as being of middle and low socioeconomic class, respectively. Of the 1,010 subjects, 337 (33.4%) were diagnosed with OSAS. The demographic characteristics of study participants, according to OSAS status, are presented in table 1. In brief, OSAS was associated with male sex, increasing age, higher socioeconomic status and obesity (p<0.01).
Admixture analysis
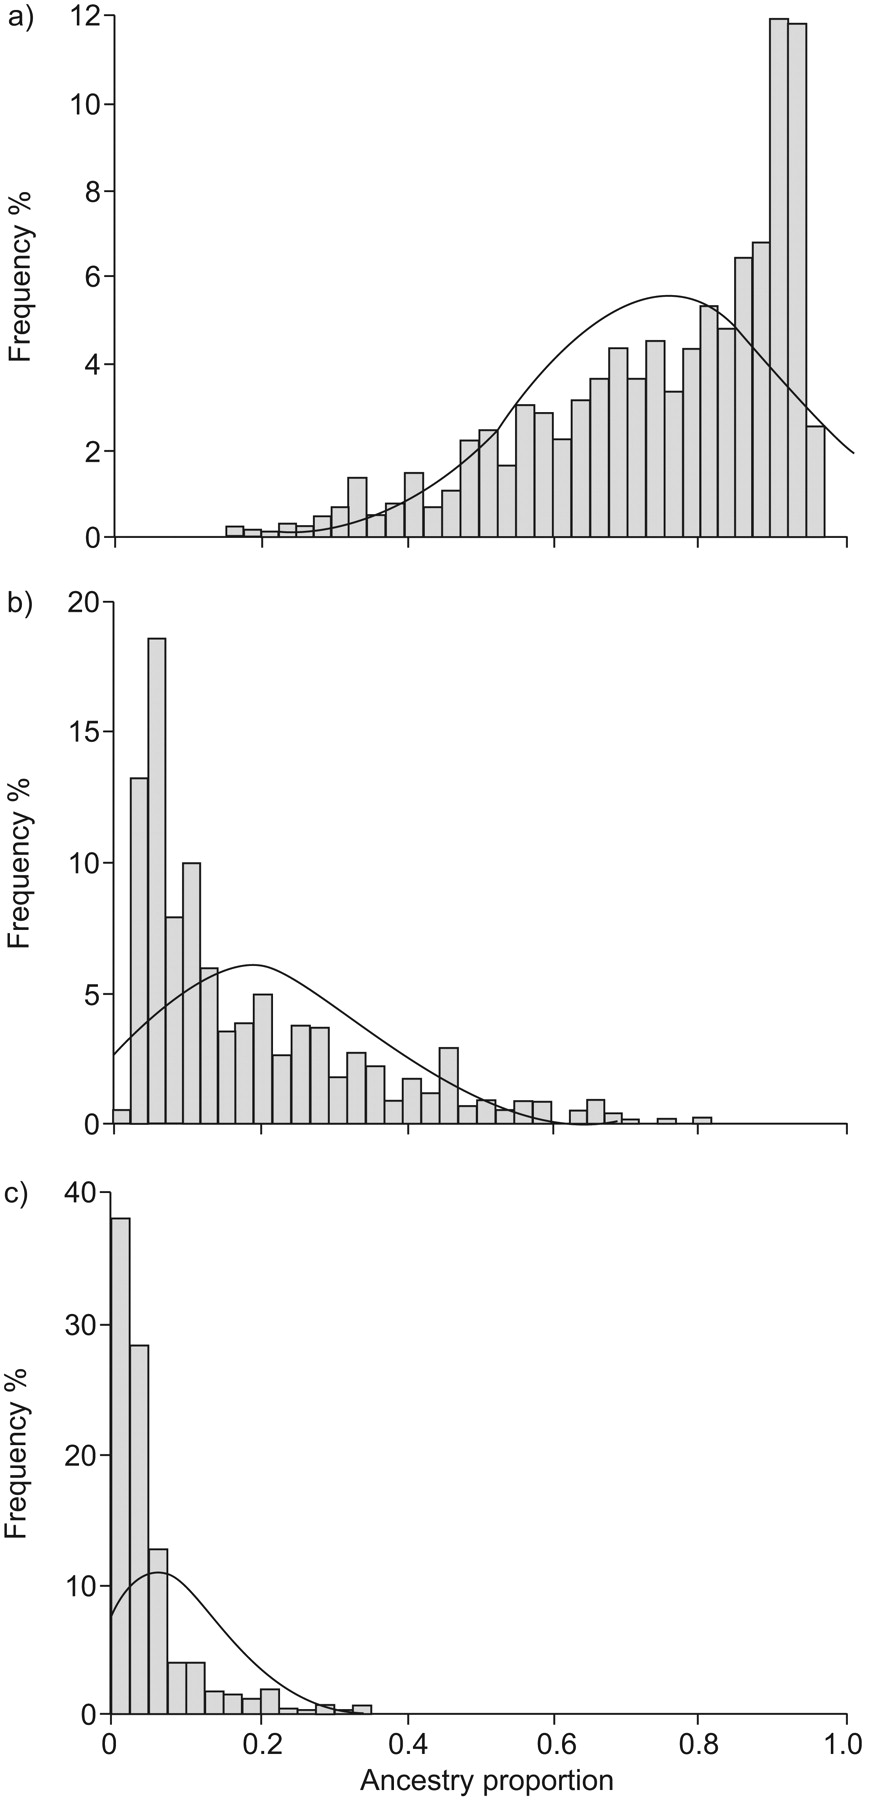
The mean call rate for the 31 genotyped markers was 97%, and the error rate was <0.5%. Using a HWE threshold of p<0.01, six AIMs (19.3%) deviated from expected HWE proportions (the SNPs rs2814778, rs2077681, rs1369290, rs719776, rs2341823 and rs1487214). This rate is higher than would be expected under the null distribution, and, for all of the markers, there was a decrease in heterozygosity, probably as a consequence of population substructure attributable to variable degrees of individual admixture. Using the genotypic data of the 31 AIMs, the STRUCTURE 2.1 program estimated the smallest log probability for K = 3 populations, suggesting that there was a greater likelihood that the cohort was descended from three rather than one, two or four ancestral populations. For the sample as a whole, it was estimated that the mean proportions of ancestry were 75.1±17.7% European, 18.8±16.4% West African and 6.3±9.1% Native American (fig. 1).

Distribution of individual ancestry proportions in the population of São Paulo (Brazil): a) European, b) West African, and c) Native American.
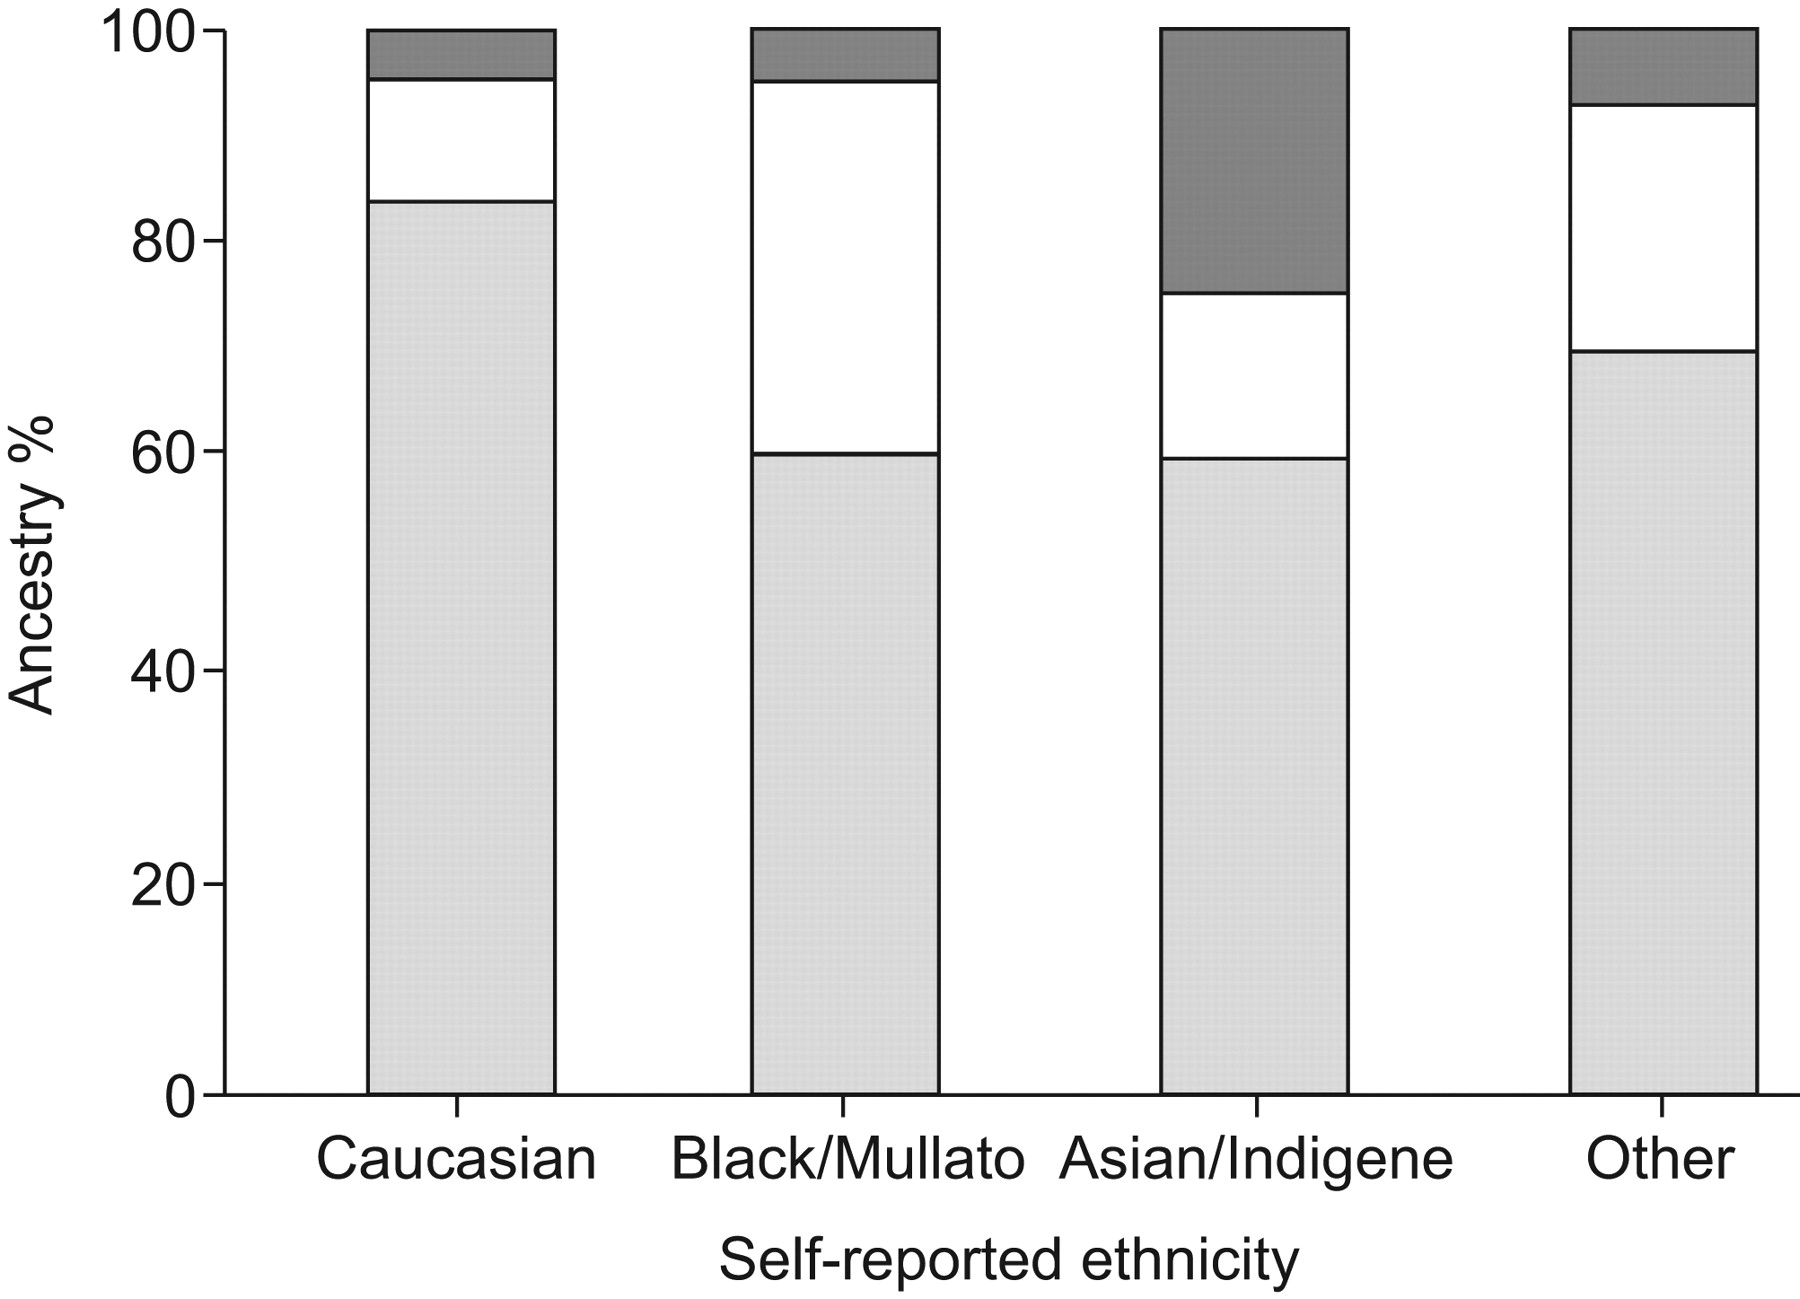
The correlation between self-reported ethnicity and ancestry proportions was highly significant (p<0.0001). Figure 2 illustrates the proportions of genetically determined ancestry in the self-reported ancestry groups. As expected, Caucasian individuals showed a higher proportion of European ancestry (84.0±11.3%) and a lower proportion of West African ancestry (11.3±9.4%) in comparison to the “Black” and “Mulatto” populations (60.1±17.0 and 35.2±17.9%, respectively; p<0.0001). Individuals self-reporting Asian or indigenous backgrounds showed higher levels of Native American ancestry (24.9±22.3%) compared to both the Caucasian (4.8±5.5%) and the “Black”/“Mulatto” groups (4.9±4.8%) (p<0.0001). Moreover, when compared to Asian or indigenous ethnic groups, the proportions of European and West African ancestry were also higher in Caucasian and “Black”/“Mulatto” individuals, respectively (p<0.0001). These results remained highly significant even after Bonferroni correction for multiple tests.
Mean proportions of genetically determined European (░), West African (□) and Native American ancestry (▒) in the self-reported ethnic groups of individuals participating in the São Paulo Epidemiologic Sleep Study (São Paulo, Brazil).
Correlation between ancestry and OSAS
The prevalence of OSAS in the total population was 33.4%. In the group of patients diagnosed with OSAS, a total of 65.3% reported Caucasian as their ethnic background, compared with 53.6% of the individuals without OSAS (p = 0.009). Conversely, the frequency of individuals reporting “Mulatto” or “Black” ethnicity was significantly higher in the non-OSAS (29.3%) than in the OSAS group (19.8%). The same trend was observed when considering the genetically determined ancestry proportions. Patients with a diagnosis of OSAS demonstrated a higher percentage of European ancestry (78.2±16.7%) and a lower percentage of West African ancestry (16.1±15.3%) compared to individuals without OSAS (73.5±18.1% and 20.1±16.8%, respectively) (p<0.0001 for both comparisons). The percentage of Native American ancestry did not differ between groups (p = 0.35).
When genetic ancestry was compared using AHI scores, a higher percentage of European ancestry was demonstrated in both groups of individuals, with AHI scores of 5–15 events·h−1 (77.4±15.9%) and >15 events·h−1 (78.0±17.5%) in relation to individuals with an AHI score of <5 events·h−1 (73.4±18.3%) (p = 0.008 and p = 0.001, respectively). Corroborating previous findings, there was significantly less African ancestry in the groups of individuals with mild and moderate OSAS (16.8±14.9%) and severe OSAS (15.9±15.6%), compared with the group of subjects with an AHI of <5 events·h−1 (20.3±17.0%) (p = 0.004 and p<0.0001, respectively). Moreover, no significant differences were observed between individuals with AHI scores of 5–15 versus >15 events·h−1 for European and African ancestry (p>0.05).
Age, sex, BMI, socioeconomic status and proportions of ancestry were tested in a stepwise forward logistic regression model in order to identify independent risk factors for the manifestation of OSAS. The best predictive model indicated that, in addition to male sex (OR 3.88, 95% CI 2.76–5.46), age (OR 1.07, 95% CI 1.06–1.09) and BMI (OR 1.19, 95% CI 1.15–1.23), European ancestry was also significantly associated with the risk of manifesting OSAS (OR 2.80, 95% CI 1.11–7.09) (table 2). Owing to the high correlation between the genetic ancestry estimates, the effect of West African ancestry was evaluated in a second regression model. It was demonstrated that West African ancestry was associated with a reduced risk of the OSAS phenotype (OR 0.26, 95% CI 0.09–0.72), when analysed together with sex, age and BMI. The effect of socioeconomic status was also investigated in both stepwise logistic regression models; however, it was not found to be significantly predictive of OSAS and was not entered in the final model.
DISCUSSION
In the present study, the ancestry proportions were estimated of 1,010 Brazilians living in São Paulo, who participated in São Paulo Epidemiologic Sleep Study, a population-based survey adopting a probabilistic three-stage cluster sample of São Paulo to represent the population according to sex, age (20–80 yrs) and socioeconomic status. The study was carried out in 2007 in order to establish the epidemiological profile of sleep disorders in the adult population of São Paulo. OSAS was diagnosed according to ICSD-2: 1) subjects presenting with an AHI of 5–14.9 events·h−1 and at least one of the following complaints (fatigue, insomnia, unrefreshing sleep, daytime sleepiness and breath-hold, gasping or choking, and bed partner reports of loud snoring and/or breathing interruptions); or 2) subjects with an AHI of ≥15 events·h−1, independent of the number of complaints 25. In this previous study 25, it was demonstrated that a total of 29.5% of individuals with an AHI of 5–14.9 events·h−1 did not exhibit sleep complaints. Conversely, 66.0% of subjects with an AHI of <5 events·h−1 and 74.3% of subjects with an AHI of >15 events·h−1 reported at least one of the previously mentioned symptoms.
For the total sample, the mean proportions of European, West African and Native American ancestry were estimated to be 75.1±17.7, 18.8±16.4 and 6.3±9.1%, respectively. The high level of admixture found in the present sample is consistent with the three-way admixture history of the Brazilian population based on the contribution of three main founder populations 14. Several studies have shown that the level of contribution of the ancestral population to the genetic background of Brazilians may vary significantly in different regions of Brazil 31. For the population as a whole, Franco et al. estimated 51% European, 36% African and 13% Native American ancestry, whereas European ancestry was found to vary from 92% 32 in the South to 54% in the North of Brazil 33. Similarly, the African contribution ranges from 8% 32 in the South to 34% in the north-east region 34, and the Native American contribution can be as low as 0% in the South of Brazil 32 and as high as 41% in the North Amazonian region 35. As expected, the estimates obtained in the present study represent intermediate values compared to the regions with extreme European, African or Native American ancestry. Therefore, although the present estimates of admixture in modern Brazilians should be seen only as approximations, since the non-admixed populations used to provide the ancestry-specific allele frequencies in the present study were not the exact mix of European, African and Native American subpopulations that contributed to the modern Brazilian population, the results are likely to represent the real scenario of the admixture patterns in the south-east region of Brazil.
According to the 2007 National Survey, Brazilians classified themselves as “White” (49.7%), “Mulatto” (42.6%), “Black” (6.9%), Asian and Native American (<1%). Comparisons of ancestry estimation with classification of self-reported ethnicity are highly correlated. Caucasian individuals have higher proportions of European ancestry, “Black” and “Mulatto” individuals show higher proportions of West African ancestry, and Asian and indigenous individuals exhibit increased levels of Native American ancestry. Although the correlation is significant, individuals classified as Caucasian have a substantial contribution of West African ancestry, and individuals classified as “Black” and “Mulatto” have a substantial contribution of European ancestry. These results agree with those of other studies, demonstrating the complexity of the genetic ancestry of Brazilians and the risk of relying on self-reported ethnicity for classification of individuals in genetic studies 14.
It has been suggested that younger and elderly African Americans exhibit significantly greater risk of OSAS and are diagnosed later with more severe OSAS 7, 8. Currently, the biological cause of such disproportion has not been elucidated, but it is probably due to multiple potentially interacting gene and environmental factors. In the present study, it was found that European ancestry, estimated by genetic markers, increases the risk of OSAS, even after correction for potential risk factors, such as age, sex and BMI. In addition, West African ancestry was also found to be significantly associated with the risk of OSAS manifestation, as a protective factor however. One possible explanation for these contradictory findings is simply that the ancestral genetic composition of African Americans is distinct from that observed for the “Black” and “Mulatto” groups in Brazil. Although, it was found that, in the latter, the overall West African ancestry contribution is ∼35±18%, a recent study indentified 83±9% African ancestry in a sample of 4,464 African Americans 36. As a result of historical factors, the contribution of European genetic ancestry is much more significant among Brazilians, and this may have a direct impact on the influence of genetic factors modulating the interethnic differences in the risk of OSAS. Moreover, it is evident that each population is unique. Brazilians and Americans have been shaped by different historical, socioeconomic and other nonmeasured environmental sources of variation. Interactions between biological and environmental factors may also modify their individual contribution to the disorder and consequently modulate risk and severity in a population-specific manner.
It is recognised that African Americans have a high prevalence of obesity, type 2 diabetes and cardiovascular disease compared to non-Hispanic “Whites” 9, 10. To date, studies using ancestry proportions to model genetic contributions in order to correlate ethnic differences with risk have produced conflicting results 15, 17. Williams et al. 17 demonstrated that European ancestry is inversely associated with BMI and fasting glucose measurements in a sample of non-diabetic Pima Indians. After adjusting for age and socioeconomic status, a significant association was also observed between African admixture and obesity among African American females 15. Conversely, Lorenzo et al. 37 reported that a Spanish genetic admixture was not a risk factor for hypertension in populations of Mexican origin. Furthermore, a recent study examining ∼1,000 individuals from the Boston Puerto Rican Health Study demonstrated that African ancestry is inversely associated with type 2 diabetes and cardiovascular disease, and positively correlated with hypertension 16. In a different context, Salari and Burchard 38 showed that, among individuals of higher socioeconomic status, the risk of asthma increased with African ancestry. Conversely, asthma risk increased in individuals of European ancestry and of a lower socioeconomic class. Taken together, these data suggest that the genetic and environmental factors influencing risk are likely to be contextual and that ancestry acts as a modifier. Nevertheless, the relationship between risk of OSAS and ancestry demonstrated in the present study is consistent with an additive genetic model with population-specific alleles influencing the ethnic difference in risk.
One limitation of the present study is the number of markers used to estimate genetic admixture. Indeed, previous simulation studies have shown that >50 AIMs are required in order to accurately estimate ancestral proportions in admixed populations 39. Nevertheless, we acknowledge that the precision of the estimation depends on not only the number of AIMs used in the analyses but also their ability to discriminate among parental populations. In this sense, it has also been demonstrated that fewer markers are satisfactory when the mean marker allele frequency difference between parental populations is >60% 13, 39, 40. In the present panel, a marker was deemed informative if there was ≥30% allele frequency difference between any two parental groups 41. From the total of 31 markers selected, 18 were informative for determining European/West African contributions, with an average allele frequency differential of 74%. There were 19 and 27 markers useful in detecting European/Native American and Native American/West African contributions, with corresponding mean allele frequency differences of 76 and 78%, respectively. Therefore, although the use of a greater number of markers would have increased the precision of the ancestral proportion estimate, the highly significant correlation between genetic ancestry estimates and self-reported ethnicity, and the fact that both classifications agree in suggesting that greater European ancestry is associated with a higher risk of OSAS, argue that it is unlikely that the direction of the association would be altered.
The present analysis is the first study to apply genomic methods to measuring the relationship between OSAS and ethnicity. The higher risk attributed to European and the lower risk to West African ancestries highlight the need to consider genetic information as an important factor in clinical and epidemiological studies of OSAS prevalence, especially in populations with high levels of ethnic admixture, such as in South and North America. Nevertheless, although the AIMs were used in an attempt to dissect the influence of biological aspects of ethnicity on OSAS phenotype apart from cultural elements, it should be noted that the findings presented here might still be a result of a complex interaction between heritable and nongenetic factors, such as diet, physical activity level, lifestyle and differing access to healthcare, to name but a few. Therefore, the impact of environmental factors on the overall risk attributed to ethnicity in the susceptibility of OSAS should not be discounted, and future studies should incorporate statistical models capable of quantifying its influence and considering its interaction with the genetic/biological aspects contributing to this phenotype. Finally, the present study highlights the Brazilian population and its wide variation in ethnic admixture and environmental exposure as a powerful resource of information in helping to explain the differences in OSAS and other sleep disorders prevalent among ethnic and racial groups.
Acknowledgments
The authors would like to express their cordial thanks to D.M. Lima and the staff of the Sleep Institute (São Paulo, Brazil) for valuable assistance during the conduct of the experiments.
Footnotes
This article has supplementary material accessible from www.erj.ersjournals.com
*Alternative terminology to qualify ethnic origins of people referring to geographical locations rather than skin colour are commonly used in international classification.
Support Statement
This study was supported by the Psychopharmacology Incentive Fund and the São Paulo Research Foundation (CEPID 98/14303-3) (both São Paulo, Brazil).
Clinical Trial
This study is registered at ClinicalTrials.gov (trial number NCT00596713).
Statement of Interest
None declared.
- Received September 15, 2009.
- Accepted February 26, 2010.
- ©2010 ERS


