


Abstract
Only 25% of multidrug-resistant tuberculosis (MDR-TB) cases are currently diagnosed. Line probe assays (LPAs) enable rapid drug-susceptibility testing for rifampicin (RIF) and isoniazid (INH) resistance and Mycobacterium tuberculosis detection. Genotype MTBDRplusV1 was WHO-endorsed in 2008 but newer LPAs have since been developed.
This systematic review evaluated three LPAs: Hain Genotype MTBDRplusV1, MTBDRplusV2 and Nipro NTM+MDRTB. Study quality was assessed with QUADAS-2. Bivariate random-effects meta-analyses were performed for direct and indirect testing. Results for RIF and INH resistance were compared to phenotypic and composite (incorporating sequencing) reference standards. M. tuberculosis detection results were compared to culture.
74 unique studies were included. For RIF resistance (21 225 samples), pooled sensitivity and specificity (with 95% confidence intervals) were 96.7% (95.6–97.5%) and 98.8% (98.2–99.2%). For INH resistance (20 954 samples), pooled sensitivity and specificity were 90.2% (88.2–91.9%) and 99.2% (98.7–99.5%). Results were similar for direct and indirect testing and across LPAs. Using a composite reference standard, specificity increased marginally. For M. tuberculosis detection (3451 samples), pooled sensitivity was 94% (89.4–99.4%) for smear-positive specimens and 44% (20.2–71.7%) for smear-negative specimens.
In patients with pulmonary TB, LPAs have high sensitivity and specificity for RIF resistance and high specificity and good sensitivity for INH resistance. This meta-analysis provides evidence for policy and practice.
Abstract
Line probe assays have high accuracy for detection of RIF resistance and INH resistance http://ow.ly/USX5305tqFV
Introduction
Tuberculosis causes 10.4 million cases and 1.8 million deaths annually and it is estimated that 4.3 million cases go undiagnosed each year [1]. The emergence of multidrug and extensively drug-resistant tuberculosis (MDR-TB and XDR-TB, respectively) is a major threat to global tuberculosis control [2]. Culture and drug-susceptibility testing (DST) using solid media can take up to 8–12 weeks for results [3] and faster liquid-based culture techniques still take 4–6 weeks [4]. The delays associated with DST lead to prolonged periods of ineffective therapy and ongoing tuberculosis transmission. The development of rapid molecular diagnostic tests for the identification of Mycobacterium tuberculosis and drug resistance has consequently become a research and implementation priority [5].
Line probe assays (LPAs) are rapid molecular diagnostics that can detect M. tuberculosis and drug resistance. Although LPAs are more technically complex (designed for reference or regional laboratory settings) and take longer to perform than the Xpert MTB/RIF assay (Cepheid, Sunnyvale, CA, USA), they have the ability to detect isoniazid (INH) resistance in addition to rifampicin (RIF) resistance unlike Xpert MTB/RIF [6]. LPAs detect RIF and INH resistance by identifying mutations in the rpoB, katG, and inhA genes. By targeting mutations in the 81-base pair “core region” of the rpoB gene, more than 95% of all RIF resistant strains can be detected [7]. In comparison, the mutations that cause INH resistance are located in several genes and regions [8, 9]. Although mutations in katG and inhA account for approximately 80–90% of INH-resistant strains [10], an additional 5–10% of INH-resistant strains have mutations in the ahpC–oxyR intergenic region, often in conjunction with katG mutations outside of codon 315 [11].
The World Health Organization (WHO) approved LPAs for the diagnosis of M. tuberculosis and RIF resistance in smear-positive tuberculosis in 2008 [12], guided by a systematic review evaluating two first-generation LPAs: INNO-LiPA Rif.TB assay (Innogenetics, Ghent, Belgium) and Genotype MTBDR assay (Hain Lifescience GmbH, Nehren, Germany) [13], both of which assays are no longer used in clinical practice. Newer versions of the LPA technology have been developed [14–17] and additional studies have been published. This systematic review was commissioned by the WHO to guide a policy update on the use of molecular diagnostics. We evaluated the diagnostic accuracy of three LPAs (appendix A in the supplementary material): GenoType MTBDRplus V1 (subsequently referred to as “Hain V1”), GenoType MTBDRplus V2 (subsequently referred to as “Hain V2”) and Nipro NTM+MDRTB Detection Kit 2 (subsequently referred to as “Nipro”), for the detection of RIF and INH resistance and detection of M. tuberculosis.
Methods
We followed the Preferred Reporting Items for Systematic Reviews and Meta-Analyses (PRISMA) guidelines and methods for systematic reviews and meta-analyses of diagnostic test accuracy [18, 19]. We prepared a protocol for the literature search, article selection, data extraction, assessment of methodological quality and synthesis of results.
Search methods
We performed a comprehensive search of the following databases (PubMed, EMBASE, BIOSIS, Web of Science, LILACS, Cochrane) for relevant citations (full search strategy reported in appendix C in the supplementary material). Our search was restricted to the time period January 2004 to August 2015, since the first Hain LPA was introduced in October 2004. In addition, we contacted laboratory experts and the test manufacturers for additional published studies. We also searched reference lists from included studies and previous meta-analyses [13]. No language restriction was initially applied but at the full-text review stage we restricted studies to English, French and Spanish. Abstracts or conference proceedings were not included.
Study selection and data extraction
Two review authors (R.R. Nathavitharana and P.G.T. Cudahy) independently assessed titles and abstracts (screen 1). Any citation identified by either review author during screen 1 was selected for full-text review. The same two review authors (R.R. Nathavitharana and P.G.T. Cudahy) independently assessed the full-text articles for inclusion (screen 2). In screen 2, any discrepancies were resolved by discussion between the review authors or by arbitration by a third review author (C.M. Denkinger). Two review authors (R.R. Nathavitharana and P.G.T. Cudahy) extracted data from the included studies with a pre-piloted standardised form and crosschecked to ensure accuracy. Disagreement between review authors on data extraction was resolved by discussion or by a third reviewer (C.M. Denkinger). Studies without extractable sensitivity and specificity data were excluded if no further information was acquired after three attempts to contact the study authors.
Selection criteria
We included cross-sectional, case-control, cohort studies or randomised controlled trials comparing LPAs to a reference standard test (see below), if at least 25 samples were tested. Patients of all age groups with suspected or confirmed pulmonary tuberculosis or MDR-TB were included, regardless of setting or country. Specimen types were limited to sputum. Patients who were already on therapy were excluded from analyses of M. tuberculosis detection (since dead bacilli not detected by culture could be detected by LPAs leading to false positive results) but were included in analyses for RIF and INH resistance detection.
The reference standard test for the detection of M. tuberculosis was a positive solid or liquid culture for M. tuberculosis. The reference standard test for the detection of RIF and INH resistance detection was phenotypic DST for our primary analysis for all studies. Where data were available, LPA results were also compared with a composite reference standard, which combined the results from targeted genetic sequencing and phenotypic DST results (see appendix B in the supplementary material for details).
Outcome measures
Our outcome measures for all questions were sensitivity and specificity. Indeterminate results were excluded from the analyses for determination of sensitivity and specificity and were reported separately (further details in appendix B in the supplementary material).
Assessment of methodological quality
We used the Quality Assessment of Studies of Diagnostic Accuracy included in Systematic Reviews-2 (QUADAS-2) instrument, a validated tool for diagnostic studies, to assess study quality [20]. The information needed to answer QUADAS-2 questions was incorporated in the data extraction sheet. A description of the QUADAS-2 items and the interpretation in the study context can be found in appendices D1 and D2 in the supplementary material.
Statistical analysis and data synthesis
We performed statistical analyses using STATA (version 13; STATA corporation, College Station, TX, USA). The studies were grouped by type of index test and reference standard used. Our QUADAS-2 analysis was performed using Excel (version 14.5.4; Microsoft, Seattle, WA, USA).
Meta-analysis
Meta-analysis was performed for each index test if at least four studies were available for the same index test and if there was limited heterogeneity between studies. Bivariate random effects meta-analyses were performed [21, 22] using the metandi package in STATA for index tests that included enough data to calculate sensitivity and specificity, with 95% confidence intervals. Summary and individual estimates were also presented graphically with the 95% confidence intervals and prediction region. Several studies did not contribute to both sensitivity and specificity but only to one of the two. In order to make complete use of the data for these studies we performed a univariate random effects meta-analysis of the sensitivity and/or specificity estimates separately. Where there were fewer than four studies available or if substantial heterogeneity precluded meta-analysis, a descriptive analysis was performed. Forest plots were visually assessed for heterogeneity among the studies within each index test. Using summary plots, we examined the variability in estimates and the width of the prediction region, with a wider prediction region suggesting more heterogeneity. We anticipated that studies included in the meta-analysis would be fairly heterogeneous and thus sub-groups for analysis were pre-specified as LPA type, specimen type, specimen conditions and smear status.
Results
Characteristics of included studies
From the literature search, we identified 1650 citations and reviewed 218 full-text articles. 74 studies were included in this systematic review (figure 1) [15, 17, 23–94]. 16 of these studies contributed data to more than one analysis, resulting in a total of 94 datasets. A list of excluded studies and the reasons for exclusion is presented in appendix E in the supplementary material. Tables 1 and 2 demonstrate the characteristics of the 94 datasets that provided data on RIF and INH (of note, four of these datasets only provided data on RIF but not INH) and the six datasets that provided data on M. tuberculosis detection respectively. The majority of datasets were cross-sectional in design and almost all were performed in either a regional or national reference laboratory setting. 48 datasets evaluated LPA for direct testing on sputum specimens [15, 17, 24, 25, 27, 29–32, 35–39, 41–43, 46, 47, 49, 50, 52, 57, 59, 62–69, 71, 72, 74, 77–82, 84, 87, 91, 93] and 46 datasets evaluated LPA for indirect testing on culture isolates [17, 23, 25–28, 33–35, 37, 39, 40, 44, 45, 48, 51–58, 60–62, 68, 70, 72, 73, 75, 76, 78, 79, 83, 85, 86, 88–90, 92, 94]. 83 datasets evaluated Hain V1, five datasets evaluated Hain V2 [15, 30, 36, 72] and six datasets evaluated Nipro [17, 72, 79]. Very few datasets recorded demographic data or HIV status due to the use of anonymised samples.

Preferred Reporting Items for Systematic Reviews and Meta-Analyses diagram of included studies. TB: tuberculosis; LPA: line probe assay.
Characteristics of included studies for rifampicin (RIF) and isoniazid (INH) resistance detection, grouped alphabetically by index test type
Characteristics of included studies for M. tuberculosis detection, grouped alphabetically by index test type
Methodological quality
The methodological quality across all included studies is summarised in figure 2 and presented for each individual study in appendix D3 in the supplementary material. Many studies did not report all factors that could affect methodological quality. For the “patient selection’ domain, there was unclear risk of bias for 56 out of 94 datasets for RIF and INH resistance and five out of six datasets for M. tuberculosis detection predominantly because the method of sampling of patients was not defined. Applicability concerns were unclear in 18 out of 94 datasets for RIF and INH resistance and one out of six datasets for M. tuberculosis detection that did not specify the type of patients tested or laboratory setting. For the “index test” domain, there was unclear risk of bias for 66 out of 94 datasets for RIF and INH resistance and two out of six datasets for M. tuberculosis detection because it was not stated whether the person performing the index test was blinded to the results of the reference standard testing. Applicability concerns in this domain were high risk in eight out of 94 datasets that reported variations in test processing that were not according to the manufacturer's recommendations. For the “reference test” domain, there was unclear risk of bias for many datasets (68 out of 94) for RIF and INH resistance and three out of six datasets for M. tuberculosis detection because it was not stated whether the person performing the reference test was blinded to the results of the index tests. Applicability concerns were low. In the “flow and timing” domain, the majority of datasets (78 out of 94 and six out of six, respectively) were judged to have a low risk of bias.

QUADAS-2 summaries. a and c) Risk of Bias and Applicability Concerns summary about each QUADAS-2 domain presented as percentages across the 94 included datasets for rifampicin (RIF) and isoniazid (INH) resistance compared with phenotypic culture-based reference standard (of note, four datasets only contributed to RIF). The summaries for the datasets for RIF and INH compared with composite reference standard are not displayed separately since these datasets are a subset of the 94 datasets displayed below and thus the figures displayed are thought to be accordingly representative. b and d) Risk of Bias and Applicability Concerns summary about each QUADAS-2 domain presented as percentages across the six included datasets for Mycobacterium tuberculosis detection compared with a culture-based reference standard.
Indeterminate result and culture contamination rates
30 datasets reported indeterminate results for directly tested specimens with a median of 5.3% and range of 1.0–14.5% for rifampicin and 5.6% and 0.9–14.5% for isoniazid (appendix F, table S1 in the supplementary material). Only five datasets reported indeterminate results for indirectly tested isolates but these percentages were lower than for direct testing, with a median of 1.0% and range of 0.5–2.1% for rifampicin and 0.5% and 0.5–1.0% for isoniazid. Only three datasets that performed direct testing for M. tuberculosis detection reported indeterminate results, with a median of 1.0% and range of 0.7–1.7%. Data on smear grade were limited. Studies did not typically report whether repeat testing was performed on indeterminate results. For comparison purposes, four datasets reported the number of contaminated cultures obtained using the culture reference standard, with a median of 7.6% and range of 2.8–17.2% of the total specimens.
Analysis of primary outcomes of interest
Diagnosis of RIF resistance using a phenotypic reference standard
Pooled Analysis for all LPAs on all specimen types
91 datasets were included in the bivariate analysis, with a total of 21 225 samples that included 6789 (32%) confirmed RIF-resistant tuberculosis cases. Meta-analysis revealed a pooled sensitivity of 96.7% (95% CI 95.6–97.5%) and specificity of 98.8% (95% CI 98.2–99.2%) (table 3). Results were largely homogenous, with a small proportion of studies being outliers. Pooled analysis stratified by LPA (appendix F, table S2 in the supplementary material) demonstrated a slightly lower sensitivity for Hain V2 and Nipro (95.0% and 94.3% compared with 97.1% for Hain V1) although confidence intervals overlapped and specificity was similar (98.3%, 98.1% and 98.9% respectively).
Diagnostic accuracy of line probe assays for all three assays combined for rifampicin (RIF) and isoniazid (INH) resistance and multidrug-resistant tuberculosis (MDR-TB) detection
Direct testing
48 datasets tested RIF resistance detection with LPA directly from specimens, with a total of 10 560 samples that included 2876 (27%) confirmed RIF-resistant tuberculosis cases. The pooled sensitivity was 96.3% (95% CI 94.6–97.5%) and specificity was 98.2% (95% CI 97.2–98.8%) (table 3, figure 3a). Outliers with lower sensitivity and specificity were predominantly datasets with limited numbers of resistant specimens (<10) and thus accompanied by very wide confidence intervals (figure 4).

Hierarchical summary receiver operating characteristic graphs of summary estimates. Bivariate analysis of the sensitivity and specificity for all line probe assays for the diagnosis of drug resistance detection compared with a phenotypic reference standard for specimens tested directly for a) rifampicin resistance, b) isoniazid resistance, c) multi-drug resistance and d) the detection of Mycobacterium tuberculosis compared to a culture reference standard. In the plots below, the red squares represent the pooled summary estimates, the dashed red lines represent the 95% confidence region and the dashed green lines represent the 95% prediction region. The individual circles represent each study and the size of the circle is proportional to the total sample size.

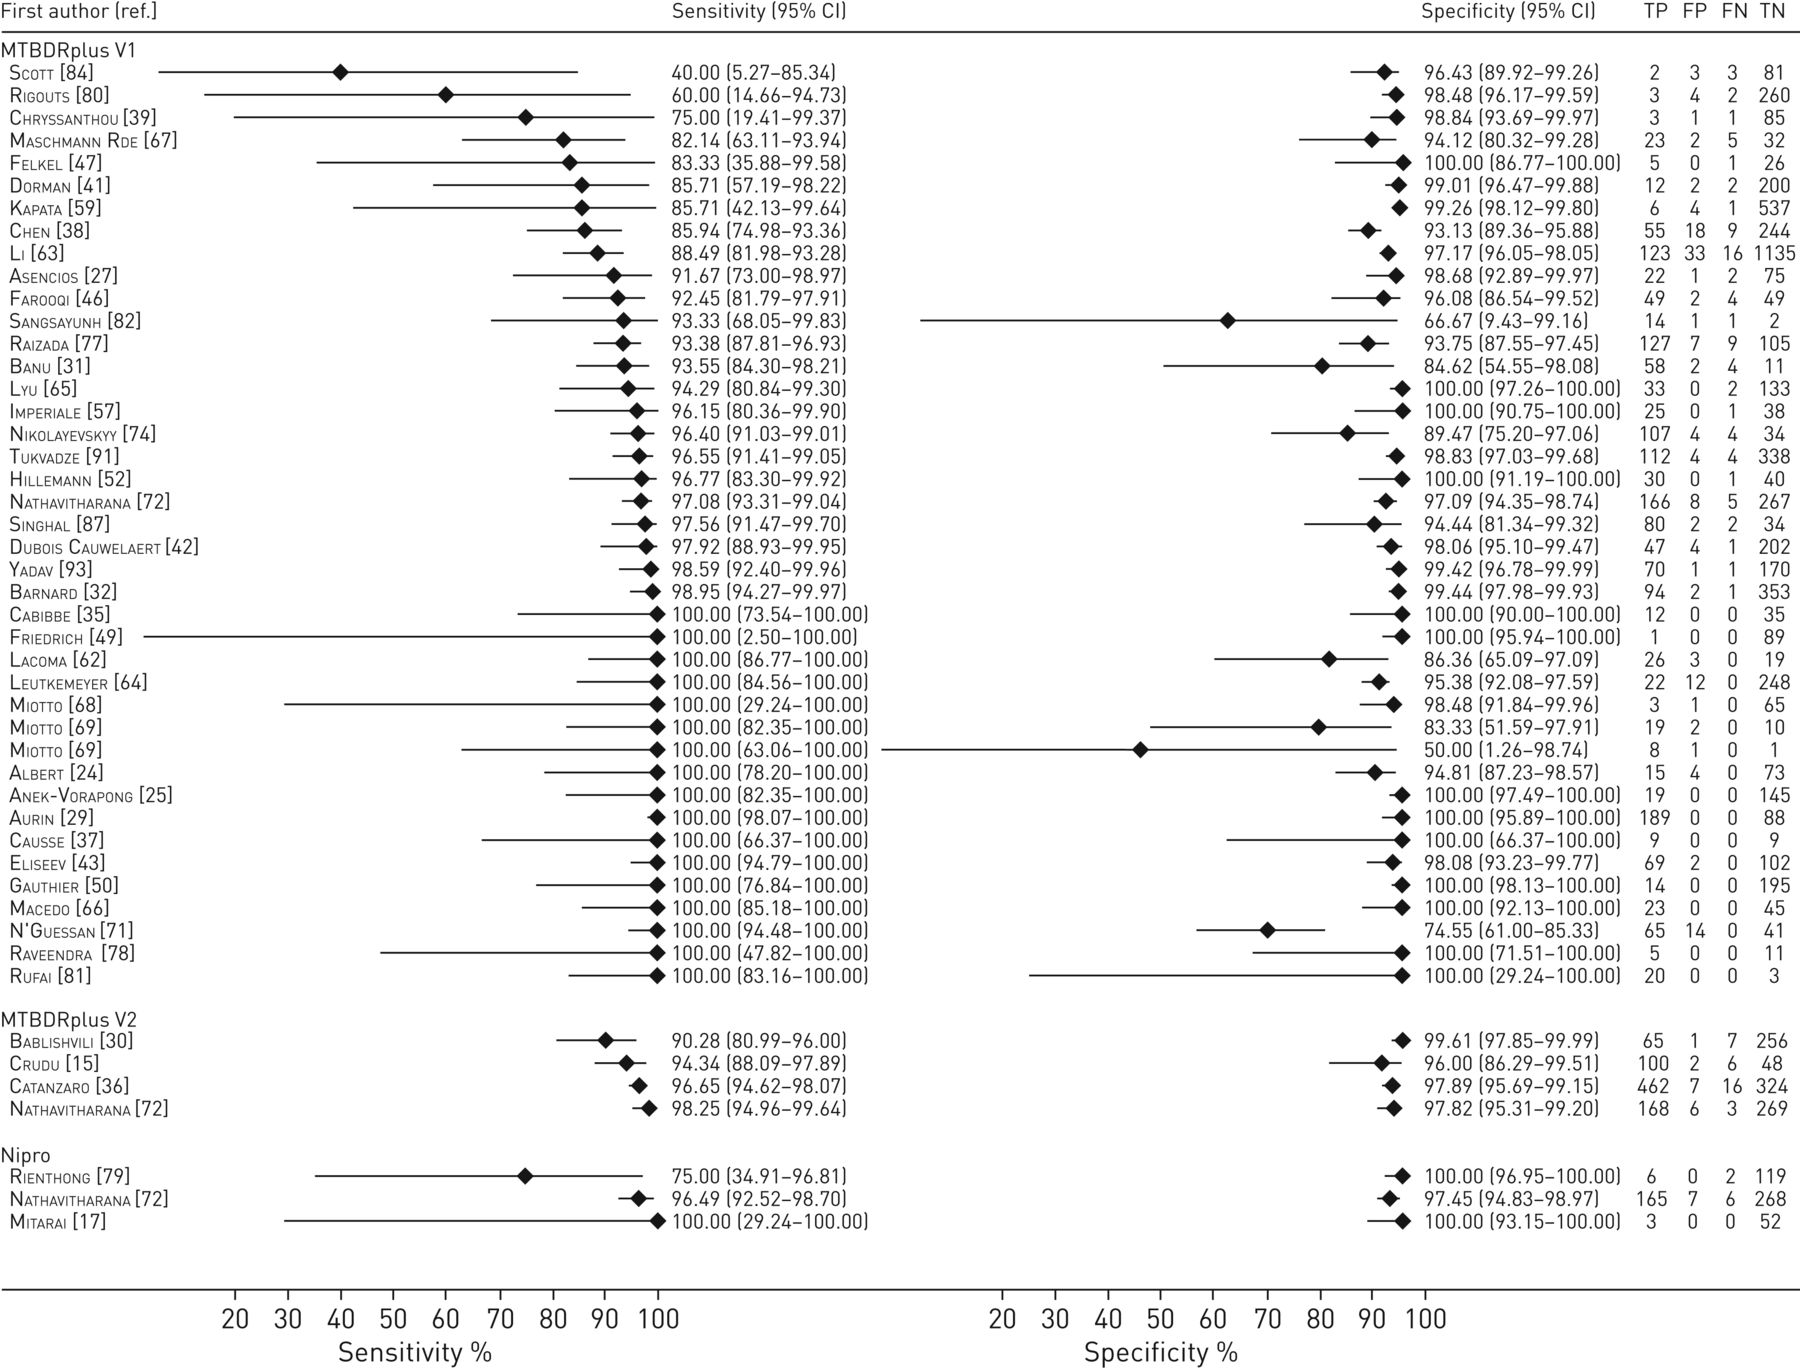
Forest plots demonstrating the sensitivity and specificity of all line probe assays for rifampicin resistance-detection for sputum specimens tested directly compared with phenotypic drug susceptibility testing. TP: true positive; FP: false positive; FN: false negative; TN: true negative.
Indirect testing
43 datasets tested RIF resistance detection with LPA indirectly from isolates, with a total of 10 696 samples that included 3913 (37%) confirmed RIF-resistant tuberculosis cases. The pooled sensitivity was 96.9% (95% CI 95.5–98.0%) and specificity was 99.3% (95% CI 98.6–99.6%) (table 3; and appendix F, figure S8a in the supplementary material). Point estimates for sensitivity for individual studies were even more homogenous than those for direct testing (appendix F, figure S4 in the supplementary material). The reasons for the outlier studies with lower sensitivities were unclear as the populations tested (all-comers versus those with MDR-TB risk) differed in the respective studies [60, 73, 90]. One outlier demonstrated a lower specificity (78.3%, 95% CI 63.6–89.1%) for specimens tested by solid (Löwenstein–Jensen) rather than liquid (Mycobacteria Growth Indicator Tube (MGIT)) culture [70].
Diagnosis of RIF resistance using a composite reference standard
Pooled Analysis for all LPAs on all specimen types
23 datasets contained data comparing LPA with a composite reference standard (using the results from targeted sequencing of either the RIF-resistance determining region or rpoB gene and phenotypic DST), with a total of 5483 samples that included 2091 (38%) RIF-resistant M. tuberculosis cases [17, 23, 26, 41, 45–47, 52–58, 62, 63, 67, 79, 92]. Most studies only performed sequencing on discrepant results, thus results from this analysis may be potentially biased in favour of the LPAs. Bivariate meta-analysis of these studies revealed a pooled sensitivity of 95.3% (95% CI 93.4–96.6%) and specificity of 99.5% (95% CI 98.6–99.8%) (table 3).
Specificity increased when a composite standard was used as 37 LPA “false-positive results” based on comparison to phenotypic DST (from 11 datasets) were reclassified as true positives as sequencing confirmed the presence of known resistance-conferring mutations (appendix F, table S3a in the supplementary material). Of note, the sensitivity was lower in this subset of datasets for which data on a composite reference standard could be derived compared with the overall dataset, which we hypothesise may be due to some selection bias in the studies that performed targeted sequencing alongside phenotypic DST.
Heterogeneity across studies was limited (appendix F, figure S5 in the supplementary material). Maschmann Rde et al. [67] demonstrated a sensitivity of 82.8% and stated that two out of the five specimens incorrectly classified had insertions in codons 516–517 which may have caused hybridisation of the corresponding wild-type probe (wt3 for codons 517–520) and the other three were wild-type on sequencing, suggesting that resistance may be driven by mutations outside of the rpoB hotspot.
Diagnosis of INH resistance using a phenotypic reference standard
Pooled analysis for all LPAs on all specimen types
87 datasets were included in the bivariate analysis, with a total of 20 954 samples that included 8135 (39%) confirmed INH-resistant tuberculosis cases. Meta-analysis revealed a pooled sensitivity of 90.2% (95% CI 88.2–91.9%) and specificity of 99.2% (95% CI 98.7–99.5%) (table 3). Results were moderately heterogeneous for sensitivity, whereas specificity estimates were more homogeneous. Pooled analysis stratified by LPA (appendix F, table S2 in the supplementary material) demonstrated a lower sensitivity for Nipro (86.9%) and higher sensitivity for Hain V2 (93.6%) compared with Hain V1 (90.2%) although specificity was similar (99.1%, 99.1% and 99.2%) respectively.
Direct testing
46 datasets tested INH-resistance detection with LPA directly from specimens against a phenotypic reference standard, with a total of 10 472 samples that included 3576 (34%) confirmed INH-resistant tuberculosis cases. The pooled sensitivity across studies was 89.2% (95% CI 85.8–91.9%) and specificity was 98.4% (95% CI 97.5–98.9%) (table 3, figure 3b). Greater heterogeneity was noted for INH-sensitivity compared with RIF for sensitivity (figure 5). Several outliers had limited numbers of resistant specimens (<10) and were thus accompanied by very wide confidence intervals [17, 31, 82, 84]. Explanations for outlier results included the known geographic variation of mutations and heteroresistance.

Forest plots demonstrating sensitivity and specificity of all line probe assays for isoniazid-resistance detection for sputum specimens tested directly compared with phenotypic drug susceptibility testing. TP: true positive; FP: false positive; FN: false negative; TN: true negative.
Indirect testing
40 datasets tested INH resistance detection with LPA indirectly from isolates against a phenotypic reference standard, with a total of 10 462 samples that included 4559 (44%) confirmed INH-resistant tuberculosis cases. The pooled sensitivity across studies was 91.0% (95% CI 88.6–93.0%), which was higher than seen with direct testing, as was the case for specificity, which was 99.7% (95% CI 99.3–100.0%) (table 3; and appendix F, figure S8b in the supplementary material). Several studies were outliers for sensitivity but specificity was largely homogeneous (appendix F, figure S6 in the supplementary material). Reasons for lower sensitivity include the use of different types of phenotypic DST within a study [17], the presence of less common resistance mutations due to geographic variation and difficulty detecting low-level INH resistance [62]. The outlier for specificity only contained three INH-sensitive strains [90].
Diagnosis of INH resistance using a composite reference standard
Pooled analysis for all LPAs on all specimen types
24 datasets contained data comparing LPA with a composite reference standard, with a total of 4516 samples that included 2346 (52%) INH-resistant M. tuberculosis cases [17, 23, 25, 26, 28, 33, 41, 46, 47, 52–55, 58, 62, 67, 68, 79, 92]. Bivariate meta-analysis of these studies revealed a pooled sensitivity of 85.1% (95% CI 80.8–88.6%) and specificity of 99.9% (95% CI 99.6–100.0%) (table 3). Bivariate analysis of the same 24 datasets compared to phenotypic DST revealed a pooled sensitivity of 85.0% (95% CI 80.5–88.6%) and specificity of 99.5% (95% CI 99.1–99.8%).
Sequencing also revealed resistance mutations that were not detected by LPA (appendix F, table S3b in the supplementary material). For example, 10 of the 11 strains with a rarer katG mutation S315N were not detected in the study by Jin et al. [58] due to the lack of the appropriate mutation probe in the Hain V1 assay and because the wild-type band also failed to disappear. Although seven LPA false-positive results (from six datasets) were reclassified as true positives in total based on sequencing confirming a known resistance mutation (four katG S315T mutations and three inhA c-15t mutations), specificity barely increased when a composite standard was used.
Heterogeneity assessment (appendix F, figure S7 in the supplementary material) demonstrated homogenous results for specificity, which was largely also the case for sensitivity aside from a few outliers. Mitarai et al. [17] demonstrated a specificity of 61.6% (95% CI 52.9–69.7%). Of the 53 isolates incorrectly identified as sensitive by LPA, 24 had a range of rare katG mutations not identified by any of the katG probes, 17 had fabG1 inhA mutations and 12 were identified as wild-type by sequencing. Maschmann Rde et al. [67] demonstrated a sensitivity of 60.4% (95% CI 45.3–74.2%) and reported that all 19 strains misclassified as susceptible on LPA were found to have wild-type katG and inhA genes according to targeted sequencing, indicating that there may have been mutations in other genes associated with INH resistance or efflux systems that could not be detected by the LPA.
Diagnosis of multidrug resistance
Pooled analysis for all LPAs on all specimen types
57 datasets included data on the diagnostic accuracy of LPA for MDR-TB detection, with a total of 13 033 samples that included 4248 (33%) confirmed MDR-TB cases [23–29, 32, 34, 35, 37, 38, 41–44, 48, 50, 52–56, 58–64, 66–69, 71–73, 75, 78, 80, 82, 84, 88, 90, 91, 93]. Bivariate meta-analysis of these datasets revealed a pooled sensitivity of 92.9% (95% CI 90.4–94.8%) and specificity of 99.3% (95% CI 98.7–99.6%) (table 3 and figure 3c). Figure 6 demonstrates homogenous results for specificity aside from a few outliers in which the number of sensitive (non-MDR strains) was <15, which was largely also the case for these sensitivity outliers.

Forest plots demonstrating sensitivity and specificity of all line probe assays for multidrug-resistant tuberculosis detection for both specimen types compared with phenotypic drug susceptibility testing. TP: true positive; FP: false positive; FN: false negative; TN: true negative.
Comparison of diagnostic accuracy from direct versus indirect testing
Based on the analysis of all data, the estimates for sensitivity of LPA for RIF and INH resistance were almost identical for LPA performed directly on sputum specimens and indirectly on culture isolates (96.3% and 96.9% respectively for RIF, 89.2% and 91.0% for INH). Specificity was slightly increased for indirect testing (99.3% compared with 98.2% for RIF, 99.7% compared with 98.4% for INH). The summary point estimates approach the upper left-hand corner of the plots, suggesting good accuracy of LPAs for detection of RIF and INH resistance whether tested directly or indirectly. No studies performed LPA testing on specimens and culture isolates from the same patients precluding direct within-study comparisons.
Diagnosis of pulmonary M. tuberculosis using a culture-based reference standard
Data to answer this question were limited, as the majority of LPA studies identified by our search criteria did not report results for M. tuberculosis detection. Of the 21 datasets that did report data on M. tuberculosis detection, 15 studies were excluded because they either tested patients who were on treatment or did not specify that patients on treatment were excluded.
Six datasets were included in the bivariate analysis [15, 41, 47, 49, 64, 84], with a total of 3451 samples that included 1277 (37%) confirmed M. tuberculosis cases tested directly with LPA. Meta-analysis of datasets that reported both sensitivity and specificity revealed a pooled sensitivity of 85.0% (95% CI 70.0–93.3%) and specificity of 98.0% (95% CI 96.2–99.0%) independent of smear-status (table 4 and figure 3d). Of note, a post hoc bivariate analysis of the 21 datasets (including those that did not exclude patients on treatment) revealed a sensitivity of 94.8% (95% CI 87.8–97.9%) and specificity of 95.7% (95% CI 85.0–98.9%).
Diagnostic accuracy of line probe assays for all three assays for Mycobacterium tuberculosis (MTB) detection
Investigation of heterogeneity
Moderate heterogeneity was seen among the sensitivity estimates for M. tuberculosis detection, which suggests that this pooled estimate has to be considered with caution (figure 7). Possible explanations include testing of a high proportion of smear negatives by Crudu et al. [15] and Dorman et al. [41] (74% and 50% respectively). Scott et al. [84] reported that they used frozen samples for LPA in comparison with fresh samples and used a non-standard protocol for phenotypic DST testing, which may have decreased sensitivity. Specificity estimates were homogeneous.

Forest plots demonstrating the sensitivity and specificity of all the line probe assays evaluated for the diagnosis of pulmonary Mycobacterium tuberculosis compared with culture. TP: true positive; FP: false positive; FN: false negative; TN: true negative.
Primary sub-group analysis by smear status
Five out of six included datasets that evaluated LPA on direct testing of clinical specimens reported smear status and were further evaluated. Two studies only reported on sensitivity and so bivariate meta-analysis was not possible for the other three studies.
Univariate analysis of the smear positive data for all five studies, which accounted for 802 samples, of which 781 were confirmed M. tuberculosis cases, revealed a sensitivity of 94.4% (95% CI 89.4–99.4%). For the three studies that contributed data to specificity, estimates were 50%, 100% and 100% [15, 49, 64]. The specificity of 50% (95% CI 0.01–98.7%) by Crudu et al. [15] represented one out of two M. tuberculosis-negative specimens.
Five studies provided data on M. tuberculosis detection in smear negative cases, which accounted for 961 samples, of which 487 were confirmed M. tuberculosis cases. Sensitivity estimates across the studies ranged from 0% to 76%. Four studies only contributed data to both sensitivity and specificity and a bivariate meta-analysis revealed a pooled sensitivity of 44.4% (95% CI 20.2–71.7%) and specificity of 98.9% (95% CI 95.4–99.7%). The dataset by Friedrich et al. [49] only tested one non-M. tuberculosis smear-negative specimen that was misidentified as M. tuberculosis by LPA. Given the substantial heterogeneity and the small number of studies, these estimates have to be interpreted with caution.
Secondary sub-group analysis by specimen condition
Given the low numbers of datasets reporting information on specimen condition, only a limited analysis was possible. Two datasets performed LPA testing on frozen specimens and reported a sensitivity of 94.7% and 76.1% respectively [47, 84]. Bivariate meta-analysis of the four datasets that performed LPA testing on fresh specimens demonstrated a pooled sensitivity of 83.0% (95% CI 61.9–93.6%). No conclusion could be drawn in regards to the effect of the specimen condition for the sensitivity of the test.
Secondary sub-group analysis by smear grade
It was not possible to perform a sub-group analysis to evaluate smear grade on the accuracy of LPA for M. tuberculosis detection due to the lack of reported data on this variable. Nathavitharana et al. [72] found that smear grade affected indeterminate rates for RIF and INH detection (see section on indeterminate results) and other studies also mentioned that smear grade affected the number of valid results, often resulting in studies only evaluating smear-positive specimens or selecting specimens with the highest smear grade for analysis.
Sensitivity analyses
We assessed whether excluding studies that: selected for MDR-TB risk, used convenience sampling, used a case–control design or did not blind operators (or if studies were unclear on these criteria). These sensitivity analyses made no difference to any of the findings (appendix F, tables S4 and S5 in the supplementary material).
Discussion
Principal findings
For the detection of RIF resistance, pooled bivariate analyses from 21 225 samples (91 datasets) demonstrated a sensitivity of 96.7% and specificity of 98.8%. For the detection of INH resistance, pooled bivariate analyses from 20 954 samples (87 datasets) demonstrated a sensitivity of 90.2% and specificity of 99.2%. Sensitivity and specificity were similar for direct and indirect testing for both RIF and INH. While INH resistance was only detected with moderate sensitivity (90.2%), INH resistance is also highly correlated with RIF resistance in high-burden settings [95] and a negative result in the context of RIF resistance needs to be treated with caution. LPAs demonstrated good sensitivity (92.9%) and high specificity (99.3%) for MDR-TB detection.
For the detection of M. tuberculosis, data were far more limited and results have to be interpreted with caution. Pooled bivariate analyses from 3451 samples (six datasets) demonstrated a sensitivity of 85.0% and specificity of 98.0% on directly tested specimens. Data on smear status were limited. However, our analysis demonstrated that the assay performs well in smear-positive samples (sensitivity 94.4%) but only detects about 44% of cases in smear-negative specimens. This compares with the 67% sensitivity for Xpert MTB/RIF on smear-negative specimens when used as an add-on test [96]. However the smear-negative sensitivity estimate is derived from only four datasets and a univariate analysis that included datasets with patients on treatment provided a higher sensitivity estimate (58%). These estimates must therefore be considered with caution given the substantial remaining heterogeneity observed.
Strengths and limitations of the meta-analysis
Our study includes the largest number of studies (74 studies, 21 225 samples) evaluated as part of a systematic review to assess the diagnostic test accuracy of LPAs for RIF resistance, INH resistance and M. tuberculosis detection. The prior WHO-commissioned systematic review on LPAs in 2008 only assessed detection of multidrug resistance without including accuracy for M. tuberculosis detection. It also evaluated two assays (INNO-LiPA and Hain MTBDR), which did not detect INH resistance due to inhA mutations and are no longer commercially available. Although the majority of datasets included in this study evaluated Hain V1, our analyses included data on Hain V2 and Nipro, which have not previously been reviewed systematically. A recent study demonstrated that the assays are non-inferior in respect to resistance detection, while slightly favouring Hain V2 due to lower indeterminate results on paucibacillary samples [72]. Differences between the index LPAs are therefore more likely to be due to variation in the study populations than due to true differences in accuracy between the tests.
Overall, studies included for the assessment of diagnostic accuracy for RIF and INH resistance were fairly homogeneous. Data from this systematic review reinforces the diagnostic accuracy estimates from the previous systematic review [13] and again demonstrates a greater degree of heterogeneity for INH compared to RIF. This is attributed to INH-resistance mutations being detected in a wider range of genetic loci than for RIF. Other explanations for residual heterogeneity include the predominance of different mutations between datasets due to strain and patient diversity with different mutations being seen in mono-resistant versus MDR strains and heteroresistance also being more common in patients that develop resistance on treatment rather than having transmitted resistance [97, 98]. Furthermore predominant mutations have been described both for INH and RIF resistance that differ by geographic locations [10, 17, 99].
Targeted sequencing was only performed in approximately one-third of studies and often only on discrepant results between LPA and phenotypic DST, which limits the validity of the composite reference standard analysis. Nonetheless, this analysis suggests that decreases in LPA sensitivity are likely due to mutations outside of the probe hotspots or other mechanisms of resistance such as efflux pumps that are also not detected by targeted sequencing. Use of the composite reference standard increased the specificity for RIF and INH resistance detection due to reclassification of some LPA false positives when mutations known to be of clinical significance were detected by LPA but missed by phenotypic DST [100, 101].
Aside from the large number of studies identified, strengths of this study included the use of a standard protocol and predefined analyses using bivariate random-effects models. However, we also recognise some limitations. Despite our comprehensive search strategy, we acknowledge that some relevant studies may have been missed. Publication and selection bias could have resulted in overly optimistic estimates of the diagnostic accuracy of LPAs. Many studies were laboratory based and did not report on the selection criteria of patients. Others included patients that were exposed to MDR-TB patients or already identified as MDR-TB, which may bias the expected pool of mutations detected. If LPAs are utilised more broadly in patients independent of risk factors for drug resistance, then a slightly different pool of mutations and more heteroresistance may impact their sensitivity [97, 98]. Available data for Hain V2 and Nipro were more limited. Further research evaluating the effect of smear status, smear grade and other covariates such as HIV on the diagnostic accuracy of LPAs is needed. A more comprehensive approach to a sequencing reference standard is needed as many studies suffered from bias due to a discrepant analysis. It is also essential for authors of diagnostic accuracy studies to follow the Standards for Reporting Diagnostic accuracy studies (STARD) criteria [102] and QUADAS-2 framework to ensure methodological quality and adequate reporting [103].
Potential clinical and epidemiologic relevance of LPA use in practice
The first pillar of integrated patient-centred care and prevention of the End TB Strategy published by WHO in 2015 [104] states the need for the “early diagnosis of tuberculosis including universal drug susceptibility testing”. This highlights the importance of LPAs for the rapid diagnosis of tuberculosis and multidrug resistance. LPAs are also recommended by the International Standards for Tuberculosis Control (3rd Edition) [105] and represent a widely used assay for the diagnosis of MDR-TB, particularly in settings where there are heightened concerns for INH mono-resistance. This review provides evidence to support the ongoing use of LPAs based on their diagnostic accuracy when used directly on sputum smear-positive specimens or indirectly on culture isolates, as an initial test or in parallel with culture-based DST for the detection of M. tuberculosis and multidrug resistance based on data acquired from a range of laboratory settings in different countries. In low- and middle-incidence countries, LPAs may also serve as a critical tool for tuberculosis elimination efforts as part of laboratory surveillance as well as the prompt diagnosis of tuberculosis including MDR-TB in high-risk groups, such as migrants [106–108].
WHO also released recommendations in support of the use of the shorter MDR-TB regimen [109] in May 2016 [110]. This regimen contains kanamycin, high-dose moxifloxacin, prothionamide (or ethionamide), clofazimine, high-dose INH, pyrazinamide and ethambutol, given together in an initial phase of 4–6 months, followed by 5 months of treatment with moxifloxacin, clofazimine, pyrazinamide and ethambutol. Although the guidelines state that INH resistance does not preclude the use of this regimen, the efficacy of high-dose INH in patients with katG mutations is unclear [111–114] and is currently the subject of an ongoing clinical trial [115]. Similarly, due to cross-resistance, strains with inhA mutations are typically resistant to ethionamide (and also prothionamide) although these patients may benefit from high-dose INH [73]. Therefore patients with katG and/or inhA mutations may potentially have between one and two fewer active drugs in the regimen. Many patients started on the short MDR-TB regimen will have been diagnosed by Xpert MTB/RIF, which does not detect INH resistance, and therefore knowledge of INH resistance mutations obtained from first line LPAs (as evaluated in this study), while not required, may provide additional valuable information to clinicians, provided it does not delay the start of therapy. Although culture-based DST may also provide these answers, this usually takes several weeks and is not frequently done. This highlights a possible adjunctive role for LPAs in the appropriate early management of MDR-TB [116, 117].
Conclusions
In adults with pulmonary tuberculosis, LPAs demonstrated high accuracy overall for the detection of RIF resistance. LPAs demonstrated high specificity for INH resistance detection with good sensitivity. The accuracy of LPAs for M. tuberculosis detection on smear-positive specimens is high, but suboptimal in smear-negative samples. These results were used to inform updated WHO policy recommendations.
Supplementary material
Supplementary Material
Please note: supplementary material is not edited by the Editorial Office, and is uploaded as it has been supplied by the author.
Supplementary material ERJ-01075-2016_Supplementary_material
Acknowledgements
We would like to thank all of the study authors who provided additional data necessary to complete this review. We also wish to thank the following individuals: Julia Whelan and Diane Young from Beth Israel Deaconess Medical Center (Boston, MA, USA) Knowledge Services for assistance with our search strategy and David Dolinger from FIND (Geneva, Switzerland) for assistance regarding the interpretation of certain drug resistance mutations.
Footnotes
This article has supplementary material available from erj.ersjournals.com
Support statement: This systematic review was commissioned by WHO in preparation for a Guideline Development Group meeting in March 2016. CMD and SGS received additional funding from Department for International Development and the Bill and Melinda Gates Foundation. RRN received additional funding through a Scholar Award from the Harvard Center for AIDS Research (NIAID 2P30AI060354-11) and an Imperial College Global Health Institutional Strategic Support Fund fellowship from the Wellcome Trust. PGTC received additional funding though the National Institute of Allergy and Infectious Disease (NIAID) training grant in investigative infectious diseases (5T32AI007517-14). Funding information for this article has been deposited with the Open Funder Registry.
Conflict of interest: None declared.
- Received May 27, 2016.
- Accepted October 11, 2016.
- Copyright ©ERS 2017
This ERJ Open article is open access and distributed under the terms of the Creative Commons Attribution Non-Commercial Licence 4.0.
References


