As the rate of Caesarean sections (CS) continues to rise in Western countries, it is important to analyze the reasons for this trend and to unravel the underlying motives to perform CS. This research aims to assess the incidence and trend of CS in a population-based birth register in order to identify patient groups with an increasing risk for CS.
Methods
Data from the Flemish birth register 'Study Centre for Perinatal Epidemiology' (SPE) were used for this historic control comparison. Caesarean sections (CS) from the year 2000 (N = 10540) were compared with those from the year 2008 (N = 14016). By means of the Robson classification, births by Caesarean section were ordered in 10 groups according to mother - and delivery characteristics.
Results
Over a period of eight years, the CS rise is most prominent in women with previous sections and in nulliparous women with a term cephalic in spontaneous labor. The proportion of inductions of labor decreases in favor of elective CS, while the ongoing inductions of labor more often end in non-elective CS.
Conclusions
In order to turn back the current CS trend, we should focus on low-risk primiparae. Avoiding unnecessary abdominal deliveries in this group will also have a long-term effect, in that the number of repeat CS will be reduced in the future. For the purpose of self-evaluation, peer discussion on the necessity of CS, as well as accurate registration of the main indication for CS are recommended.
The online version of this article (doi:10.1186/1471-2393-12-3) contains supplementary material, which is available to authorized users.
Competing interests
The authors declare that they have no competing interests.
Authors' contributions
ID contributed in the interpretation of data and manuscript drafting. HC contributed to the study design, interpretation of data and manuscript revision. EM contributed in the study design, data acquisition, data analysis and manuscript revision. IT contributed in the study design, interpretation of data and manuscript revision. GM contributed in the study design, data acquisition, data analysis and manuscript revision. MT contributed to interpretation of data and manuscript revision. All authors agree for publication of this final version.
Background
The Caesarean section (CS) rate has been rising through the twentieth century with a substantial increase in the last 30 years. Currently, a Caesarean section rate of 18-20% is recorded in developed countries and is more than 30% in the United States alone [1, 2]. These rates far exceed the 15% that is recommended by the World Health Organization [3]. It is therefore of interest to bring attention to this rising CS-rate, and to better understand the increased pathology in pregnancy and delivery of women in which a uterine scar has been registered. Examples of such pathology are a higher risk of spontaneous abortion, abruption, placenta previa, placenta accrete and rupture [3, 4]. Although the risk for maternal death is low in developed countries and maternal mortality associated with CS has decreased substantially over time, the hazard of this obstetrical outcome is still doubled (or more) after (elective) CS [4, 5]. In addition, abdominal delivery goes hand in hand with a higher risk of operative complications (infections, haemorraghia, visceral injury, thromboembolism) and psychological problems in the postpartum period [3, 4].
Our research aims to assess the incidence and trend of CS in a low-risk population and to better understand the rationale of the increase of abdominal deliveries in this population. Only when these questions are answered, can there be approaches instituted to level or adjust the rising trend in CS rates.
Anzeige
Methods
The Study Centre for Perinatal Epidemiology (SPE) is a birth register which collects data on every birth in Flanders (Northern and Flemish speaking region of Belgium) [6]. This data collection occurs anonymously and is population-based, as all 72 Flemish maternity units cooperate. Next to permanent registration of perinatal data, another important objective of the SPE is evaluation of perinatal care in order to inform hospitals about their policy and to stimulate quality of care improvement. Registration started in 1987, in December 2009 there were in total 1,378,873 deliveries of children with a birth weight of minimum 500 grams included in the database. For this study, we included all live born children (birth weight > 500 grams) delivered by caesarean section in the year 2000 or 2008. Data from 2004 are included in order to monitor for deviations from the trend within this timespan.
The study design has been approved from the Ethical Committee of the University Hospital Ghent.
In order to range the SPE-population in subgroups, the Robson classification was used (Robson 1996). Within the Robson 10-group classification, Caesarean sections are ordered according to characteristics of patients and their deliveries, rather than to the indication for CS (see table 1). As such, the different obstetric populations requiring CS are classified and comparison of CS rates among these populations is possible. This classification is engaging, in that all possible deliveries are prospectively identifiable in order to improve outcomes in the same patients in the future; furthermore the classification is totally inclusive and mutually exclusive. Obstetric concepts and parameters used to group women in the ten-group classification are: category of pregnancy, previous obstetric record, course of labor and delivery and gestational age [7].
Table 1
The Robson 10 - group classification
Group 1
Nulliparous, single cephalic, ≥ 37 weeks, in spontaneous labor
Group 2
Nulliparous, single cephalic, ≥ 37 weeks, induced or CS before labor
Group 3
Multiparous (excluding prev. CS), single cephalic, ≥ 37 weeks, in spontaneous labor
Group 4
Multiparous (excluding prev. CS), single cephalic, ≥ 37 weeks, induced or CS before labor
Group 5
Previous CS, single cephalic, ≥ 37 weeks
Group 6
All nulliparous breeches
Group 7
All multiparous breeches
Group 8
All multiple pregnancies (including prev. CS)
Group 9
All abnormal lies (including prev. CS)
Group 10
All single cephalic, ≤ 36 weeks (including prev. CS)
With the use of Robson classification, only SPE - data from 2000 on could be included, since 'history of a previous CS' was included as a variable in the database from 2000 onwards.
Anzeige
Elective Caesarean section is defined as a section which was planned before admission of the patient to the hospital (pre-labor section). A non - elective Caesarean section is a section for which there were initially no indications, but CS occurred due to complications after onset of labor (CS in labor).
Results
Patient characteristics
Relevant and available characteristics of patients, their pregnancy and delivery are depicted in table 2. Although the percentage of multiple pregnancies is comparable in both study years, the incidence of malpresentations is higher in 2008 (5.9% versus 4.9% in 2000). Mean gestational age at birth remained stable at 38.7 weeks in both years. Whereas no differences in mean birth weight are found throughout the years (3294 grams in 2000, 3309 grams in 2008), the percentage of vaginal deliveries (including vaginal breech deliveries) as well as vacuum extractions and the use of the forceps have all decreased in the study period in favor of Caesarean sections, with equal augmentations in primary CS and secondary CS. Even though the permillages of both fetal death and neonatal death are lower in 2008, no significant difference was found between both years. A lower incidence of multiple pregnancies is noticeable in 2004. This is due to the introduction of a government measure in 2003 in order to stimulate the use of single embryo transfer in assisted reproduction [8].
Table 2
Patient, pregnancy and delivery characteristics
2000
2004
2008
OR (95% CI)
2000 - 2008
Patient and pregnancy characteristics
60993
women
61647
women
68199
women
Primiparae aged 35 or older
5.2%
6.6%
7.6%
1.50 (1.43 - 1.57)***
Multiparae aged 35 or older
15.9%
18.4%
20%
1.32 (1.28 - 1.36)***
Parity
First child
46.7%
47.8%
46.9%
1.01 (0.99 - 1.03)
Second child
34.2%
33.5%
34.9%
1.03 (1.01 - 1.06)**
Third child
12.7%
12.5%
12.2%
0.96 (0.92 - 0.99)**
Assisted Reproduction
Assisted induction of ovulation
1.7%
2.1%
2.1%
1.24 (1.14 - 1.35)***
Assisted Reproductive Technology (In vitro fertilisation and Intra Cytoplasmic Sperm Injection)
1.7%
2.3%
3.3%
1.97 (1.83 - 2.13)***
Twin pregnancies
1.80%
1.61%
1.83%
1.02 (0.94 - 1.10)
Hypertension during pregnancy
4.9% (2002)
4.8%
4.8%
0.98 (0.93 - 1.03)
Diabetes during pregnancy
1.2% (2002)
1.4%
1.8%
1.51 (1.38 - 1.66)***
Induction of labor
30.3%
27.6%
25.3%
0.78 (0.76 - 0.80)***
Preterm birth (GA < 37 weeks)
7.1%
7.5%
7.4%
1.05 (1.00 - 1.09)*
Delivery characteristics
62 128
births
62657
births
69470 births
Presentation
Vertex
95.0%
94.3%
94.1%
0.84 (0.80 - 0.88)***
Breech
4.6%
5.2%
5.4%
1.18 (1.13 - 1.25)***
Other
0.3%
0.5%
0.5%
1.67 (1.39 - 2.01)***
Low birth weight (< 2500 gr)
6.8%
6.9%
6.9%
1.02 (0.97 - 1.06)
Vaginal cephalic delivery
71.2%
69.8%
69.3%
0.91 (0.89 - 0.94)***
Vaginal breech delivery
0.5%
0.5%
0.3%
0.60 (0.50 - 0.72)***
Vacuum extraction
11.2%
9.7%
9.5%
0.83 (0.80 - 0.86)***
Forceps
1.3%
0.9%
0.8%
0.61 (0.55 - 0.68)***
Caesarean sections
16.4%
18.3%
19.5%
1.23 (1.20 - 1.27)***
Elective C - section
9.2%
10.8%
11.2%
1.24 (1.20 - 1.29)***
Unplanned C - section
6.6%
7.4%
8.2%
1.26 (1.21 - 1.32)***
Perinatal mortality
6.7‰
6.4%
6.2‰
0.92 (0.80 - 1.06)
Foetal death
4.4 ‰
4.3‰
4.3 ‰
0.98 (0.83 - 1.16)
Neonatal death
2.3 ‰
1.8‰
1.9 ‰
0.83 (0.65 - 1.06)
*P < 0.05, **P < 0.01, ***P < 0
The Robson 10 - group classification
Tables 3 en 4 shows the 10-group classification according to Robson. We compared the 10-groups for the years 2000 with those of the year 2008 in table 3. In order to picture the trend over those years, the classification of the year 2004 is provided in table 4. Columns 3 and 7 show the number of CS for the total number of births in each group for the years 2000 and 2008 respectively. The relative value of groups in total births (columns 4 and 8) is calculated by dividing the number of births in each group by the total obstetric population for the given year and expresses the 'importance' or 'weight' of each group in the total population. The next (fifth and ninth) column shows the CS rate in each group and represents the fractions as depicted in columns 3 and 7. The 'contribution per group' columns (columns 6 and 10) show the percentage contribution by each group to the overall birth rate (number of CS/total obstetric population for the given year). This classification allows assessing which groups contribute more to the overall section rate.
Table 3
Robson's 10-group classification of Flemish women giving birth in 2000 or 2008
2000
2008
Δ Caesarean sections (%)
(2008 - 2000)
Δ contribution per group (2008 - 2000)
1.
2.
3.
4.
5.
6.
7.
8.
9.
10.
11.
12.
Columns/groups
Number of CS/Total births
Relative value group in total births (%)
Caesarean sections (%)
Contribution per group (%)
Number of CS/Total births
Relative value group in total births (%)
Caesarean sections (%)
Contribution per group (%)
1.
Nulliparous, single cephalic, ≥ 37 weeks, in spontaneous labor
1036/15316
24.7
6.8
1.7
1635/18571
26.7
8.8
2.4
2.0
0.7
2.
Nulliparous, single cephalic, ≥ 37 weeks, induced or CS before labor
2087/8843
14.2
23.6
3.4
2576/8793
12.6
29.3
3.7
5.7
0.3
3.
Multiparous (excluding prev. CS), single cephalic, ≥ 37 weeks, in spontaneous labor
233/16568
26.7
1.4
0.4
295/18688
26.9
1.6
0.4
0.2
/
4.
Multiparous (excluding prev. CS), single cephalic, ≥ 37 weeks, induced or CS before labor
804/9505
15.3
8.5
1.3
707/8451
12.2
8.4
1.0
-0.1
- 0.3
5.
Previous CS, single cephalic, ≥ 37 weeks
2127/3409
5.5
62.4
3.4
3372/5369
7.7
62.8
4.8
0.4
1.4
6.
All nulliparous breeches
1451/1642
2.6
88.4
2.3
1792/1882
2.7
95.2
2.6
6.8
0.3
7.
All multiparous breeches
765/1125
1.8
68.0
1.2
1049/1241
1.8
84.5
1.5
16.5
0.3
8.
All multiple pregnancies (including prev. CS)
1079/2253
3.6
47.9
1.7
1441/2558
3.7
56.3
2.1
8.4
0.4
9.
All abnormal lies (including prev. CS)
188/200
0.3
94.0
0.3
171/180
0.3
95.0
0.2
1.0
- 0.1
10.
All single cephalic, ≤ 36 weeks (including prev. CS)
770/3264
5.3
23.6
1.2
978/3800
5.5
25.7
1.4
2.1
1.4
TOTALS
10540/62125
17.0
14016/69533
20.2
3.2
Table 4
Robson's 10-group classification of Flemish women giving birth in 2004
2004
1.
2.
3.
4.
5.
6.
Columns/groups
Number of CS/Total births
Relative value group in total births (%)
Caesarean sections (%)
Contribution per group (%)
1.
Nulliparous, single cephalic, ≥ 37 weeks, in spontaneous labor
1214/16806
26.8
7.2
1.9
2.
Nulliparous, single cephalic, ≥ 37 weeks, induced or CS before labor
2298/8509
13.6
27.0
3.7
3.
Multiparous (excluding prev. CS), single cephalic, ≥ 37 weeks, in spontaneous labor
238/16041
25.6
1.5
0.4
4.
Multiparous (excluding prev. CS), single cephalic, ≥ 37 weeks, induced or CS before labor
718/8521
13.6
8.4
1.1
5.
Previous CS, single cephalic, ≥ 37 weeks
2739/4310
6.9
63.5
4.4
6.
All nulliparous breeches
1560/1650
2.6
94.5
2.5
7.
All multiparous breeches
823/1115
1.8
82.8
1.5
8.
All multiple pregnancies (including prev. CS)
1075/2029
3.2
53.0
1.7
9.
All abnormal lies (including prev. CS)
168/178
0.3
94.4
0.3
10.
All single cephalic, ≤ 36 weeks (including prev. CS)
889/3501
5.6
25.4
1.4
TOTALS
11818/62654 (18.9%)
Our results show an increase of the CS rate in all groups, except in the group of multiparous women with a term single cephalic pregnancy (group 3) which remains more or less stable. The most notable rise is detected in women with previous sections (group 5) and in nulliparous term women in spontaneous labor of a single cephalic (group 1). In multiple pregnancies (group 8), there is an obvious lower threshold in 2008 to perform a CS compared with the year 2000. In 2000, groups 2, 5 and 6 contribute most to the CS- rate; in 2008 the dominance of group 5 (repeat CS) is notable, the group of nulliparous women with induction or elective CS is the second - most important and the third place is shared by group 1 (lowest - risk group) and group 6. As a consequence the group of term nulliparous women with a singleton cephalic in spontaneous labor contribute as much to the CS - rate as the group with nulliparous breech presentations. Conversely, there is no 100% CS - rate in group 9 (abnormal lies), this can be explained by the high preterm birth rate in this group. Groups 1 to 4 represent uncomplicated pregnancies; in 2000 this group represented 80.9% of total deliveries, while in 2008 there was a slight increase (88.4%). This implicates a increase in the percentage of low - risk patients. When the magnitude of rise in contributions per group is calculated, a 41% rise is detectable in both groups 1 and 5.
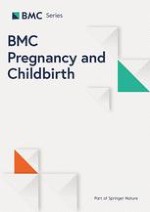
Details of mode of delivery in the low-risk populations are depicted in Figure 1 and 2 (for 2004). Low-risk deliveries are defined as deliveries in primipare women, who deliver from a term live born singleton without malformations in vertex presentation with a birth weight between 3000 and 4000 grams. Figure 1 shows an important reduction of instrumental deliveries in the advantage of natural vaginal deliveries, but more notably in favor of the non - elective CS - rate.
Figure 1
Mode of delivery in low risk deliveries in Flanders (2000 and 2008).
Figure 2
Mode of delivery in low risk deliveries in Flanders (2004).
×
×
In table 5 CS - rates according to different maternal age groups are illustrated. There is a relative increase of the CS - rate in all age groups, but no statistical significant rise in risk - groups (teenage mothers or women of advanced age). In the age group 20-34 years, a significant increase of the CS - rate is found.
Table 5
Trend in maternal age (2000, 2004 and 2008, low risk patients only
2000
2004
2008
OR (95% CI)
Maternal age
Total deliveries
C - section
%
Total deliveries
C - section
%
Total deliveries
C - section
%
< 20 years
727
52
7.2
633
56
8.8
693
57
8.2
1.16 (0.77 - 1.75)
20-24 years
3829
377
9.8
3877
412
10.6
3776
476
12.6
1.36 (1.18 - 1.58)
25-29 years
8005
863
10.8
7846
853
10.9
8512
1072
12.6
1.19 (1.08 - 1.31)
30-34 years
3343
458
13.7
4116
619
15.0
4221
677
16.0
1.20 (1.05 - 1.37)
35-39 years
689
127
18.4
965
181
18.8
1073
241
19.6
1.08 (0.84 - 1.39)
≥ 40 years
68
18
26.5
132
38
28.8
157
57
36.3
1.58 (0.81 - 3.12)
The trend of inductions of delivery is depicted in table 6. In 2000, 33% of all deliveries were induced; in 2008 this proportion decreased to 27.7%. However, the percentage of CS after induction increased from 13.2 to 17.9%. Particularly in gestational weeks 39, 40 and 41, there was an increase in failure of induction.
Table 6
Trend in induction of delivery (2000, 2004 and 2008, low risk patients only)
2000
2004
2008
OR (95% CI)
2004-2008
Gestational age
Total deliveries
Induction
CS in induced deliveries
%
Total deliveries
Induction
CS in induced deliveries
%
Total deliveries
Induction
CS in induced deliveries
%
37 weeks
833
230
22
9,6
796
154
32
20.8
869
192
28
14,6
0.62 (0.33-1.17)
38 weeks
2486
659
79
12,0
2583
634
101
15.9
2903
657
103
15,7
0.73 (0.53-1.02)
39 weeks
4821
1244
135
10,8
5030
1070
144
13.5
5737
1062
163
15,3
0.67 (0.52-0.86)***
40 weeks
6823
2337
307
13,1
6702
1983
317
16.0
7058
1890
340
18,0
0.69 (0.58-0.82)***
41 weeks
2077
1077
177
16,4
2334
1273
215
16.9
2739
1499
307
20,4
0.76 (0.62-0.94)*
42 weeks
105
65
19
29,3
123
82
22
26.8
110
74
21
28,4
1.04 (0.47-2.32)
Totals
17145
5612
739
13,2
17568
5196
831
16,0
19416
5374
962
17,9
Comparison between the hospital with lowest Caesarean section rate and the hospital with highest Caesarean section rate
Differences in CS rates between the hospital with the lowest rate of abdominal delivery (hospital A) and the hospital with the highest rate (hospital B) are depicted in table 7. In general, there is a three times higher Caesarean section rate in the hospital with the highest rate (which is not a university hospital) when compared to the hospital with the lowest rate (26.3% versus 9.1%); looking at the low-risk pregnancies only (groups 1 and 2), a five times higher CS rate is found (24.6% versus 4.6%). Because of the historically low CS rate in hospital A, the relative value of group 5 is considerably lower in this hospital when compared with hospital B (1.6% versus 9.1%). The differences in CS percentage in the breech - presentation groups (6 and 7) are notable as well.
Table 7
Robson's 10 - group classification of hospital with lowest c - section rate (A) and hospital with highest c - section rate (B) in Flanders (2000 and 2008)
Hospital A: lowest c - section rate (2000 - 2008)
Hospital B: highest c - section rate (2000 - 2008)
Δ Caesarean sections (%)
(hospital highest rate - hospital lowest rate)
Δ contribution per group (hospital highest rate - hospital lowest rate)
1.
2.
3.
4.
5.
6.
7.
8.
9.
10.
11.
12.
Columns/groups
Number of CS/Total births
Relative value group in total births (%)
Caesarean sections (%)
Contribution per group (%)
Number of CS/Total births
Relative value group in total births (%)
Caesarean sections (%)
Contribution per group (%)
1.
Nulliparae, singleton, head presentation, ≥ 37 weeks, spontaneous labor
77/2033
37.2
3.8
1.4
234/1575
23.1
14.9
3.4
11.1
2.0
2.
Nulliparae, singleton, head presentation, ≥ 37 weeks, induction or primary section
Multiparae, singleton, head presentation, ≥ 37 weeks, induction or primary CS
48/564
10.3
8.5
0.9
89/1202
17.6
7.4
1.3
-1.1
0.4
5.
Previous CS, singleton, head presentation, ≥ 37 weeks
55/85
1.6
64.7
1.0
466/634
9.3
73.5
6.8
8.8
5.8
6.
All breech presentations, nulliparae
93/125
2.3
74.4
1.7
169/174
2.5
97.1
2.5
22.7
0.8
7.
All breech presentations, multiparae
43/91
1.7
47.3
0.8
108/129
1.9
83.7
1.6
36.4
0.8
8.
All twins or HOM, previous CS inclusively
53/158
2.9
33.5
1.0
116/191
2.8
60.7
1.7
27.2
0.7
9.
All transverse presentations, previous CS inclusively
7/8
0.1
87.5
0.1
17/18
0.3
94.4
0.2
6.9
0.1
10.
All singletons, head presentations, ≤ 36 weeks, previous CS inclusively
35/235
4.3
14.9
0.6
84/310
4.5
27.1
1.2
12.2
0.6
TOTALS
497/5459
9.1
1792/6824
26.3
17.2
Anzeige
While there is a balanced contribution of the first 5 groups (4.9%) and the last 5 groups (4.2%) in hospital A, the balance in hospital B gravitates towards the lowest - risk groups (18.9% versus 7.2%). In hospital A, there was a perinatal death rate of 3.63 ‰, compared to 4.97 ‰ in hospital B.
Trends in perinatal death
Fetal well-being is one of the main reasons to proceed to Caesarean section. Reasons for perinatal death are registered accurately in our database as this parameter is one of the most important for perinatal outcomes. Table 8 shows a slight increase in the total absolute number of perinatal deaths in 2008, but a non - significant relative decrease (6.2‰ versus 6.7‰ in 2000). In general, it can be said that the 3% rise in CS in the studied period did not result in a substantial increase of perinatal survival, although there were 8 more perinatal deaths due to asphyxia in 2000 when compared with 2008 (7.7% in 2000 versus 5.6% in 2008). The most remarkable changes in perinatal mortality are found in the categories 'intra - uterine death of a normal fetus' 111 infants in 2008 versus 88 in 2000) and 'low birth weight' (52 infants in 2008 versus 39 in 2000).
Table 8
Reasons for perinatal death in the SPE - population (2000, 2004 and 2008)
2000
2004
2008
Δ
OR (95% CI)
Total
418 (6.7‰)
398
(6.4‰)
431 (6.2‰)
+ 13
(- 0.5‰)
0.92 (0.80-1.06)
Intra - uterine death of a normal fetus
21.1%
21.9
25.7%
+ 4.6
1.30 (0.93-1.81)
Congenital malformations
23.7%
25.8
24.8%
+ 1.1
1.06 (0.77-1.47)
Low birth weight
9.3%
11.7
12.0%
+ 2.7
1.33 (0.84-2.12)
Hypertension or other illness of the mother
1.0%
1.8
1.6%
+ 0.6
1.71 (0.45-6.99)
Abruptio placentae
7.9%
3.3
5.3%
- 2.6
0.66 (0.37-1.18)
Asphyxia/trauma of the child
7.7%
5.4
5.6%
- 2.1
0.71 (0.40-1.27)
Specified cause
15.0%
16.1
13.2%
- 1.8
0.86 (0.57-1.29)
Unknown
12.0%
14.0
11.3%
- 0.7
0.94 (0.61-1.47)
Discussion
Our results illustrate that the rate of CS is particularly rising in the lowest risk population: term primiparae with a singleton in cephalic presentation. In 2008, the group of term nulliparous women with a singleton cephalic in spontaneous labor contributed as much to the CS - rate as the group with nulliparous breech presentations. The contribution of repeat CS to the overall rate was already considerable in 2000; however, in 2008 the contribution of this group is manifest. Since the incidence of abdominal delivery keeps rising in the low-risk group, this trend is not expected to turn. Furthermore, the proportion of inductions of labor decreased in favor of elective CS, in the meanwhile inductions of labor more often end in non-elective CS as well.
The impact of changing trends in the patient population
Changing trends in mode of delivery may be a reflection of associated changes in the patient population. Assessment of our patient populations demonstrates increasing proportions of women of advanced age and elevated use of assisted reproduction. However, multiple regression analysis did not indicate these parameters to have a large impact on our results.
Anzeige
Our dataset did not allow to adjust for CS due to maternal request or the impact of maternal obesity, which is a shortcoming.
The impact of hospital policy
Our comparison between the Flemish hospital with the lowest and highest abdominal deliveries shows that hospital policy has an essential impact on CS rate. A lot of studies consider a Caesarean section rate of 15% as the most optimal. This cut-off is based on the prevalence of maternal complications which could be effectively addressed by advanced levels of care including (but not limited to) Caesarean section [3]. This rate is recommended to ensure maternal safety, so maybe there should be space for discussion and reconsideration whether the 15% rate is not too narrow to guarantee both maternal and fetal safety. According to Robson (2001), the question is not whether CS rates are too high or too low, but rather whether abdominal deliveries are performed when appropriate or not in a given circumstance. For Robson, a CS is convenient when the information is available to explain and justify it [7]. Brennan et al. [9] compared Caesarean delivery rates between nine institution of different countries. Their results showed significant variability in overall CS rates across the centers. These variations were largely explained by variations in spontaneously laboring term nulliparae.
It would be of interest to account for obstetrician characteristics (age, experience in vaginal breech deliveries, etc.) in future studies.
Complications of CS, in the aftermath and in future reproduction
Complications for the following pregnancy include a higher incidence of placenta previa and accrete (of which the risk is greater than 60% in women who have had four or more abdominal deliveries). On the shorter term, there are more thromboembolic problems and infections after CS [10]. Mother - child acquaintance is postponed after CS, in that standard admission to neonatal care is more common [3], which introduces to health - economical considerations. The health economical aspect of the abdominal delivery has escaped extended research so far, notwithstanding CS to be the operation most often performed in Western countries [11]. With longer hospital stays for both mother and child plus the additional complications, it may be assumed that abdominal delivery is the less economical option.
Anzeige
Conclusion
Results of this study show that if we want to bring the rising CS rate to a halt, we must concentrate on low-risk primipare women. Refraining first elective sections will have an impact on repeat sections in the future as well. According to Scott (2002), elective CS may not be compared with other elective surgery, in that the latter does not influence the reproductive future of a patient. Minkoff et al. (2003) referred to the longer life expectancy of women and decreased child wish in order to promote (elective) CS. As women live longer, long - term complications such as pelvic floor problems are more important; while there is less concern about the risk of repeated procedures with a lower fertility rate. Such rationale may be a hazardous basis for professional guidelines, since fertility rates are not constant over time and borders. In Flanders, couples currently tend to have two children or more
Robson achieved success with his hospital - based audits in order to draw back the CS rate. In these audits, appropriateness of individual elective CS is discussed within the medical team. This mode of operation has been outlined by other authors as well [10, 12]. The audit of the van Dillen study resulted in a 18.7% section rate (in total of 1221 deliveries), which was a 5% decrease compared with the period prior to the audit. In 24.4% of cases, discussion about necessity was carried out. Also the audits illustrated in the other studies, resulted in a lower CS rate.
Next to peer discussion about necessity, Robson recommends accurate registration of both numbers and indications for abdominal delivery whereby one main indication should be registered rather than a list of indications [7].
In conclusion, although elective Caesarean section may appear a safe option in the short term; the long term consequences should also be considered. Every elective abdominal delivery in a nullipare woman should be considered as a hallmark for her reproductive future and as such should be considered thoroughly and preferably in a discussion with peers.
Acknowledgements and Funding
Ilse Delbaere is holder of a Fund for Researchers from the FWO (Fonds Wetenschappelijk Onderzoek). The authors wish to thank Thomas O'Leary for language revision.
This article is published under license to BioMed Central Ltd. This is an Open Access article distributed under the terms of the Creative Commons Attribution License (http://creativecommons.org/licenses/by/2.0), which permits unrestricted use, distribution, and reproduction in any medium, provided the original work is properly cited.
Competing interests
The authors declare that they have no competing interests.
Authors' contributions
ID contributed in the interpretation of data and manuscript drafting. HC contributed to the study design, interpretation of data and manuscript revision. EM contributed in the study design, data acquisition, data analysis and manuscript revision. IT contributed in the study design, interpretation of data and manuscript revision. GM contributed in the study design, data acquisition, data analysis and manuscript revision. MT contributed to interpretation of data and manuscript revision. All authors agree for publication of this final version.