


Abstract
Available evidence shows an association of vitamin D with androgen levels in men. However, results from preliminary randomized controlled trials (RCTs) are conflicting.
To evaluate whether vitamin D supplementation increases total testosterone (TT) levels in healthy men.
The Graz Vitamin D&TT-RCT is a single-center, double-blind, randomized, placebo-controlled trial conducted between December 2012 and January 2017.
Endocrine outpatient clinic at the Medical University of Graz, Austria.
Ninety-eight healthy men with TT levels ≥10.4 nmol/L and 25-hydroxyvitamin D [25(OH)D] levels <75 nmol/L completed the study.
Subjects were randomly assigned to receive 20,000 IU/wk of vitamin D3 (n = 50) or placebo (n = 50) for 12 weeks.
Primary outcome was TT measured using mass spectrometry. Secondary outcomes were free testosterone, sex hormone-binding globulin, estradiol, follicle-stimulating hormone, and luteinizing hormone levels; free androgen index; metabolic characteristics; and body composition.
In healthy men [mean values ± standard deviation: age, 39 years (±13 years); 25(OH)D level, 53.3 nmol/L (±18.3 nmol/L); TT, 19.1 nmol/L (±5.6 nmol/l)], no significant treatment effect on TT was found; however, there were significant effects on quantitative insulin sensitivity check index (QUICKI) and a trend toward decreased Matsuda index. In the treatment group, median (interquartile range) changes for TT, QUICKI, and Matsuda index were 0.5 nmol/L (−0.63 to 0.63 nmol/L; P = 0.497), −0.02 (−0.04 to 0.01; P = 0.034), and −0.9 (−3.2 to 0.8; P = 0.051), respectively.
Vitamin D treatment had no effect on TT levels in middle-aged healthy men with normal baseline TT, but it significantly decreased QUICKI. Additional studies investigating vitamin D effects on TT and insulin sensitivity in healthy men are required.
Vitamin D deficiency is considered an important public health problem (1). Beyond the well-known relationship between vitamin D deficiency and musculoskeletal diseases, evidence is accumulating that vitamin D deficiency is also a risk marker for insulin resistance (2), cardiovascular disease (3), infectious and autoimmune diseases (4), cancer (5), and increased mortality risk (1). Similarly, several lines of evidence suggest that low testosterone levels are associated with adverse events including higher cardiovascular and all-cause mortality (6–9). Interestingly, men with combined vitamin D and androgen deficiencies are at high risk for all-cause and cardiovascular mortality, suggesting that a parallel deficiency of both hormones is a powerful marker of poor health (10).
The vitamin D receptor (VDR) regulates about 3% of the human genome and is almost ubiquitously expressed in human cells, which underlines the clinical significance of the vitamin D endocrine system (1, 4, 11). VDR and vitamin D metabolizing enzymes are concomitantly expressed in the reproductive male tract, including Leydig cells (12), suggesting a potential role of vitamin D in the production of male reproductive hormones. This notion is supported by an association of vitamin D and androgen levels in men suggested by previous studies (13–15). However, several recent studies among young and healthy men failed to find an association of vitamin D and androgen levels (16, 17). Furthermore, evidence from preliminary randomized controlled trials (RCTs) revealed conflicting results. We previously found a significant increase of androgen levels after vitamin D supplementation in obese men undergoing weight reduction (18), whereas other studies did not find a significant vitamin D effect on total testosterone (TT) (19, 20).
Therefore, we designed the Graz Vitamin D and Total Testosterone Randomized Clinical Trial (Graz Vitamin D&TT-RCT) to investigate the effects of vitamin D supplementation on TT concentrations in men.
Methods
Study design
The Graz Vitamin D&TT-RCT is a single-center, randomized, double-blind, placebo-controlled trial conducted at the Medical University of Graz, Graz, Austria. The trial was designed to investigate the effect of vitamin D supplementation (12 weeks) on TT levels in men. To further investigate a possible short-term effect of vitamin D treatment, we performed an additional study visit after 4 weeks of vitamin D supplementation. The Graz Vitamin D&TT-RCT examines vitamin D effects in 100 men with normal TT levels as well in 100 men with low TT levels (recruitment is ongoing; study end expected later in 2017).
The design, conduction, and publication of this study adhere to the recommendations of the Consolidated Standards of Reporting Trials Statement. The study was performed in accordance with the Good Laboratory Practice, Good Clinical Practice guidelines, and the Declaration of Helsinki. The trial was registered at http://www.clinicaltrialsregister.eu (EudraCT no. 2011-003575-11) and at clinicaltrials.gov (ClinicalTrials.gov no. NCT01748370). The study protocol was approved by the ethics committee of the Medical University of Graz (EK 23-513 ex 10/11) and written informed consent was obtained from each participant before entering the study.
Subjects
Eligible study participants were men ≥18 and <70 years old with 25-hydroxyvitamin D [25(OH)D] levels <75 nmol/L and TT levels ≥10.4 nmol/L. To obtain a relatively homogenous group of men with TT levels in the normal range, we used ≥10.4 nmol/L as cutoff value, which is the cutoff used in the Boston Area Community Health Survey (21) to define hypogonadism but is slightly higher than that used by the local university laboratory. Exclusion criteria were hypercalcemia (serum calcium level >2.65 mmol/L); oral or transdermal testosterone supplementation in the last 2 months before entering the study; intramuscular testosterone supplementation 6 months before entering the study; regular intake of vitamin D supplements before study entry; chronic diseases (such as diabetes mellitus), thyroid disease, endocrine disturbances in need of treatment, or diseases known to interfere with vitamin D intake or sensitive to vitamin D intake (including inflammatory diseases with granuloma, such as sarcoidosis, tuberculosis, Wegener granulomatosis); other forms of vasculitis and inflammatory bowel diseases; intake of medication influencing metabolic or endocrine parameters (e.g., insulin sensitizers, insulin, or glucocorticoids) in the last 3 months before study entry; prostate-specific antigen level >4 ng/mL (or >3 ng/mL in men at high risk for prostate cancer); palpable prostate nodule or induration; hematocrit >50%; untreated severe obstructive sleep apnea; severe lower urinary tract symptoms; uncontrolled or poorly controlled heart failure; or a history of prostate cancer, breast cancer, orchidectomy, and chromosomal disorders (e.g., Klinefelter syndrome).
Men were recruited from the outpatient clinic of the Department of Internal Medicine, Division of Endocrinology and Diabetology, and the outpatient clinic of the Department of Urology, Medical University of Graz, Graz, Austria, as well as from male hospital staff and male family members of hospital staff. Men were informed about the trial either by a conversation in the outpatient clinic, by a telephone call, or by written information posted in the respective outpatient clinics. All patients were informed that the participation in the study is voluntary and that refusal to participate as well as stopping at any time without giving reasons, without any consequences, is possible. Written informed consent was obtained from all subjects before carrying out any study-related procedures.
Intervention
Subjects were allocated to either the vitamin D or placebo group according to a computer-generated randomization list using a ratio of 1:1. The study medication was placed in numbered bottles according to the computer-generated randomization list. Randomization procedures were conducted using web-based software (http://www.randomizer.at/) with Good Clinical Practice compliance as confirmed by the Austrian Agency for Health and Food Safety.
The treatment group received an oral dose of 20,000 IU vitamin D (equivalent to 2,857 IU/d) as 50 oily drops weekly (Oleovit D3 drops; Fresenius Kabi Austria, Linz, Austria) for 12 weeks and the placebo group received 50 oily drops without vitamin D weekly (Fresenius Kabi Austria) for 12 weeks. Placebo oil contained the same oil as Oleovit D3 drops (without vitamin D content). All investigators who enrolled participants, collected data, and assigned intervention were masked to participant allocation. To improve and verify compliance, patients were asked to return the study medication bottles (full as well as empty bottles) at study end (visit 3).
Primary outcome
The primary outcome was the change in TT levels after 12 weeks of vitamin D supplementation compared with placebo. TT concentrations were assessed at baseline, after 4 weeks, and after 12 weeks at the end of the study.
Secondary outcomes
The secondary outcomes were the changes in endocrine parameters, including levels of free testosterone (FT), free androgen index (FAI), sex hormone-binding globulin (SHBG), follicle-stimulating hormone (FSH), luteinizing hormone (LH), and estradiol after vitamin D supplementation compared with those in the placebo group. SHBG concentrations were assessed at baseline, after 4 weeks, and after 12 weeks (study end), whereas FSH, LH, and estradiol levels were assessed at baseline and after 12 weeks.
Further prespecified secondary outcomes include changes in metabolic parameters [i.e., insulin resistance, insulin sensitivity, serum lipid levels, area under the curve (AUC) for glucose (AUCglucose) and for insulin (AUCinsulin), and body composition (fat mass and lean mass)], as well as sexual, psychological, and physical symptoms after vitamin D supplementation (assessed at baseline and after 12 weeks).
There was no change in study outcomes after the trial commenced. Although prespecified as a secondary outcome, sexual, psychological, and physical symptoms were assessed only at baseline, because of an organizational mistake.
Procedures
Basal blood samples for 25(OH)D, parathyroid hormone (PTH), TT, SHBG, LH, FSH, estradiol, glucose, insulin, lipids, and calcium were collected between 8:00 am and 9:00 am after an overnight fast. Levels of 25(OH)D and TT measured by immunoassays were used for evaluation of inclusion criteria. Biobanking of remaining blood samples was performed by freezing and storing the samples at −80°C until analysis. Serum levels of 25(OH)D and TT were additionally measured by isotope-dilution liquid chromatography tandem mass spectrometry (ID-LC-MS/MS) in 2017. 25(OH)D and TT levels measured by ID-LC-MS/MS were used for statistical analyses. FT values were calculated from TT (measured by ID-LC-MS/MS), SHBG, and albumin, according to Vermeulen et al. (22). The FAI was calculated as TT (nmol/L; measured by ID-LC-MS/MS) divided by SHBG (nmol/L) × 100.
All participants underwent a fasting 75-g oral glucose tolerance test (OGTT). Blood samples were drawn after 30, 60, and 120 minutes for determination of glucose and insulin concentrations. AUCglucose and AUCinsulin were calculated according to the trapezoidal method. Insulin resistance was estimated using homeostatic model assessment-insulin resistance and calculated as fasting plasma insulin (μU/mL) × fasting plasma glucose (mg/dL) divided by 405. The quantitative insulin sensitivity check index (QUICKI) was used to estimate insulin sensitivity and calculated as 1/log fasting insulin (μU/mL) plus log fasting glucose (mg/dL) (23). To assess β-cell function, HOMA-β was calculated as [20 × fasting insulin (μU/mL)] divided by [fasting glucose (mmol/L) − 3.5]. The Matsuda index was calculated as follows: 10,000 divided by the square root of [(fasting glucose × fasting insulin) × (mean glucoseOGTT × mean insulinOGTT)] (24). Additional methods are described in the Supplemental Methods.
Statistical analyses
Sample size calculation was based on the results of our pilot study (18) showing TT levels [± standard deviation (SD)] of 10.7 nmol/L (±3.9 nmol/L) vs 13.4 nmol/L (±4.7 nmol/L) at baseline and after 1 year of vitamin D treatment, respectively. We calculated a sample size of 92 patients. The probability is 90% that the study will detect a treatment difference at a two-sided 0.05 significance level, if the true difference between treatments is 0.78 nmol/L. This is based on the assumption that the SD of the response variable is 1.13. To compensate for subjects leaving during the study, we enrolled 50 patients per group.
Data are presented as median with interquartile range. Categorical data are presented as percentages. The distribution of data was analyzed by descriptive statistics and Kolmogorov-Smirnov test. Skewed variables were log transformed and rechecked for normal distribution. Because not all parameters had a normal distribution even after log transformation, we used parametric and nonparametric tests for group comparisons. Student t, Mann-Whitney U, and χ2 tests were used for comparisons of baseline characteristics between the vitamin D and placebo groups.
To study seasonal variation, we subdivided the year into 3-month measurement periods—January through March (season 1), April through June (season 2), July through September (season 3), and October through December (season 4)—to address the seasonal changes in availability of sunlight. Seasonal variation (stratified by month as well as by season) of 25(OH)D, PTH, TT, and FT levels, and of FAI was analyzed by analysis of variance.
Analyses of primary and secondary outcome variables were performed according to the intention-to-treat principle and inclusion of all participants with baseline and follow-up values of the respective outcome variable. We did not perform data imputation for missing values. A paired Student t test and Wilcoxon test were used for comparisons of outcome variables at baseline and follow-up. Changes between baseline and study end were calculated as the difference between the study end and baseline values of outcome variables. Student t test and the Mann-Whitney U test were used for comparisons of the change in values between the vitamin D and placebo groups. All statistical procedures were performed with SPSS version 23 (IBM, Armonk, NY). P < 0.05 was considered statistically significant.
Results
Blood samples were taken from approximately 500 men and evaluated for TT levels and 25(OH)D levels (Fig. 1). Men with 25(OH)D levels <75 nmol/L, TT levels ≥10.4 nmol/L, and a medical history without any exclusion criteria were informed about the study, its purpose, potential benefits, and possible risks, and were invited to participate in the trial. Main reasons for exclusion were 25(OH)D levels >30 ng/mL, TT level <10.4 nmol/L, as well as refusal to participate. A total of 100 men who met all inclusion and exclusion criteria and who gave their written informed consent were enrolled in the study and randomly assigned to the treatment or placebo group. The first subject was randomly assigned in December 2012 and the last follow-up was performed in January 2017. Baseline characteristics of all study participants are shown in Table 1. We found no significant difference in baseline characteristics between the vitamin D and placebo groups. Most subjects were recruited in seasons 1 and 2. No subject reported the intake of calcium supplements. The mean (±SD) overall treatment period was 89 ± 8 days in the vitamin D group and 87 ± 7 days in the placebo group. A total of 98 men completed the study (Fig. 1) and were analyzed for primary and secondary outcomes.
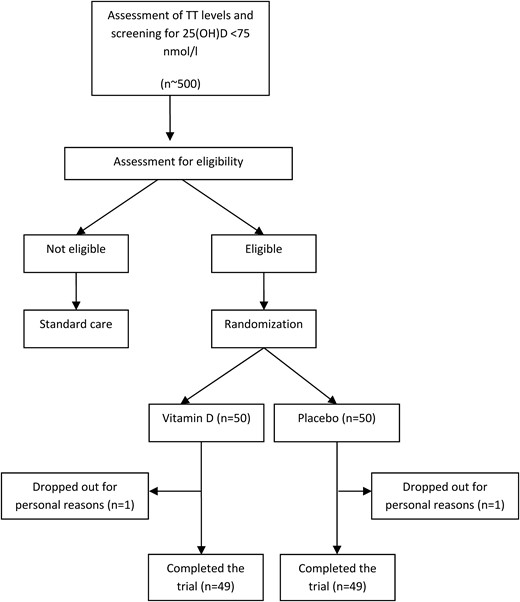
Study flowchart showing recruitment, dropout, and follow-up of study participants.
Baseline Characteristics of Study Participants
| All Study Participants (N = 100) | Vitamin D Group (n = 50) | Placebo Group (n = 50) | P Value | ||||
|---|---|---|---|---|---|---|---|
| Median | IQR | Median | IQR | Median | IQR | ||
| Age, y | 37 | 27–50 | 34 | 26–48 | 38 | 28–52 | 0.256 |
| BMI, kg/m2 | 25.1 | 22.8–26.8 | 25.0 | 22.2–26.5 | 25.2 | 23.1–27.8 | 0.791 |
| 25(OH)D, nmol/L | 52 | 42–66 | 52 | 42–65 | 51 | 43–68 | 0.596 |
| PTH, pg/mL | 46.2 | 36.0–54.6 | 49.5 | 37.0–55.6 | 44.5 | 35.8–50.2 | 0.504 |
| Serum calcium, mmol/L | 2.40 | 2.35–2.42 | 2.38 | 2.33–2.42 | 2.40 | 2.36–2.43 | 0.356 |
| Urine calcium, mmol/L | 2.61 | 1.56–3.88 | 2.65 | 1.66–3.88 | 2.49 | 1.33–4.00 | 0.521 |
| TT, nmol/L | 18.0 | 15.8–21.5 | 18.7 | 15.8–22 | 17.7 | 15.6–21.1 | 0.333 |
| FT, ng/mL | 0.096 | 0.079–0.113 | 0.098 | 0.081–0.118 | 0.096 | 0.077–0.111 | 0.450 |
| SHBG, nmol/L | 40.2 | 31.1–53.8 | 40.6 | 30.1–49.4 | 39.8 | 31.3–55.7 | 0.934 |
| FAI | 7.4 | 5.0–11.6 | 7.6 | 5.1–12.3 | 7.0 | 4.7–10.6 | 0.560 |
| Estradiol, ng/mL | 32.3 | 25.1–42.4 | 32.3 | 24.2–39.1 | 32.6 | 26.4–48.6 | 0.475 |
| FSH, mU/mL | 4.5 | 3.0–6.2 | 4.8 | 3.2–6.3 | 4.4 | 2.9–5.1 | 0.491 |
| LH, mU/mL | 3.7 | 2.8–5.1 | 3.7 | 2.6–5.1 | 3.5 | 2.9–5.1 | 0.705 |
| HOMA-IR | 1.7 | 1.02.5 | 1.5 | 1.0–2.4 | 2.0 | 1.1–2.5 | 0.291 |
| HOMA-β | 118.9 | 82.4–172.1 | 116.5 | 74.3–165.4 | 126.4 | 86.5–182.4 | 0.509 |
| Matsuda index | 6.7 | 4.5–9.8 | 7.1 | 4.6–10.5 | 6.2 | 4.3–9.3 | 0.358 |
| QUICKI | 0.35 | 0.33–0.38 | 0.36 | 0.33–0.39 | 0.34 | 0.33–0.36 | 0.291 |
| AUCglucose | 205.8 | 176.3–232.5 | 204.5 | 171.3–231.3 | 205.8 | 176.5–234.3 | 0.828 |
| AUCinsulin | 79.0 | 54.3–118.3 | 76.4 | 54.3–112.9 | 79.3 | 54.8–123.9 | 0.704 |
| Total cholesterol, mg/dL | 189 | 164–216 | 187 | 163–209 | 190 | 171–218 | 0.481 |
| HDL-C, mg/dL | 60 | 51–69 | 61 | 51–72 | 57 | 51–68 | 0.238 |
| LDL-C, mg/dL | 107 | 86–127 | 101 | 85–127 | 113 | 93–130 | 0.388 |
| Triglycerides, mg/dL | 92 | 62–133 | 83 | 60–123 | 99 | 65–146 | 0.209 |
| Fat mass, kg | 19.8 | 14.5–24.9 | 18.7 | 14.2–23.1 | 21.7 | 13.9–23.0 | 0.700 |
| Lean mass, kg | 58.6 | 54.9–62.2 | 58.6 | 55.7–61.9 | 58.6 | 54.4–62.4 | 0.465 |
| AMS score | 22 | 19–26 | 23 | 19–26 | 22 | 19–25 | 0.673 |
| IIEF-EF score | 30 | 28–30 | 30 | 27–30 | 30 | 28–30 | 0.999 |
| Season, %a | |||||||
| 1 | 39 | 40 | 38 | 0.541 | |||
| 2 | 34 | 30 | 38 | ||||
| 3 | 10 | 14 | 6 | ||||
| 4 | 17 | 16 | 18 | ||||
Comparisons of baseline characteristics between men in vitamin D and placebo group were performed using Student t, Mann-Whitney U, and χ2 tests.
Abbreviations: AMS, Aging Male’s Symptoms questionnaire; HDL-C, high-density lipoprotein cholesterol; LDL-C, low-density lipoprotein cholesterol; IIEF-EF, International Index of Erectile Function-Erectile Function questionnaire.
Season 1: January through March; season 2: April through June; season 3: July through September; season 4: October through December.
Seasonal variation
When stratified by month, we found a significant difference in 25(OH)D (P < 0.001) and PTH (P = 0.035) levels (data not shown). Furthermore, when stratified by season, we observed a significant difference in 25(OH)D levels and a trend toward different PTH levels (Supplemental Table 1). No significant seasonal variation (stratified by month and season) was seen for TT or FT levels, or FAI.
Endocrine characteristics
In the vitamin D group, we found a significant increase in estradiol levels, a significant decrease in SHBG levels, and no significant change in the remaining endocrine parameters (Tables 2 and 3). In the placebo group, we found no significant change in TT, FT, SHBG, estradiol, FSH, or LH levels, or FAI. We observed no significant treatment effects on endocrine parameters.
Outcome Variables at Baseline and Study End, and Changes From Baseline
| Baseline Visit | Study End | Change From Baseline to Study Enda | Within-Group Differences P Valuec | |||||
|---|---|---|---|---|---|---|---|---|
| Median | IQR | Median | IQR | Median | IQR | P Valueb | ||
| Endocrine characteristics | ||||||||
| TT, nmol/L | ||||||||
| Vitamin D (n = 49) | 18.7 | 15.9–21.9 | 19.4 | 17.2–21.2 | 0.5 | −2.2 to 2.2 | 0.497 | 0.922 |
| Placebo (n = 49) | 17.6 | 15.7–20.5 | 18.3 | 15–21.4 | 0.5 | −1.9 to 2.6 | 0.424 | |
| FT, ng/mL | ||||||||
| Vitamin D (n = 48) | 0.100 | 0.085–0.108 | 0.102 | 0.009–0.131 | 0 | −0.02 to 0.01 | 0.690 | 0.112 |
| Placebo (n = 49) | 0.096 | 0.079–0.110 | 0.095 | 0.075–0119 | 0 | −0.01 to 0.01 | 0.186 | |
| SHBG, nmol/L | ||||||||
| Vitamin D (n = 48) | 39.9 | 30.1–48.4 | 37.9 | 31.1–47.1 | −2.5 | −3.05 to 5.6 | 0.657 | 0.028 |
| Placebo (n = 49) | 39.7 | 31.2–54.1 | 39.5 | 30.1–48.6 | −1.2 | −4.4 to 7.8 | 0.257 | |
| FAI | ||||||||
| Vitamin D (n = 48) | 7.6 | 5.1–11.8 | 7.4 | 5.5–9.6 | −0.39 | −1.67 to 1.08 | 0.655 | 0.242 |
| Placebo (n = 49) | 6.9 | 4.9–10.0 | 6.8 | 5.0–9.6 | 0.09 | −1.95 to 1.22 | 0.561 | |
| Estradiol, ng/mL | ||||||||
| Vitamin D (n = 48) | 32.3 | 23.8–38.8 | 35.3 | 27.2–43.4 | 3.2 | −5.2 to 12.4 | 0.448 | 0.035 |
| Placebo (n = 49) | 30.7 | 25.3–44.0 | 37.3 | 30.1–48.6 | 5.6 | −8.8 to 11.3 | 0.269 | |
| FSH, mU/mL | ||||||||
| Vitamin D (n = 48) | 4.8 | 3.0–6.3 | 4.1 | 3–5.8 | −0.04 | −0.91 to 0.8 | 0.827 | 0.630 |
| Placebo (n = 49) | 3.8 | 2.7–5.1 | 4.3 | 2.9–6.4 | 0.43 | −0.68 to 1.07 | 0.244 | |
| LH, mU/mL | ||||||||
| Vitamin D (n = 48) | 3.7 | 2.4–4.9 | 3.3 | 2.8–4.5 | −0.19 | −0.91 to 0.8 | 0.722 | 0.886 |
| Placebo (n = 49) | 3.3 | 2.8–4.4 | 3.3 | 2.5–4.4 | −0.16 | −1.23 to 1.04 | 0.516 | |
| Metabolic characteristics | ||||||||
| HOMA-IR | ||||||||
| Vitamin D (n = 47) | 1.4 | 1.0–2.4 | 2.0 | 1.4–2.8 | 0.42 | −0.26 to 1.01 | 0.084 | 0.020 |
| Placebo (n = 48) | 2.0 | 1.2–2.5 | 1.8 | 1.3–2.5 | 0.07 | −0.65 to 0.56 | 0.999 | |
| HOMA-β | ||||||||
| Vitamin D (n = 47) | 105.7 | 69.3–155.5 | 125.9 | 91.2–183.8 | 14.6 | −26.3 to 56.3 | 0.517 | 0.141 |
| Placebo (n = 48) | 126.4 | 88.8–172.1 | 124.9 | 94.5–173.6 | 15.2 | −33.9 to 46.9 | 0.460 | |
| Matsuda index | ||||||||
| Vitamin D (n = 45) | 7.6 | 4.8–10.5 | 6.6 | 4.2–8.8 | −0.9 | −3.2 to 0.8 | 0.051 | 0.037 |
| Placebo (n = 48) | 6.1 | 4.3–8.5 | 6.2 | 4.6–9.7 | 0.2 | −1.4 to 2.3 | 0.418 | |
| QUICKI | ||||||||
| Vitamin D (n = 47) | 0.37 | 0.34–0.39 | 0.34 | 0.33–0.36 | −0.02 | −0.04 to 0.01 | 0.034 | 0.012 |
| Placebo (n = 48) | 0.34 | 0.33–0.36 | 0.35 | 0.33–0.37 | 0.00 | −0.02 to 0.02 | 0.975 | |
| AUCglucose | ||||||||
| Vitamin D (n = 48) | 204.6 | 177.3–231.2 | 214.9 | 192.9–238.0 | 8.0 | 19.5 to 27.8 | 0.237 | 0.127 |
| Placebo (n = 48) | 205.8 | 176.4–234.3 | 205.8 | 186.8–230.0 | 1.0 | −36.6 to 32.1 | 0.560 | |
| AUCinsulin | ||||||||
| Vitamin D (n = 47) | 75.6 | 54.3–110.5 | 69.4 | 48.2–103.5 | −3.6 | −29.5 to 21.5 | 0.905 | 0.409 |
| Placebo (n = 48) | 79.3 | 54.6–122.0 | 82.5 | 60.2–106.0 | −11.9 | −36.4 to 19.2 | 0.246 | |
| Lipids | ||||||||
| Total cholesterol, mg/dL | ||||||||
| Vitamin D (n = 40) | 180 | 158–201 | 190 | 166–217 | 3 | −11 to 11 | 0.419 | 0.168 |
| Placebo (n = 37) | 183 | 157–215 | 195 | 165–220 | 1 | −19 to 6.5 | 0.950 | |
| HDL-C, mg/dL | ||||||||
| Vitamin D (n = 40) | 59 | 42–68 | 64 | 51–71 | −0.5 | −5 to 4 | 0.937 | 0.769 |
| Placebo (n = 39) | 54 | 42–65 | 57 | 51–71 | −1 | −5 to 5 | 0.659 | |
| LDL-C, mg/dL | ||||||||
| Vitamin D (n = 39) | 100 | 80–124 | 109 | 87–132 | 1 | −12 to 12 | 0.120 | 0.096 |
| Placebo (n = 37) | 107 | 74–122 | 112 | 86–133 | −6 | −18 to 8 | 0.700 | |
| Triglycerides, mg/dL | ||||||||
| Vitamin D (n = 39) | 71 | 50–110 | 86 | 70–116 | 4 | −21 to 16 | 0.861 | 0.902 |
| Placebo (n = 37) | 86 | 48–125 | 103 | 65–145 | −1 | −17.5 to 23.5 | 0.904 | |
| Body composition | ||||||||
| Fat mass, kg | ||||||||
| Vitamin D (n = 48) | 18.7 | 14.4–22.6 | 19.1 | 13.9–23.0 | 0 | −0.7 to 1.0 | 0.394 | 0.423 |
| Placebo (n = 49) | 22.3 | 16.3–25.5 | 22.5 | 16.0–25.0 | 0 | −0.6 to 0.7 | 0.693 | |
| Lean mass, kg | ||||||||
| Vitamin D (n = 39) | 58.6 | 55.7–61.2 | 59.1 | 55.8–61.3 | 3.3 | −5.7 to 9.2 | 0.478 | 0.155 |
| Placebo (n = 37) | 58.5 | 54.2–61.7 | 58.2 | 54.9–62.5 | 1.0 | −7.7 to 6.6 | 0.830 | |
Abbreviations: HDL-C, high-density lipoprotein cholesterol; IQR, interquartile range; LDL-C, low-density lipoprotein cholesterol.
Changes between baseline and study end were calculated as the difference between the study end and baseline concentrations of biochemical parameters.
Student t and Mann-Whitney U tests were used to compare the change in values between the vitamin D and placebo groups.
Paired Student t and Wilcoxon tests were used to compare biochemical characteristics at baseline and follow-up (within group differences).
Outcome Variables at Baseline and Visit 2, and Changes From Baseline to Visit 2
| Baseline Visit | Visit 2 | Change From Baseline to Visit 2 | Within-Group Differences P Valueb | |||||
|---|---|---|---|---|---|---|---|---|
| Median | IQR | Median | IQR | Median | IQR | P Valuea | ||
| TT, nmol/L | ||||||||
| Vitamin D (n = 49) | 18.7 | 15.9–21.9 | 18.2 | 15.9–20.6 | −0.1 | −1.6 to 2.9 | 0.902 | 0.214 |
| Placebo (n = 49) | 17.6 | 15.7–20.5 | 16.3 | 15–19.6 | −0.2 | −3.0 to 1.8 | 0.145 | |
| FT, ng/mL | ||||||||
| Vitamin D (n = 48) | 0.100 | 0.085–0.108 | 0.099 | 0.075–0.123 | 0 | −0.02 to 0.01 | 0.486 | 0.294 |
| Placebo (n = 49) | 0.096 | 0.079–0.110 | 0.092 | 0.074–0.118 | 0 | −0.02 to 0.02 | 0.840 | |
| SHBG, nmol/L | ||||||||
| Vitamin D (n = 48) | 39.9 | 30.1–48.4 | 39.4 | 30–49.4 | 0.1 | −5.7 to 3.1 | 0.506 | 0.644 |
| Placebo (n = 49) | 39.7 | 31.2–54.1 | 38.7 | 29.4–49.5 | −1.4 | −10.1 to 3.8 | 0.129 | |
| FAI | ||||||||
| Vitamin D (n = 48) | 7.6 | 5.1–11.8 | 6.6 | 5.0–10.9 | −0.58 | −1.76 to 0.94 | 0.862 | 0.157 |
| Placebo (n = 49) | 6.9 | 4.9–10.0 | 5.6 | 4.7–9.5 | −0.72 | −2.05 to 0.98 | 0.060 | |
Abbreviation: IQR, interquartile range.
Changes between baseline and visit 2 were calculated as the difference between the visit 2 and baseline concentrations of biochemical parameters. Student t and Mann-Whitney U tests were used to compare the change in values between the vitamin D and placebo groups.
Paired Student t and Wilcoxon tests were used to compare biochemical characteristics at baseline and follow-up (within group differences).
Metabolic characteristics
In the vitamin D group, we found a significant increase of homeostatic model assessment-insulin resistance levels as well as a significant decrease in the Matsuda index and QUICKI (Table 2). In the placebo group, we found no significant change in metabolic parameters, or fat or lean mass. The QUICKI decreased significantly [P = 0.034; Fig. 2(a)], and there was a trend toward decreased Matsuda index in the vitamin D group [P = 0.051; Fig. 2(b)]. We observed no significant treatment effect on the remaining metabolic parameters, or fat and lean mass.
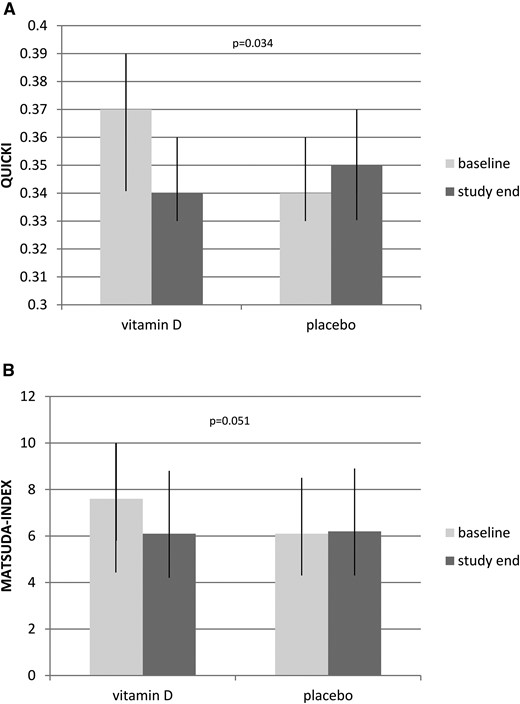
Baseline and study end characteristics of study participants. Data are show as median with interquartile range. (a) QUICKI at study end and baseline. Mann-Whitney U test was used to compare the vitamin D (n = 47) and placebo (n = 48) groups. (b) Changes between baseline and study end were calculated as the difference between the Matsuda index at study end and baseline. Mann-Whitney U test was used to compare vitamin D (n = 45) and placebo (n = 48) groups.
Mineral metabolism
Parameters of mineral metabolism are shown in Table 4. We found a significant difference in the change in 25(OH)D and PTH values between treatment groups, whereas no significant difference was observed in the change in serum calcium or urine calcium levels.
Parameters of Mineral Metabolism at Baseline, Visit 2, and Study End, and Changes From Baseline
| Baseline Visit | Visit 2 | Change From Baseline to Visit 2 | Study End | Change From Baseline to Study End | ||||||||
|---|---|---|---|---|---|---|---|---|---|---|---|---|
| Median | IQR | Median | IQR | Median | IQR | P Value | Median | IQR | Median | IQR | P Value | |
| 25(OH)D, nmol/L | ||||||||||||
| Vitamin D (n = 49) | 52 | 42–65 | 82 | 76–98 | 32 | 21–44 | <0.001 | 107 | 89–119 | 53 | 36–65 | <0.001 |
| Placebo (n = 49) | 52 | 45–64 | 56 | 42–67 | 1 | −7 to 9 | 69 | 46–79 | 9 | −2 to 22 | ||
| PTH, pg/mL | ||||||||||||
| Vitamin D (n = 45) | 48.2 | 37.0–54.4 | 45.0 | 33.9–53.2 | −1.3 | −6.6 to 8.2 | 0.009 | |||||
| Placebo (n = 48) | 44.5 | 35.0–50.2 | 48.6 | 39.9–65.4 | 5.6 | −3.5 to 17.6 | ||||||
| Serum calcium, mmol/L | ||||||||||||
| Vitamin D (n = 45) | 2.38 | 2.33–2.42 | 2.39 | 2.34–2.47 | 0.01 | −0.04 to 0.09 | 0.371 | 2.37 | 2.30–2.42 | −0.04 | −0.08 to 0.04 | 0.765 |
| Placebo (n = 48) | 2.40 | 2.35–2.42 | 2.39 | 2.35–2.44 | 0.00 | −0.05 to 0.07 | 2.37 | 2.33–2.41 | −0.03 | −0.06 to 0.01 | ||
| Urine calcium, mmol/L | ||||||||||||
| Vitamin D (n = 45) | 2.61 | 1.59–3.87 | 2.41 | 1.70–3.72 | −0.17 | −1.12 to 0.95 | 0.806 | |||||
| Placebo (n = 48) | 2.49 | 1.33–4.00 | 2.44 | 1.07–4.42 | −0.25 | −1.05 to 1.38 | ||||||
Changes between baseline and visit 2, and baseline and study end were calculated as the difference between the study end (or visit 2) and baseline concentrations of biochemical parameters. Student t and Mann-Whitney U tests were used to compare the change in values between the vitamin D and placebo groups.
Abbreviation: IQR, interquartile range.
No important harms or unintended treatment effects were observed during the study. Furthermore, no study participant treated with vitamin D had developed hypercalcemia at the final study visit.
Despite careful verification of inclusion and exclusion criteria, one study participant with a TT concentration <10.4 nmol/L was included by mistake, and randomly assigned to the vitamin D group and treated. By adhering to the intention-to-treat principle, we included this study participant in our analyses. When performing a sensitivity analysis excluding this patient, our results remained materially unchanged.
Discussion
In this RCT, we found no significant effect of vitamin D therapy on TT levels in men. Regarding our secondary end points, we found a significant difference in changes in the QUICKI, and a trend toward a significant change in the Matsuda index between the vitamin D and placebo groups, suggesting a decrease in insulin sensitivity in the vitamin D group. We observed no significant treatment effect on the remaining secondary outcome measures, including gonadal endocrine parameters, insulin resistance, AUCglucose, AUCinsulin, fat and lean mass, and sexual, physical, and psychological symptoms.
Our results are in line with a previous post hoc analysis by Heijboer et al. (20) demonstrating no effect of vitamin D supplementation on serum TT concentrations in three independent intervention studies including male patients with heart failure (study 1), male nursing home residents (study 2), and male non-Western immigrants in the Netherlands (study 3). Those studies were designed to investigate vitamin D effects on the renin-angiotensin-aldosterone system (study 1), effects of different vitamin D doses (study 2), and vitamin D effects on insulin sensitivity (study 3). Similarly, the study by Jorde et al. (19) did not show a significant vitamin D effect on testosterone concentrations in pooled data from three vitamin D RCTs performed in Tromsø with weight reduction, insulin sensitivity, and depression scores as end points. In contrast, we previously found a significant increase in androgen levels after vitamin D supplementation in obese men undergoing a weight reduction program (18). Those differences might be explained by different study designs and subjects. Although the Pilz et al. study (18) and the current study used similar doses (3,332 IU/d vs 2,857 IU/d, respectively), the Pilz et al. study (18) investigated vitamin D effects after 1 year of vitamin D supplementation (vs 12 weeks in the Graz Vitamin D&TT-RCT). Further, Pilz et al. (18) included subjects with 25(OH)D levels <50 nmol/L whereas the Graz Vitamin D&TT-RCT investigated men with 25(OH)D levels <75 nmol/L. Other differences are related to the study participants (significant weight loss in obese subjects vs healthy men), baseline TT levels (11.4 nmol/L vs 19.1 nmol/L) and the method used for TT measurements (immunoassay vs mass spectrometry) for the Pilz et al. study (18) and the current Graz Vitamin D&TT-RCT report, respectively. Furthermore, Canguven et al. (25) conducted an uncontrolled trial including 102 male patients with 25(OH)D levels <75 nmol/L and observed a significant increase in TT levels after vitamin D treatment. Those contradictory results might be explained by different study duration (1 year vs 12 weeks) as well as by different dosing regimens (initial vitamin D bolus after a vitamin D treatment regimen vs weekly doses). Of note, because the Canguven et al. study is an uncontrolled trial, no definite statement regarding a real treatment effect of vitamin D can be made.
Testosterone is an anabolic hormone with a wide range of beneficial effects on men’s health, including important physiological effects on brain, muscle, bone, and fat mass (26). There is accumulating evidence suggesting that androgen deficiency may contribute to the onset and progression of cardiovascular disease and play an important role in the development of the metabolic syndrome in men (27). Thus, a causal relationship between vitamin D and testosterone, with a potential increase of testosterone levels after vitamin D treatment is of clinical interest.
Several lines of evidence suggest a complex interplay of vitamin D and androgen metabolism. Interestingly, it has been shown that androgens increase 1-α-hydroxylase, a key enzyme in vitamin D metabolism that converts 25(OH)D to 1,25-dihydroxyvitamin D (28). Furthermore, it has been demonstrated that the regulation of gene expression by vitamin D metabolites is modified according to androgen levels (29). The VDR, as well as key enzymes for vitamin D metabolism, are widely expressed in human tissues and cells (30). In this context, Blomberg Jensen et al. (31) observed a significant expression of the VDR and vitamin D metabolizing enzymes in the male reproductive tract, including Leydig cells of the testis. These data have raised the question of whether vitamin D can influence male reproductive hormone production. The existence of such an effect is supported by previous studies suggesting that vitamin D deficiency may contribute to reduced fertility and hypogonadism (11, 32). High LH and FSH levels in male VDR knockout mice indicate the presence of hypergonadotropic hypogonadism (11). Recently, it has been shown that vitamin D treatment upregulates certain testis-specific genes in mice (33), including ABCA1 (adenosine triphosphate-binding cassette transporter 1). ABCA1 knockout mice have significantly reduced intratesticular testosterone levels as well as reduced sperm counts compared with wild-type animals (34). Furthermore, vitamin D significantly increased testosterone production in a human primary testicular cell culture model (35). After 1,25-dihydroxyvitamin D supplementation, 63 genes were significantly upregulated in human testicular cells, such as IGF-1, ALPL, DPP4, and genes associated with bone and the immune system (34). Despite this promising evidence, we did not find at significant vitamin D effect on androgen levels in men in this RCT. This suggests that previously observed associations between 25(OH)D and testosterone levels may be a consequence of confounding or reverse causation.
Regarding secondary outcomes, we observed a significant difference in changes in the QUICKI between the vitamin D and placebo groups as well as a trend toward a significant difference in changes in the Matsuda index. This finding is unexpected because previous observational studies demonstrated a positive association of vitamin D and insulin sensitivity (4), whereas our results suggest a decrease of insulin sensitivity in the vitamin D group. Evidence from previous RCTs revealed conflicting results, however (33, 36). A positive vitamin D effect has been demonstrated in insulin-resistant, vitamin D–deficient women (33), whereas the study by Mousa et al. (36) did not demonstrate a significant vitamin D effect on insulin sensitivity (determined via hyperinsulinemic-euglycemic clamp) in vitamin D–deficient overweight or obese adults. To our knowledge, there is no published RCT demonstrating an adverse effect of vitamin D on insulin sensitivity. Our finding, therefore, is difficult to explain and we can only speculate on underlying mechanisms. It should be noted, however, that study participants had relatively high 25(OH)D levels at study end; therefore, our findings might be supported by previous inconsistent results with possible U-shaped or nonlinear associations that have been suggested for vitamin D and cancer (5), cardiovascular disease (37), and mortality (38, 39). Thus, we hypothesize that there might be a U-shaped association of vitamin D status with insulin sensitivity in this cohort of healthy men without insulin resistance at baseline. Considering the previously demonstrated positive effect of vitamin D treatment on insulin sensitivity (35), our results might also be a chance finding without an underlying true effect. Additional large-scale RCTs addressing the effect of vitamin D on insulin sensitivity in healthy subjects are warranted.
Our study has several limitations that should be noted. First, we present data from a single-center study performed in healthy middle-aged men; therefore, our results may not be generalizable to other populations. Because we investigated men with relatively high baseline TT levels, we cannot exclude a vitamin D effect on testosterone levels in hypogonadal men or men with low-normal TT levels. This issue is addressed in the second arm of the Graz Vitamin D&TT-RCT, and results are expected later in 2017. Furthermore, we investigated a cohort of men with relatively high baseline 25(OH)D levels. Thus, we cannot exclude vitamin D effects in men with severe vitamin D deficiency. Given that a U-shaped association of vitamin D levels with hypogonadism has been observed in healthy middle-aged men (40), one might speculate that an RCT aiming at target 25(OH)D levels between 75 and 100 nmol/L would provide different results. Moreover, we cannot exclude that time interval of vitamin D supplementation had an impact on our study outcomes and that the use of daily instead of weekly doses could have changed our results. Furthermore, due to the relatively short treatment period, we cannot exclude substantial effects of vitamin D on androgen levels with longer treatment. Moreover, we estimated insulin sensitivity using surrogate indices rather than the gold standard method (i.e., hyperinsulinemic-euglycemic clamp). Finally, we did not assess dietary calcium intake.
Our study has also several strengths. First, this RCT was specifically designed to investigate vitamin D effects on TT concentrations in men. Second, we used state-of-the-art and standardized methods to measure 25(OH)D as well as TT concentrations in our samples (41). Further, we included a relatively large number of participants and the dropout rate was low. In addition, although we did not use gold standard methods for evaluation of insulin sensitivity, we analyzed data derived from OGTTs, allowing a more precise estimation of insulin sensitivity and insulin resistance than the simple use of fasting values.
In summary, we found no significant vitamin D effect on TT concentrations in this cohort of middle-aged healthy men with normal baseline TT levels, confirming the results of previous preliminary RCTs, but we observed a significant decrease in QUICKI. The latter finding points to the need for additional studies investigating a potential adverse effect of vitamin D on insulin sensitivity and insulin resistance in large cohorts of healthy subjects. Regarding vitamin D and TT, we recommend further investigation of potential vitamin D effects on androgen levels in different cohorts, including hypogonadal men with severe vitamin D deficiency.
Abbreviations
- 25(OH)D
25-hydroxyvitamin D
- AUCglucose
area under the curve for glucose
- AUCinsulin
area under the curve for insulin
- FAI
free androgen index
- FSH
follicle-stimulating hormone
- FT
free testosterone
- Graz Vitamin D&TT-RCT
Graz Vitamin D and Total Testosterone Randomized Clinical Trial
- ID-LC-MS/MS
isotope-dilution liquid chromatography tandem mass spectrometry
- LH
luteinizing hormone
- OGTT
oral glucose tolerance test
- PTH
parathyroid hormone
- QUICKI
quantitative insulin sensitivity check index
- RCT
randomized controlled trial
- SD
standard deviation
- SHBG
sex hormone-binding globulin
- TT
total testosterone
- VDR
vitamin D receptor.
Acknowledgments
We thank all study participants, Roswitha Gumpold for recruitment of patients, Cornelia Missbrenner and the members of Endocrinology Laboratory platform for continuous support, David Lerchbaum for scientific discussion and statistical support, and Fresenius Kabi for providing the study medication.
Financial Support: The Graz Vitamin D&TT-RCT was supported by funding from the Austrian National Bank (OeNB Jubilaeumsfonds Project 14846).
Clinical Trial Information: EudraCT no. 2011-003575-11 (registered 3 May 2013); ClinicalTrials.gov no. NCT01748370 (registered 10 December 2012).
Disclosure Summary: The authors have nothing to disclose.
References
