Biochemical study and gene expression of Glutathione-S-Transferase (GST)in induced asthma in Rat
Ferdous A. Jabir1,* Ahmed S. Al Ali2
1AL-Qadisyia University/college of medicine/Department of chemistry
2AL-Qadisyia University/college of science/Department of chemistry
DOI : http://dx.doi.org/10.13005/ojc/310337
Article Received on :
Article Accepted on :
Article Published : 23 Jul 2015
This researchaims to stud the role of Glutathione-S-transferases in asthma under stress conditions. Also, evaluate the ability of Iraqi propolis to inhibit the free radicals production in asthmatic rats too.GST enzyme was partially purified from rats liver after induction asthma. The experimental Sprague-Dawly rats were divided into four groups. (G1) control group, (G2) asthma group, (G3) asthma treated with propolis and (G4) was treated with propolis first and then induce asthma. The results showed reduction GST activity in (G2) when compared with control group (G1), and increase activity of GST in (G3) when compared with (G2).
KEYWORDS:Biochemical study; gene expression; gene expression
Download this article as:| Copy the following to cite this article: Jabir F. A, Al Ali A. S. Biochemical study and gene expression ofGlutathione-S-Transferase (GST)in induced asthma in Rat. Orient J Chem 2015;31(3). |
| Copy the following to cite this URL: Jabir F. A, Al Ali A. S. Biochemical study and gene expression ofGlutathione-S-Transferase (GST)in induced asthma in Rat. Orient J Chem 2015;31(3). Available from: http://www.orientjchem.org/?p=9950 |
Introduction
Glutathione S-transferases (GST) is a family of enzymes that play an of detoxification enzymes. All eukaryotic specie has multiple GSTisoenzyme that are bound by cytosolic and membranes (1). The role of glutathione S-transferases as a defense against potentially toxic compounds. Glutathione-S-transferases (GSTs) are enzymes that catalyze nucleophilic attacks by glutathione on compounds containing electrophilic centers (2). GST is present as soluble and membrane bound forms and it’s found in highest concentration in the liver,kidney, lung and intestine. Human GSTs are divided into three main families: cytosolic, mitochondrial, and microsomal. cytosolic GSTs are subdivided into seven distinct classes designated ,named as Alpha (α), Mu (μ), Pi (π), Sigma (σ), Theta (θ), Zeta (ξ), Omega (ω) and Kappa (κ) (5). Three classes Alpha, mu and pi are involved in drug metabolism and detoxification (3, 4). Four additional classes of this super family, called Beta (β), Delta (δ), Phi (φ), and Tau (τ) are represented in bacteria, insects and plants (6). In glutathione redox cycle cycle, most of the enzymes catalyze the conjugation of reduced Glutathione (GSH) with compounds that include an electrophilic center through the formation of a thioether bond between the sulphur atom of GSH and the substrate (7).
Asthma is characterized by chronic airway inflammation and oxidative stress in the lungs has been implicated in its pathogenesis. Most of ROS and other free radicals are generated as by-products of normal cellular metabolic activities.Firstly in the mitochondria or during the enzymatic oxidation. ROS have long been recognized as important mediators of inflammation and cell death. Oxygen free radicals are highly reactive molecules result in oxidative damage of biological molecules such as, lipids, and DNA and proteins and alter their functions(8). The shift in the balance between oxidants and antioxidants in favor of oxidants is termed oxidative stress. These are countered by enzymatic and non-enzymatic antioxidants, including dietary antioxidants, such as vitamins C, glutathione (GSH), phenolic compounds, alkaloids, non-protein amino acids and a-tocopherols(9). A family of enzymes, the glutathione-S-transferases(GSTs), has the general function of conjugating glutathione with electrophilic substances that are capable of generating free radicals, thus leading to detoxification of their effects. Genetic polymorphisms associated with reduced activity of GSTs are therefore of interest in the study of disease susceptibility. Two common deletion polymorphisms of GSTM1 and GSTT1 genes have been associated with asthma(10)
Experimental design
Sixty malesratsused in this study,the average weight of rats were (140 ± 10) gm and (8-9) week age were divided into four groups. Every group contained 15 rats. First group received distilled water daily for three weeks then injected with (0.5ml) normal saline one dose on 1st, 3rd, 5th day as a control. Second group received distilled water for three weeks then was injected subcutaneous with three doses of 100µg of egg albumin on 1st,3rd,5th day . Third group induced asthma by injected of 100µg of egg albumin on 1st,3rd,5th day and then received local propolis for three weeks at doses 200mg /kg.The last group received local propolis at doses 200mg /kg for three weeks, then injected subcutaneous with three doses of 100µg of egg albumin on 1st, 3rd, 5th day.
Materials and methods
Biochemical Tests
A–Determination of Serum Reduced Glutathione (GSH) level(11)
The disulfide of 5, 5-Dithiobis (2-nitrobenzoic acid) (DTNB) is readily reduced by sulfahydryl group of GSH to an intensely yellow compound .That reduced Compound measured absorbance at 412 nm and is directly proportional to the GSH concentration, by using UV-VIS Spectrophotometer(APLEPD-303 UV).
B–Determination of Serum Nitric Oxide Level(12)
A reaction between nitrite and sulfanilamide and N-(1-naphthyl) ethylene diamine produced a pink colored complex which is measured by UV-VIS Spectrophotometer(APLEPD-303 UV)at 540 nm wave length.
C-Assament activity of serum GlutathioneS-Transferase(GST) (13)
The activity was determined by using 1-chloro-2, 4-dinitrobenzene (CDNB) as Substrate,The conjugation of (CDNB) with GSH proceeds by nucleophilic aromatic substitution of chlorine by thiol group of GSH, producing a dinitrophenylthioether and chloride ion, measured absorbance at 340nm by using UV-Visible spectrophotometer(SHIMADZU UV-1650PC).
Enzyme partially purified–2
A. Purification of Glutathione-s-Transferase(GST) from Rat liver.
All steps were performed at 4 oC unless stated otherwise.
Step 1: Preparation of Cytosol Fractions
Rat liver (2 g) was cut into small pieces and homogenized in 10 mM ice-cold Tris-acid pH 8.0 in a blender. The homogenate was filtrated through 2 layers of gauze to remove connective tissue. The homogenate was centrifuged at 5,000 rpm for one hour. The resulting supernatant was then centrifuged for 30 minute. The cytosol fraction was obtained, and stored at -20 Cᵒ (13).
Step 2: Ammonium Sulfate Fractionation
Protein was precipitated using ammonium sulfate (NH4)2SO4 saturation (50%) or protein salting out (14). Solid ammonium sulfate (1.45) gm per (5 ml) supernatant was added with stirring to the enzyme extract and the mixture was stirred until all of the ammonium sulfate had dissolved; the suspension was centrifuged for (30) min. The protein in precipitate and supernatant are determined using the modified Lowry method (15), and the GST is determined in each fraction (13)
Step 3: Dialysis
Dialysis was made using a semipermeable cellophane dialysis membrane with M.wt. cut off (<10000) dalton.The dialysis containing the suspension in (Step 2) was dialyzed against 0.015M phosphate buffer, pH 6.25.The solution was stirred with a magnetic stirrer overnight at (4) oC. The buffer was changed twice during dialysis (16). The protein of the dialyzed enzyme was estimated by modified Lowry method (15).
Step 4: Gel Filtration Chromatography
This step was done in column dimension of 2 × 100 cm containing gel using Sephadex G-75 to high (80 cm) (16). 0.5 ml of the protein, which was obtained in (Step 3), was applied on the top of a bed Sephadex G-75, followed by phosphate buffer solution. Elution of protein was carried out at a flow rate (52.3) ml / hour.
Step 5: Freeze-Dryer (Lyophilization) Technique
The enzyme fraction which was obtained from gel filtration was lyophilized to obtain a powder of a concentrated protein. The enzyme was kept in a deep freeze at (-20) C0 in a tight sample tube to be used in further investigations.
B- Kinetic properties of purified glutathione-S-transferase enzyme
Different concentration of CDNB (2, 4, 6, 8, 10, 12, 14, 16, 18 and 20 mM) was reacted with 0.001 gm/ 1 ml of purified enzyme in 1 ml phosphate buffer, and then read the absorbance of reaction at 340 nm every minute for 10 minute. Km and Vmax were calculated by the line Weaver-Burk plot equation.
Gene expression of Glutathione-S-Transferrase (GST)
Primers
The primers were used in this study, GAPDH gene primers used as Housekeeping gene, GSTM1 gene and GAPDH geneprimers used as target genes. These primers were designed by using NCBI- Gene Bank data base and Primer 3 design online, the primers used in quantification of gene expression using qRT-PCR techniques based SYBER Green DNA binding dye, and supplied from (Bioneer, Korea) company.
Table1: GSTM 1 Primer, GAPDH Primer
|
Code |
Amplicon |
Sequence |
Primer |
|
NM_017014.1 |
121bp |
TGCCATAATGCGCTACCTTG |
GSTM1 |
|
AAGCATGATGAGCTGCATGC |
|||
|
NM_017008.4 |
136bp |
ATGCCCCCATGTTTGTGATG |
GAPDH |
|
TCCACGATGCCAAAGTTGTC |
Quantitative Reverse Transcription Real-Time PCR
Quantitative Reveres Transcription Real-Time PCR technique was performed for estimation of relative quantification (gene expression analysis). This technique was done according to method described by (17).
Results and discussion
Biochemical Analysis
A- Glutathione (GSH) level
The asthmatic rats (G2) showed significant decline in the mean of serum GSH level as compared with serum samples in control group(G1)(P <0.05) .The oral administration of EEP and then induced asthma in (G3) caused a significant elevation in GSH as compared with results found in asthmatic group(G2) (P <0.05).Animal’ sadministration with EEP before induced asthma in (G4) showed almost the same concentration in GSH level as compared with control group as shown table (2).
Table2: Comparison between the control group (G1) and the three treatments on both alone to indicate any treatments more effect of GSH
|
p-value |
GSH (µmol/L) (M ± SD)
|
Groups of male Rats |
|
2.15±0.4 |
G1 |
|
|
p < 0.05 |
1.04±0.6 |
G2 |
|
p < 0.05 |
1.47±0.5 |
G3 |
|
Non sign |
2.1±0.4 |
G4 |
|
p < 0.05 |
0.9 |
LSD |
GSH concentration plays a central role of antioxidant defense system, which detoxifies ROS (18, 19). The decreased level of serum GSH in asthmatic group (G 2) may be returned to the increase in the oxidative stress ,and so that GSH becomes oxidized to its dimeric form (GSSG)as a result of its function as an antioxidant by acting as a approximate target for reactive oxygen species and other products of lipid peroxidation.This result agrees with(Nouf;2010)(20) that showed the decrease GSH level in Saudi Asthmatic patients . The enhancement in the GSH level caused by EEP may be returned to its antioxidant components such as flavonoids. Flavonoids are ideal scavengers of peroxyl radicals due to their favorable reduction potentials relative to alkyl peroxyl radicals, and thus they are effective inhibitors of lipid peroxidation (21). On the other hand, the elevation of GSH level in this group (group 3) may return to increase GSH production,where CAPE ,one of the propolis components ,is known to increase the expression of γ-glutamyl cysteine synthatase,an important enzyme in synthesis of GSH resulted in production of glutathione (22). The increased level of GSH in (group4) as compared with control group may be backed to that EEP increase the power and capacity of other endogenous antioxidant defense of the body and thus increase the steady state levels of GSH.
B-Nitric Oxide Level
The concentration of NO increased significantly in asthmatic rats (G2) as compared with control group (G1)(P <0.05). This is a marked elevation of NO which was significantly reduced by pre administration ofEEP in (G3)(P <0.05). In addition ,there is a almost the same concentration of NO showed in treated group with EEP and then induced asthma( G4)as compared with control group .show table (3).
Table3: Comparison between the control group (G1) and the three treatments on both alone to indicate any treatments more effect of Nitric oxide
|
p-value |
Nitric oxide(mg/dL) M ± SD))
|
Groups of male Rats |
|
3.84±1.1 |
G1 |
|
|
p < 0.05 |
19.85±2.6 |
G2 |
|
p < 0.05 |
16.82±1.9 |
G3 |
|
Non sign |
3.54±1.2 |
G4 |
|
p < 0.05 |
5.8 |
LSD |
NO play a critical role in the pathogenes is of airway inflammation in allergic asthma (23). The increased level of NO in (G2) may be due to OVA albumin which induced asthma .OVA induced airway inflammation, asthma and its greater expression of NOS in the lung tissue(23Airway inflammation occur as a result of increased expression and activity of NOS which increase NO realization and thus the numbers of eosinophils in the airway and airway inflammation (24, 25).
The significant decrease in NO values in rats were pretreated with EEP before induce asthmamight be attributed to the ability of EEP to inhibit different pathologic changes associating asthma or may be due to the effect of EEP to inhibited the OVA-induce and decrease level of IgE and NOS in serum of asthmatic rats . This result agrees with (El-Sayedet al 2013)(26).Where caffeic acid phenethyl ester, a biologically active ingredient of propolis ,showed inhibitory effects on the inflammatory cells (27)and it may be a main regent of the decrease level of the NOS and NO concentration in rats that received of EEP.
C-GlutathioneS-Transferase(GST).
The changes in the serum Glutathion –S-transferaseactivity of normal and experimental rats are illustrated in Figure (3) show significant reduction in the activity of GST in serum of rats in (G2) when compared with control group(G1),then simultaneous induced asthma and treatment with EEP (G 3) show increase activity of GST in serum of rats when compared with (G2),while in (G4) treatment with EEP before induced asthma was showed almost same activity of GST enzyme as compared with control group(G1),as shown in table (4).
Table4: Comparison between the control group (G1) and the three treatments on both alone to indicate any treatments more effect of GST
|
p-value |
GST activity (U/L) M ± SD))
|
Groups of male Rats |
|
25 ±1.3 |
Control |
|
|
p < 0.05 |
12.5±1.6 |
1 |
|
p < 0.05 |
18.12±2.3 |
2 |
|
Non sign |
24.96±1.1 |
3 |
|
p < 0.05 |
3.5 |
LSD |
The body has an effective mechanism to prevent and neutralize the free radicals induced damage.This is accomplished by a set of endogenous oxygen species and oxidant defenses are lost,oxidative stress results (28). The decrease activity of GST in asthmatic rats (G2) may return to the toxic effects of asthma. They are largely due to its active metabolite, the free radicals and that leads to increased oxidative stress (29, 30),or may be returned to the decrease availability of GSH in( G 2),the relation between GSH and GST its close, where it was well documented that GST enzyme catalyze the reaction via thiol(-SH) group of glutathione (GSH) by neutralizing and rendering the product more water soluble , this result agrees with (Cervello,et al :1992) (31). The elevation in serum GST activity of rats received EEP in (G3) might be due to the decline of the production of free radicals and /or by trapping and inhibited the formed free radicals and increasing of toxic metabolites of asthma that lead to increasing of antioxidant system. The EEP may inspire the induction of GST and other antioxidant enzymes by its chemical ingredients of phenyl propanoids(32).
Enzyme partially purified
Purification of Glutathione Transferase(GST) from Rat liver
The results predicted that the enzyme activity was found in the (50) % of asaturation ammonium sulfate precipitates (13).As shown in table (5), the specific activity was increased after dialysis.
Table5: partial purification steps of glutathione S-transferase (GST) from rat liverfor (G1, G2, G3 and G4) groups.
|
Purification stage |
Volumetaken(ml) |
Total protein mg/ml |
Activity U*/ml |
Specific activity U/mg Protein |
|
G1 |
||||
|
Cytosol Fractions: |
6 |
0.521 |
1.329 |
2.55 |
|
Precipitate by (NH4)2SO4 |
5 |
0.446 |
1.885 |
4.22 |
|
Supernatant |
3 |
0.211 |
0.4 |
1.89 |
|
Dialysis |
2.5 |
0.346 |
2.146 |
6.19 |
|
Sephadex G-75 (Fractions) |
0.5 |
0. 290 |
2.85 |
9.827 |
|
G2 |
||||
|
Cytosol Fractions: |
6 |
0.491 |
0.671 |
1.36 |
|
Precipitate by (NH4)2SO4 |
5 |
0.412 |
0.952 |
2.31 |
|
Supernatant |
3 |
0.191 |
0.23 |
1.2 |
|
Dialysis |
2.5 |
0.335 |
1.081 |
3.22 |
|
Sephadex G-75 (Fractions) |
0.5 |
0.281 |
1.43 |
5.08 |
|
G3 |
||||
|
Cytosol Fractions: |
6 |
0.489 |
0.97 |
1.98 |
|
Precipitate by (NH4)2SO4 |
5 |
0.392 |
1.37 |
3.49 |
|
Supernatant |
3 |
0.187 |
0.29 |
1.55 |
|
Dialysis |
2.5 |
0.322 |
1.56 |
4.84 |
|
Sephadex G-75 (Fractions) |
0.5 |
0.277 |
2.08 |
7.5 |
|
G4 |
||||
|
Cytosol Fractions: |
6 |
0.513 |
1.27 |
2.47 |
|
Precipitate by (NH4)2SO4 |
5 |
0.432 |
1.79 |
4.14 |
|
Supernatant |
3 |
0.201 |
0.38 |
1.89 |
|
Dialysis |
2.5 |
0.352 |
2.04 |
5.79 |
|
Sephadex G-75 (Fractions) |
0.5 |
0.288 |
2.71 |
9.4 |
Kinetic properties of purified glutathione-S-transferase enzyme
The results showed that the value Vmax in (G2)show significant reduction when compared with control group (G1), then simultaneous induced asthma and treatment with EEP (G3) show increase Vmax when compared with (G2), while in (G4) treatment with EEP before induced asthma was showed almost same Vmax as compared with control group .As show Figure (4) and table (6).
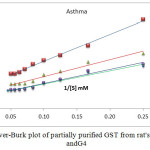 |
Figure1: Line weaver-Burk plot of partially purified GST from rat’s liver of G1, G2, G3 and G4
|
Table6: show value of Km and VMax for G1, G2, G3 andG4
|
groups |
VMax(μmol/min) |
Km(mmol/liter) |
|
G1 |
4.35 |
11.73 |
|
G2 |
2.40 |
13.20 |
|
G3 |
3.21 |
11.03 |
|
G4 |
4.48 |
12.96 |
The Michaelis-Menten constant (Km) of the enzyme was determined from Figure(4) by using a Line weaver-Burk plot by plotting the reciprocal of the invertedinitial velocity versus the reciprocal of the inverted substrate concentration.
Gene expression of Glutathione-S-Transferrase (GST)
Quantitative Reverse Transcriptase Real- Time PCR
Quantitative Reveres Transcription Real-Time PCR (RT-qPCR) was performed for measurement of relative quantification (gene expression analysis) for GSTM1 genes expression levels normalized by housekeeping gene expression.RT-qPCR quantification method in Real-Time PCR system was dependent on the values threshold cycle numbers (CT) of amplification plot of target genes and housekeeping gene. Where the result of Real-Time PCR amplification plot of housekeeping gene was appeared no difference in CT value, where the control group (CT=27) while the treatment groups which also appeared (CT=27).
Relative Gene Expression Results
The relative expression of target genes (GSTM1) in rats liver tissue was calculated by using Livak Method (2^-ΔΔCT) that dependent on normalization of RT-qPCR (CT values) of target genes with housekeeping gene (GAPDH) as reference gene in different groups.
The results of relative gene expression in GSTM1 gene which appeared clear difference in fold change of gene expression levels between different groups. Where, G2 was appeared up regulation at (5±1.3), G3 group was appeared up regulation at (2.9±1.6), G4 was appeared down regulation at (0.97±0.4), relative to control groups that is equal to 1 fold change of gene expression levels as in table (7) and table (8).
The statistical analysis of relative gene expression in GSTM1 gene was found significant differences in treatment groups compared with control groups at level (P<0.05) in table (9)
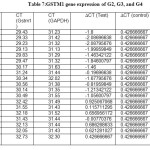 |
Table7: GSTM1 gene expression of G2, G3, and G4 Click here to View table |
Table8: GSTM1 gene expression of G 1
|
Exp. Group |
CT (GSTM1 ) |
CT (GAPDH) |
| G1 |
32.24 |
31.22 |
|
G1 |
32.89 |
31.25 |
|
G1 |
33.12 |
31.23 |
|
G1 |
32.34 |
31.37 |
|
G1 |
33.23 |
31.37 |
|
G1 |
32.54 |
31.29 |
|
Mean |
32.72666667 |
31.29 |
Table9: Comparison between the control group (G1) and the three treatments on both alone to indicate any treatments more effect GSTingene expression
|
Test result |
GSTM1 gene expression (M ± SD)
|
Groups of male Rats |
|
1± 0.5 |
G1 |
|
|
p < 0.05 |
5±1.3 |
G2 |
|
p < 0.05 |
2.9±1.6 |
G3 |
|
Non sign |
0.97±0.4 |
G4 |
|
p < 0.05 |
1.7 |
LSD |
Glutathione S-transferases (GST) include a number of subclasses, such as GST-P1 and GST-M1 that are expressed in the lungs and have been implicated in the pathogenesis of asthma. Children with GSTM1 null or GSTP1 val/val genotypes had increased respiratory symptoms upon exposure,As was calculated gene expression and show that result increase gene expression in (G2) when compared with (G1), while in (G4) was showed almost samegene expression as compared with control group.
Reference
- Hayes, J.D.; Pulford,D.J.Crit Rev BiochemMolBiol.J.1995, 30, 445-600.
- Boyland, E.;Chasseaud.L.F.Bio.chem.J. 1969, 115, 85-91.
- Mannervik,B.AdvEnzymolRelat Areas MolBoil. 1985, 57,357-417.
- Jakobsson, P.J.; Morgenstern, R.; Mancini, J., Ford-Hutchinson, A.;Persson,B.Protein Sci.J.1999, 8, 689–92.
- Board P.G.; Coggan, M.; Chelvanayagam, G.et al.,J. Biol. Chem.2000, 275, 24798-4806.
- Petrus, A.J.A.;Kalpana, K.; Devi A.B.Orient J Chem2014; 30, 1197-1203.
- Mannervik, B.;Pacifici, G.M.;Warholm, M.;Guthenberg, C.;Rane,A. Pharmacology J.1986, 35, 1616–1619.
- Alsalman, A.R., Almashhedy, L,A.; Hadwan, M.H. Life Sci. J.2013, 10, 989–997.
- Brasch-Andersen, C.; Christiansen, L.; Tan, Q.;Haagerup A.;Vestbo, J.; Kruse, T.A.J. Hum Mutat.2004, 24, 208–14.
- Saadat, M.;Saadat, I;Saboori, Z.; Emad, A. J Allergy ClinImmun.2004113:996–98.
- Keyvanfard, M.; Alizad, K. Orient J Chem2014, 30, 593-599.
- Hadwan, M.H.; Almashhedy, L.A.; Alsalman, A.S. Reprod. Biol. &Endocrinol.2014, 12:1.
- Habig,W.H.;Pabst,M.J.; Jakoby,W.B.J. Biol. Chem1974,249, 7130.
- Dixon, M.; Webb, E.C. Enzyme fractionation by salting out: A theoretical note, in advances in protein chemistry, (C.B. Anfinsen et al., Eds.), Academic Press, New York.J. ,. 16, pp. 197-219( 1961).
- Schacterle, G.R.; Pollack, R.L.A.Anal. Biochem.J.1973, 51, 654-55.
- Robyt, J.F. and White, B.J. Biochemical techniques, Theory and practice. Wadsworth, Inc., Belmont, California, USA. (1987).
- Brasch-Andersen, C.; Christiansen, L.; Tan, Q.;Haagerup, A.; Vestbo, J.; Kruse, T.A. J. Hum Mutat2004, 24, 208–214.
- Meister, A. meth enzymolJ., 1995,251, 3- 7.
- Sen,C.K. and Hanninen ,O. “Handbook of oxidant and Antioxidant in Exercise” 1sted .Elsevier Press.AmSterdam,( 2000).
- Nouf, O.A. “Oxidative stress and Antioxidant status in Saudi Asthmatic Patients” .King Saud University Science. (Thesis)M .S. (thesis).(2010).
- Hee,S.P.;So,R.;Ju, O.; Yong ,C.L. J.Molecules2010, 15,6810-6834.
- Sirag,H.M.;Ibrahim,H.A.;Amer,A.A.;Salam,T.A.;Samaka,R.M.; El- Mowafy,Y.A. Ann of Biol Res. J 2011, 2, 503-515.
- In-Sik, S.;Mee-Young,L.; Hyekyung, H.; Woo-Young, J.;Chang-Seob, S.; Hyeun-Kyoo,S. J . inflamm. 2012, 9, 9-41.
- Zhou, D.Y.; Du,Q.; Li,R.R.; Huang, M.;Zhang, Q.; Wei, G.Z.Plant. Med .J.2011, 77, 1575-1581.
- Hesslinger, C.; Strub,A.; Boer,R.C.Biochem.Soc Trans. J. 2009, 37:881-891.
- El-Sayed, M.A.; Nariman, M.G.; Manar, A.N.; Noha,M.S.; .J.Aller. Ther.2013; S11:006.
- Jung, W.K.; Lee, D.Y.; Choi, Y.H.;Yea,S.S.; Choi,I. Life Sci.J.2008,82, 797- 805.
- Alsalman, A.R., Almashhedy, L,A.; Hadwan, M.H. BioTechnology: An Indian Journal. 2014, 9, 267-272.
- Zghair A.A.; Jabir F.A. Int J Pharm Bio Sci.2015,6, 1339 – 1351.
- Srinivasa,D.R.;Prasada,V.R.;Sambisiva,K.R.S.R.Int J. adv. Pharm. Sci2010, 1.
- Cervello,I.;Lafuente,A.;Giralt, M.; Mallol,J. placenta.J.1992, 13, 273-280.
- Korkina, L. G.cell. Mol…Biol. J.2007, 53, 15-25.

This work is licensed under a Creative Commons Attribution 4.0 International License.
![]()
A New Edition of Web of Science
Journal Impact Factor
2022: 0.5
Five Year: 0.8
Journal is Indexed in

Cabells Whitelist
![]()


