

Abstract
Chorea-acanthocytosis (ChAc) is a fatal neurological disorder characterized by red blood cell acanthocytes and striatal neurodegeneration. Recently, severe cell membrane disturbances based on depolymerized cortical actin and an elevated Lyn kinase activity in erythrocytes from ChAc patients were identified. How this contributes to the mechanism of neurodegeneration is still unknown. To gain insight into the pathophysiology, we established a ChAc patient-derived induced pluripotent stem cell model and an efficient differentiation protocol providing a large population of human striatal medium spiny neurons (MSNs), the main target of neurodegeneration in ChAc. Patient-derived MSNs displayed enhanced neurite outgrowth and ramification, whereas synaptic density was similar to controls. Electrophysiological analysis revealed a pathologically elevated synaptic activity in ChAc MSNs. Treatment with the F-actin stabilizer phallacidin or the Src kinase inhibitor PP2 resulted in the significant reduction of disinhibited synaptic currents to healthy control levels, suggesting a Src kinase- and actin-dependent mechanism. This was underlined by increased G/F-actin ratios and elevated Lyn kinase activity in patient-derived MSNs. These data indicate that F-actin stabilization and Src kinase inhibition represent potential therapeutic targets in ChAc that may restore neuronal function.
SIGNIFICANCE STATEMENT Chorea-acanthocytosis (ChAc) is a fatal neurodegenerative disease without a known cure. To gain pathophysiological insight, we newly established a human in vitro model using skin biopsies from ChAc patients to generate disease-specific induced pluripotent stem cells (iPSCs) and developed an efficient iPSC differentiation protocol providing striatal medium spiny neurons. Using patch-clamp electrophysiology, we detected a pathologically enhanced synaptic activity in ChAc neurons. Healthy control levels of synaptic activity could be restored by treatment of ChAc neurons with the F-actin stabilizer phallacidin and the Src kinase inhibitor PP2. Because Src kinases are involved in bridging the membrane to the actin cytoskeleton by membrane protein phosphorylation, our data suggest an actin-dependent mechanism of this dysfunctional phenotype and potential treatment targets in ChAc.
- actin cytoskeleton
- chorea-acanthocytosis
- human induced pluripotent stem cells
- patch-clamp electrophysiology
- Src kinase
- striatal medium spiny neurons
Introduction
Neuroacanthocytosis (NA) syndromes are characterized by progressive degeneration of the basal ganglia and abnormal spiny red blood cells called acanthocytes. The core NA syndromes are the autosomal-recessive chorea-acanthocytosis (ChAc) and the X-linked McLeod syndrome, with an estimated prevalence of <1–5 per 1,000,000 inhabitants of the general world population (Danek et al., 2001; Al-Asmi et al., 2005; Dobson-Stone et al., 2005; Jung et al., 2011; Hermann and Walker, 2015). ChAc is described as a progressive hyperkinetic movement disorder with cognitive dysfunction, behavioral abnormalities, and variable acanthocytosis of red blood cells. In the progression of the disease, most patients develop a characteristic phenotype including chorea, a “feeding dystonia” with tongue protrusions (Bader et al., 2010), orofacial dyskinesia, involuntary vocalizations, dysarthria, and involuntary tongue and lip biting. ChAc is associated with epileptic seizures often appearing as initial symptoms in adolescence and additional multisystem features including myopathy and axonal neuropathy of variable degree. Cerebral magnetic resonance imaging may demonstrate striatal atrophy. The disease course usually begins in the second to the third decade and progresses chronically to major disability and premature death of the patient due to various complications after 15–30 years (Jung et al., 2011). There is currently only symptomatic treatment available.
ChAc is caused by mutations in the VPS13A gene leading to a loss of the protein chorein that is expressed in various cell types (Ueno et al., 2001; Velayos-Baeza et al., 2004). Chorein is a very large protein suggested to be involved in vacuolar protein sorting and morphogenetic membrane regulation in yeast (Ueno et al., 2001; Velayos-Baeza et al., 2004; Park and Neiman, 2012). The insufficient pathophysiological knowledge regarding ChAc relates to the lack of specific chorein antibodies and the limited availability of suitable (especially mammalian) animal models (Tomemori et al., 2005). Western blots for chorein demonstrate absence of this protein in red blood cells of ChAc patients (Dobson-Stone et al., 2002, 2004, 2005). Despite the identification of causative mutations in the VPS13A gene several years ago, the detailed function of the encoded protein and the mechanisms by which the disease-specific mutations cause neurodegeneration remain unclear. The association of the acanthocytic membrane abnormality with neurodegeneration, however, suggests a common pathogenetic pathway.
Recently, severe actin-related cell membrane disturbances and elevated Lyn kinase activity in erythrocytes from ChAc patients have been identified (De Franceschi et al., 2011a; Föller et al., 2012; Schmidt et al., 2013; Honisch et al., 2015). Actin negatively regulates vesicle fusion, as demonstrated by experiments in which depolymerization of cortical actin stimulates exocytosis in a variety of non-neuronal cell types (Burgoyne and Cheek, 1987; Muallem et al., 1995; Vitale et al., 1995). The polymerized form of actin, filamentous or F-actin, is the major cytoskeletal element identified in presynaptic nerve terminals (Fifková and Delay, 1982; Gotow et al., 1991). In cultured hippocampal neurons, F-actin depolymerization by latrunculin A increases exocytosis rapidly by a mechanism independent of intracellular Ca2+. These findings indicate that either actin itself or proteins that link to the actin cytoskeleton participate in a regulatory mechanism that restrains fusion of synaptic vesicles at the active zone (Morales et al., 2000).
To investigate pathophysiological mechanisms, we established a human in vitro model of ChAc using reprogrammed skin fibroblasts from patients to generate disease-specific induced pluripotent stem cells (iPSCs). We hypothesized that a disturbed actin polymerization in ChAc leads to a pathological synaptic hyperactivity preceding degeneration of striatal GABAergic interneurons. Therefore, we developed an efficient iPSC differentiation protocol providing a large number of striatal medium spiny neurons (MSNs) and performed detailed functional analyses of voltage- and ligand-gated ion channels and synaptic activity of disease-specific neurons and healthy controls to identify potential therapeutic targets for the treatment of ChAc.
Materials and Methods
Induction, cultivation, and three-germ-layer differentiation of human iPSCs (hiPSCs).
Skin biopsy of lines not published previously was taken after informed consent according to the approval of the ethical committee of the Medical Faculty of the Technische Universität Dresden (EK 45022009). Human dermal fibroblasts (HDFs) of two female ChAc patients (born 1977 and 1962), referred to as mutant (Mut), as well as HDFs from healthy sex- and age-matched control persons (born 1965 and 1959) referred to as wild-type (WT), were reprogrammed to iPSCs as described previously (Reinhardt et al., 2013a). Briefly, HDFs were retrovirally transduced with OCT4, SOX2, KLF4, and c-MYC. After 14–21 d, emerging iPSC colonies were isolated clonally and further cultivated.
hiPSCs were cultivated on mitomycin C (Tocris Bioscience)-inactivated mouse embryo fibroblast feeder cells in human embryonic stem cell (hESC) medium, which consisted of knock-out DMEM (Life Technologies), 20% knock-out serum replacement (Life Technologies), 0.1 mm β-mercaptoethanol, 1% penicillin/streptomycin/glutamine (PSG), 1% nonessential amino acids, and 5 ng/ml human FGF2 (Peprotech). iPSCs were passaged every 5–7 d using 1 mg/ml collagenase IV or dispase (both from Life Technologies).
For three-germ-layer differentiation, iPSCs were detached from the feeder layer as colonies to form embryoid bodies (EBs) using 2 mg/ml collagenase IV for 45 min. Colony pieces were collected by sedimentation and resuspended in hESC medium without FGF2 supplemented with 1 μm dorsomorphin (Tocris Bioscience), 10 μm SB-431542 (Abcam), and 5 μm Y27632 Rho-kinase (ROCK) inhibitor, and plated onto non-cell-culture-treated plastic Petri dishes to form EBs. Two and 4 d later, the medium was changed to hESC medium without any additional supplements. Six days later, EBs were either plated on Matrigel (BD Biosciences)-coated plastic dishes in N2B27 medium (see below) for ectoderm formation or on gelatin (Sigma-Aldrich)-coated plates in DMEM with 1% PSG and 20% fetal calf serum (Biochrom) for mesoderm and endoderm differentiation. The medium was changed every 3 d and cells were fixed and analyzed by immunocytochemistry after 2 weeks.
Differentiation of striatal MSNs.
To differentiate hiPSCs into MSNs, colonies were detached from the feeder layer using collagenase or dispase 2–3 d after splitting to form EBs. Detached colonies were collected by sedimentation and resuspended in hESC medium without FGF2, supplemented with 1 μm dorsomorphin, 10 μm SB-431542, 1 μm IWP2 (Millipore), and 5 μm Y27632 ROCK inhibitor, and plated on non-cell-culture-treated plastic Petri dishes to prevent cell attachment (day 0). Two days later, the medium was replaced with a 1:1 mixture of hESC and N2 medium (DMEM/F-12, with 1:100 N2 supplement, both Life Technologies, 1% PSG), supplemented with the same concentrations of dorsomorphin, SB-431542, and IWP2 as mentioned above (day 2). Two days later, the medium was changed to N2 medium with the same combination of small molecules (day 4). On days 6 and 8, the medium was replaced with N2 medium containing 0.6 μm purmorphamine (PMA; Alexis) and 1 μm IWP2. On day 10, small-molecule supplements were withdrawn and, on days 12–14, EBs were plated on Matrigel-coated plates (Corning) in N2B27 maturation medium (1:1 DMEM/F-12 and Neurobasal medium containing 1:200 N2, 1:100 B27 without vitamin A, all from Life Technologies, and 1% PSG), supplemented with 20 ng/ml brain-derived neurothropic factor (BDNF), 10 ng/ml glial cell line-derived neurotrophic factor (GDNF), 1 ng/ml transforming growth factor-β 3 (TGFβ3) (all from Peprotech), and 0.5 mm dibutyryl-cAMP (dbcAMP; Sigma-Aldrich). The medium was changed every other day. Once the outgrowing cells became too confluent (days 20–24), cells were replated. Cultures were treated for 2 min with fresh, prewarmed Accutase (Sigma-Aldrich), washed once with PBS and N2B27 each, and detached in maturation medium with a cell scraper. After pipetting to break the cell clusters into smaller clumps, cells were replated at a 1:3 ratio on fresh Matrigel-coated plates in maturation medium. To replate the cultures as single cells at ∼day 30 or at earlier time points, as indicated, neuronal cultures were digested using fresh, warm Accutase supplemented with 10 μm Y27632 ROCK inhibitor for up to 1 h. Cultures were carefully pipetted to a single-cell suspension, diluted at least 1:10 in N2B27 medium with ROCK inhibitor, collected by centrifugation for 5 min at 200 × g, and replated in maturation medium with ROCK inhibitor. ROCK inhibitor was withdrawn the day after splitting.
Cell quantification after long-term cell culture.
Mature MSNs were differentiated for at least 3 months (4 separate experiments using 5 healthy control and 4 ChAc clones). Cells were washed once with PBS and then treated with Accutase for 1 h. The reaction solution was then diluted with DMEM/F12, centrifuged at 200 × g for 4 min, the supernatant discarded, and the pellet resuspended in a 1:1 mixture of DMEM/F12 and Neurobasal medium without phenol red. Cells were gently triturated to yield a homogeneous suspension. The solution was incubated with 7.5 μg/ml Hoechst33342 (Life Technologies) and analyzed with excitation at 360 nm and measuring emission at 460 nm using a GENios fluorescence microplate reader (Tecan) and Magellan version 7.2 software (Tecan). Background values were obtained by measuring 7.5 μg/ml Hoechst33342 in cell-free solution and deducted from the samples. Quantification was done relative to healthy controls and a Student's t test with p < 0.05 considered significant.
Differentiation of midbrain dopaminergic neurons.
iPSCs were converted into neural precursor cells that could be maintained independently and propagated to yield a homogeneous starting condition for differentiation into tyrosine hydroxylase-positive midbrain dopaminergic neurons (mDANs), as described previously (Reinhardt et al., 2013b). In short, 1 × 10⁵ cells per cm2 were seeded in PLO/laminin-coated dishes and fed with N2B27 medium (1:1 DMEM/F-12 and Neurobasal medium containing 1:200 N2, 1:100 B27 without vitamin A, all from Life Technologies, and 1% PSG), supplemented with 200 μm AA, 1 μm PMA, and 100 ng/ml FGF8 (R&D Systems) every other day for 10 d. Thereafter cells were splitted using Accutase (Life Technologies) and reseeded with a density of 5 × 10⁴ cells per cm2 on PLO/laminin-coated dishes and fed every other day for 14 d with N2B27 medium supplemented with 200 μm AA (Sigma-Aldrich), 5 ng/ml BDNF (Promega), 10 ng/ml GDNF (Sigma-Aldrich), 1 ng/ml TGF-β3 (Peprotech), and 250 μm dbcAMP (Sigma-Aldrich). Differentiated mDANs were only used for Western blots of the G/F-actin ratio and Lyn kinase activation levels compared with MSNs.
G/F-actin Western blots.
The protocol for G/F-actin Western blots was adapted from Föller et al. (2012). Mature neurons were washed with ice-cold PBS containing phosphatase inhibitor (Thermo Fisher Scientific). Cells were then incubated with extraction buffer consisting of 0.3% Triton X-100 (Thermo Fisher Scientific), 5 mm Tris/HCl (Roth), pH 7.4, 2 mm EGTA (Roth), 300 mm sucrose (Roth), 2 μm phalloidin (Tocris Bioscience), and 1:100 protease inhibitor (Thermo Fisher Scientific) for 5 min on ice. The supernatant was collected and the same volume of RIPA lysis buffer was applied containing 50 mm Tris/HCl, pH 7.4, 1% Triton X-100, 1% sodium deoxycholate (Sigma-Aldrich), 0.1% SDS (Roth), 0.15 m NaCl (Roth), 1 mm EDTA (Roth), 1 mm DTT (Roth), and 1 mm sodium orthovanadate (Sigma-Aldrich). Cells were scrapped off and incubated in the lysis buffer for 15 min on ice. The remaining insoluble pellet was removed by centrifugation at 10,000 × g for 2 min and discarded. Globular actin (G-actin) and filamentous actin (F-actin)-containing fractions were both mixed 3:1 with SDS loading buffer (Life Technologies) and 10 μl was pipetted into precast 12% Bis-Tris gels (Life Technologies). For 75 min, 140 V/60 mA were applied to the gels, which were then blotted on nitrocellulose membranes (Life Technologies) for 8 min using the dry blot system iBlot (Life Technologies). Membranes were blocked for 1 h using 5% skim milk powder solved in PBST. Rabid polyclonal anti-actin (1:500; Cell Signaling Technology) was diluted in 1% skim milk PBST solution and incubated overnight. Samples were washed 5 times with PBST and then incubated for 1 h with HRP-conjugated secondary antibody (1:5000; Jackson ImmunoResearch) dissolved in 1% skim milk PBST solution. Membranes were washed four times with PBST and one time with ddH2O before development was conducted using the ECL Western blot detection kit (GE Healthcare) with an LAS3000 imager (Fujifilm). Densitometry was done using TotalLab Quant software. For quantification of G/F-actin ratios by Western blots, we compared MSNs (5 separate experiments using a total of 17 healthy control and 9 ChAc clones) and mDAN (3 independent experiments with 16 control and 9 ChAc clones) using a Student's t test with p < 0.05 considered significant.
Lyn kinase Western blot.
MSNs and mDAN (3 independent experiments with up to 3 ChAc and control clones) were lysed in Bicina-based buffer in presence of proteasome 20S inhibitor, bortezomib) as described previously (De Franceschi et al., 1997, 2011b; Franco et al., 2014). For mono-dimensional electrophoresis, proteins from neurons were solubilized in reducing sample buffer (50 mm Tris, pH 6.8, 2% w/v SDS, 10% v/v glycerol, 100 mm β-mercaptoethanol, and a few grains of bromphenol blue). Gels were transferred to nitrocellulose membranes for immunoblot analysis with specific antibodies anti-Lyn (2732; Cell Signaling Technology), anti-phospho-Lyn (p-Lyn 396; Cell Signaling Technology), and anti-GAPDH or anti-actin (Sigma-Aldrich). Blots were developed using HRP chemiluminescence detection reagents. Densitometric analysis of band intensities was performed with Quantity One analysis software (Bio-Rad) using a Student's t test with p < 0.05 considered significant.
Cofilin and profilin Western blots.
For Western blot analysis of cofilin and profilin 2a, frozen iPSC pellets were lysed with RIPA buffer containing the following (in mm): 137 NaCl, 50 NaF, 20 Tris-HCl, pH 7.5, 25 b-glycerophosphate, 2 EDTA, 1 sodium orthovanadate, and 1 phenylmethylsulfonylfluoride (PMSF) plus 2% (v/v) protease inhibitor cocktail (EDTA-free; Roche), 1% (v/v) Triton X-100, 1% (w/v) sodium desoxycholate, and 1% (v/v) phosphatase inhibitor cocktail 1 (Roche), sonicated, and incubated for 30 min on ice. Nonsoluble debris were centrifuged and protein concentration on the supernatant was determined with a BCA assay (Pierce). SDS-PAGE and Western blots were performed with equal protein amounts as described previously (Claus et al., 2003). Blots for incubation with anti-phospho-antibodies were blocked with BSA, all other blots were blocked with dried milk in TBS–Triton.
The following primary antibodies were used for Western blot analysis: mouse anti-βIII tubulin (1:3000, clone 2G10, 05–559; Millipore), mouse anti-GAPDH (1:4000; Millipore), rabbit anti-phospho (Ser-138) profilin (1:1000, PPU4791; ECM Biosciences), rabbit anti-profilin (1:1000, PPU821; ECM Biosciences), rabbit anti-phospho (hSer-3) cofilin (1:1000, sc-12912R; Santa Cruz Biotechnology), rabbit anti-cofilin (D3FD) XP (1:1000; CST; 5175). HRP-conjugated secondary antibodies (sheep anti-mouse, 1:4000, GE Healthcare; goat anti-rabbit, 1:4000, Pierce) were used for visualization by chemiluminescence imaging using Immobilon reagent (Millipore).
Immunocytochemical staining.
Cells were fixed with 4% paraformaldehyde and blocked for 45 min in blocking buffer (5% goat serum, 1% BSA, 0.3% Triton X-100 in PBS). Primary antibodies were as follows: mouse monoclonal anti-β III tubulin (TUBB3, 1:500, Millipore or 1:1000, Covance), rabbit polyclonal anti-Map2 (1:500, Cell Signaling Technology, or 1:1000, Santa Cruz Biotechnology), rabbit polyclonal anti-GABA (1:2000; Sigma-Aldrich), mouse monoclonal anti-GABA (1:200; Sigma-Aldrich), rabbit polyclonal anti-DARPP32 (1:200; Santa Cruz Biotechnology), mouse monoclonal anti-Nestin (1:300; R&D Systems), rabbit polyclonal anti-FOXG1 (1:300; Abcam), mouse monoclonal anti-GAD67 (1:200; Millipore), goat polyclonal anti-SOX2 (1:200; Santa Cruz Biotechnology), mouse monoclonal anti-OCT4 (1:100; Santa Cruz Biotechnology), goat polyclonal anti-NANOG (1:50; R&D Systems), mouse monoclonal anti-TRA1–81 (1:100; Millipore), mouse monoclonal anti-SSEA4 (1 μg/ml; Developmental Studies Hybridoma Bank), mouse monoclonal anti-AFP (1:300; Sigma-Aldrich), and mouse monoclonal anti-SMA (1:100, Dako) were applied overnight at 4°C. Appropriate secondary antibodies (Alexa Fluor labeled, 1:500, Life Technologies) were incubated for 1 h at room temperature and nuclei were counterstained with DAPI (10 mg/ml; Life Technologies) or Hoechst (Applichem), as indicated. Images were taken with an Olympus DP72 camera under an Olympus BX61 fluorescent microscope using the image-analysis software CellF (Olympus) or on a Zeiss Axiovert Fluorescence microscope. Cell counts were performed within three randomly selected visual fields from at least three independent differentiation experiments. Cell counts for the differentiation efficiencies were performed with the Cellomics ArrayScan in an automated fashion on cultures that were fixed 2 d after reseeding.
Analysis of neuronal morphology and synaptic density.
Cultures were stained with a βIII-tubulin antibody (1:500; Millipore), as well as an antibody directed against GABA (1:2000; Sigma-Aldrich) and images were taken with an Olympus BX60 using Olympus cellSens imaging software. The experimenter performing microscopy and analysis was blinded and images were arbitrarily selected. All automated imaging acquisition algorithms were inactivated and pictures were taken with a constant exposure time and gain for each channel, ensuring comparability between images. Images were preprocessed using a preinstalled ImageJ version 1.46r algorithm unsharp mask with a radius (σ) of 1.0 and a mask weight of 0.6. ImageJ-based plugin NeurphologyJ (Ho et al., 2011) was used to quantify soma, neurites, attachment points, and end points. Briefly, the plugin uses two different thresholds for somata and neurites, as well as the information of the approximate neurite thickness for detection and quantification of number of somata and neurites, the area of somata and neurites, and the total neurite length within an image. Those parameters were used to normalize neurites by somata obtaining a quantitative expression for total neurite outgrowth within an image. Similarly, the end points of a neurite were normalized by soma attachment points receiving an expression for ramification. GABAergic staining was used for quantification of synaptic density using the ImageJ plugin SynapCountJ (version 2.0) and NeuronJ (version 1.4.3) (Meijering et al., 2004) as described previously (Hensel et al., 2016). Briefly, NeuronJ was used to trace a neurite with a distance of 30 μm to the soma for a total length of at least 100 μm. This tracing was applied to SynapCountJ, in which GABA-positive spots along the tracing were detected within an intensity threshold. 20 images of each culture were analyzed for morphology and synaptic density and each of the different quantitative outcomes were averaged to a single value avoiding pseudo-replicates. This value was subsequently subjected to statistical analysis using a Student's t test with p < 0.05 considered significant.
Electrophysiology.
Electrophysiological measurements of two ChAc patient and three control cell lines were performed after 40 d of differentiation in vitro from at least three independent differentiation experiments as described previously (Stanslowsky et al., 2014). In brief, patch pipettes with final resistances of 3–4 MΩ were filled with the internal solution consisting of the following (in mm): 153 KCl, 1 MgCl2, 10 HEPES, 5 EGTA, and 2 Mg-ATP, adjusted to pH 7.3 with KOH (305 mOsm). The bath solution contained the following (in mm): 142 NaCl, 8 KCl, 1 CaCl2, 6 MgCl2, 10 glucose, and 10 HEPES, adjusted to pH 7.4 with NaOH (325 mOsm). Whole-cell currents were low-pass filtered at 2.9 kHz, digitized at 10 kHz using an EPC-10 amplifier (HEKA), and analyzed with Patch Master (HEKA). Sodium and potassium ion currents were elicited by depolarizing voltage steps in increments of 10 mV from a holding potential of −70 to 40 mV. Miniature postsynaptic currents (mPSCs) were acquired by recording 72 s traces at a holding potential of −70 mV. Action potentials (APs) were evoked in response to depolarizing current pulses in current-clamp mode. Spontaneous APs and membrane potentials were recorded by clamping the cells at 0 pA. Tetrodotoxin (TTX, 1 μm), tetraethyl ammonium chloride (TEA, 10 mm), bicuculline (10 μm), and NBQX (10 μm, all purchased from Sigma-Aldrich) diluted in the bath solution were applied via gravity using a modified SF-77B perfusion fast-step system (Warner Instruments).
Drug treatment of differentiating hiPSCs.
To investigate the influence of the F-actin stabilizer phallacidin (Santa Cruz Biotechnology) and the inhibitor of the Src-family of tyrosine kinases, PP2 (Sigma-Aldrich), on electrophysiological properties of differentiating hiPSCs in vitro, separate functional experiments were performed. After 37 d of differentiation, cells from ChAc patients and healthy controls were treated with 100 nm phallacidin or 10 μm PP2 for 72 h before analysis. Appropriate controls without drug treatments were cultured in parallel. The given drug concentrations were chosen because they had no effects on cell viability and proved to be efficient in former studies (De Franceschi et al., 2011a; Föller et al., 2012). The drugs were renewed with every medium change. The stock solutions were prepared by dissolving phallacidin in dH2O at a concentration of 1 mm and PP2 in DMSO at a concentration of 10 mm.
Calcium imaging.
Monitoring of cytosolic calcium transients was performed as described previously (Stanslowsky et al., 2014). Cells from ChAc patients and healthy controls were incubated for 30 min at 37°C with Fura 2-AM (Sigma-Aldrich) in standard bath solution containing the following (in mm): 140 NaCl, 5 KCl, 2 CaCl2, 10 glucose, and 10 HEPES, adjusted to pH 7.4 with NaOH. Intracellular Ca2+ changes were imaged by exciting Fura 2-AM at 340 and 380 nm and monitoring its emission in intervals of 300 ms at 510 nm with the Life Acquisition Software (T.I.L.L. Photonics) coupled to an upright microscope (Axioskop 2 FS plus; Zeiss). Recordings were terminated by applying 50 mm KCl to ensure the viability of the recorded cells. After background subtraction, the 340/380 nm excitation ratio for Fura 2-AM was calculated, which increases as a function of the cytosolic free Ca2+ ([Ca2+]i).
Reverse transcription and qRT-PCR.
Total RNA was extracted using the RNeasy Micro Kit (Qiagen) and reversely transcribed using oligo-dT primer and Superscript II reverse transcriptase (Life Technologies) according to manufacturers' instructions. qRT-PCR experiments were performed as described previously (Stanslowsky et al., 2014). Primer information is provided in Table 1. Target gene expressions are given as means ± SEM, normalized to the endogenous references (β2-microglobulin or GAPDH and ACTB) and relative to the expression in undifferentiated iPSCs.
List of oligosequences used for qRT-PCR analysis
Statistics.
Data were analyzed with GraphPad Prism 5 software if not otherwise stated. Morphological analyses, G/F-actin ratios, and Lyn kinase activation levels were calculated using a Student's t test. Sodium (INa) and potassium (IK) amplitudes during depolarization were compared by two-way ANOVA and Bonferroni's posttest. AP properties, synaptic activity, calcium influx, and gene expression data were analyzed statistically by a nonparametric Mann–Whitney test. All data are presented as means ± SEM and the significance level was set at p < 0.05.
Results
Generation of hiPSCs from ChAc patients and healthy controls
For functional analyses we generated human iPSCs from two patients harboring the mutations c.4282G>C and c.7806G>A (Mut 2) as well as confirmed absence of the chorein protein (Mut 1 and Mut 2) by Western blots. Interestingly, the ChAc patient cell line Mut 1 did not show an obvious mutation in the VPS13A gene (encodes the >3000 aa chorein protein), although almost the complete exon sequence was investigated. However, for the generation of patient-derived iPSC lines, the loss of chorein expression was most important. As controls, we derived iPSCs from three healthy age-matched females. Clonal iPSC lines were derived from each fibroblast line. Multiple assays were applied to confirm successful reprogramming. All hiPSC lines expressed the pluripotency markers NANOG, OCT4, TRA 1–81, and SSEA4 (Fig. 1A). The pluripotency was confirmed using EB-based differentiation into cells of all three germ layers (ectoderm, mesoderm, and endoderm) as shown by immunochemical staining for TUBB3, AFP, and SMA (Fig. 1B). qRT-PCR demonstrated that iPSCs expressed pluripotency markers at levels comparable to that of hESCs (Fig. 1C) and showed efficient silencing of the retroviral reprogramming constructs (Fig. 1D). Single nucleotide polymorphism array-based karyotyping was used to confirm euploidy of the generated iPSC lines (data not shown).

Characterization of hiPSC lines. A, All hiPSC lines used in this study expressed the pluripotency markers NANOG, OCT4, TRA1–81, and SSEA4 as seen by immunocytochemical stainings. B, To show pluripotency, iPSC lines were differentiated in vitro into cells expressing markers of all three germ layers: ectoderm (TUBB3), endoderm (AFP), and mesoderm (SMA). For A and B, WT1–1 and Mut1 are shown as representative lines. Nuclei were counterstained with Hoechst. Scale bars, 100 μm. C, qRT-PCR revealed that all iPSC lines expressed a comparable level of pluripotency markers as the hESC line HUES6. D, Retroviral transgenes used for reprogramming were efficiently silenced in established iPSC lines. Expression was normalized to a freshly infected human fibroblast sample 4 d postinfection (dpi). Data are presented as means ± SEM using GAPDH and BACT as housekeeping genes.
Differentiation of hiPSCs to striatal MSNs
Because particular striatal interneurons are the main target of neurodegeneration in ChAc, we established a hiPSC differentiation protocol (Fig. 2) providing a large population of GABAergic forebrain neurons and DARPP32-immunopositive striatal MSNs. To induce a neuroectodermal fate in hiPSCs efficiently, we used a combination of double SMAD inhibition by dorsomorphin and SB-431542 and application of the porcine inhibitor IWP2 that prevents the production of endogenous, posteriorizing WNT proteins. This strongly induced the expression of the forebrain marker FOXG1 in the differentiating EBs (Fig. 3A). Shortly after neural induction, the neuroepithelial cells were ventralized using PMA, a small-molecule agonist of the sonic hedgehog signaling pathway, and plated in maturation medium on day 8 of differentiation. At this time point, the EBs contained neuronal cells expressing the telencephalic marker FOXG1, the lateral ganglionic eminence markers GSH2 and DLX2 (data not shown), as well as the neural progenitor marker NESTIN (Fig. 3B). In the course of maturation, the cells started to express the early neuronal marker TUBB3 (Fig. 3C). Because MSNs typically have a GABAergic phenotype, the expression of glutamate decarboxylase (GAD67), the neurotransmitter GABA, and DARPP32 was assessed by qRT-PCR and immunocytochemical analysis. After 30 d of differentiation, the hiPSC lines analyzed showed a comparable expression of FOXG1, GAD67, and the mature neuronal marker MAP2 (Fig. 3D). High-content analysis after reseeding the cells as single cells at day 30 revealed that the different hiPSC lines matured with a good reproducibility in respect to the differentiation efficiency. Most of the TUBB3+ neurons expressed FOXG1, ∼80% were GABA positive, and ∼40% expressed DARPP32 (Fig. 3E–G). Quantitative real-time PCR analysis determined a more pronounced expression of dopamine receptor 2 (DRD2) than dopamine receptor 1 (DRD1) in ChAc and control MSNs (data not shown). Although this difference was not significant, these data suggest that the generated mixed MSN population in differentiated cultures is predominantly of the D2 type (the “indirect pathway”), which is mainly affected in neuroacanthocytosis patients (Brooks et al., 1991).

Sequential induction of hiPSCs toward MSNs. A, Schematic summary of the differentiation procedure. B–D, Phase-contrast images during in vitro differentiation. hiPSC colonies were detached from the feeder layer and cultured in suspension as EBs in the presence of small molecules as indicated. On days 12–14, EBs were plated on Matrigel-coated cell culture dishes. Neuronal cells started to spread out and matured through the addition of various growth factors. Scale bars, 100 μm.
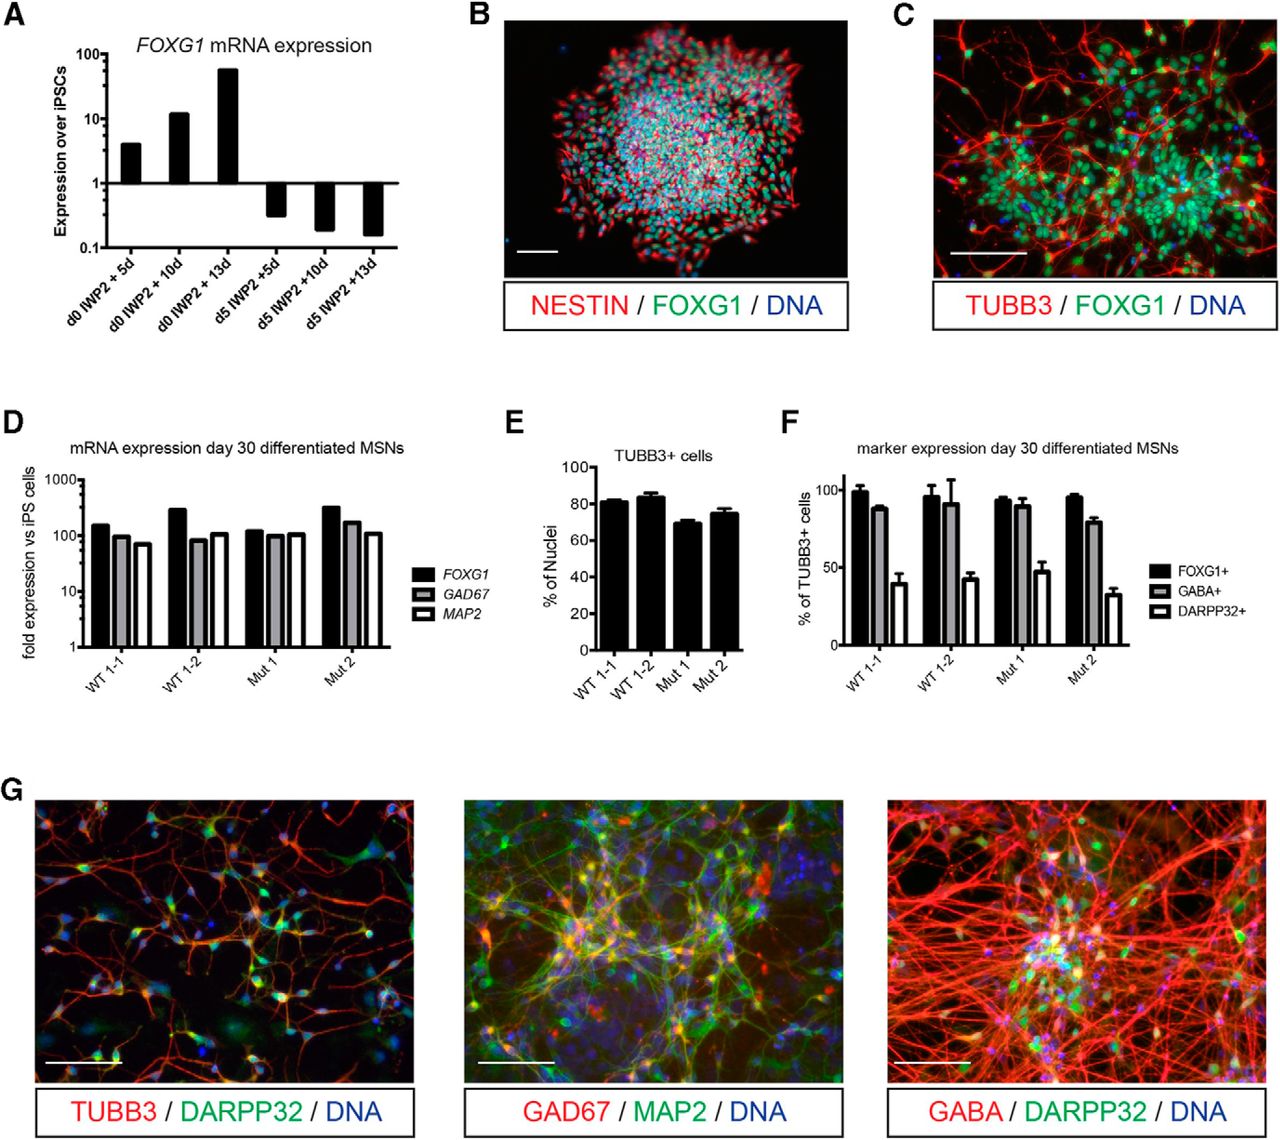
Differentiation of hiPSCs into MSNs. A, The WNT inhibitor IWP2 was added either at the beginning of differentiation or at day 5 and telencephalic identity was monitored by analyzing FOXG1 mRNA expression by qRT-PCR on day 5, 10, and 13. Only when IWP2 was added from day 0 the expression of the forebrain marker FOXG1 was strongly induced. Data were exemplarily generated with the hiPSC line WT1–2. B, When EBs were plated at day 8 of differentiation and fixed 2 d later, cells stained positive for the neural progenitor cell marker NESTIN and FOXG1. C, At day 21 of the differentiation process, neurons marked by the expression of TUBB3 mostly expressed FOXG1. D, At day 30, different hiPSC lines of ChAc patients (Mut 1 and 2) and controls (WT 1–1 and 1–2) showed comparable expressions of the genes FOXG1, GAD67, and MAP2 as analyzed by qRT-PCR and normalized to the average expression level in undifferentiated hiPSCs. MSNs were replated as single cells at ∼day 30. Two days later, most of the TUBB3+ neurons (E) stained also positive for FOXG1 and GABA and ∼40% of patient and control MSNs expressed DARPP32 (F). The stainings were performed in triplicate (FOXG1 and DARPP32) or duplicate (GABA). Data are shown as means ± SEM. For D–F, the lines WT1–1, WT1–2, Mut1, and Mut2 were used. G, Mature MSNs at ∼day 30 or older expressed TUBB3, DARPP32, MAP2, GAD67, and GABA, as shown by representative immunocytochemical staining. Scale bars, 100 μm.
For detailed morphological analyses of MSN neurites, TUBB3 staining was combined with the ImageJ-based software NeurphologyJ to detect neuronal somata, neurites, attachment points of neurites at the soma, and end points of neurites automatically. Interestingly, ChAc patient-derived neurons displayed enhanced neurite outgrowth and ramification (Fig. 4A,B,E,F). A significant difference from controls was found for the normalized neurite length/number of somata (p = 0.0349, Student's t test; Fig. 4E). To investigate synapse formation in ChAc MSNs, we quantified GABA-positive synaptic boutons (Fig. 4C,D). Neurite tracing with the NeuronJ plugin was applied to the SynapCountJ plugin, detecting a similar synaptic density between patient and control cell lines, although ChAc MSNs showed a higher degree of ramification (Fig. 4F). The comparable number of synapses in ChAc MSNs and controls does therefore not account for differences of synaptic activity. Furthermore, in qRT-PCR, there was no significant difference in the mRNA expression of the synaptic proteins SYN1 and synaptophysin between patient-derived and control cells (data not shown).

Neuronal morphology and GABAergic synaptic density of control and ChAc patient-derived cells. Control (A, C) and patient-derived (B, D) iPSCs were stained for neuronal marker βIII-tubulin (red) and for GABAergic synapses (green). βIII-tubulin staining was combined with the ImageJ-based software NeurphologyJ to detect neuronal somata, neurites, attachment points of neurites at the soma, and end points of neurites automatically. E, Total neurite outgrowth was quantified normalizing neurites by somata. Therefore, we divided the area of the neurites by the area of the somata or the number of neurites (# neurites) by the number of somata (# somata). These parameters showed a tendency to be increased in patient-derived cells. In addition, total neurite length was normalized by the number of somata, which was significantly enhanced in ChAc neurons (p < 0.05, Student's t test). F, The number of end points of the neurites within an image was normalized by the number of attachment points at the soma giving a quantitative expression for an increased total ramification of patient-derived cells. Moreover, we used the ImageJ-based plugin SynapCountJ to quantify GABAergic synapses as stained in C and D. There was no significant difference in the synaptic density of ChAc neurons and controls. The bar graph gives the synaptic density as synapses per 100 μm neurite (all bars show means ± SEM, n = 3, where n represents a culture seeded at different dates).
ChAc neurons show elevated synaptic activity
Ion channel and AP properties, as well as the synaptic activity of neurons from ChAc patient and healthy control iPSC lines, were analyzed by whole-cell patch-clamp recordings to uncover potential neuronal malfunctions. Electrophysiological measurements were performed on cells with a clear neuronal morphology after 40 d of differentiation from a minimum of three independent differentiation experiments. In response to depolarization, all cells showed TEA-sensitive potassium outward currents and, in both patient and control groups, most of the cells generated TTX-sensitive sodium inward currents (ChAc 88.6 ± 4.8%, control 77.4 ± 7.1%, p = 0.24; Fig. 5A). The maximal INa and IK normalized to individual cell capacitances did not differ significantly in either group (see Table 2 for means ± SEM and sample sizes); however, the voltage dependence of Na+ channel activation was shifted to more negative membrane potentials in ChAc neurons with significantly enhanced peaks at −20 and −30 mV (Fig. 5B). Using qRT-PCR, we observed a trend of upregulated expression of several voltage-gated Na+ channel subunits that may account for the altered sodium current kinetics seen in ChAc neurons (Fig. 5C).

Altered Na+ currents in neurons from ChAc patients. A, Voltage-gated ion currents of neurons differentiated from iPSCs for 40 d in vitro recorded in whole-cell voltage-clamp by depolarizing steps in increments of 10 mV from a holding potential of −70 to 40 mV. Inward currents were completely blocked by TTX, identifying them as being Na+ driven. Outward currents showed TEA sensitivity, indicating a potassium dependency. B, Although the maximal INa and IK normalized to individual cell capacitances did not differ significantly in either group, sodium channels in ChAc neurons activated at lower voltages and the sodium current amplitudes at −30 and −20 mV were significantly larger in ChAc cells. Data are presented as means ± SEM (p < 0.05, ANOVA). C, Expression of several sodium channel subunits tended to be upregulated in ChAc neurons as seen by qRT-PCR, which could explain the altered sodium current kinetics.
Functional properties of neurons from ChAc-iPSCs and healthy controls
Current-clamp mode recordings revealed a comparable number of neurons from ChAc patients (58.7 ± 10.3%) and controls (45.7 ± 9.6%) that fired TTX-sensitive APs upon depolarizing current injection (Fig. 6A,B). Spontaneous spiking (see Fig. 6C for representative traces) was observed in a minor neuronal population (ChAc 13.9 ± 3.8%, control 6.7 ± 2.4%, p = 0.12), with no differences in frequencies when patient and control cells were compared (Fig. 6D). Only the amplitudes of provoked and spontaneous APs were significantly higher in ChAc cells (p = 0.004 and p = 0.001; Fig. 6B,D, Table 2).

Elevated AP amplitudes in ChAc neurons. A, Differentiated cells from ChAc patients and healthy controls fired single APs in response to depolarizing current pulses in current-clamp mode that could be blocked by 1 μm TTX. B, Although the percentage of cells with APs did not differ in either group, the AP amplitudes were significantly higher in ChAc neurons compared with controls. C, Spontaneous AP firing was measured at the neuronal membrane potential over a period of 11 s. D, Spontaneous APs were observed only in a minor cell population without significant differences in percentage or frequency, but higher amplitudes in ChAc neurons compared with controls. Data represent means ± SEM (p < 0.05, Mann–Whitney test).
Next, we assessed the synaptic input received by the hiPSC-derived MSNs by analyzing the spontaneous synaptic neurotransmission at a holding potential of −70 mV. The percentage of ChAc cells showing mPSCs was significantly elevated (ChAc 88.6 ± 4.3%; control 69.5 ± 5.3%, p = 0.01; Fig. 7A). We observed a nearly 2-fold frequency increase and significantly higher amplitudes of mPSCs in ChAc neurons (0.57 ± 0.06 Hz; 11.7 ± 0.1 pA; n = 123) compared with controls (0.30 ± 0.03 Hz, p < 0.0001; 9.5 ± 0.4 pA, p < 0.0001; n = 107). The origin of mPSCs was analyzed by extracellular application of the GABAA receptor antagonist bicuculline and the glutamate receptor blocker NBQX to neurons with high mPSC frequencies only. The reduction of mPSCs by application of bicuculline suggested a predominantly GABAergic synaptic input, which is consistent with the high number of striatal GABAergic MSNs in our cultures. NBQX had no significant effect on mPSCs (Fig. 7B,C).

Enhanced spontaneous synaptic transmission in neurons derived from ChAc patient iPSCs. A, Higher percentages of ChAc neurons showed spontaneous mPSCs, which exhibited an almost 2-fold increase in frequency and a significantly higher mean amplitude in ChAc cells compared with controls, indicating a higher synaptic activity. B, C, Application of the AMPA receptor blocker NBQX reduced mPSC frequency just slightly, whereas the GABAA receptor blocker bicucullin decreased current frequency by 66% and 90% in ChAc and control neurons, respectively, indicating a predominantly GABAergic synaptic input, which is consistent with the high number of GABAergic cells in our cultures. Data are presented as means ± SEM (p < 0.05, Mann–Whitney test).
Evaluation of the passive membrane properties in patient and control MSNs revealed no significant differences in resting membrane potentials or input resistances. Only the cell capacitances were significantly higher in ChAc neurons compared with controls (Table 2).
Normal Ca2+ signaling in ChAc neurons
Based on the observed elevated synaptic transmission in ChAc neurons and Ca2+ as a trigger for the fusion of synaptic vesicles with the plasma membrane, we investigated potential alterations in the intracellular Ca2+ signaling. The basic Ca2+ level represented by the ratio of fluorescence emission at 340 and 380 nm from fura-2 loaded cells was similar in ChAc cells and healthy controls. Application of the neurotransmitters GABA, acetylcholine, glutamate, and glycine induced intracellular calcium rises in comparable percentages of cells and with similar amplitudes in both groups (Fig. 8A–C). These data might exclude different neurotransmitter receptor densities as a reason for the variations in postsynaptic currents. GABA and glycine induced depolarizing Ca2+ signals in ∼20% of the cells, suggesting an excitatory function of these neurotransmitters in ChAc neurons and controls because it is typically seen in fetal neurons (Wegner et al., 2008, 2012).

ChAc neurons and controls showed similar spontaneous and neurotransmitter-induced Ca2+ signaling. A, Representative traces of transient cytosolic Ca2+ changes induced by bath application of GABA (100 μm), acetylcholine (ACh, 100 μm), glutamate (Glut, 50 μm), glycine (Gly, 100 μm), and KCl (50 mm) in fura-2-loaded neurons from control iPSCs. Intracellular Ca2+ changes are presented as ratios of the fluorescence signals obtained at 340 and 380 nm (F340/F380). B, Summary of cytosolic Ca2+ response amplitudes normalized to the basal Ca2+ level of the investigated cells (n) showed no significant differences between ChAc neurons and healthy controls. C, A similar fraction of ChAc and control cells responded to neurotransmitter application obtained from experiments as shown in A. Note: GABA and glycine induced depolarizing Ca2+ signals in ∼20% of the cells. Therefore, the GABAergic and glycinergic synaptic transmission partly have an excitatory function in ChAc neurons and controls. D, Analyzing spontaneous Ca2+ transients revealed no significant difference in the percentage of spontaneously active cells (∼30%), Ca2+ current frequency, or amplitudes in ChAc neurons compared with controls. E, Genomic expression of voltage-gated calcium channel subunits analyzed by qRT-PCR did not differ significantly between ChAc neurons and healthy controls. Data represent means ± SEM (p < 0.05, Mann–Whitney test).
Neither the percentages of cells showing Ca2+ responses caused by application of KCl (ChAc 80.5 ± 9.5%; control 68.3 ± 8.7%, p = 0.2) nor the amplitudes (ChAc 0.14 ± 0.01, n = 79; control 0.18 ± 0.01, n = 111, p = 0.2) were significantly different in either group. Spontaneous calcium influx was observed in 27.0 ± 6.5% of ChAc and 35.0 ± 10.7% of control cells (p = 0.4) with similar frequencies (ChAc 0.002 ± 0.0002, n = 102; control 0.003 ± 0.0004, n = 52, p = 0.3) and the same mean amplitude of 0.25 ± 0.01 (p = 0.9; Fig. 8D).
The expression of voltage-gated Ca2+ channels as analyzed by qRT-PCR was also not significantly different between ChAc neurons and healthy controls (Fig. 8E).
Decrease of synaptic activity in ChAc neurons to healthy control levels by drug treatment with phallacidin and PP2
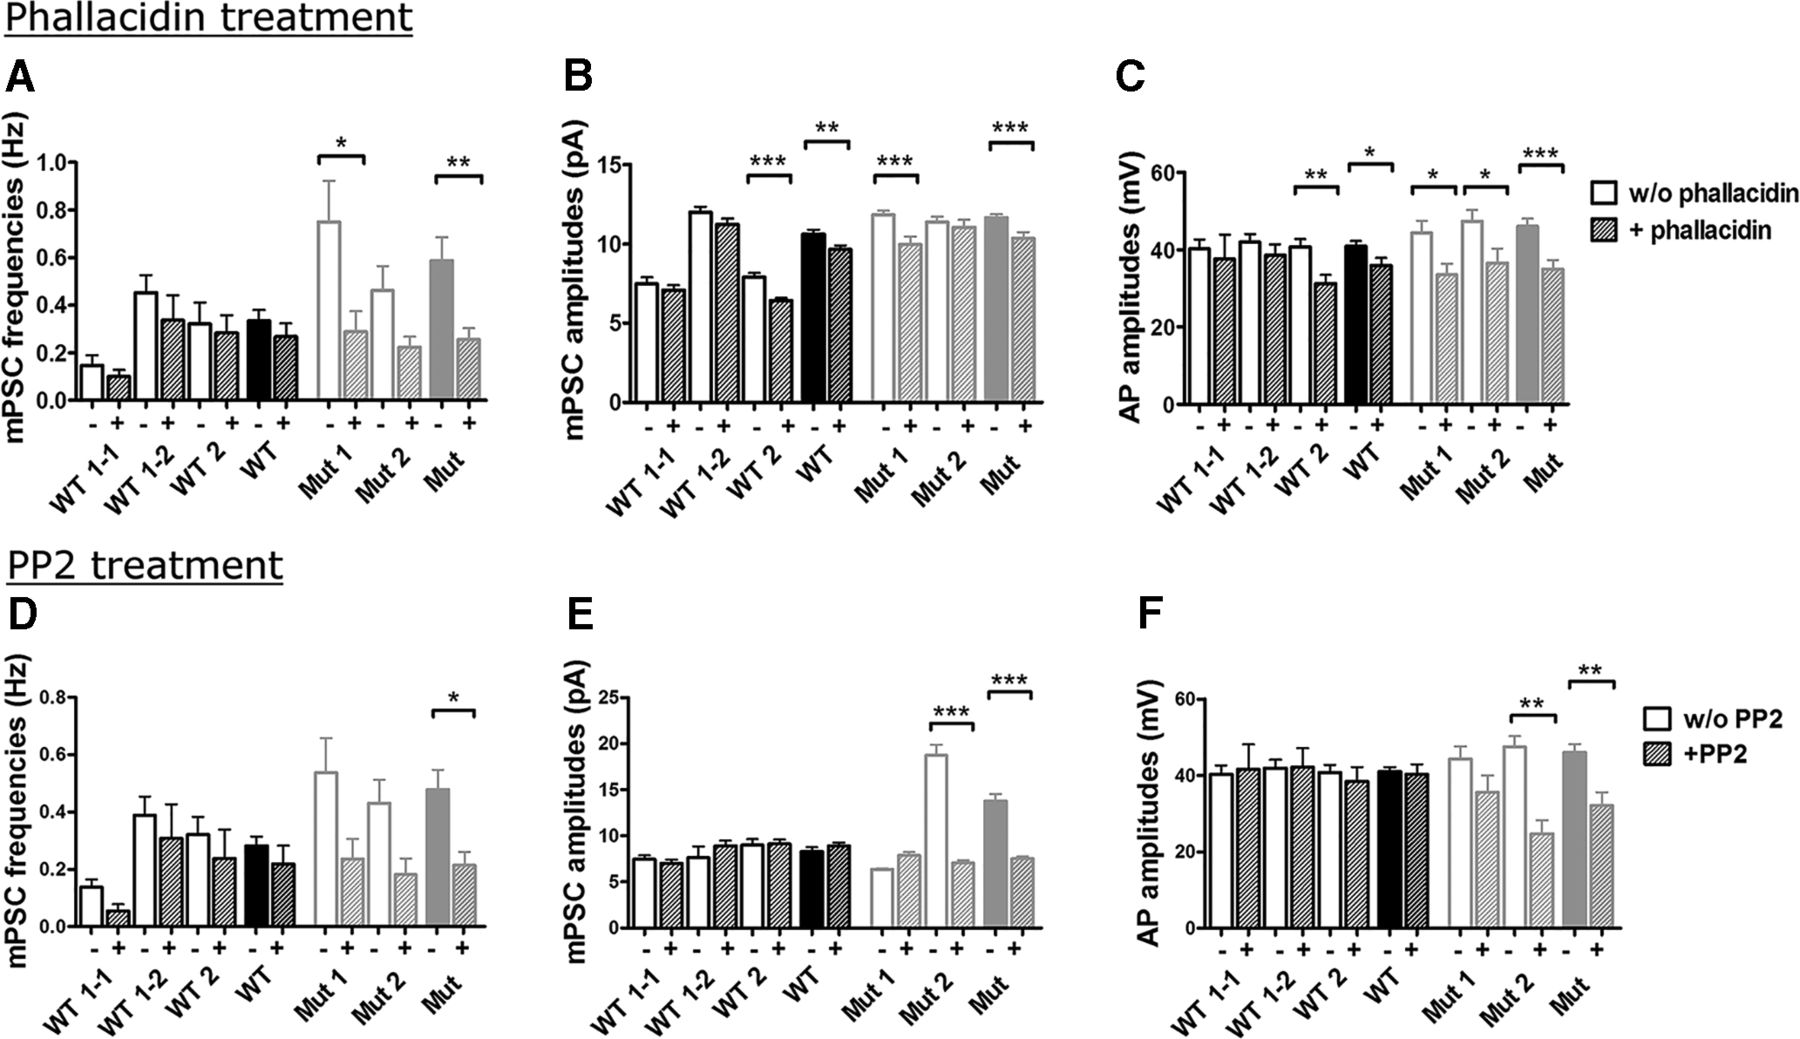
Depolymerized cortical actin has been identified in erythrocytes from ChAc patients (Föller et al., 2012). Because the regulation of synaptic neurotransmitter release is actin dependent (Morales et al., 2000), we hypothesized that the depolymerized actin phenotype disinhibits synaptic vesicle release. To test our hypothesis, we evaluated whether stabilization of F-actin by incubating the cells with phallacidin might reverse the synaptic hyperactivity seen in ChAc neurons. Indeed, the treatment of ChAc cells with 100 nm phallacidin for 72 h (Föller et al., 2012) reduced the frequency and amplitude of synaptic currents to the level of healthy controls (Fig. 9A,B). The AP amplitudes were also reduced significantly by phallacidin treatment (Fig. 9C).

Treatment with the F-actin stabilizer phallacidin and the Src kinase inhibitor PP2 rescued the functional phenotype seen in ChAc neurons (n = 33–98). Treatment of differentiating cells with 100 nm phallacidin (A–C) or 10 μm PP2 (D–F) 72 h before analysis decreased the frequency and amplitudes of mPSCs to the level of control cells (n = 8–101). C, F, AP amplitudes were reduced significantly by phallacidin and PP2 as well. All data are given as means ± SEM of individual cell lines and as averaged values (p < 0.05, Mann–Whitney test).
Another mechanistic explanation for the pathological synaptic currents arose from observations of increased activity of the Src-family tyrosine kinase Lyn in erythrocytes of ChAc patients (De Franceschi et al., 2011a). Elevated Lyn kinase activity weakens the connection between the actin cytoskeleton and the cell membrane (De Franceschi et al., 2011a) and might induce enhanced synaptic activity. We used the irreversible Src kinase inhibitor PP2 (10 μm for 72 h; Williams et al., 2009; De Franceschi et al., 2011a) to treat cells before functional analyses and found a similar reduction of synaptic current frequency and amplitudes, as well as AP amplitudes, compared with phallacidin treatment (Fig. 9D–F). In both cases, the viability was not influenced, as indicated by similar numbers of TUNEL-positive cells in treated and untreated cultures after 40 d of differentiation (data not shown). In contrast to this regular differentiation time, a long-term cultivation (>3 months) of untreated ChAc MSNs and controls revealed a significant decrease of patient-derived cells (p < 0.05, Student's t test; Fig. 10A), suggesting a beginning neurodegeneration.

Actin regulation and Lyn kinase activity in differentiated neurons. A, After at least 3 months of MSN differentiation from iPSCs, cell-culture dishes of ChAc neurons (n = 5 clones, red) contained significantly fewer cells (data are given as Whiskers minimum to maximum, box 25% to 75%, median, p < 0.05, Student's t test) than healthy controls (n = 4 clones, blue) when investigated with a Hoechst-based quantification assay. B, G-/F-actin ratio (soluble globular G-actin over filamentous F-actin) of MSNs (right bars) cultures differentiated for 6 weeks is increased significantly (p < 0.05, Student's t test) in ChAc cells (n = 9 clones, red) compared with healthy controls (n = 17 clones, blue), whereas cultivation into mDANs (9 ChAc and 16 control clones, left bars) did not lead to marked differences. Data represent means ± SD. C, Western blots of patient and control MSNs were analyzed with antibodies against the Rho-kinase downstream targets cofilin (left) and profilin (right). Results show different phosphorylation patterns between patient-derived and control cells. D, Phosphorylated and nonphosphorylated levels of cofilin (black) and profilin (gray) were quantitatively measured and ratios calculated. Although expression levels and phosphorylation state of controls did not differ, one ChAc cell line (Mut 2) showed a strong hyperphosphorylation of cofilin and cells from another patient (Mut 1) displayed hypophosphorylation of profilin. E, Western blots with specific antibodies against active Lyn kinase (phospho-Lyn 396) and total Lyn in MSNs. The representative experiment shown is one of three separate similar experiments, each with MSNs derived from healthy controls (Ctrl) or individual ChAc patients and each with similar results. GAPDH was used as a loading control (left). Shown is a densitometric analysis of the immunoblots; data are shown as either a single experiment (empty circle) or as means ± SD (black circle) (n = 3; *p < 0.05, Student's t test). F, Western blot with specific antibodies against active Lyn (phospho-Lyn 396) and total Lyn in mDANs. The representative experiment shown is one of three separate similar experiments, each with mDANs derived from healthy controls (Ctrl) or individual ChAc subjects and each with similar results. Actin was used as a loading control (left). Shown is a densitometric analysis of the immunoblots; data are shown as either a single experiment (empty box) or as means ± SD (black circle) (n = 3; *p < 0.05, Student's t test).
We also investigated the voltage-gated sodium channel blocker and AMPA glutamate receptor antagonist riluzole for its effect on the enhanced synaptic activity in ChAc neurons. Riluzole is the only Food and Drug Administration-approved drug for the treatment of amyotrophic lateral sclerosis and has been reported to prevent excitatory neurotransmitter release from presynaptic nerve terminals by a reduction of cytosolic Ca2+, as well as stimulated transmitter clearance from the synapse (Azbill et al., 2000; Dunlop et al., 2003; Wang et al., 2004). It was also discussed as treatment for cerebellar ataxias (Romano et al., 2015). In contrast to phallacidin and PP2, incubation with 1 μm riluzole during the whole differentiation period did not have significant influence on the frequency or amplitudes of mPSCs (data not shown).
Considering our electrophysiological evidence linking F-actin stabilization and Src kinase inhibition to enhanced activity of ChAc MSNs, we sought to examine the actin network and dynamics and the activation levels of the Lyn kinase. Using qRT-PCR, we measured the expression of β-actin interacting with chorein (Shiokawa et al., 2013) and did not find a significant difference between patient-derived and control cells (data not shown). Then ratios of soluble G-actin and F-actin were determined by Western blotting in differentiated patient and control neurons of multiple clones. In contrast to midbrain dopaminergic neurons (mDAN), the G/F-actin ratio of ChAc MSNs was significantly higher than in respective controls (p < 0.05, Student's t test; Fig. 10B), suggesting a depolymerization of cortical actin comparable to erythrocytes from ChAc patients (Föller et al., 2012).
ROCK is a key player and signaling hub for regulation of the actin cytoskeleton and neuronal differentiation (da Silva et al., 2003; Nölle et al., 2011). For the analysis of actin dysregulation, we tested expression levels and phosphorylation of the ROCK downstream targets. Nonphosphorylated cofilin has an actin-severing activity, whereas phosphorylated profilin blocks its own binding to G-actin (Arber et al., 1998; Shao et al., 2008). Proteins from MSNs of two patient and control individuals were analyzed by Western blotting (Fig. 10C). Whereas expression levels and phosphorylation state of controls did not differ, one ChAc patient-derived cell line (Mut 2) showed a strong hyperphosphorylation of cofilin and MSNs from another patient (Mut 1) displayed hypophosphorylation of profilin (Fig. 10D). Although phosphorylation patterns were not uniform, these results indicate a dysregulation of the actin cytoskeleton in ChAc patient-derived MSNs.
Finally, we analyzed Lyn kinase activity in neurons derived from healthy controls and ChAc patients. As shown in Figure 10, E and F, we found significantly elevated activation levels of Lyn (phosphorylated P-Lyn396/Lyn) in MSNs (Fig. 10E) and mDANs (Fig. 10F) from ChAc subjects compared with healthy controls, which is in agreement with data reported for ChAc red cells (De Franceschi et al., 2011a). Interestingly, the MSNs as main targets of neurodegeneration in ChAc displayed a twofold increase of Lyn activity compared with mDAN.
Discussion
Our understanding of ChAc neuropathology at the cellular and molecular levels is still very limited. From skin biopsies of ChAc patients and age-matched healthy control subjects, we established a novel iPSC-based human model system to study the neuropathology of the disease. In this study, we used a differentiation protocol based on neural induction, regional patterning toward a lateral ganglionic eminence identity, and terminal differentiation to striatal MSNs (Aubry et al., 2008; Ma et al., 2012; Delli Carri et al., 2013; Golas and Sander, 2016), the cell type that is mainly affected by the neurodegenerative process, as shown by histopathological analysis and magnetic resonance imaging of ChAc patients (Hardie et al., 1991; Kutcher et al., 1999; Walterfang et al., 2008).
In many neurodegenerative diseases, such as amyotrophic lateral sclerosis, Parkinson's disease, and Huntington's disease, excitotoxicity may contribute to the pathophysiological process by which nerve cells are degenerating due to excessive synaptic transmission (Pitt et al., 2000; Van Damme et al., 2005; Dong et al., 2009). Using electrophysiological analysis of neurons from ChAc-iPSCs, we observed an elevated synaptic activity that might contribute to the striatal cell death seen in ChAc patients as the disease progresses. The spontaneous postsynaptic currents that we measured represent neurotransmitter binding events to its receptors on the postsynaptic membrane. Because abnormal neurotransmitter release or sodium channel expression and function can cause seizures, skeletal muscle paralysis, and neurodegeneration (Waxman, 2001; Wada, 2006), symptoms that are observed in ChAc patients, we studied ion channel and AP properties.
Our data showed a hyperpolarizing shift in the voltage dependence of Na+ channel activation in ChAc neurons. A shift of the voltage dependence to the hyperpolarized direction has also been reported in epilepsy, in which it is believed to increase the channel activity and thereby may cause hyperexcitation of neurons, leading to epileptic seizures that are observed early in ChAc patients (Ogiwara et al., 2009). The earlier activation and the higher AP amplitudes in ChAc cells might be explained by a tendency of increased expression of several Na+ channel subunits as seen by qRT-PCR (Hong et al., 2004; Zhan et al., 2007).
As stated above, overstimulation by increased spontaneous postsynaptic currents in ChAc neurons could result in neuronal stress and even cell death via the excessive influx of water and ions. The absence of any significant difference in ligand-gated ion channel expression as measured by calcium-imaging excludes differential receptor densities as a reason for the enhanced synaptic currents. In addition, a similar synaptic density of ChAc MSNs and controls does not contribute to the increased synaptic activity in patient-derived cells. We hypothesized that a disinhibited neurotransmitter release may account for a potentially pathological synaptic hyperactivity in ChAc. Neurotransmitter release at central synapses is strongly actin dependent. Depolymerization of cortical actin promotes exocytosis and insertion of proteins into the plasma membrane (Morales et al., 2000; Malacombe et al., 2006). In epithelial cells, it has been shown that endocytosis was inhibited upon actin depolymerization (Gottlieb et al., 1993). A receptor-mediated arrest of endocytosis has also been reported by Lamaze et al. (1997) when actin polymerization was blocked in the human epidermoid carcinoma cell line A431.
Depolymerized cortical actin was found in erythrocytes from ChAc patients (Föller et al., 2012). The observed increases in the G/F-actin ratios of MSNs and erythrocytes might be a cell-specific phenomenon in ChAc, because mDANs have not yet shown this pattern of actin pathology. The implications of a disturbed actin cytoskeleton on the neuronal function can be diverse ranging over dynamics of the vesicle pool to impairment of long-term potentiation or long-term depression (Zhou et al., 2011; Lee et al., 2012). The increased G/F-actin level and the altered phosphorylation of cofilin/profilin in ChAc MSNs suggest a dysregulated cortical actin network. When we treated the cells with the F-actin stabilizer phallacidin, which had reversed the abnormally enhanced G/F-actin ratio in ChAc erythrocytes (Föller et al., 2012), the synaptic activity in ChAc MSNs was reduced to the level of healthy controls. These results indicate that there are cortical actin disturbances also in MSNs from ChAc patients, leading to synaptic hyperactivity and neuronal damage in the course of the disease (Morales et al., 2000). After long-term differentiation of >3 months, the number of ChAc patient-derived cells indeed showed a significant decrease compared with controls, suggesting a beginning process of neurodegeneration.
A similar reduction of synaptic currents was observed when the ChAc neurons were incubated with the Src kinase inhibitor PP2. Elevated activity of the Src-family tyrosine kinase Lyn, which leads to increased tyrosine phosphorylation of several membrane proteins involved in anchoring the membrane to the actin cytoskeleton, was identified in erythrocytes from ChAc patients (De Franceschi et al., 2011a). We were able to demonstrate significantly enhanced Lyn kinase activation levels in ChAc neurons. At synapses, the synaptic vesicle release is a tightly regulated process that requires the interaction of several membrane proteins and cytoskeletal elements (Fon and Edwards, 2001; Bellani et al., 2010). A weakened connection between the actin cytoskeleton and the membrane due to abnormally activated Lyn kinase might therefore result in pathologically enhanced synaptic transmission that can be attenuated by Src kinase inhibition.
We cannot exclude with certainty that neurons from ChAc-iPSCs mature functionally faster than cells from healthy controls, thus giving rise to an increased neurite outgrowth and ramification as well as enhanced synaptic transmission. However, the immunocytochemically detected synaptic density and the electrophysiological data, such as similar percentages of cells with sodium currents, provoked and spontaneous APs, and comparable amounts of cells with calcium responses, underlined equal differentiation and maturation abilities. Furthermore, the functional phenotype rescue seen by treatment of ChAc neurons with Src kinase inhibitor and F-actin-stabilizing compounds suggests a pathophysiological mechanism rather than a simple maturation discrepancy.
Our data indicate pathologically elevated synaptic activity in diseased ChAc neurons that is reversed to healthy control levels by treatment with the F-actin stabilizer phallacidin and the Src kinase inhibitor PP2. This was underlined by significantly increased G/F-actin ratios and Lyn kinase activation levels in patient-derived MSNs. Because Src kinases are involved in bridging the membrane to the actin cytoskeleton by membrane protein phosphorylation, our data suggest a cortical actin-dependent mechanism of this dysfunctional ChAc phenotype. This study indicates that F-actin stabilization and Src kinase inhibition represent potential treatment targets in ChAc to restore neuronal function.
Footnotes
↵†A.H. and F.W. are co-senior authors.
This work was supported by the Advocacy for Neuroacanthocytosis patients (F.W, A.H., and A.S.) and by the Federal Ministry of Education and Research (BMBF FKZ Grant 01GM1303) under the frame of E-Rare-2, the ERA-Net for Research on Rare Diseases (EMINA2 consortium) (A.H.), and Telethon (Grant GP13005 to L.D.F.). We thank the patients and the probands for donating skin biopsies; Glenn and Ginger Irvine who founded and run the Advocacy for Neuroacanthocytosis Patients; Andreas Niesel for his excellent technical support; and Carola Kassebaum for technical assistance.
The authors declare no competing financial interests.
- Correspondence should be addressed to Prof. Dr. med. Florian Wegner, Department of Neurology, Hannover Medical School, Carl-Neuberg-Str. 1, 30625 Hannover, Germany. Wegner.Florian{at}mh-hannover.de


