


Considerable evidence supports the importance that the autonomic nervous system (ANS) has regarding cardiovascular health and prognosis.1 Specific variables derived from heart rate (HR) and heart rate variability (HRV) at rest and with exercise help assess the status of the ANS. Interest has also peaked on the use of HRV to assess the quality of an exercise programme. Among the athletic population, HRV has been recommended to warn of over-training and to optimise performance. The wide availability of mHealth2 HR-monitoring devices (wellness and medical devices) for both health status and exercise training assessment provided motivation for this systematic review.
Autonomic Nervous System
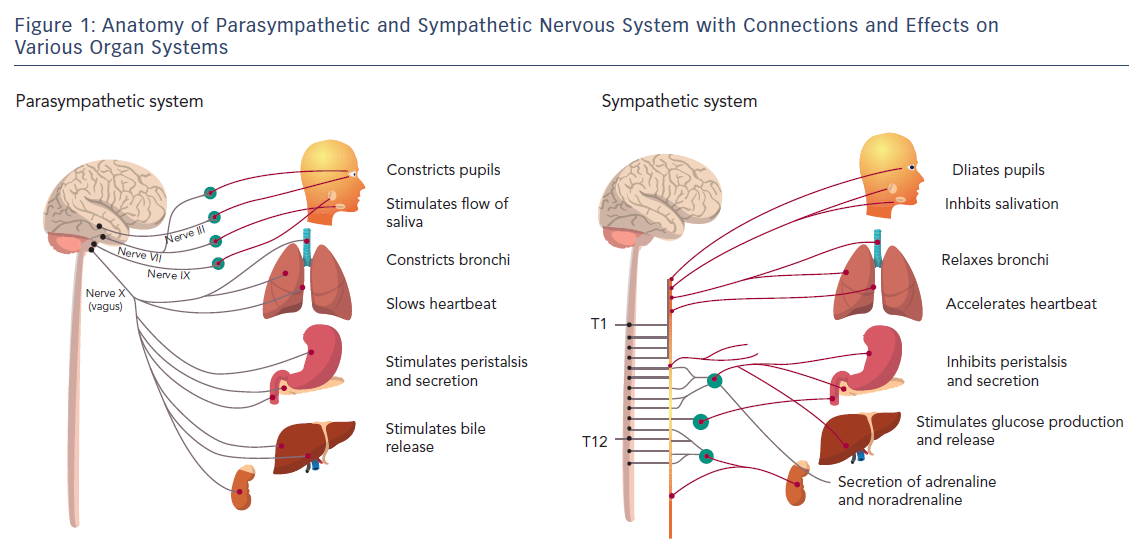
The ANS is predominantly an efferent system transmitting impulses from the central nervous system (CNS) to peripheral organs. Its effects include control of HR and force of heart contraction, constriction and dilatation of blood vessels, contraction and relaxation of smooth muscle in various organs, and glandular secretions. Autonomic nerves constitute all the efferent fibres that leave the CNS, except those that innervate skeletal muscle. There are some afferent autonomic fibres (i.e. from the periphery to the CNS) that innervate the baroreceptors and chemoreceptors in the carotid sinus and aortic arch, which are important in the control of HR, blood pressure and respiratory activity. The ANS is divided into the parasympathetic and sympathetic systems, based on anatomical and functional differences (Figure 1).
Parasympathetic Nervous System
The preganglionic outflow of the parasympathetic nervous system (PNS) arises from the brain stem and is known as the craniosacral outflow. The vagus nerve (or 10th cranial nerve) carries fibres to the heart and lungs (as well as other organs) and is the primary parasympathetic innervation of these organs. Vagal tone declines with ageing, and the major stimulus that increases vagal tone is regular aerobic exercise.1 The PNS is largely concerned with conservation and restoration of energy by causing a reduction in HR and blood pressure and by facilitating digestion and absorption of nutrients and discharge of waste. The chemical transmitter at synapses in the PNS is acetylcholine (ACh); thus, nerve fibres that release ACh from their endings are described as cholinergic. Postganglionic parasympathetic nerve endings not only respond to ACh, but also to muscarine (muscarinic ACh receptors) or nicotine (nicotinic ACh receptors).
Sympathetic Nervous System
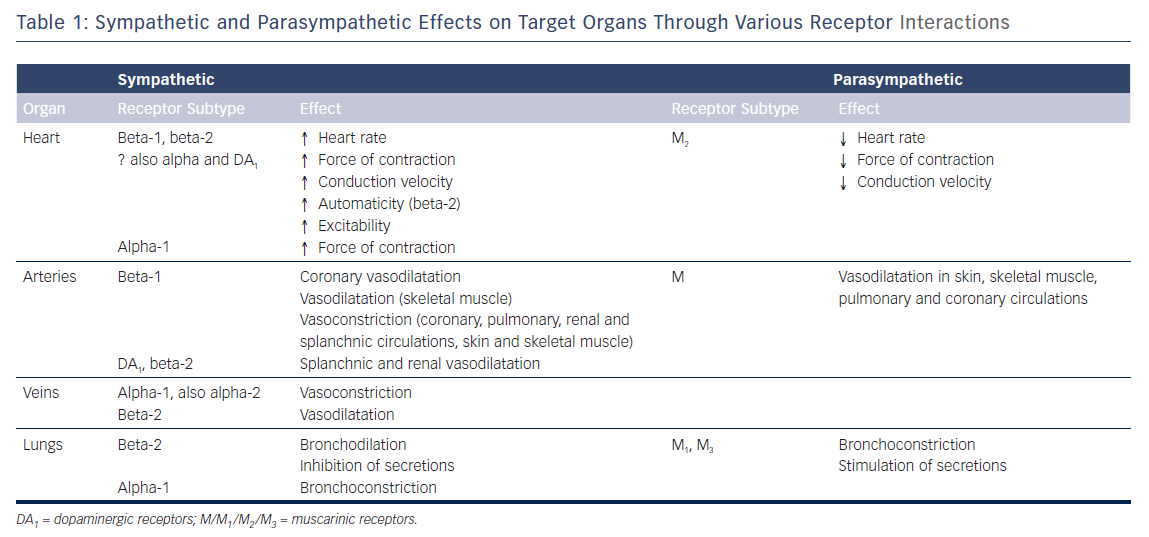
The cell bodies of the sympathetic preganglionic fibres are in the lateral horns of spinal segments T1 to L2, which comprise the thoracolumbar outflow of the sympathetic ganglionic chains. The adrenal medulla is innervated by preganglionic fibres, and adrenaline is released from the gland by stimulation of nicotinic ACh receptors. In situations involving physical or psychological stress, adrenaline is released. The specific ACh receptors have been further subdivided pharmacologically by the actions of the alkaloids muscarine and nicotine on these receptors. In contrast to the parasympathetic system, the sympathetic system enables the body to respond to challenges to survival (fight or flight) or situations of haemodynamic collapse or respiratory failure. Sympathetic responses include an increase in HR, blood pressure and cardiac output, a diversion of blood flow from the skin and splanchnic vessels to those supplying skeletal muscle, bronchiolar dilation, and a decline in metabolic activity. The actions of catecholamines are mediated by alpha and beta receptors. Beta-1-adrenoceptor-mediated effects in the heart, which include increased force and rate of contraction, are differentiated from those producing smooth muscle relaxation in the bronchi and blood vessels, which are beta-2-mediated effects. Table 1 summarises the various cardiovascular and pulmonary responses to parasympathetic and sympathetic stimulation.
Measuring Heart Rate Variability
HRV is defined as the physiological variation in the duration of intervals between sinus beats. It reflects the combined activity of sympathetic and parasympathetic tone on HR and serves as a measurable indicator of cardiovascular integrity and prognosis. Formal criteria for HRV and comparison of variables were developed by a joint task force between the European Society of Cardiology and the North American Society of Pacing and Electrophysiology in 1996 and updated in 2015.3,4 The update added newer methods, including fractal and chaos analysis, and highlighted the disconnection between biomedical engineering developments and their application to clinical disease states. The major methods of analysis can be divided into time-domain (subdivided into statistical and geometric approaches) and frequency-domain methods.5
Time-domain Measures of Heart Rate Variability
We will concentrate on statistical methods, since clinical studies have used them the most. Time-domain statistical methods assess the difference between normal R-R intervals (NN), excluding ectopic beats. Units of measurement include the standard deviation of NN intervals (SDNN), the standard deviation of the average R-R intervals (SDANN), the root mean square of the differences in successive R-R intervals (RMSSD), and the percentage of normal R-R intervals that differ by 50 ms (pNN50). Other difference values, including the proportion of R-R intervals that differ by 20 ms (pNN20), have been found to have better discriminatory value.6 Variance of HRV is related to the length of analysed recordings, so comparison of different SDNN values must be standardised to the same duration of recording length.7 With an increasing number of devices on the market, standardisation is becoming increasingly important. The RMSSD method is preferred because it is more sensitive and less affected by respiratory rate, HR or recording duration, and because it reflects largely parasympathetic activity.8

Frequency-domain Measures of Heart Rate Variability
Frequency-domain methods allow for the distinction between high frequency (HF) and low frequency (LF) components (Table 2). HF components (between 0.14 and 0.40 Hz) reflect the activity of the PNS, while LF components (between 0.04 and 0.15 Hz) are generally accepted to reflect the activity of the sympathetic nervous system.
The aetiology of LF remains in question, with some studies suggesting it is primarily under sympathetic control; others suggest it is the result of both sympathetic and parasympathetic influences. Goldstein and colleagues have proposed that LF power reflects underlying baroreflex function rather than sympathetic tone.9 They note that patients with congestive heart failure and resultant increases in sympathetic tone tend to have decreased LF power levels. Additionally, pharmacological manipulation through blockade of preganglionic sympathetic outflow does not seem to affect LF, while beta-adrenergic stimulation with isoprenaline results in a decrease of LF power. Goldstein and colleagues concluded that LF power results from baroreflex function, and manipulations that affect LF power may do so not by directly affecting cardiac autonomous outflows but through modulation of those outflows by baroreflexes.
Roach and Sheldon hypothesised that HRV in the LF band is due to transient fluctuations of about 10 seconds in HRV sequences, associated with blood pressure fluctuations.10 Ten healthy subjects, mean age 36 years, had HRV and blood pressure measured for 10 minutes. Non-random HRV fluctuations lasting 6.7–20 seconds were detected using time-scrambled surrogate sequences as controls. These fluctuations were 99 ± 40 ms in amplitude, in concatenates 23.4 ± 7.4 seconds long. The HRV fluctuations correlated with blood pressure fluctuations of 5 ± 5 mmHg (correlation r2 = 0.68 ± 0.10). A second HRV structure consisting of transient tachycardias of 140 ± 53 ms lasting 15.1 ± 6.1 seconds occurred singly. Together, the two occurrences contributed 84 % of the total power in the LF band. Mini bursts were noted independently of blood pressure changes and were thought to be due to muscle mechanoreceptor activation and contraction of small muscle groups. The authors concluded that HRV is due to a clustering of transient events, with the LF component being the result of the two types of HRV structures. Due to the small study size, further investigation assessing the effect of ageing and disease will be required to validate the authors’ findings.
The LF/HF ratio serves as an index to assess the relationship between sympathetic and parasympathetic (vagal tone) activity (Figure 2). This ratio is subject to marked variation depending on type and delivery of stress. During tilt and other physical stress the LF component becomes dominant to HF (LF>HF, LF/HF=3), while during rest the absolute power of LF is less than HF (LF<HF, LF/HF=0.8). During emotional/mental stress, the HF component becomes dominant to LF. At very low respiratory rates (<7–8 breaths per minute or deep breaths), parasympathic activity can drive LF power. This translates to changes in all frequency-domain methods favouring vagal tone: higher HF power, lower LF and LF/HF power.11 Therefore, respiratory rate must be considered, since it is a confounder of these methods.
Autonomic Nervous System Regulation of Heart Rate Variability
HRV refers to the beat-to-beat alteration of the HR, i.e. the RR interval. The ECG of a healthy individual measured under resting conditions exhibits an obvious high frequency (0.14–0.4 Hz) periodic variation known as respiratory sinus arrhythmia (RSA). This can be identified on a 10-second ECG recording, since two or more HF cycles can be observed, while no more than one LF cycle could occur which is imperceptible. RSA fluctuates with the phase of respiration, with HR increasing during inspiration and HR decreasing during expiration. Vagal efferent trafficking to the sinus node occurs primarily in expiration and is attenuated during inspiration (bronchodilatation). During inhalation, intra-thoracic pressure lowers due to the contraction and downward movement of the diaphragm and the expansion of the chest cavity. Atrial pressure is also lowered because of this, enabling more blood to return to the heart. As more blood enters the heart, the vasculature and atria expand, triggering baroreceptors which suppress vagal tone, and, subsequently, HR increases. During exhalation, the diaphragm relaxes, moving upwards, and decreases the size of the chest cavity, causing an increase in intra-thoracic pressure. This increased pressure inhibits venous return to the heart, and thus less atrial expansion and activation of baroreceptors occurs. As these baroreceptors are no longer acting to suppress vagal tone, HR decreases.
RSA is predominantly mediated by respiratory gating of parasympathetic efferent activity to the heart, making HRV a response to dynamic and cumulative cardiac workloads. As a dynamic marker of loads, HRV appears to be sensitive and responsive to acute stress. Mental load (i.e. making complex decisions, public speaking) decreases HRV.12 As a marker of chronic changes, HRV is also reduced with the ageing, sedentary lifestyle and, perhaps, over-training. Resting HR (average 72 BPM for decades 20 and above) does not change with ageing, and a reduction of HRV is attributed to a decrease in efferent vagal tone and reduced beta-adrenergic responsiveness. By contrast, aerobic exercise training increases resting HRV by increasing vagal tone. Therefore, HRV is considered a marker of frequent activation (short dips in HRV in response to acute stress) and the inadequate response (long-term vagal withdrawal, resulting in the over-activity of the counter-regulatory system), leading to the sympathetic control of HR.

Devices for Monitoring Heart Rate Variability
A wide range of ambulatory medical and fitness devices are available that use sensors to detect heartbeats. These have been based on sensors for auscultation of the heart (sound), blood pressure measurement (pressure or oscillographic),13 pulse oximetry (optical), photoplethysmography (optical) and ECGs. The ECG device can consider the entire ECG or just the fiducial point of the QRS complex. There are currently no clinical studies using ambulatory auscultation or pulse oximetry for HRV studies, but such are possible. In clinical use since 1970, Holter ECG recorders have evolved by incorporating advances in electronic amplifiers, processors, solid state memory, batteries and wireless communications.14 Other advances have included single-lead ECG adhesive recorders, implantable loop recorders, smartphone attachments, and wearables, including watches and straps for the chest or wrist. The implication is that extended periods of continuous HR and rhythm monitoring are possible with minimal cost.
Guidelines on how to optimise the use of these data need refining. Recordings for HRV measurements can be short term (10–20 seconds or a few minutes) or long term (days). Short-term recordings should have specific situations identified regarding position (supine, standing), state, time of day and breathing; for instance, morning, relaxed, supine or erect, spontaneous and/or controlled breathing (10 breaths/min). These situations can be identified or annotated during prolonged recordings.
Pulse Oximeter
A pulse oximeter is frequently used in exercise studies. Pulse oximetry works by passing a beam of red and infrared light through a pulsating capillary bed, usually an ear or finger. The ratio of red to infrared light transmitted gives a measure of the oxygen saturation of the blood. The oximeter works on the principle that the oxygenated blood is a brighter red than the deoxygenated blood, which is more blue-purple. The oximeter measures the sum of the intensity of both shades of red, representing the fractions of the blood with and without oxygen. The oximeter detects the pulse and then subtracts the intensity of colour detected when the pulse is absent. The remaining intensity of colour represents only the oxygenated red blood. This is displayed on the electronic screen as a percentage of oxygen saturation in the blood, along with the HR.
Photoplethysmography
Photoplethysmography (PPG) is an optical technique that detects blood volume changes in the microvascular bed of tissue under the skin surface.15 The PPG waveform comprises a pulsatile (‘AC’) physiological waveform attributed to changes in the blood volume with each heart beat and a ‘DC’ baseline with various lower frequency components associated with respiration, sympathetic activity and thermoregulation. The AC waveforms can be corrupted by motion artifact and affected by skin characteristics. Numerous groups are working to overcome these limitations, often by incorporating accelerometers and spectral analysis.16,17
Validation of PPG for the assessment of HRV has been limited, but interest in the technique has increased substantially in recent years. Although there are issues related to motion artifact, the accuracy and wearability of PPG devices make them an attractive option for HRV monitoring. With PPG-HRV, SDNN and SD2 seem to have the greatest stability, with relative error compared with ECG between 2 % and 2.5 %, whereas pNN50 seems to be unstable, with relative error ~30 %.18 HRV estimation using PPG through Bayesian learning algorithms may improve. PPG has the potential to assess ultra-short-term analysis in a free-living environment. In one study, Baek et al. reported a 5-minute PPG-HRV procedure in which HR, HF, LF, VLF, LF/HF, RMSSD, pNN50 and SDNN required 10, 20, 90, 270, 90, 30, 60 and 240 seconds, respectively.19
In response to the rapid uptake in usage of PPG-based wellness devices, Shcherbina et al. compared five commercially available wrist-worn devices that measure HR using PPG.20 Sixty participants wore devices while being simultaneously assessed with continuous telemetry when sitting, walking, running and cycling. Error in HR was computed for each subject–device–activity combination. Devices reported the lowest error for cycling and the highest for walking. Device error was higher for males, greater body mass index, darker skin tone and walking. Six of the devices achieved a median error for HR below 5 % during cycling. Shcherbina et al. concluded that most wrist-worn devices adequately measure HR in laboratory-based activities. HRV was not part of this study.
To establish the validity of smartphone PPG and HR sensors in the measurement of HRV, Plews et al. studied 29 healthy subjects.21 An app called HRV4Training uses a smartphone’s light and camera as a PPG sensor. RR intervals were measured at rest during 5 minutes of guided breathing and normal breathing using the smartphone PPG, ECG chest strap (H10 Polar, which uses the R wave peak to send RR data via Bluetooth to a smartphone) and ECG. The root mean sum of the squared differences between R–R intervals (rMSSD) was determined from each device. Both PPG- and HR-sensor-derived measures had almost perfect correlations with ECG (R = 1.00 [0.99; 1.00]). Plews et al. concluded that PPG and HR sensors provide an acceptable agreement for the measurement of rMSSD when compared with ECG.
Lu et al. enrolled 42 subjects, comparing ECG-measured parameters with ear-clip contact-based PPG methods for HRV analysis.22 After 5 minutes of analysis at rest, they found highly significant correlations in SDNN, LF power, HF power and LF/HF ratio. Similarly, in a study of 30 subjects, Peng et al.23 used a smartphone-based PPG to compare HRV measurements with ECG while at rest. They found good correlation between the average of all NN intervals. LF parameters were in greater agreement than HF parameters, consistent with HF measurements being more prone to noise.
Perrotta et al. compared Elite HRV, a commercially available mobile app, to an established software program for ECG analysis (Kubios HRV 2.2).24 Thirty-seven subjects (average age 30.8 years) were enrolled, recording HRV measurements (RMSSD) for 14 consecutive days upon waking. There was a significant correlation between Elite HRV and Kubos HRV 2.2 measurements (r=0.92, p<0.0001). However, when using Bland–Altman analysis to assess for agreement, 6.4 % of RMSSD values fell outside the 95 % confidence interval. This was thought to be due to the prolonged time of measurement – many participants recorded data for more than 10 minutes – and longer sampling lengths have been shown to increase variance in R-R intervals in vagal-related indicies.3 For this reason, most studies choose a sampling time of between 3 and 5 minutes.
While these studies have established a high correlation between PPG and ECG for HRV at rest, few studies have assessed HRV parameters with exercise. Lin et al. enrolled eight healthy subjects, comparing PPG and ECG HRV parameters at rest and with exercise.25 While LF coherence was demonstrated throughout, HF coherence decreased after exercise, again demonstrating the susceptibility of these measurements to noise when used in the general community.
ECG Devices
ECG devices offer the most accurate way to measure ambulatory HRV, either by using only the fiducial point of the QRS complex or, better yet, by using the entire ECG complex processed by computer algorithms to account for arrhythmias.
Single-lead ECG Adhesive Recorder
In one of the earliest reports of an adhesive recorder, Lemmert et al. reported the comparative ability of a three-channel ECG recorder to detect premature ventricular contractions and ventricular fibrillation.26 Ackermans et al evaluated the feasibility of an adhesive monitor.27 They found that the new monitor could be worn by most participants for at least 6 days, and that skin irritation and comfort rating were comparable and impact on the quality of life was low compared with the control. The NUVANT was a single-lead ECG adhesive recorder paired with a portable transmitter.28
To minimise noise, Lee and colleagues created a wearable device that utilised R and S wave amplitudes for QRS detection, as well as a temporal period of at least 200 ms between successive R-R intervals to decrease noise. This patch device showed improved signal-to-noise ratio when compared with Holter for ambulation at speeds greater than 1 km/h.29 There are other ambulatory ECG solutions with software providing HRV analysis.30
A more complicated method of ECG analysis with potential for assessing sympathetic nervous system activity requires 3D high-resolution ECG recordings.31 ST and T wave portions of the ECG are subject to rhythmic modulations in the LF range (≤0.1 Hz). Periodic repolarisation dynamics likely reflect the response of the myocardium to sympathetic activation and are a strong and independent predictor of mortality. This could be applied to ECG signals gathered by an ambulatory device.
Wearables: Watches and Wrist or Chest Bands
Most wrist-worn wearables depend upon PPG to estimate HR and cardiac rhythm, although some have an added ECG sensor. Chest straps with ECG electrodes that record ECG signals are more accurate. One such device is the H10 Polar, which uses the R wave peak to send RR data via wireless technology to a smartphone. The actual ECG waveform is not visualised with this device.
Samsung has developed several prototypes of a band that includes a single-channel ECG (built-in electrodes for right and left hand), multi-wavelength PPG, and tri-axial accelerometry recording simultaneously at 128 Hz. In a published study, ambulatory pulsatile and movement data were recorded from 46 subjects and the ECG was recorded for 3.5–8.5 minutes.32 Pulse detection was performed on the PPG waveforms, and 11 features were extracted based on HRV and waveform signal quality.
Google’s health division Verily recently announced the launch of a new smartwatch called the Study Watch, which will be focused on use in medical research studies.33 It will be able to capture and store up to a week’s worth of raw encrypted data, including ECG, movement data and electrodermal activity.34
Conclusion
Given the recent trend towards incorporating health assessment into wearable and other mobile technologies, efforts are being put into establishing the validity of these devices for HRV measurements. While multi-lead ambulatory ECG devices have served as the gold standard, multiple alternative devices, mainly based on single-lead ECG and PPG, are more convenient and practical for measuring HRV parameters. Their validity must continue to be studied, particularly in cohorts needing risk stratification, and decisions made regarding which measurements are the most accurate and reproducible. Part two will deal with prognostic studies and training studies applying HRV technologies and methods.
Clinical Perspective
- It is important to understand the balance between sympathetic and parasympathetic control over HR variability.
- New ambulatory monitoring technologies permit ambulatory cardiovascular monitoring on a scale not achievable with traditional techniques.
- Part two of this review will focus on implications of these new devices for training and prognostic purposes.