Abstract
The aim of this study was to evaluate the validity of the bone density value of potential implant sites in HU obtained by a specific cone-beam computed tomography (CBCT) device. In this study, the HU values obtained using a MSCT scanner were used as the gold standard. Twenty mandibles (40 potential implant sites) were scanned using an MSCT scanner (Somatom Sensation 40) and a CBCT scanner (i-CAT). The MSCT images were evaluated using the Syngo CT Workplace software and the CBCT images, using the XoranCat software. The images were evaluated twice by three oral radiologists, at 60 day intervals. The trabecular bone density of the same area was evaluated on both images. Intraclass coefficients (ICC) were calculated to examine the agreement between the examiners and between the two periods of evaluation. The bone density and area of the ROI were compared by the Student t test and Bland-Altman analysis. ICCs were excellent. The mean HU value obtained using CBCT (418.06) was higher than that obtained using MSCT (313.13), with a statistically significant difference (p < 0.0001). In addition, Bland-Altman analysis showed that the HU measures were not equivalent. In conclusion, the bone density in HU with CBCT images obtained using the device studied proved unreliable, since it was higher than that obtained using MSCT.
Tomography; X-Ray Computed; Cone-Beam Computed Tomography; Bone Density; Dental Implants
ORAL RADIOLOGY
Bone density: comparative evaluation of Hounsfield units in multislice and cone-beam computed tomography
Isabela Maria de Carvalho Crusoé SilvaI; Deborah Queiroz de FreitasI; Glaucia Maria Bovi AmbrosanoII; Frab Norberto BóscoloI; Solange Maria AlmeidaI
IOral Radiology Area, Department of Oral Diagnosis, Piracicaba Dental School, Univ Estadual de Campinas - Unicamp, Piracicaba, SP, Brazil
IIDepartment of Community Dentistry, Dental School of Piracicaba, Univ Estadual de Campinas - Unicamp, Piracicaba, SP, Brazil
Corresponding Author Corresponding Author: Deborah Queiroz Freitas E-mail: deborah@fop.unicamp.br
ABSTRACT
The aim of this study was to evaluate the validity of the bone density value of potential implant sites in HU obtained by a specific cone-beam computed tomography (CBCT) device. In this study, the HU values obtained using a MSCT scanner were used as the gold standard. Twenty mandibles (40 potential implant sites) were scanned using an MSCT scanner (Somatom Sensation 40) and a CBCT scanner (i-CAT). The MSCT images were evaluated using the Syngo CT Workplace software and the CBCT images, using the XoranCat software. The images were evaluated twice by three oral radiologists, at 60 day intervals. The trabecular bone density of the same area was evaluated on both images. Intraclass coefficients (ICC) were calculated to examine the agreement between the examiners and between the two periods of evaluation. The bone density and area of the ROI were compared by the Student t test and Bland-Altman analysis. ICCs were excellent. The mean HU value obtained using CBCT (418.06) was higher than that obtained using MSCT (313.13), with a statistically significant difference (p < 0.0001). In addition, Bland-Altman analysis showed that the HU measures were not equivalent. In conclusion, the bone density in HU with CBCT images obtained using the device studied proved unreliable, since it was higher than that obtained using MSCT.
Descriptors: Tomography, X-Ray Computed; Cone-Beam Computed Tomography; Bone Density; Dental Implants.
Introduction
The quantity and the quality (density) of available bone influence the clinical success of dental implants. Computed tomography (CT) is an established method for acquiring bone images before performing dental implant surgery. It allows precise three-dimensional evaluation of anatomic structures and direct measurement of bone density, expressed in Hounsfield units (HU),1 characteristics that provide important information about the bone.
Hounsfield units (HU) are standard numbers originating from CT imaging. HU represent the relative density of body tissues according to a calibrated gray-level scale, based on values for air (-1000 HU), water (0 HU), and bone density (+1000 HU).2 Many studies have evaluated the use of HU to assess the relative bone density of the jaws in CT, and HU seem to be a useful method to analyze bone density, despite the high radiation doses associated with CT imaging.3,4
Today, cone-beam computed tomography (CBCT) is increasingly replacing multislice CT (MSCT) in dentistry for evaluating mineralized tissues, because it provides adequate image quality associated with a lower exposure dose. Other advantages of CBCT are low cost, as compared with CT, fast scanning time and lower number of image artifacts.5 Several authors have reported the use of CBCT intensity values as a measurement to assess bone density.1,6-10 However, other studies concluded that the HU derived from CBCT and from MSCT is not identical.2,11 Moreover, there are many differences in the methodology used in these studies, concerning the sample and the CBCT device. Isoda et al.9 defended that it is not clear whether the density values obtained by a CBCT device could be applied to another device. Nackaerts et al.2 found that, when five CBCT scanners were studied, the intensity values varied depending on the device.
We also believe that projection data discontinuity, image artifacts and the scatter levels produced by CBCT scanners can vary depending on the device, and can affect the accuracy of CBCT intensity values. This could make CBCT images unreliable for assessing bone density. To the best of our knowledge, only one study evaluated images of i-CAT;10 however, they compared them with micro-CT. This evaluation provides accurate bone density measurements, but it cannot yet be applied clinically. This indicates that more studies are required in order to confirm the proposition that CBCT images obtained by the CBCT scanner can successfully substitute the MSCT scanner in evaluating bone density.
Therefore, given the importance of the subject, the lack of consensus of other studies and the lack of studies on the i-CAT scanner, the aim of this study was to evaluate the validity of the bone density value of potential implant sites in HU obtained by a specific CBCT device. In this study, the HU values obtained using a MSCT scanner were used as the gold standard.
Methodology
This study was approved by the Research Ethics Committee of the State University of Campinas, Protocol No. 124/2010. Twenty dry partially or completely edentulous mandibles were used. A gutta-percha marker was fixed into each mandible angle at the same height in order to obtain the same axial images using CBCT and MSCT.
Acquisition of images
The images were acquired in the following manner. Each mandible was positioned in a Styrofoam container (dimensions: 16 ⋅ 16 ⋅ 9 cm) filled with water, which covered the container to simulate the soft tissues. MSCT image acquisition was performed using a Somatom Sensation 40 scanner (Siemens AG, Erlangen, Germany) according to the following technical protocol: 120 kVp and 200 mA, 160 mm field of view, 0.7 mm thick slice, 0.5 mm increments, 968 ⋅ 968 matrix, 0° gantry angulation. CBCT images were acquired using a Classic i-CAT scanner (Imaging Sciences International, Inc., Hatfield, USA), operating at 120 kVp and 8 mA, voxel 0.2 mm, 40 s rotation time, 80 mm field of view, 512 ⋅ 512 matrix, and no added filtration.
Image analysis
The MSCT images were evaluated using the Syngo CT Workplace software (Siemens AG, Erlangen, Germany). The CBCT images were analyzed using the XoranCat version 3.1.62 software (Xoran Technologies, Ann Arbor, USA).
Three sequential axial images were used:
1. the image corresponding to the gutta-percha marker, which was considered the central image,
2. the superior view of the central image, and
3. the inferior view of the central image of each of the 20 mandibles (40 potential implant sites).
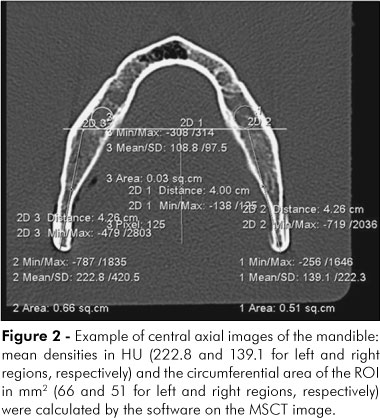
The operator used the spatial coordinate tool (x,y) to determine the region of interest (ROI). The y-coordinate, which could vary vertically, was held constant, and the x-coordinate, which could vary horizontally, was initially positioned tangential to the posterior region of the gutta-percha markers. The posterior region of the gutta-percha markers was used as reference for the operator to start the evaluation of both images. The x-coordinate was displaced 4 cm in the anterior direction, where a circular area was defined in each hemi-mandible tangential to the internal cortical bones, corresponding to the ROI (Figure 1). Then the mean densities and standard deviations in HU, as well as the circumferential area of the ROI (mm2) in the trabecular bone, were automatically calculated by the software. The procedures used to retrieve the bone density and the area measurements were identical for the MSCT and the CBCT images (Figures 2 and 3).
Three previously calibrated oral radiologists with CBCT experience measured the bone density of each ROI three times on each of the three axial images, totaling nine measurements for each potential implant site. The HU value and the area of each site were obtained by the mean of the nine measurements. The evaluation was repeated by the three examiners within an interval of 60 days to ascertain the reproducibility of the HU and the area measurements.
Statistical analysis
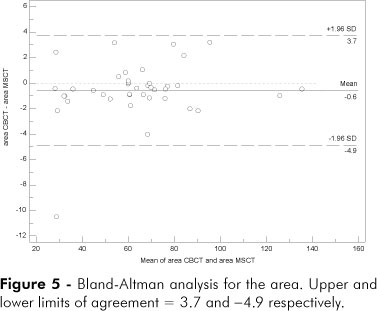
The statistical analyses were performed using SPSS Statistics 17.0J software (SPSS Inc., Tokyo, Japan). Intraclass correlation coefficients (ICC) were calculated to examine the agreement between the examiners and between the two periods of evaluations. Between-group comparison of bone density and area of the ROI were made with the paired Student t test (p values < 0.05 were considered statistically significant). In addition, the difference between the measurements was plotted against their average as recommended by Bland and Altman12 when a new method of measurement is to be compared against a gold standard. If the two measurements are equivalent, the difference should show values closer to zero mean and no significant trends.
Results
The intraobserver agreement was 0.99 for both HU and area measurements, whereas the interobserver agreement ranged between 0.98 and 1.00. Therefore, the ICCs were excellent.
Table 1 shows the means, standard deviations and p values of the HU for MSCT and CBCT. The HU value obtained using CBCT was higher than that obtained using MSCT, with a statistically significant difference (p < 0.0001).
The means, standard deviations and p values of the area measurements for MSCT and CBCT are shown in Table 2. There was no statistical difference between them (p = 0.11).
Figures 4 and 5 show the Bland-Altman analysis for HU and area of the ROI respectively. Analysis for HU revealed a positive mean (bias) of 104.9 for CBCT. This indicates that the measurements were not equivalent. Moreover, the limits of agreement were not close, further indicating that the methods are not interchangeable. When we evaluated the analysis for area, it could be observed that the measurements were in agreement, insofar as the mean was closer to zero (mean = -0.6) and the limits of agreement were close.
Discussion
The evaluation of bone density is essential for implant planning and for the success of this treatment. An adequate radiographic examination is required to obtain this information. To this end, several studies have assessed the evaluation of bone density.13,14 Evaluation of bone density was performed initially by subjective analysis.13,14 Later, studies correlated HU and objective assessment of bone density.3,4,15 - 17 Studies have also shown the relationship between high bone density and a high rate of success with implants.3,4,15,18 There is also good correlation between high bone density and the primary stability of the implants.9,19 Because MSCT is an established method to assess bone density in implant planning,2,3,15,18 we used MSCT images as the gold standard. Histomorphometric and densitometric evaluations provide accurate bone density measurements, but they cannot be applied in implantology routinely.15
Since CBCT has been replaced by MSCT in several areas of dentistry for evaluating mineralized tissues, it was important to determine whether it would be reliable in assessing bone density. However, the average value for CBCT was 418.06 HU, which was overestimated by 33.51% when compared with the MSCT value. Furthermore, the two statistical analyses showed that these measurements were not equivalent. This is in accordance with a previous study which found that CT values from CBCT images are not accurate. Nackaerts et al.2 observed that the intensity values were variable for CBCT imaging using different CBCT scanners, whereas MSCT showed stable HU values. This demonstrates that CBCT provides less accurate quantitative values for HU. These authors used 3D Accuitomo XYZ, Galileos Comfort, Kodak 9000 3D, Picasso Duo and Scanora 3D, whereas we used the i-CAT scanner. We also found that the CBCT values were not comparable to the MSCT values. However, we could not compare the values found by these authors with those of our study, because the authors used a phantom with water and calcium hydroxyapatite. Mah et al.20 also defended that CBCT systems do not display HU correctly. Accordingly, they studied the relationship between gray levels and HU by evaluating images of a phantom of 11 CBCT scanners. However, the authors pointed out that the results were obtained in an ideal situation in which the location and the size of each material was known, a very different situation from the clinical one.
Nevertheless, there are authors that defended the opposite. Aranyarachkul et al.1 also found overestimated values of HU, just like we did when these authors used human cadavers fixed in formalin or New Tom CBCT scanners. Despite the results, the authors concluded that CBCT could be considered a diagnostic tool for bone density evaluation. Naitoh et al.8 considered CBCT images useful for estimating bone density; however, they evaluated trabecular bone volume between the roots of the posterior inferior tooth on images obtained using the Alphard Vega scanner. Nomura et al.21 concluded that there was a high correlation between the values obtained using CBCT and MSCT images, when they measured voxel values on images of a water phantom with aluminum and iodine solutions scanned in 3D Accuitomo. However, the authors also claimed that the relationship was not entirely linear, and that the measurements obtained by CBCT were not as reproducible as those obtained by MSCT, and should be explored further.
The imprecision of the intensity values using CBCT may be attributed to several factors. The increased scatter generated by CBCT systems compared with MSCT systems results in inaccurate calculations.2,22,23 The cone angle x-rays of CBCT, another characteristic that differs from MSCT, influence the scatter. As the cone angle is widened to allow larger ROIs to be imaged, the scatter-to-primary ratio increases significantly. Furthermore, as the cone angle is widened, the scatter fluence at the center of the image plane increases relative to the periphery due to increased scatter from out-of-plane. The cone angle has also been seen experimentally to affect the presence and magnitude of the cupping artifact, due to a combination of scattered radiation and beam hardening.24 Nackaerts et al.2 reported that the intensity values in CBCT images are not reliable, because they are influenced by the device, the imaging parameters and the position of the area being evaluated.
When we compared the results of this study with the Misch classification,14 we observed that density values obtained using MSCT (313.3 HU) were classified as D4 (150 - 350 HU), whereas the values obtained using CBCT (HU 418.06) were classified as D3 (350 - 850 HU). Therefore, the increase in value produced different results. The quality of D2 and D3 classifications is better than that of D4, which demands attention during surgery.
In this study, the mandible images obtained are explainable because they approach the real-life situation and may be used on both scanners without being damaged by radiation. Since the aim of the study was not just to obtain density values but to compare both scanners, the use of dry bone is acceptable. It is important that all jaws be positioned in containers filled with water to simulate soft tissue, as reported by Katsumata et al.25
Despite the different methods of acquisition by MSCT versus CBCT scanners, there was no variance in the sample, and the same potential implant sites were examined by both scanners. Moreover, there were no differences between the three examiners and the two periods of evaluation, proving that these variables did not interfere with the results. Therefore, the HU values should be similar in both images for CBCT to be considered reliable in assessing bone density. The calculation used to determine HU should be universal and should not be influenced by image acquisition.
There are some limitations to an in vitro study. First, only the images and not the clinical parameters were evaluated. Second, dry mandibles without soft tissue simulation were used. Further studies with cadavers are necessary. In addition, in vivo research could be further developed, but this may be difficult to undertake. Another potential source of error could be the ROI. It is nearly impossible to eliminate the human error factor in selecting the ROI.20 Moreover, standardizing the ROI could be difficult because of the anatomical differences among jaws. For this reason, we used the circumferential area of the internal cortical bone and ascertained whether there was a difference between the areas on MSCT and CBCT posteriorly. Since the results showed that there was no statistical difference, we believe that the size and the position of the ROIs had no or little influence on the results, proving that the HU results are reliable.
Conclusion
The bone density value in HU on CBCT images obtained by the device studied is not reliable, since it was higher than that obtained on MSCT images. Improvements in the CBCT technique and the development of new software that allows uniform correction in CBCT images could contribute to reducing the differences between scanners, so that CBCT images can become a reliable tool for bone density assessment.
Submitted: Jul 02, 2012
Accepted for publication: Aug 28, 2012
Last revision: Sep 12, 2012
Declaration of Interests: The authors certify that they have no commercial or associative interest that represents a conflict of interest in connection with the manuscript.
- 1. Aranyarachkul P, Caruso J, Gantes B, Schulz E, Riggs M, Dus I, et al. Bone density assessments of dental implant sites: 2. quantitative cone-beam computerized tomography. Int J Oral Maxillofac Implants. 2005 May-Jun;20(3):416-24.
- 2. Nackaerts O, Maes F, Yan H, Couto Souza P, Pauwels R, Jacobs R. Analysis of intensity variability in multislice and cone beam computed tomography. Clin Oral Implants Res. 2011 Aug;22(8):873-9.
- 3. Turkyilmaz I, Tözüm TF, Tumer MC. Bone density assessments of oral implant sites using computerized tomography. J Oral Rehabil. 2007 Apr;34(4):267-72.
- 4. Aksoy U, Eratalay K, Tözüm TF. The possible association among bone density values, resonance frequency measurements, tactile sense, and histomorphometric evaluations of dental implant osteotomy sites: a preliminary study. Implant Dent. 2009 Aug;18(4):316-25.
- 5. Miracle AC, Mukherji SK. Conebeam CT of the head and neck, part 1: physical principles. AJNR Am J Neuroradiol. 2009 Jun;30(6):1088-95.
- 6. Lee S, Gantes B, Riggs M, Crigger M. Bone density assessments of dental implants sites: 3. bone quality evaluation during osteotomy and implant placement. Int J Maxillofac Implants. 2007 Mar-Apr;22(2):208-12.
- 7. Katsumata A, Hirukawa A, Okumura S, Naitoh M, Fujishita M, Ariji E, et al. Relationship between density variability and imaging volume size in cone-beam computerized tomographic scanning of the maxillofacial region: an in vitro study. Oral Surg Oral Med Oral Pathol Oral Radiol Endod. 2009 Mar;107(3):420-5.
- 8. Naitoh M, Aimiya H, Hirukawa A, Ariji E. Morphometric analysis of mandibular trabecular bone using cone beam computed tomography: an in vitro study. Int J Oral Maxillofac Implants. 2010 Nov-Dec;25(6):1093-8.
- 9. Isoda K, Ayukawa Y, Tsukiyama Y, Sogo M, Matsushita Y, Koyano K. Relationship between the bone density estimated by cone-beam computed tomography and the primary stability of dental implants. Clin Oral Implants Res. 2012 Jul;23(7):832-6.
- 10. González-García R, Monje F. The reliability of cone-beam computed tomography to assess bone density at dental implant recipient sites: a histomorphometric analysis by micro-CT. Clin Oral Implants Res. 2012 Jan 17. doi: 10.1111/j.1600-0501.2011.02390.x.
- 11. Arisan V, Karabuda ZC, Avsever H, Ozdemir T. Conventional Multi-Slice Computed Tomography (CT) and Cone-Beam CT (CBCT) for Computer-Assisted Implant Placement. Part I: Relationship of Radiographic Gray Density and Implant Stability. Clin Implant Dent Relat Res. 2012 Jan 17. doi: 10.1111/j.1708-8208.2011.00436.x.
- 12. Bland JM, Altman DG. Statistical methods for assessing agreement between two methods of clinical measurement. Lancet. 1986 Feb;1(8476):307-10.
- 13. Lindh C, Nilsson M, Klinge B, Petersson A. Quantitative computed tomography of trabecular bone in the mandible. Dentomaxillofac Radiol. 1996 Jun;25(3):146-50.
- 14. Misch CE. Density of bone: effect on treatment plans, surgical approach, healing, and progressive bone loading. Int J Oral Implantol. 1990;6(2):23-31.
- 15. Shapurian T, Damoulis PD, Reiser GM, Griffin TJ, Rand WM. Quantitative evaluation of bone density using the Hounsfield index. Int J Oral Maxillofac Implants. 2006 Mar-Apr;21(2):290-7.
- 16. Fuh LJ, Huan HL, Chen CS, Fu KL, Shen YW, Tu MG, et al. Variations in bone density at dental implant sites in different regions of the jawbone. J Oral Rehabil. 2010 May 1;37(5):346-51.
- 17. Hashemi HM, Javidi B. Comparison between interpositional bone grafting and osteogenic alveolar distraction in alveolar bone reconstruction. J Oral Maxillofac Surg. 2010 Aug;68(8):1853-8.
- 18. Oliveira RC, Leles CR, Normanha LM, Lindh C, Ribeiro-Rotta RF. Assessments of trabecular bone density at implant sites on CT images. Oral Surg Oral Med Oral Pathol Oral Radiol Endod. 2008 Feb;105(2):231-8.
- 19. Farré-Pagés N, Augé-Castro ML, Alaejos-Algarra F, Mareque-Bueno J, Ferrés-Padró E, Hernández-Alfaro F. Relation between bone density and primary implant stability. Med Oral Patol Oral Cir Bucal. 2011 Jan 1;16(1):e62-7.
- 20. Mah P, Reeves TE, McDavid WD. Deriving Hounsfield units using grey levels in cone beam computed tomography. Dentomaxillofac Radiol. 2010 Sep;39(6):323-35.
- 21. Nomura Y, Watanabe H, Honda E, Kurabayashi T. Reliability of voxel values from cone-beam computed tomography for dental use in evaluating bone mineral density. Clin Oral Implants Res. 2010 May;21(5):558-62.
- 22. Gupta R, Grasruck M, Suess C, Bartling SH, Schmidt B, Stierstorfer K, et al. Ultra-high resolution flat-panel volume CT: fundamental principles, design architecture, and system characterization. Eur Radiol. 2006 Jun;16(6):1191-205.
- 23. Orth RC, Wallace MJ, Kuo MD. C-arm cone-beam CT: general principles and technical considerations for use in interventional radiology. J Vasc Interv Radiol. 2008 Jun;19(6):814-20.
- 24. Siewerdsen JH, Jaffray DA. Conebeam computed tomography with a flat-panel imager: magnitude and effects of x-ray scatter. Med Phys. 2001 Feb;28(2):220-31.
- 25. Katsumata A, Hirukawa A, Okumura S, Naitoh M, Fujishita M, Ariji E, et al. Effects of image artifacts on gray-value density in limited-volume cone-beam computerized tomography. Oral Surg Oral Med Oral Pathol Oral Radiol Endod. 2007 Dec;104(6):829-36.
Publication Dates
-
Publication in this collection
23 Nov 2012 -
Date of issue
Dec 2012
History
-
Received
02 July 2012 -
Accepted
28 Aug 2012