
Molecular Correlates of In Vitro Responses to Dacomitinib and Afatinib in Bladder Cancer
Abstract
Background:
The HER family of proteins (EGFR, HER2, HER3 and HER4) have long been thought to be therapeutic targets for bladder cancer, but previous clinical trials targeting these proteins have been disappointing. Second generation agents may be more effective.
Objective:
The aim of this study was to evaluate responses to two second-generation irreversible tyrosine kinase inhibitors, dacomitinib and afatinib, in bladder cancer cell lines.
Methods:
Cell lines were characterized by targeted next generation DNA sequencing, RNA sequencing, western blotting and flow cytometry. Cell survival responses to dacomitinib or afatinib were determined using (3-[4,5-dimethylthioazol-2-yl]-2,5-diphenyl tetrazolium bromide) (MTT) or [3-(4,5-dimethylthiazol-2-yl)-5-(3-carboxymethoxyphenyl)-2-(4-sulfophenyl)-2H-tetrazolium (MTS) and phenazine methosylfate (PMS) cell survival assays.
Results:
Only two cell lines of 12 tested were sensitive to afatinib. Sensitivity to afatinib was significantly associated with mutation in either HER2 or HER3 (p < 0.05). The two cell lines sensitive to afatinib were also responsive to dacomitinib ralong with an additional 4 other cell lines out of 16 tested. No characteristic was associated with dacomitinib sensitivity. Molecular profiling demonstrated that only two genes were high in both afatinib and dacomitinib sensitive cells. Further rhigher expression of RAS pathway genes was noted for dacomitinib responsive cells.
Conclusions:
This study confirms that cell line screening can be useful in pre-clinical evaluation of targeted small molecule inhibitors and suggests that compounds with similar structure(s) and target(s) may have distinct sensitivity profiles. Further rcombinational targeting of additional molecularly relevant pathways may be important in enhancing responses to HER targeted agents in bladder cancer.
INTRODUCTION
Bladder cancer is predicted to have over 79,000 new cases and cause over 16,000 deaths in 2017. It is the second most common genitourinary cancer, fourth most common cancer in men, and the eighth highest cause of cancer death in men [1]. Mortality for invasive and metastatic bladder cancer remains high [2]. The recent observations of impressive and durable responses to new immune therapies were the first improvement in metastatic bladder cancer treatments in the past 20 years. However, responses to these promising new agents are limited to 20–30 percent of patients [3]. New and more effective treatments as well as predictive and prognostic markers must be found.
Precision medicine, which matches targeted therapies to the individual molecular profile of a patients’ tumor, has shown promise in many tumor types [4]. For bladder cancer, members of the HER/erbB family have been recognized as potential targets. The HER family includes four proteins: HER1/epidermal growth factor receptor (EGFR); HER2/erbB2; HER 3; and HER 4. Of these four proteins, three (EGFR, HER2 and HER4) have intracellular portions capable of cell signaling, while HER3 lacks active intracellular kinase domains. In response to ligand binding, members of this family form dimers which activate a tyrosine kinase signaling cascade [5–7].
EGFR overexpression has long been observed in bladder cancer, and appears to contribute to progression and invasion in bladder cancer [8]. HER2 expression has been reported in bladder cancer, and some studies suggest expression may be associated with more aggressive metastatic disease and shorter survival [9–11]. The Cancer Genome Atlas Project identified amplification in EGFR, amplification and mutation in HER2, and/or HER3 in multiple muscle-invasive bladder cancer tumors. Additionally, these alterations were mostly found in different tumors, which results in nearly 20% of patients demonstrating alteration in one of these genes [12]. These results have been confirmed in an independent study [13]. In spite of these data, early clinical trials targeting either EGFR or HER2 were mixed. Initial studies were performed using antibody-based agents that target the external domains of EGFR (cetuximab) or HER2 (trastuzumab). Cetuximab, when added to a combination of gemcitabine and cisplatin, produced greater toxicity with no improvement in overall survival or progression-free survival compared to the chemotherapies alone in patients with advanced urothelial cancers [14]. In a single-armed phase II clinical trial, trastuzumab added to paclitaxel, carboplatin and gemcitabine showed a high 70% initial response rate, but the time to progression and survival rates were no better than historical results for standard chemotherapy in metastatic urothelial cancer [15]. Since these agents target only one HER family member, dimerization with an untargeted HER partner might explain clinical resistance [7]. Experimental data have shown that EGFR may also partner with other non-HER family receptors [16, 17], providing additional means of resistance to therapies targeting EGFR activation.
A second generation of small molecule HER family drugs targeting the tyrosine kinase activity of HER family members have been generated [18]. This approach should be effective against any HER family dimers regardless of the participating receptors. Lapatinib is a reversible HER family tyrosine kinase inhibitor (TKI) that has shown promise in pre-clinical studies in bladder cancer [19]. However, clinical trials with this drug in unselected patients with advanced bladder cancer have been disappointing [20, 21].
New irreversible TKI HER family drugs are now available for study [18]. These drugs were developed specifically to target EGFR mutations that allow cancer cells to evade other EGFR targeting therapies [18, 22–24]. Even though such EGFR mutations are not common in bladder cancer [12] the high level of HER family expression in bladder cancer, along with previous lackluster results with traditional HER targeting agents, compels studies of other HER targeting drugs. Additionally, our expanding knowledge of the genetics of advanced bladder cancer may reveal subtypes more likely to respond to HER targeted agents. For example, up to 40% of cases of the aggressive micropapillary subtype have HER2 mutations when fewer than 10% of non-micropapillary bladder cancers have such mutations [13, 25].
Two of the irreversible HER targeting agents, dacomitinib and afatinib, have very similar chemical structures and even bind to identical sites on the mutant EGFR molecule [26, 27]. Dacomitinib has been shown to have promise in bladder cancer pre-clinical studies [28]. Afatinib is another irreversible pan-EGFR inhibitor which has activity in tumors. A phase II trial of single agent afatinib in metastatic platinum-refractory metastatic bladder cancer showed that patients with HER2 or HER3 molecular alterations derived clinical benefit from afatinib [29]. The identification of genomic, transcriptomic and protein markers to indicate which patients with metastatic bladder cancer might benefit from EGFR-targeted therapies is essential for further drug development in this patient population. In this study, we explored the endogenous genetic and protein expression profiles of a panel of bladder cancer cell lines and compared them to the in vitro cytotoxicity responses to dacomitinib and afatinib to identify potential biomarker predictors of sensitivity to these kinase inhibitors.
MATERIALS AND METHODS
Chemicals
Dacomitinib was provided by Pfizer (New York, NY) and afatinib purchased from Selleckchem (Houston, TX). Staurosporine, MTT (3-(4,5-dimethylthiazol -2-yl)-2,5-diphenyl tetrazolium bromide) and phenazine methosulfate (PMS) were purchased from Sigma Chemicals (St. Louis, MO). MTS [3-(4,5-dimethylthiazol-2-yl)-5-(3-carboxymethoxyphenyl)-2-(4-sulfophenyl)-2H-tetrazolium] was purchased from Promega (Madison, WI).
Cell lines
All cells were cultured in Dulbecco’s Minimal Essential Medium (DMEM; Corning, Manassas VA) supplemented with 10% fetal bovine serum and 1% penicillin/streptomycin/Fungizone (Corning, Manassas, VA). Cell lines 253J, 5637, J82, RT4, SW780 and T24 were obtained from the American Type Culture Collection (ATCC, Manassas, VA). UM-UC-1,3,5,6,7,9,10,12,13,14,15,17 and 18 were obtained from the originator, Dr. H. Barton Grossman, The University of Texas-MD Anderson Cancer Center, Houston, TX. All cell lines were appropriately characterized or found to be unique by DNA short tandem repeat analysis (IDEXX Bioresearch, Columbia, MO) within 6 months of use. All cultures were monitored and found to be free of bacterial and mycoplasma infection (last tested 2017/8/24).
Cell survival assays
Cell survival assays that were performed used standard techniques [30, 31]. Briefly, 0.1 mL of cells were plated in a 96-well plate at 1000–2000 cells/well in DMEM with 10% fetal bovine serum and 1% penicillin/streptomycin but without phenol red, and allowed to incubate overnight. The next day, 0.1 mL of various concentrations of drugs (dacomitinib or afatinib), diluted in DMEM without phenol red, were added to wells at least in triplicate. Cells without drug treatment (receiving 0.1 mL of DMEM without phenol red) served as a negative control, and cells treated with 2.5 μM staurosporine diluted in DMEM without phenol red to determine maximal cytotoxicity as a positive control. After four days, the number of surviving cells was quantitated using an indicator; for dacomitinib, MTT was used as previously described [30] and for afatinib, MTS + PMS [31]. The results were analyzed by graphing the log of inhibition versus response with a nonlinear fit calculation to determine the IC50 (GraphPad Prism Software v5, La Jolla, CA). For each drug, mean IC50 values were used to classify bladder cancer cell lines as having a sensitive, moderate, or resistant response. 3-bin k-means clustering as implemented in the R programming language [32] was used to classify cell lines as sensitive, moderate, or resistant to dacomitinib.
Flow cytometry
Levels of cell surface expression of HER proteins were evaluated at the University of Michigan Cancer Center core facility on a Fortesse Cell analyzer (Becton Dickinson Biosciences, San Jose, CA) using FAC Diva 8.0.1 software (Becton Dickinson Biosciences, San Jose, CA). The following antibodies were used: Phycoerythrin or fluorescein isothiocyanate labeled rat monoclonal antibody to human EGFR (ICR 10, Abcam, Eugene, OR); allophycocyanin (APC) labeled anti-HER2 (Becton Dickinson Biosciences, San Jose, CA); APC labeled anti-human HER3 (R&D Systems, Minneapolis, MN); APC labeled anti-human HER4 (R&D Systems, Minneapolis, MN), and isotype controls mouse IgG2A (R&D Systems, Minneapolis, MN) and mouse IgG1 (Miltenyi Biotech, San Diego, CA). Cells were incubated with antibodies for 30 minutes-1 hour in the dark at room temperature on a rotator. After incubation, the cells were washed with phosphate buffered saline containing 1% fetal bovine serum (1% FBS/PBS), centrifuged, and resuspended in 1% FBS/PBS. The samples were kept on ice in the dark prior to analysis on the flow cytometer.
Western blotting
Western blotting of whole cell extracts was performed as previously described [33]. Briefly, cells were extracted by scraping into ice-cold lysis buffer and centrifuged x 14,000 g for 15 minutes. Equal amounts of protein (25 μg) for each cell line were separated by SDS-PAGE and transferred to FL-PVDF membranes (Bio-Rad, Hercules, California). The membrane was incubated with primary antibodies overnight at 4°C, washed, and incubated with secondary antibodies for one hour at room temperature. Antibodies used as probes were mouse anti-EGFR (Ab-15 Clone H9B4, ThermoFisher Scientific, Fremont, CA); mouse anti-erbB2 (Ab-17 Clone e2-4001+3B5, ThermoFisher Scientific, Fremont, CA) and mouse anti-β-actin (Sigma-Aldrich, St. Louis, MO). Blots were imaged using LI-COR IRDye 800CW and 680LT fluorescent secondary antibodies and a fluorescence imaging system (LI-COR, Lincoln, NE).
Targeted next generation sequencing (NGS)-DNA
Genomic DNA was isolated from bladder cancer cell lines using the Qiagen DNeasy kit (Qiagen, Valencia, CA, USA) with RNA-Seq treatment. Targeted multiplexed PCR based sequencing (Ampliseq) was performed using the DNA component of the Oncomine Comprehensive Panel (OCP), which assesses mutations, short insertions/deletions (indels) and copy number alterations in ∼135 oncogenes and tumor suppressors as described [34]. High confidence somatic mutations/indels and copy number alterations were prioritized as described (e.g. hotspot mutations or amplifications in oncogenes; hotspot mutations, deleterious mutations or deep deletions in tumor suppressors) [34].
Genomic DNA was used for library generation using the Ion Ampliseq library kit 2.0 (Life Technologies, Foster City, CA) according to manufacturer’s instructions with barcode incorporation as described. Templates were prepared using the Ion PGM Template OT2 200 Kit or Ion PI Template OT2 200 kit (Life Technologies, Foster City, CA) on the Ion One Touch 2 according to the manufacturer’s instructions. Sequencing of multiplexed templates was performed using the Ion Torrent Personal Genome Machine (PGM) on Ion 318 chips with the Ion PGM Sequencing 200 Kit v2 or on the Ion Torrent Proton machine using Ion PI chips using the Ion PI Sequencing 200 Kit v2 (Life Technologies, Foster City, CA) according to the manufacturer’s instructions.
Variant calling
Sequencing data was analyzed using Torrent Suite 5.0.2 with alignment by TMAP using default parameters, and variants called via the Torrent Variant Caller plugin (version v5.0.2.1) using default low-stringency somatic variant settings. Called variants were filtered to remove low-quality or panel-specific errors as previously described [34], including flow-corrected sequencing depth of <40 reads and variants at variant fractions of <10% in tumor suppressors or <5% in oncogenic hotspots. Synonymous and non-coding variants passing these initial filters were also removed, as were all variants present in the ExAC database at >0.1% (except those with pathogenic Clinvar annotation). The variant classification, gene/protein consequences and effect in protein function were identified using SNPnexus (http://www.snp-nexus.org) [35], Ensembl (http://useast.ensembl.org/index.html) [36], USCS Genome Browser (https://genome.ucsc.edu) [37] and RefSeqNCBI Reference Sequence Database (https://www.ncbi.nlm.nih.gov/refseq) [38] annotation tools. The findings were corroborated by bibliographic search.
Copy number analysis
Normalized, GC-content corrected read counts per amplicon for each sample were divided by those from a pool of normal male genomic DNA samples (FFPE and frozen tissue, individual and pooled samples), yielding a copy number ratio for each amplicon. Gene-level copy number estimates were determined as described previously [39–41] by taking the coverage-weighted mean of the per-probe ratios, with expected error determined by the probe-to-probe variance. Genes with a log2 copy number ratio estimate of < –1 or >0.8 were considered to have high level loss and gain, respectively.
RNA-Seq profiling, differential expression, and gene set enrichment
Total RNA was isolated from bladder cancer cell lines using QiZol (Qiagen, Valencia, CA, USA) and the RNeasy Kit (Qiagen) with DNAseq digestion. Paired end RNA sequencing libraries were prepared and sequenced using an Illumina HiSeq 2500 (Illumina, San Diego, CA, USA) as described [34].
Fragment reads were trimmed using Trimmomatic v0.36 with the following parameters: ILLUMINACLIP:TruSeq3-PE.fa:2 : 30 : 10 LEA-DING:3 TRAILING:3 SLIDINGWINDOW:4 : 15 MINLEN:36 [42]. Fragments were aligned to Gencode Release 19 GRCh37.p13 using STAR v2.5.2a with the following parameters: –outSAMtype BAM Unsorted –outFilterType BySJout –outFilterMultimapNmax 20 –outFilterMismatchNmax 999 –outFilterMismatchNoverLmax 0.04 –alignIntronMin 20 –alignIntronMax 1000000 –alignMatesGapMax 1000000 –alignSJoverhangMin 8 –alignSJDBoverhangMin 1 –outSAMstrandField intronMotif [43]. FPKM values were quantified using Cufflinks v2.2.0 with the following parameters: –max-bundle-frags 10000000 –library-type fr-unstranded [44]. FPKM values were normalized using the upper quartile normalization method [45].
Gene expression analysis was performed on each sample using the Cufflinks pipeline, as previously described [46]. Briefly, cDNA fragment size distribution means and standard deviations were estimated from unspliced alignment to the genome. Next, reads were prepared with Tophat 2.0.4’s “prep_reads” software, using the previously estimated fragment size distributions, prior knowledge of Ensembl gene annotations (hg19, GRCh37.69), and the following parameters: –min-anchor 8; –splice-mismatches 0; –min-report-intron 50; –max-report-intron 500000; –min-isoform-fraction 0.15; –max-multihits 20; –max-seg-multihits 40; –segment-length 25; –segment-mismatches 2; –min-closure-exon 100; –min-closure-intron 50; –max-closure-intron 5000; –min-coverage-intron 50; –max-coverage-intron 20000; –min-segment-intron 50; –max-segment-intron 500000; –max-mismatches 2; –max-insertion-length 3; –max-deletion-length 3; –no-closure-search; –no-coverage-search; –no-microexon-search; –library-type fr-firststrand. Alignment was then performed with Tophat 2.0.4, using Bowtie2, and again using the previously estimated fragment size distributions and Ensembl gene annotations. Finally, the expression of each Ensembl gene was estimated using Cufflinks version 2.0.2, using the following parameters: –library-type fr-firststrand; and –multi-read-correct. Gene-level FPKM values were then rounded to the nearest tenths place and summarized in expression matrices.
Fragment counts were generated per Ensembl gene using the SubRead featureCounts tool [47]. DESeq2 was used to quantify differential expression between sensitive and resistant cell lines [48]. Briefly, DESeq2 models sample read counts using a negative binomial distribution and a generalized linear model to estimate expression strengths, fold changes, and pValues. pValues were adjusted for multiple testing using the BH method to calculate qValues. For each drug, genes with a fold change ≥2 and a qValue ≤0.05 were considered to be differentially expressed. Additionally, for afatinib differential expression we required that all candidate genes have ≥0.5 FPKM value in both sensitive cell lines to prevent a high expressing sensitive line from masking a cell line with no expression for a given gene.
To interpret the meaning of genes with high relative expression in drug sensitive cell lines, we calculated statistical enrichment with KEGG and gene ontology (GO) annotated gene sets using a Fisher’s exact test. GO gene sets were downloaded 9/30/2016 using the GO.db Bioconductor package [49–51]. KEGG gene sets were downloaded using the KEGG web API on 9/30/2016 [52]. All gene set gene IDs were mapped to Entrez gene IDs and only Entrez gene IDs that mapped to both Gencode Ensembl IDs and a given gene set source were considered in the Fisher’s exact test calculation. P-values were adjusted for multiple testing using FDR for each gene set source and only gene sets with a qValue ≤0.05 were considered to be significant.
RESULTS
Characterization of cell lines
A panel of human bladder cancer cell lines were characterized by their gene copy number, gene mutations and expression of HER family genes in order to examine sensitivity to afatinib and dacomitinib. Only one cell line, UC5, had a high level amplification of EGFR, and six other cell lines showed a low gain in copy number for EGFR (Table 1). One cell line, UC18, had a low gain in copy number for HER2. Genomic amplification or deletions were not observed for HER3 and HER4. The bladder cancer cell line 5637 harbors an ERBB2 S310F mutation, and both UC15 and UC3 had missense mutations in ERBB3 (Table 2). All mutations are in the coding regions of the genes, resulting in alterations in the extracellular protein domains [12] and are predicted to be activating [13, 25, 53, 54].
Table 1
ErbB Family genomic alterations in the bladder cancer cell line panel
| Cell Line | |
| 253J | Low gain EGFR |
| UC1 | Low gain EGFR |
| UC5 | Amplified EGFR |
| UC7 | Low gain EGFR |
| UC9 | Low gain EGFR |
| UC10 | Low gain EGFR |
| UC12 | Low gain EGFR |
| UC18 | Low gain ERBB2 |
Table 2
Somatic mutations in ERBB genes in bladder cancer cell line panel
| Cell Line | Gene (HUGO nomenclature) | SNP/Genome change | Protein change/Protein sequence | Mutation type | Variant classification | Mutation function |
| 5637 | ERBB2 | g.chr17 : 37868208C>T | p.S310F (extracellular domain) | Substitution | Missense mutation | Exonic |
| UC15 | ERBB3 | g.chr12 : 56478854G>A | p.V104M (extracellular domain) | Substitution | Missense mutation | Exonic |
| UC3 | ERBB3 | g.chr12 : 56478817G>A | p.M91I (extracellular domain) | Substitution | Missense mutation | Exonic |
These results largely corresponded to RNA levels observed from RNA-Seq analyses of these cell lines with UC5 displaying the highest levels of EGFR and UC18 displaying the highest level of ERBB2 and UC3 very low levels (Fig. 1A). RNA sequencing demonstrated variable mRNA levels for HER3 with highest expression seen in UC9. HER4 mRNA expression was exceedingly low across all cell lines examined (Fig. 1A). These results were confirmed in a selected panel of cells by cell-surface flow cytometry (data not shown).
Fig.1
Endogenous RNA and protein expression of ErbB family members. (A) Heat map of the expression of ERBB genes [in log2(FPKM)] in bladder cancer cell lines from RNA-Seq analysis. ErbB family members are listed in the rows (EGFR, ERBB2, ERBB3, ERBB4) and cell lines are listed along the columns. (B) Western blot of whole cell lysates from human bladder cancer cell lines, whose names are listed above each lane, which were probed with EGFR and HER2 antibodies. Actin was used as a loading control.
![Endogenous RNA and protein expression of ErbB family members. (A) Heat map of the expression of ERBB genes [in log2(FPKM)] in bladder cancer cell lines from RNA-Seq analysis. ErbB family members are listed in the rows (EGFR, ERBB2, ERBB3, ERBB4) and cell lines are listed along the columns. (B) Western blot of whole cell lysates from human bladder cancer cell lines, whose names are listed above each lane, which were probed with EGFR and HER2 antibodies. Actin was used as a loading control.](https://content.iospress.com:443/media/blc/2018/4-1/blc-4-1-blc170144/blc-4-blc170144-g001.jpg)
Protein expression for HER family members was evaluated by western blotting. As expected based on genomic and gene expression analysis, UC5 cells displayed the highest level of EGFR protein by western blotting, consistent with its amplified status (Fig. 1B). UC18, which harbored a low gain of HER2 genomic DNA also displayed the most HER2 protein (Fig. 1B). Two cell lines, UC9 and UC10, have relatively higher levels of HER3 (data not shown).
These results suggest that UC5 (amplification and overexpression of EGFR), 5637 (HER2 mutation), UC18 (low gain copy number of HER2 with high protein expression), UC15 and/or UC3 (HER3 mutation) might be sensitive to inhibition of the EGFR/HER pathway. Additionally, UC7, had relatively high expression of EGFR, HER2 and HER3 by western blotting and RNA sequencing, suggesting possible sensitivity to EGFR/HER signaling inhibition.
Response to HER targeted therapy
Having determined that our cell line panels included an appropriate sampling of HER family mutations and expression, we used these cells to test responses to afatinib and dacomitinib. Mean IC50 values for afatinib varied from 0.39 to 6.14 μM (Fig. 2A). Only two cell lines, UC15 and 5637, were sensitive to afatinib (mean IC50 = 0.86 μM). These cells have mutations in HER2 (S310F, 5637) or HER3 (V104M, UC15) affecting the extracellular domains (Table 2; [12]). This result is consistent with the clinical observation that the majority of patients whose tumors were sensitive to afatinib had mutations in HER3 [29]. One other cell line, UC3, has a mutation in HER3 but is not sensitive to afatinib. UC3 also harbors a mutation in KRAS which is associated with resistance to EGFR inhibitors in advanced lung cancers and metastatic colon cancers [55]. Interestingly, despite amplification and overexpression of EGFR, UC5 was not sensitive to afatinib, suggesting that amplification of EGFR alone may be insufficient to promote sensitivity to afatinib. Analysis of the cell line responses demonstrated a significant difference between cells with HER2 or HER3 mutations compared to those cells that do not have mutations (p = 0.045, Fisher’s exact test; Table 3).
Fig.2
Cellular responses to afatinib and dacomitinib. MTS and MTT results for both (A) afatinib and (B) dacomitinib on a number of cell lines. The IC50 values were generated in triplicate and error bars represent the standard error of the mean. The three categories of dacomitinib response were obtained by 3-bin k-means clustering.
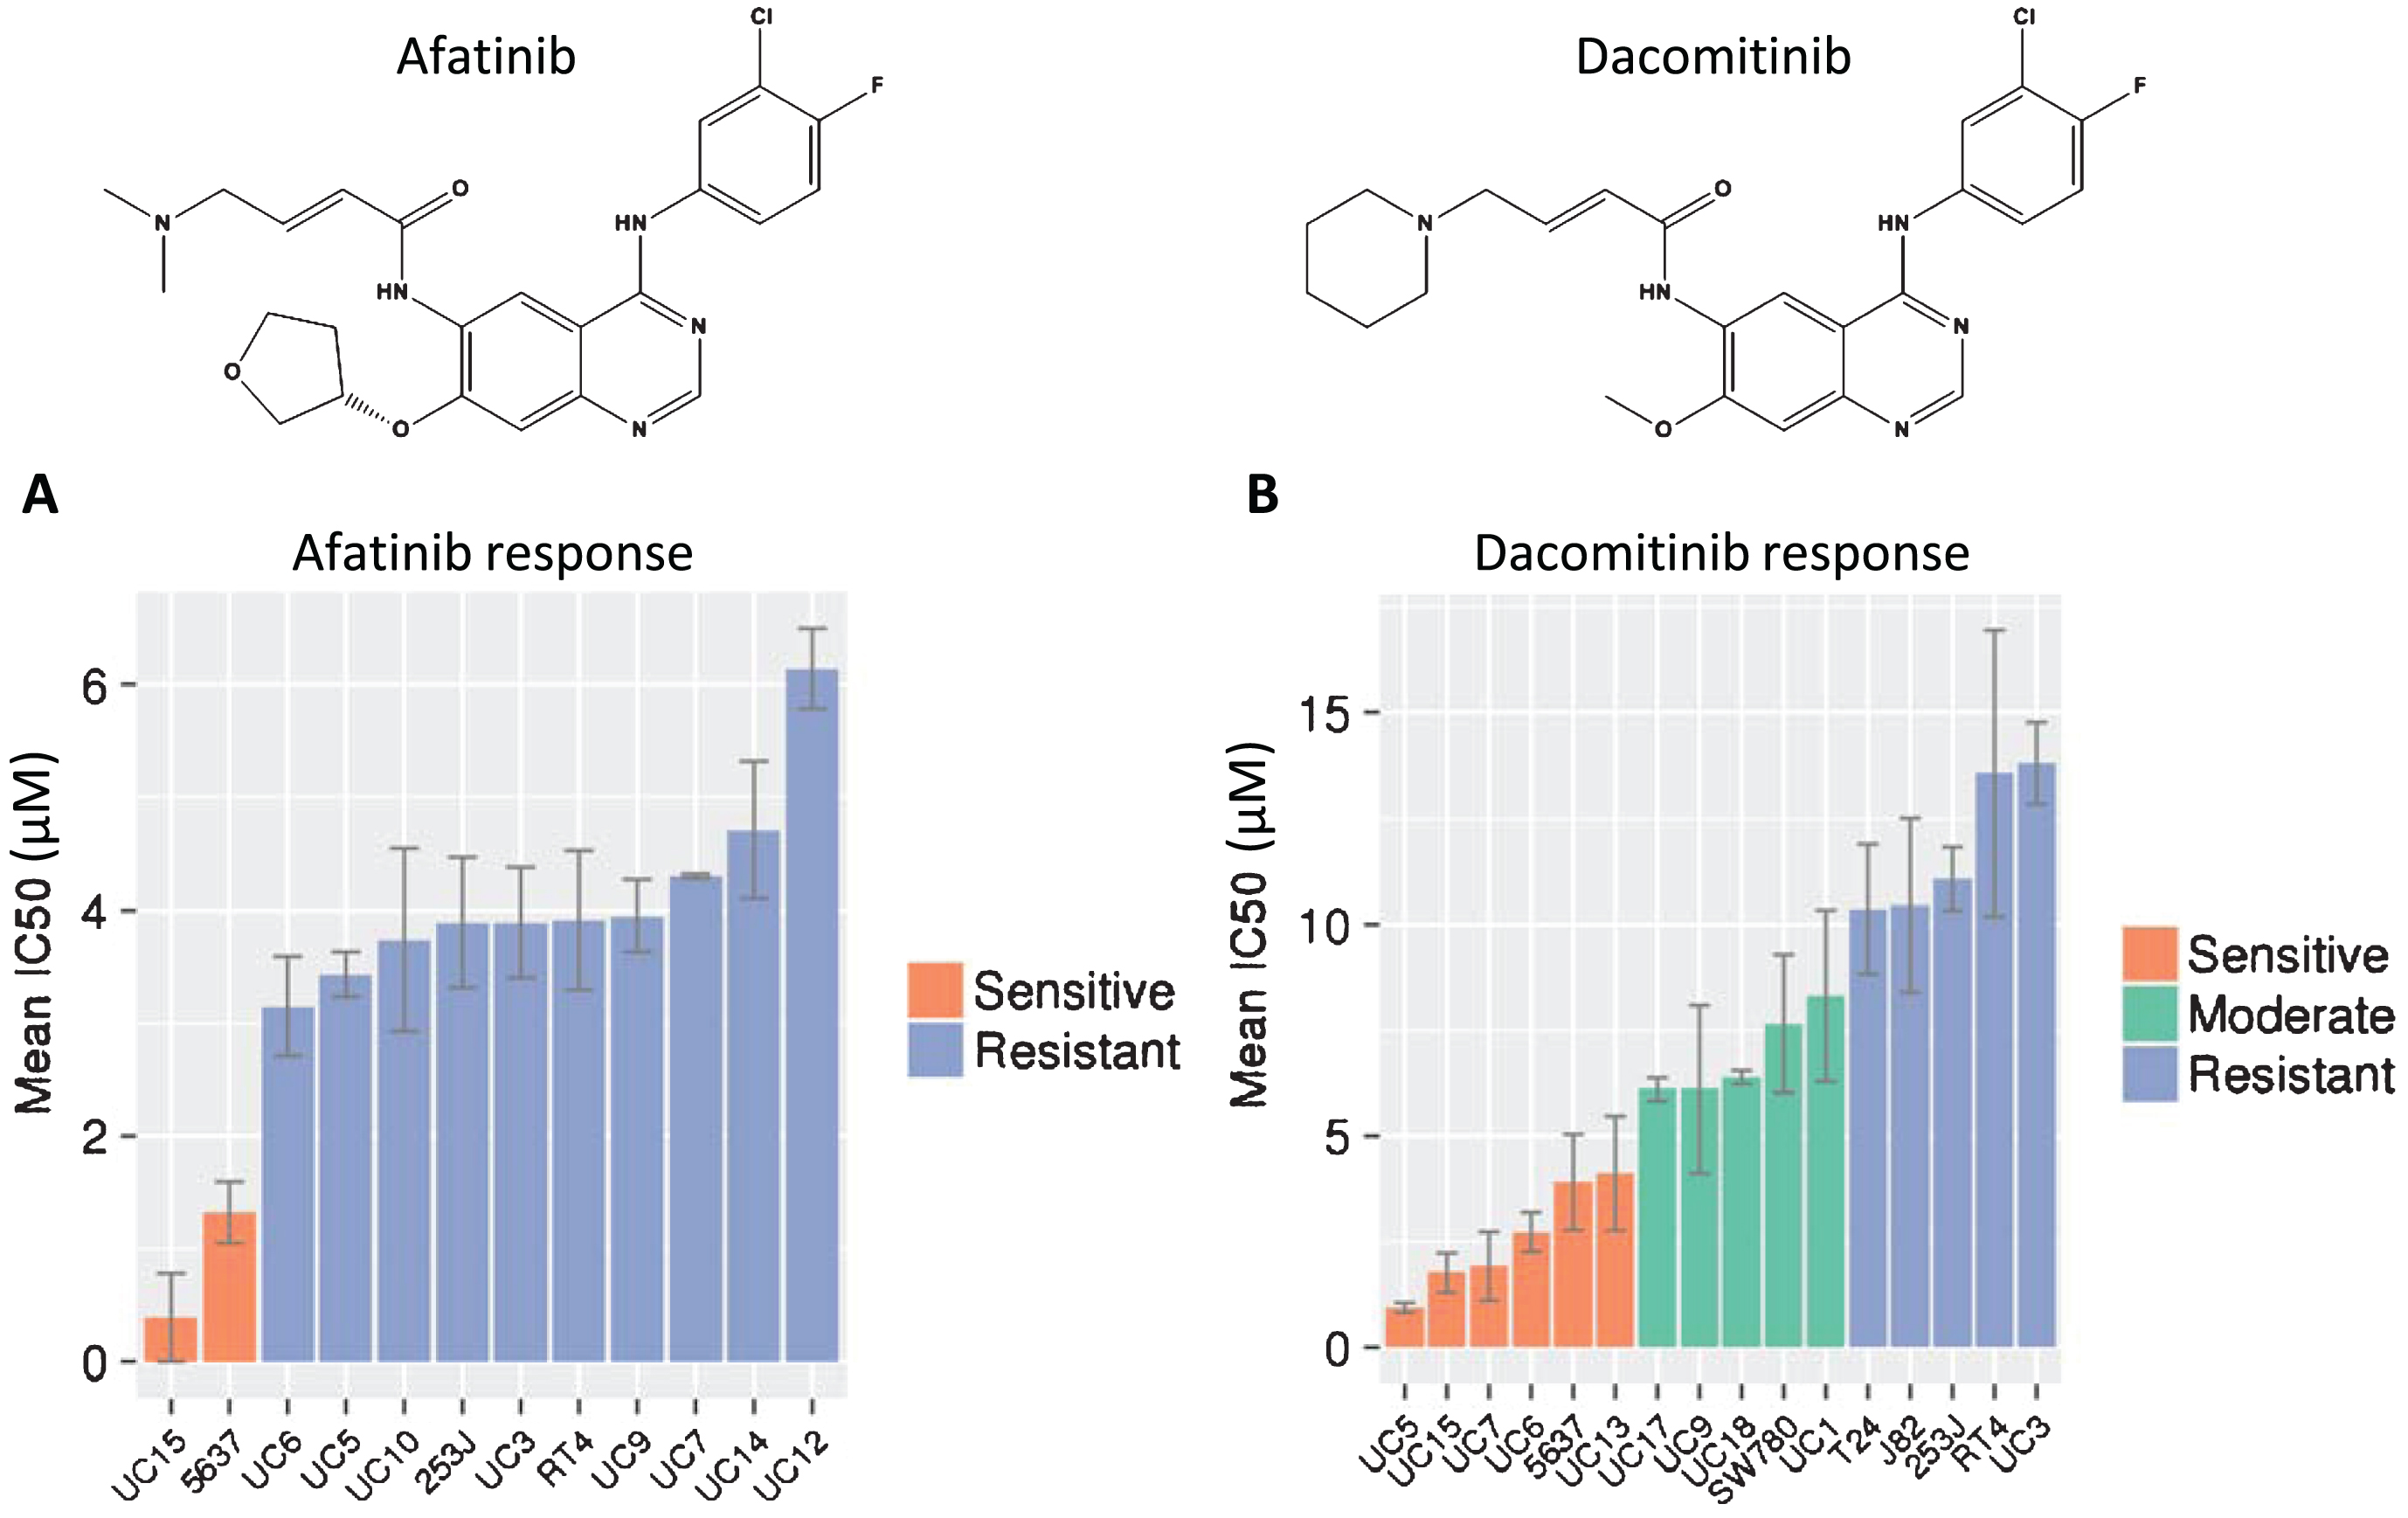
Table 3
Evaluation of afatinib sensitivity with Her2 or Her3 mutation
| Sensitive to AFAT | Resistant to AFAT | |
| Her2 or 3 mutant | 2 | 1 |
| Not mutant | 0 | 9 |
Fisher’s exact test one-tailed p = 0.0455.
Dacomitinib is another irreversible pan-HER inhibitor which was identified by similar screening methods and shows strong chemical structural similarity to afatinib (Fig. 2B). That similarity extends to binding to the same site on mutant EGFR molecules in structural modeling analysis [26, 27]. Despite these similarities, the responses of the bladder cancer cell line panel to dacomitinib were distinctly different from afatinib. The mean IC50 values for dacomitinib ranged from 0.95–13.8 μM, and showed a wider spectrum of sensitivities that were grouped into sensitive, intermediate and resistant groups by k-means clustering (Fig. 2B). As expected, the UC15 and 5637 cell lines that were sensitive to afatinib were also sensitive to dacomitinib. In contrast to afatinib, four additional cell lines, including UC5 (amplified EGFR and high EGFR protein expression but no mutation) also displayed sensitivity to dacomitinib. Two cell lines (UC6 and UC13) demonstrated sensitivity to dacomitinib although they had moderate to low expression of HER gene transcription and protein levels, and no mutations were detected. These data confirmed classification from our previous study, which identified UC6 as sensitive, UC9 as intermediate, and UC3 as resistant to dacomitinib [28].
Preliminary evaluation of predictors for response to dacomitinib revealed a trend toward higher EGFR protein expression. Of the six cell lines sensitive to dacomitinib, four showed higher EGFR expression, while only two out of eight of the moderate and resistant cells had higher EGFR expression. However, these results were not statistically significant, possibly due to the low number of cell lines in each group.
After the cell lines were categorized as sensitive or resistant (Fig. 3A, B), they were profiled using RNA-Seq, and differential analysis was used to identify differences in endogenous gene expression between cell lines that were sensitive to each drug versus resistant cell lines. We focused on genes with increased expression in cell lines sensitive to each drug. Gene expression changes with greater or equal to 2 fold and an FDR adjusted p-value less than or equal to 0.05 were considered significant. Using these criteria, we identified 38 genes expressed at higher levels in afatinib sensitive cells (Table S1) and 163 genes expressed at higher levels in dacomitinib sensitive cells (Table S2). We made profiles of the top 38 RNA-Seq differentially expressed genes in afatinib and dacomitinib sensitive cell lines (Fig. 3C, D). The expression profile for the two afatinib sensitive cells were similar to each other but different from the expression profiles of the resistant cells. The expression profiles of the dacomitinib sensitive cells showed that 5637 was different from the other sensitive cells, and appeared to be more similar to the resistant cells.
Fig.3
Cell lines were categorized as either sensitive or resistant to each TKI and then endogenous RNA expression was compared between sensitive and resistant cell lines. Cytotoxic response to (A) afatinib or (B) dacomitinib treated cells which are separated into groups of sensitive (orange) or resistant (blue). DESeq was used to quantify differences between the endogenous RNA expression of sensitive and resistant cell lines for each drug. Afatinib and dacomitinib had 38 and 163 genes identified, respectively, using fold change ≥2 and an FDR adjusted p-value ≤0.05 threshold. Median expression for all cell lines was 2. All log2(FPKM) values represented have been upper quartile normalized. Heat map depiction of the top 38 up-regulated differentially expressed genes for (C) afatinib and (D) dacomitinib sensitive cell lines versus resistant bladder cell lines. Two additional upregulated genes marked with “*”, CHD5 and TCHH, were included for dacomitinib despite not being in the top 38 up-regulated genes. These genes were included because they are (E) the only 2 genes overlapped between the up-regulated, differentially expressed genes for each drug. P-value for overlap was not significant (≥0.01).
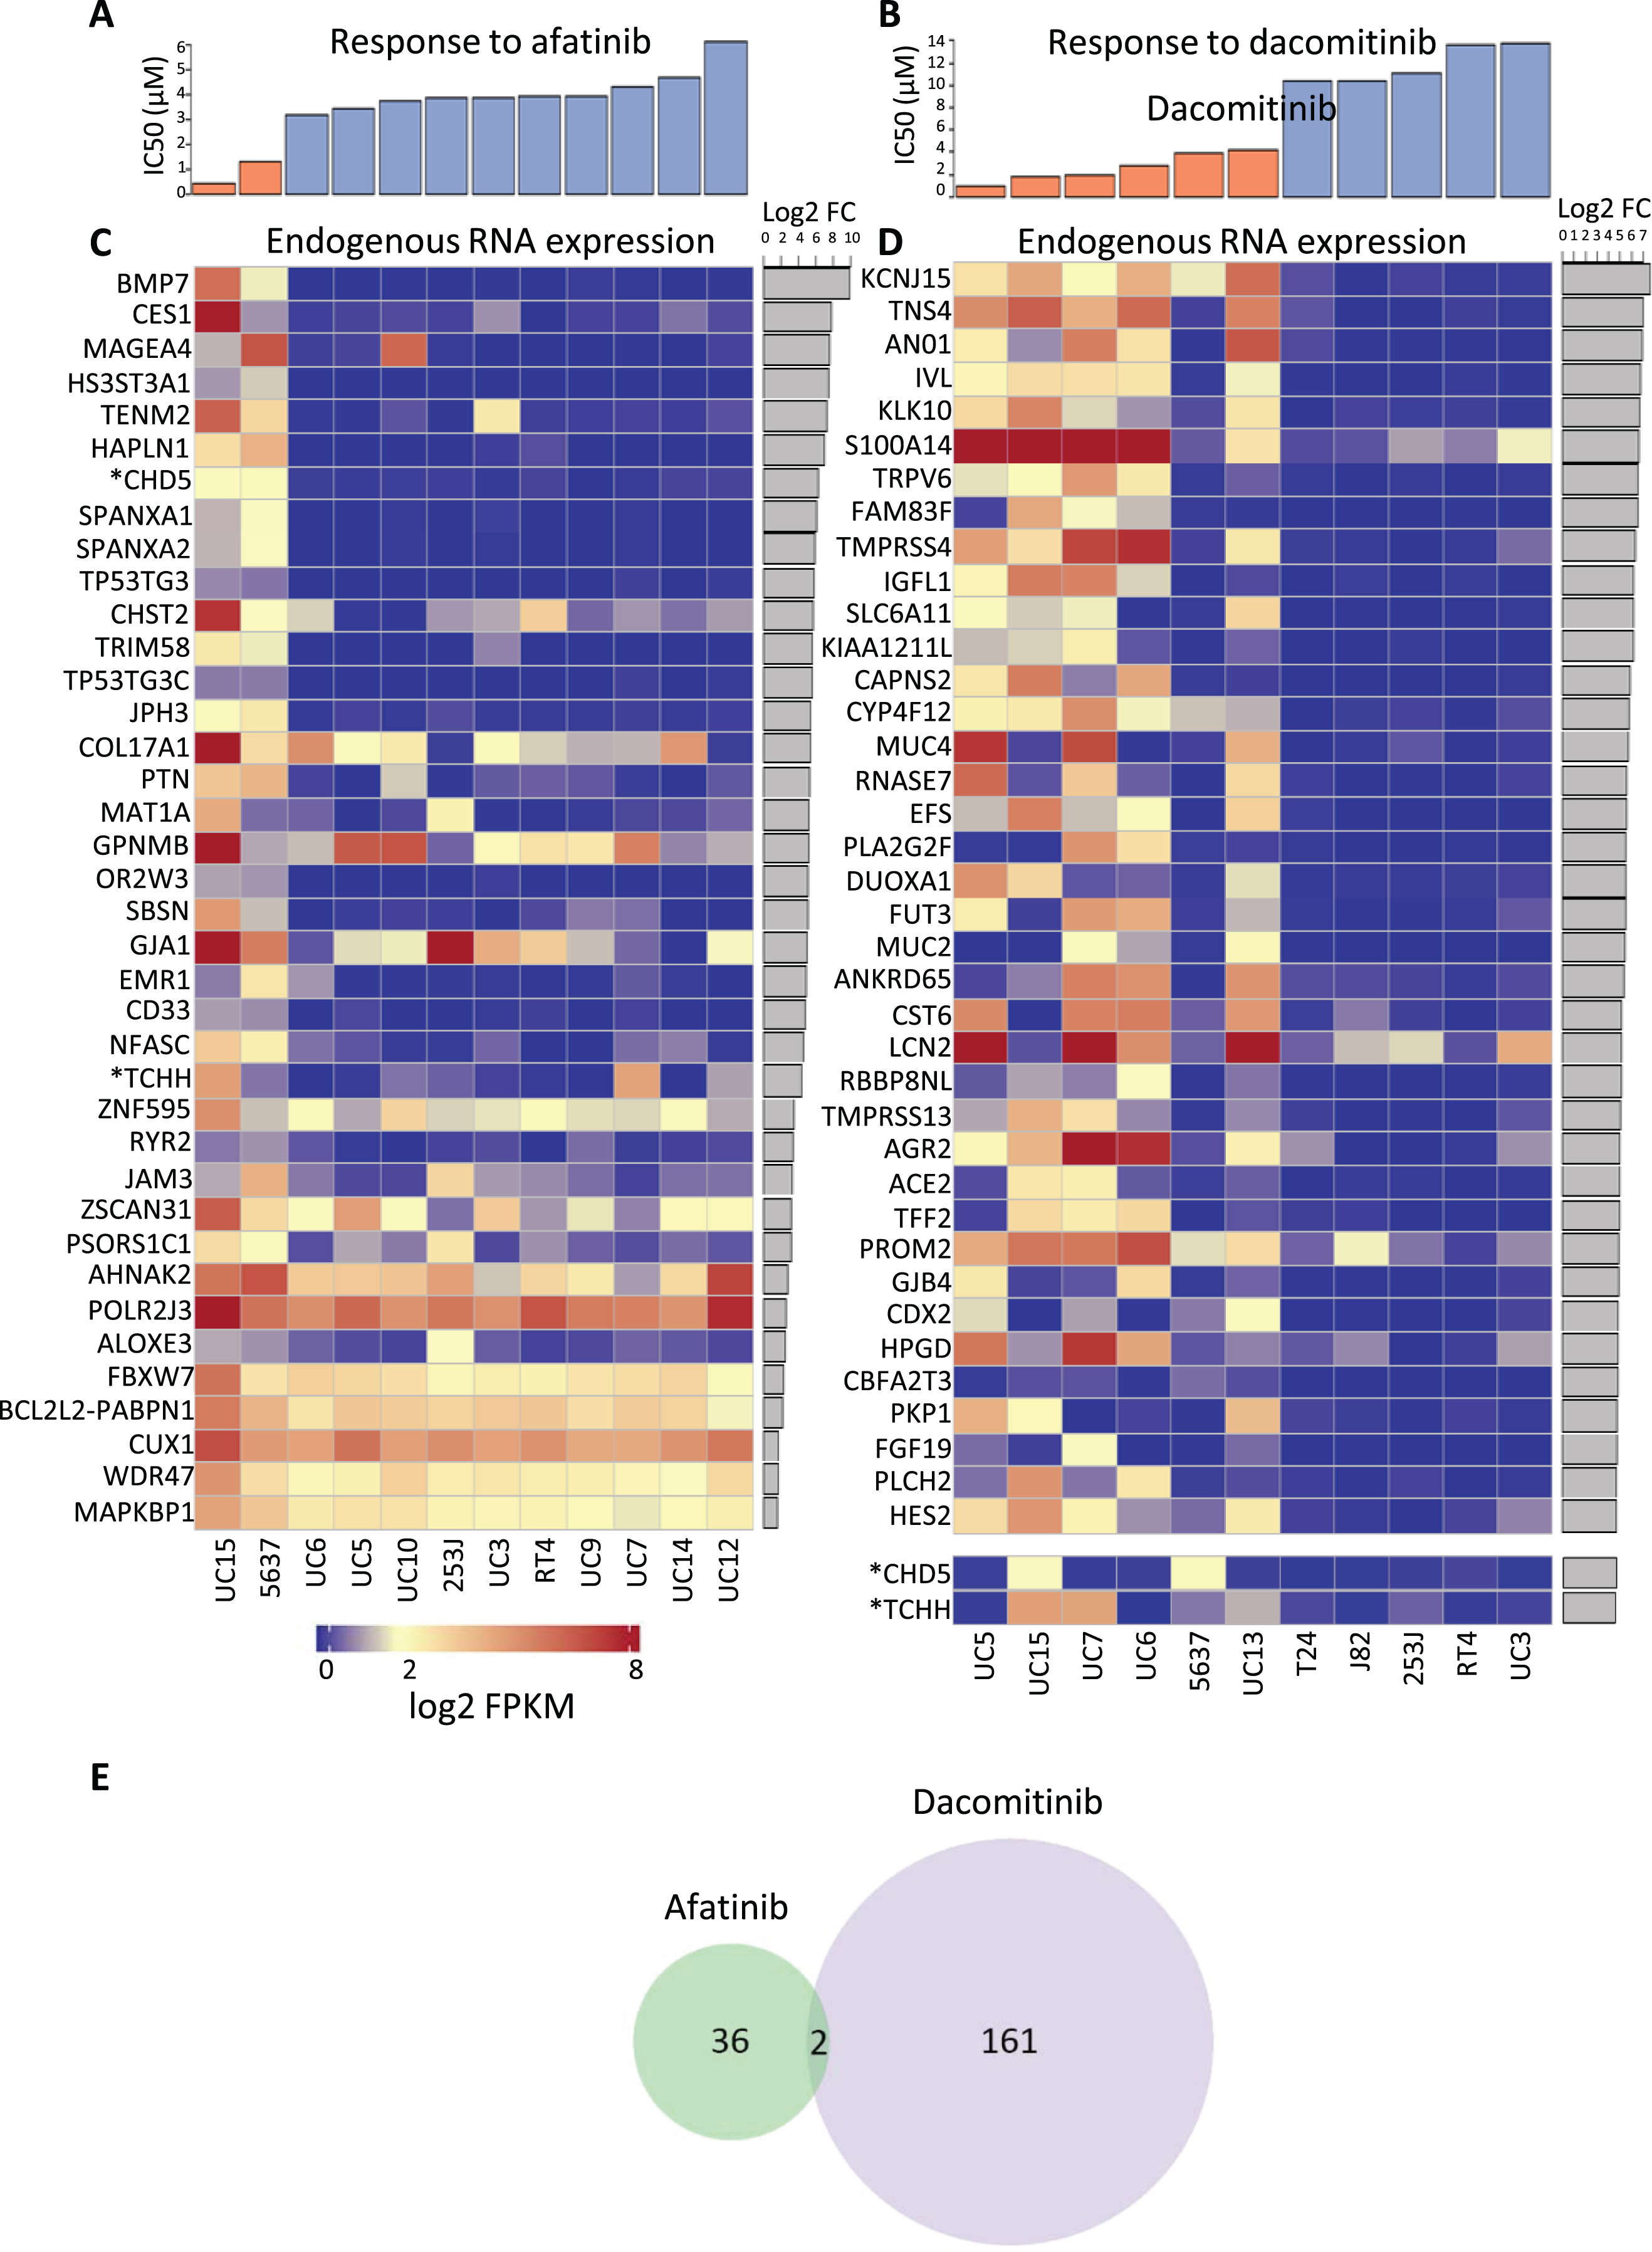
Of these expression profiles, only two genes were in common between dacomitinib and afatinib responses (out of 163 up-regulated in dacomitinib responsive cells and 38 in afatinib responsive cells), as shown in Fig. 3E. The lack of overlap in the gene signatures of cells sensitive to the two agents is consistent with hypothetical differences in the pathways involved in responses to afatinib and dacomitinib, resulting in in different spectra of activities of the two drugs. The two genes in common are CHD5, encoding a helicase DNA binding protein, and TCHH, encoding trichohyalin, a structural keratin cross-linking protein. TCHH is a member of the “epidermal differentiation complex” located on chromosome 1. Other members of this complex include S100 proteins and other protein components of the cornified envelope [56]. Trichohyalin is one of the “fused” proteins, showing characteristics of calcium binding and signaling, similar to S100 proteins, and keratin cross-linking proteins [57]. Increased differential expression of trichohyalin in afatinib and dacomitinib sensitive cells may reflect greater squamous differentiation and a more “basal” phenotype [58].
The RAS Signaling Pathway was found to be statistically enriched with eight genes expressed at significantly higher levels in dacomitinib sensitive cell lines (Fig. 4). Increased expression of fibroblast growth factor receptor 3 (FGFR3) is common in bladder cancer, and FGFR3 fusions have also been reported [12]. Interestingly, of the cell lines with FGFR3 fusions, SW780 is moderately sensitive to dacomitinib and RT4 is resistant [59]. The fusions are different in the two cell lines: RT4 harbors an FGFR3-TACC fusion, while SW780 has an FGFR3-BAIAP2L1 fusion. The different responses to dacomitinib may reflect functional differences in the two fusions but also suggests that FGFR3 fusion does not play a major role in sensitivity to dacomitinib. FGF19 is one of several FGFR3 ligands [60]. Activation of FGFR3 results in signaling through RAS, which is regulated by RAS A4 [61]. Increased expression of RAS A4 may be an attempt by cells to compensate for RAS and/or FGFR3 hyperactivity. The downstream result that is observed in the dacomitinib sensitive cells is expression of several members of the calcium independent phospholipase A2 family (iPLA2). These enzymes contribute to cell proliferation and metastasis through generation of bioactive lipids such as HETE and prostaglandins [62–64].
Fig.4
DESeq analysis revealed RAS pathway involvement. The diagram is courtesy of the Kyoto Encyclopedia of Genes and Genomes (KEGG) [52, 73, 74]. Cell lines sensitive to dacomitinib have a higher expression of several RAS signaling pathway components. FDR adjusted p-value = 0.005 using Fisher’s exact test. All genes highlighted in red were differentially expressed with fold change ≥2 and FDR qValue ≤0.05.
![DESeq analysis revealed RAS pathway involvement. The diagram is courtesy of the Kyoto Encyclopedia of Genes and Genomes (KEGG) [52, 73, 74]. Cell lines sensitive to dacomitinib have a higher expression of several RAS signaling pathway components. FDR adjusted p-value = 0.005 using Fisher’s exact test. All genes highlighted in red were differentially expressed with fold change ≥2 and FDR qValue ≤0.05.](https://content.iospress.com:443/media/blc/2018/4-1/blc-4-1-blc170144/blc-4-blc170144-g004.jpg)
DISCUSSION
In this study, we explored responses to two second-generation irreversible HER-family targeting TKIs, afatinib and dacomitinib using a subset of the bladder cancer cell line panels. In spite of the structural similarities of the two drugs, and their emergence from similar drug screening, the responses to the two drugs were distinctly different. Further, the expression profiles of responsive cells to the two drugs showed nearly no overlap, with only two genes in common.
Sensitivity to afatinib was observed in two cell lines, both of which harbor mutations affecting the extracellular domain of either HER2 or HER3. These results are consistent with a recent bladder cancer clinical trial with afatinib [29]. However, one cell line, UC3, with a HER3 mutation was highly resistant to afatinib, presenting an important caveat to the selection of bladder cancer patients solely with tumoral HER2 or HER3 mutations for afatinib treatment. The UC3 cell line has several unusual properties. UC3 harbors a K-ras mutation [59] which is not common in muscle-invasive bladder cancers [12]. UC3 has been shown to have a mesenchymal phenotype [65], and has previously demonstrated resistance to both IMC-CC225 antibody treatment (cetuximab) and dacomitinib [28, 66]. Finally, the HER3 mutation in the resistant UC3 line is different from the HER3 mutation in the sensitive UC15 cell line, which may reflect functional differences in the mutations. Whether these factors or others contribute to afatinib resistances will be the subject of future studies. Additionally, the afatinib clinical trial also identified two responsive patients who lacked HER3 mutations but had amplification of HER2 or EGFR in their tumors [29]. Our study did not replicate that finding, as UC5 bladder cancer cells, with amplified EGFR, and other cell lines with low gain of EGFR, failed to respond to afatinib.
Sensitivity to dacomitinib was not clearly linked to any one cellular factor. A non-statistically significant trend towards higher EGFR protein expression was detected, but several non-responding cells also had higher EGFR levels. UC3 was one of these resistant cell lines with higher EGFR levels, but this resistance may be due to the KRAS mutation it harbors [55]. The UC1 cell line, despite high EGFR, showed only a moderate response to dacomitinib. Additionally, two of the sensitive cell lines, 5637 and UC13, had very modest EGFR protein levels. While EGFR protein may contribute to dacomitinib responses, other processes are clearly influential. The emergence of the RAS family signaling pathway in the RNA-Seq evaluation may have revealed additional contributors. RAS family proteins directly regulate key cellular processes that include growth, migration, senescence and cell death [67]. RAS family signaling has previously been implicated in bladder cancer tumors [12, 68]. One study reported that 39% of their muscle-invasive bladder cancer samples had alterations in the RAS pathway, with mutation or amplification in FGFR3, HER2, EGFR and HER3 being most common [12]. However, one of the dacomitinib resistant cell lines, RT4, is known to have the FGFR3-TACC3 gene fusion that results in constitutively active FGFR3 [59]. A second cell line, SW780, which showed moderate resistance to dacomitinib, has a different FGFR3 fusion [59]. Those responses suggest that the activity in the RAS pathway is probably not solely at the FGFR3 receptor. Additional studies are needed to detail the role of this pathway in response to dacomitinib treatment.
The observed difference in response to afatinib and dacomitinib suggests that combination treatment might be useful. However, a more fruitful approach may be to target HER heterodimerization which is a hypothetical mechanism of resistance to HER therapies. HER family members will form heterodimers not only with other members of the family, but also with other receptors, including cMET, PDGFR, and IGF1R [17, 69, 70]. This receptor promiscuity adds another level of complexity to therapeutic targeting. Targeting several of these “rogue” dimerization partners in the therapeutic mix may be a promising approach.
New reports suggest that EGFR activation may also induce immune suppression through PDL-1 or PD-1 [71, 72]. Since recent clinical results show an excellent response in a subset of bladder cancer patients to PDL-1 or PD-1 inhibitors [3], sequential treatment with HER family targeting might be another therapeutic strategy.
In summary, our data show that two irreversible HER family TKI agents with similar structures have distinctly different efficacies in a panel of bladder cancer cell lines. While our afatinib results are consistent with the results of a clinical trial [29], our data indicate that patient selection for afatinib treatment based only on over-expression or mutation of HER family members may not guarantee therapeutic responsiveness. Our results indicate that several groups of patients may benefit from treatment with dacomitinib, including those with tumoral HER2 or HER3 mutation or amplification of EGFR, along with other factors, possibly included in the RAS pathway. Additional studies with combination treatments will assist in determining the optimal pathways for future treatments.
CONFLICT OF INTEREST
The authors have no conflict of interest to report.
ACKNOWLEDGMENTS
This research is supported in part by the University of Michigan Cancer Center Genitourinary Program and Core Support Grant (P30 CA46592) and bladder research funds from generous donors to the University of the Michigan Urology Department; UL1TR000433 (G.L.H.) Michigan Institute for Clinical and Health Research, TRI, NIH; K08 CA201335-01A1, NCI, NIH (P.L.P.); generous gifts from the MacLeod family and the Teeter family to S.A.T. S.A.T. is supported by the A. Alfred Taubman Medical Research Institute.
SUPPLEMENTARY MATERIAL
[1] The supplementary material is available in the electronic version of this article: http://dx.doi.org/10.3233/BLC-170144.
REFERENCES
[1] | Siegel RL , Miller KD , Jemal A . Cancer Statistics, 2017. CA Cancer J Clin (2017) ;67: (1):7–30. |
[2] | Abdollah F , Gandaglia G , Thuret R , Schmitges J , Tian Z , Jeldres C , Passoni NM , Briganti A , Shariat SF , Perrotte P , Montorsi F , Karakiewicz PI , Sun M . Incidence, survival and mortality rates of stage-specific bladder cancer in United States: A trend analysis. Cancer Epidemiol (2013) ;37: (3):219–25. |
[3] | Bellmunt J , Powles T , Vogelzang NJ . A review on the evolution of PD-1/PD-L1 immunotherapy for bladder cancer: The future is now. Cancer Treat Rev (2017) ;54: :58–67. |
[4] | Schmidt KT , Chau CH , Price DK , Figg WD . Precision oncology medicine: The clinical relevance of patient-specific biomarkersused to optimize cancer treatment. J Clin Pharmacol (2016) ;56: (12):1484–99. |
[5] | Schlessinger J . Cell signaling by receptor tyrosine kinases. Cell (2000) ;103: (2):211–25. |
[6] | Rowinsky EK . The erbB family: Targets for therapeutic development against cancer and therapeutic strategies using monoclonal antibodies and tyrosine kinase inhibitors. Annu Rev Med (2004) ;55: :433–57. |
[7] | Daly RJ . Take your partners, please–signal diversification by the erbB family of receptor tyrosine kinases. Growth Factors (1999) ;16: (4):255–63. |
[8] | Mellon K , Wright C , Kelly P , Horne CH , Neal DE . Long-term outcome related to epidermal growth factor receptor status in bladder cancer. J Urol (1995) ;153: (3 Pt 2):919–25. |
[9] | Lonn U , Lonn S , Friberg S , Nilsson B , Silfversward C , Stenkvist B . Prognostic value of amplification of c-erb-B2 in bladder carcinoma. Clin Cancer Res (1995) ;1: (10):1189–94. |
[10] | Sato K , Moriyama M , Mori S , Saito M , Watanuki T , Terada K , Okuhara E , Akiyama T , Toyoshima K , Yamamoto T , et al. An immunohistologic evaluation of C-erbB-2 gene product in patients with urinary bladder carcinoma. Cancer (1992) ;70: (10):2493–8. |
[11] | Kolla SB , Seth A , Singh MK , Gupta NP , Hemal AK , Dogra PN , Kumar R . Prognostic significance of Her2/neu overexpression in patients with muscle invasive urinary bladder cancer treated with radical cystectomy. Int Urol Nephrol (2008) ;40: (2):321–7. |
[12] | Cancer Genome Atlas Research N. Comprehensive molecular characterization of urothelial bladder carcinoma. Nature (2014) ;507: (7492):315–22. |
[13] | Ross JS , Wang K , Gay LM , Al-Rohil RN , Nazeer T , Sheehan CE , Jennings TA , Otto GA , Donahue A , He J , Palmer G , Ali S , Nahas M , Young G , Labrecque E , Frampton G , Erlich R , Curran JA , Brennan K , Downing SR , Yelensky R , Lipson D , Hawryluk M , Miller VA , Stephens PJ . A high frequency of activating extracellular domain ERBB2 (HER2) mutation in micropapillary urothelial carcinoma. Clin Cancer Res (2014) ;20: (1):68–75. |
[14] | Hussain M , Daignault S , Agarwal N , Grivas PD , Siefker-Radtke AO , Puzanov I , MacVicar GR , Levine EG , Srinivas S , Twardowski P , Eisenberger MA , Quinn DI , Vaishampayan UN , Yu EY , Dawsey S , Day KC , Day ML , Al-Hawary M , Smith DC . A randomized phase 2 trial of gemcitabine/cisplatin with or without cetuximab in patients with advanced urothelial carcinoma. Cancer (2014) ;120: (17):2684–93. |
[15] | Hussain MH , MacVicar GR , Petrylak DP , Dunn RL , Vaishampayan U , Lara PN Jr , Chatta GS , Nanus DM , Glode LM , Trump DL , Chen H , Smith DC , National Cancer I. Trastuzumab, paclitaxel, carboplatin, and gemcitabine in advanced human epidermal growth factor receptor-2/neu-positive urothelial carcinoma: Results of a multicenter phase II National Cancer Institute trial. J Clin Oncol (2007) ;25: (16):2218–24. |
[16] | Grivas PD , Day M , Hussain M . Urothelial carcinomas: A focus on human epidermal receptors signaling. Am J Transl Res (2011) ;3: (4):362–73. |
[17] | Black PC , Brown GA , Dinney CP , Kassouf W , Inamoto T , Arora A , Gallagher D , Munsell MF , Bar-Eli M , McConkey DJ , Adam L . Receptor heterodimerization: A new mechanism for platelet-derived growth factor induced resistance to anti-epidermal growth factor receptor therapy for bladder cancer. J Urol (2011) ;185: (2):693–700. |
[18] | RoskoskiR Jr. ErbB/HER protein-tyrosine kinases: Structures and small molecule inhibitors. Pharmacol Res (2014) ;87: :42–59. |
[19] | Li J , Lin B , Li X , Tang X , He Z , Zhou K . Biomarkers for predicting response to tyrosine kinase inhibitors in drug-sensitive and drug-resistant human bladder cancer cells. Oncol Rep (2015) ;33: (2):951–7. |
[20] | Wulfing C , Machiels JP , Richel DJ , Grimm MO , Treiber U , De Groot MR , Beuzeboc P , Parikh R , Petavy F , El-Hariry IA . A single-arm, multicenter, open-label phase 2 study of lapatinib as the second-line treatment of patients with locally advanced or metastatic transitional cell carcinoma. Cancer (2009) ;115: (13):2881–90. |
[21] | Powles T , Huddart RA , Elliott T , Sarker SJ , Ackerman C , Jones R , Hussain S , Crabb S , Jagdev S , Chester J , Hilman S , Beresford M , Macdonald G , Santhanam S , Frew JA , Stockdale A , Hughes S , Berney D , Chowdhury S . Phase III, double-blind, randomized trial that compared maintenance lapatinib versus placebo after first-line chemotherapy in patients with human epidermal growth factor receptor 1/2-positive metastatic bladder cancer. J Clin Oncol (2017) ;35: (1):48–55. |
[22] | Sequist LV , Yang JC , Yamamoto N , O’Byrne K , Hirsh V , Mok T , Geater SL , Orlov S , Tsai CM , Boyer M , Su WC , Bennouna J , Kato T , Gorbunova V , Lee KH , Shah R , Massey D , Zazulina V , Shahidi M , Schuler M . Phase III study of afatinib or cisplatin plus pemetrexed in patients with metastatic lung adenocarcinoma with EGFR mutations. J Clin Oncol (2013) ;31: (27):3327–34. |
[23] | Greenall SA , Donoghue JF , Gottardo NG , Johns TG , Adams TE . Glioma-specific Domain IV EGFR cysteine mutations promote ligand-induced covalent receptor dimerization and display enhanced sensitivity to dacomitinib in vivo. Oncogene (2015) ;34: (13):1658–66. |
[24] | Modjtahedi H , Cho BC , Michel MC , Solca F . A comprehensive review of the preclinical efficacy profile of the ErbB family blocker afatinib in cancer. Naunyn Schmiedebergs Arch Pharmacol (2014) ;387: (6):505–21. |
[25] | Ross JS , Wang K , Khaira D , Ali SM , Fisher HA , Mian B , Nazeer T , Elvin JA , Palma N , Yelensky R , Lipson D , Miller VA , Stephens PJ , Subbiah V , Pal SK . Comprehensive genomic profiling of 295 cases of clinically advanced urothelial carcinoma of the urinary bladder reveals a high frequency of clinically relevant genomic alterations. Cancer (2016) ;122: (5):702–11. |
[26] | Solca F , Dahl G , Zoephel A , Bader G , Sanderson M , Klein C , Kraemer O , Himmelsbach F , Haaksma E , Adolf GR . Target binding properties and cellular activity of afatinib (BIBW 2992), an irreversible ErbB family blocker. J Pharmacol Exp Ther (2012) ;343: (2):342–50. |
[27] | Gajiwala KS , Feng J , Ferre R , Ryan K , Brodsky O , Weinrich S , Kath JC , Stewart A . Insights into the aberrant activity of mutant EGFR kinase domain and drug recognition. Structure (2013) ;21: (2):209–19. |
[28] | Grivas PD , Day KC , Karatsinides A , Paul A , Shakir N , Owainati I , Liebert M , Kunju LP , Thomas D , Hussain M , Day ML . Evaluation ofthe antitumor activity of dacomitinib in models of human bladder cancer. Mol Med (2013) ;19: :367–76. |
[29] | Choudhury NJ , Campanile A , Antic T , Yap KL , Fitzpatrick CA , Wade JL 3rd , Karrison T , Stadler WM , Nakamura Y , O’Donnell PH . Afatinib activity in platinum-refractory metastatic urothelial carcinoma in patients with ERBB alterations. J Clin Oncol (2016) ;34: (18):2165–71. |
[30] | Mosmann T . Rapid colorimetric assay for cellular growth and survival: Application to proliferation and cytotoxicity assays. J Immunol Methods (1983) ;65: (1-2):55–63. |
[31] | Gauduchon J , Gouilleux F , Maillard S , Marsaud V , Renoir JM , Sola B . 4-Hydroxytamoxifen inhibits proliferation of multiple myeloma cells in vitro through down-regulation of c-Myc, up-regulation of p27Kip1, and modulation of Bcl-2 family members. Clin Cancer Res (2005) ;11: (6):2345–54. |
[32] | R Core Team. R: A Language and Environment for Statistical Computing. Vienna, Austria: R Foundation for Statistical Computing; 2017. |
[33] | Zhang L , Duan CJ , Binkley C , Li G , Uhler MD , Logsdon CD , Simeone DM . A transforming growth factor beta-induced Smad3/Smad4 complex directly activates protein kinase A. Mol Cell Biol (2004) ;24: (5):2169–80. |
[34] | Hovelson DH , McDaniel AS , Cani AK , Johnson B , Rhodes K , Williams PD , Bandla S , Bien G , Choppa P , Hyland F , Gottimukkala R , Liu G , Manivannan M , Schageman J , Ballesteros-Villagrana E , Grasso CS , Quist MJ , Yadati V , Amin A , Siddiqui J , Betz BL , Knudsen KE , Cooney KA , Feng FY , Roh MH , Nelson PS , Liu CJ , Beer DG , Wyngaard P , Chinnaiyan AM , Sadis S , Rhodes DR , Tomlins SA . Development and validation of a scalable next-generation sequencing system for assessing relevant somatic variants in solid tumors. Neoplasia (2015) ;17: (4):385–99. |
[35] | Dayem Ullah AZ , Lemoine NR , Chelala C . A practical guide for the functional annotation of genetic variations using SNPnexus. Brief Bioinform (2013) ;14: (4):437–47. |
[36] | Yates A , Akanni W , Amode MR , Barrell D , Billis K , Carvalho-Silva D , Cummins C , Clapham P , Fitzgerald S , Gil L , Giron CG , Gordon L , Hourlier T , Hunt SE , Janacek SH , Johnson N , Juettemann T , Keenan S , Lavidas I , Martin FJ , Maurel T , McLaren W , Murphy DN , Nag R , Nuhn M , Parker A , Patricio M , Pignatelli M , Rahtz M , Riat HS , Sheppard D , Taylor K , Thormann A , Vullo A , Wilder SP , Zadissa A , Birney E , Harrow J , Muffato M , Perry E , Ruffier M , Spudich G , Trevanion SJ , Cunningham F , Aken BL , Zerbino DR , Flicek P . Ensembl 2016. Nucleic Acids Res (2016) ;44: (D1):D710–6. |
[37] | Kent WJ , Sugnet CW , Furey TS , Roskin KM , Pringle TH , Zahler AM , Haussler D . The human genome browser at UCSC. Genome Res (2002) ;12: (6):996–1006. |
[38] | O’Leary NA , Wright MW , Brister JR , Ciufo S , Haddad D , McVeigh R , Rajput B , Robbertse B , Smith-White B , Ako-Adjei D , Astashyn A , Badretdin A , Bao Y , Blinkova O , Brover V , Chetvernin V , Choi J , Cox E , Ermolaeva O , Farrell CM , Goldfarb T , Gupta T , Haft D , Hatcher E , Hlavina W , Joardar VS , Kodali VK , Li W , Maglott D , Masterson P , McGarvey KM , Murphy MR , O’Neill K , Pujar S , Rangwala SH , Rausch D , Riddick LD , Schoch C , Shkeda A , Storz SS , Sun H , Thibaud-Nissen F , Tolstoy I , Tully RE , Vatsan AR , Wallin C , Webb D , Wu W , Landrum MJ , Kimchi A , Tatusova T , DiCuccio M , Kitts P , Murphy TD , Pruitt KD . Reference sequence (RefSeq) database at NCBI: Current status, taxonomic expansion, and functional annotation. Nucleic Acids Res (2016) ;44: (D1):D733–45. |
[39] | Grasso C , Butler T , Rhodes K , Quist M , Neff TL , Moore S , Tomlins SA , Reinig E , Beadling C , Andersen M , Corless CL . Assessing copy number alterations in targeted, amplicon-based next-generation sequencing data. J Mol Diagn (2015) ;17: (1):53–63. |
[40] | Cani AK , Hovelson DH , McDaniel AS , Sadis S , Haller MJ , Yadati V , Amin AM , Bratley J , Bandla S , Williams PD , Rhodes K , Liu CJ , Quist MJ , Rhodes DR , Grasso CS , Kleer CG , Tomlins SA . Next-gen sequencing exposes frequent MED12 mutations and actionable therapeutic targets in phyllodes tumors. Mol Cancer Res (2015) ;13: (4):613–9. |
[41] | Warrick JI , Hovelson DH , Amin A , Liu CJ , Cani AK , McDaniel AS , Yadati V , Quist MJ , Weizer AZ , Brenner JC , Feng FY , Mehra R , Grasso CS , Tomlins SA . Tumor evolution and progression in multifocal and paired non-invasive/invasive urothelial carcinoma. Virchows Arch (2015) ;466: (3):297–311. |
[42] | Bolger AM , Lohse M , Usadel B . Trimmomatic: A flexible trimmer for Illumina sequence data. Bioinformatics (2014) ;30: (15):2114–20. |
[43] | Dobin A , Davis CA , Schlesinger F , Drenkow J , Zaleski C , Jha S , Batut P , Chaisson M , Gingeras TR . STAR: Ultrafast universal RNA-seq aligner. Bioinformatics (2013) ;29: (1):15–21. |
[44] | Trapnell C , Williams BA , Pertea G , Mortazavi A , Kwan G , van Baren MJ , Salzberg SL , Wold BJ , Pachter L . Transcript assembly and quantification by RNA-Seq reveals unannotated transcripts and isoform switching during cell differentiation. Nat Biotechnol (2010) ;28: (5):511–5. |
[45] | Dillies MA , Rau A , Aubert J , Hennequet-Antier C , Jeanmougin M , Servant N , Keime C , Marot G , Castel D , Estelle J , Guernec G , Jagla B , Jouneau L , Laloe D , Le Gall C , Schaeffer B , Le Crom S , Guedj M , Jaffrezic F , French StatOmique C. A comprehensive evaluation of normalization methods for Illumina high-throughput RNA sequencing data analysis. Brief Bioinform (2013) ;14: (6):671–83. |
[46] | Trapnell C , Roberts A , Goff L , Pertea G , Kim D , Kelley DR , Pimentel H , Salzberg SL , Rinn JL , Pachter L . Differential gene and transcript expression analysis of RNA-seq experiments with TopHat and Cufflinks. Nat Protoc (2012) ;7: (3):562–78. |
[47] | Liao Y , Smyth GK , Shi W . featureCounts: An efficient general purpose program for assigning sequence reads to genomic features. Bioinformatics (2014) ;30: (7):923–30. |
[48] | Love MI , Huber W , Anders S . Moderated estimation of fold change and dispersion for RNA-seq data with DESeq2. Genome Biol (2014) ;15: (12):550. |
[49] | Ashburner M , Ball CA , Blake JA , Botstein D , Butler H , Cherry JM , Davis AP , Dolinski K , Dwight SS , Eppig JT , Harris MA , Hill DP , Issel-Tarver L , Kasarskis A , Lewis S , Matese JC , Richardson JE , Ringwald M , Rubin GM , Sherlock G . Gene ontology: Tool for theunification of biology. The Gene Ontology Consortium. Nat Genet (2000) ;25: (1):25–9. |
[50] | Gene Ontology C. Gene Ontology Consortium: Going forward. NucleicAcids Res (2015) ;43: (Database issue):D1049–56. |
[51] | Carlson M ((2016) ). GO.db: A set of annotation maps describing the entire Gene Ontology. R package version 3.4.0. |
[52] | Kanehisa M , Sato Y , Kawashima M , Furumichi M , Tanabe M . KEGG as a reference resource for gene and protein annotation. Nucleic Acids Res (2016) ;44: (D1):D457–62. |
[53] | Bose R , Kavuri SM , Searleman AC , Shen W , Shen D , Koboldt DC , Monsey J , Goel N , Aronson AB , Li S , Ma CX , Ding L , Mardis ER , Ellis MJ . Activating HER2 mutations in HER2 gene amplification negative breast cancer. Cancer Discov (2013) ;3: (2):224–37. |
[54] | Jaiswal BS , Kljavin NM , Stawiski EW , Chan E , Parikh C , Durinck S , Chaudhuri S , Pujara K , Guillory J , Edgar KA , Janakiraman V , Scholz RP , Bowman KK , Lorenzo M , Li H , Wu J , Yuan W , Peters BA , Kan Z , Stinson J , Mak M , Modrusan Z , Eigenbrot C , Firestein R , Stern HM , Rajalingam K , Schaefer G , Merchant MA , Sliwkowski MX , de Sauvage FJ , Seshagiri S . Oncogenic ERBB3 mutations in human cancers. Cancer Cell (2013) ;23: (5):603–17. |
[55] | Raponi M , Winkler H , Dracopoli NC . KRAS mutations predict response to EGFR inhibitors. Curr Opin Pharmacol (2008) ;8: (4):413–8. |
[56] | Mischke D , Korge BP , Marenholz I , Volz A , Ziegler A . Genes encoding structural proteins of epidermal cornification and S100 calcium-binding proteins form a gene complex (“epidermal differentiation complex”) on human chromosome 1q21. J Invest Dermatol (1996) ;106: (5):989–92. |
[57] | Lee SC , Wang M , McBride OW , O’Keefe EJ , Kim IG , Steinert PM . Human trichohyalin gene is clustered with the genes for other epidermal structural proteins and calcium-binding proteins at chromosomal locus 1q21. J Invest Dermatol (1993) ;100: (1):65–8. |
[58] | Choi W , Porten S , Kim S , Willis D , Plimack ER , Hoffman-Censits J , Roth B , Cheng T , Tran M , Lee IL , Melquist J , Bondaruk J , Majewski T , Zhang S , Pretzsch S , Baggerly K , Siefker-Radtke A , Czerniak B , Dinney CP , McConkey DJ . Identification of distinct basal and luminal subtypes of muscle-invasive bladder cancer with different sensitivities to frontline chemotherapy. Cancer Cell (2014) ;25: (2):152–65. |
[59] | Earl J , Rico D , Carrillo-de-Santa-Pau E , Rodriguez-Santiago B , Mendez-Pertuz M , Auer H , Gomez G , Grossman HB , Pisano DG , Schulz WA , Perez-Jurado LA , Carrato A , Theodorescu D , Chanock S , Valencia A , Real FX . The UBC-40 Urothelial Bladder Cancer cell line index: A genomic resource for functional studies. BMC Genomics (2015) ;16: :403. |
[60] | Parish A , Schwaederle M , Daniels G , Piccioni D , Fanta P , Schwab R , Shimabukuro K , Parker BA , Helsten T , Kurzrock R . Fibroblast growth factor family aberrations in cancers: Clinical and molecular characteristics. Cell Cycle (2015) ;14: (13):2121–8. |
[61] | Dai Y , Walker SA , de Vet E , Cook S , Welch HC , Lockyer PJ . Ca2+-dependent monomer and dimer formation switches CAPRI Protein between Ras GTPase-activating protein (GAP) and RapGAP activities. J Biol Chem (2011) ;286: (22):19905–16. |
[62] | Ramanadham S , Ali T , Ashley JW , Bone RN , Hancock WD , Lei X . Calcium-independent phospholipases A2 and their roles in biological processes and diseases. J Lipid Res (2015) ;56: (9):1643–68. |
[63] | Scott KF , Sajinovic M , Hein J , Nixdorf S , Galettis P , Liauw W , de Souza P , Dong Q , Graham GG , Russell PJ . Emerging roles for phospholipase A2 enzymes in cancer. Biochimie (2010) ;92: (6):601–10. |
[64] | Cummings BS . Phospholipase A2 as targets for anti-cancer drugs. Biochem Pharmacol (2007) ;74: (7):949–59. |
[65] | Adam L , Zhong M , Choi W , Qi W , Nicoloso M , Arora A , Calin G , Wang H , Siefker-Radtke A , McConkey D , Bar-Eli M , Dinney C . miR-200 expression regulates epithelial-to-mesenchymal transition in bladder cancer cells and reverses resistance to epidermal growth factor receptor therapy. Clin Cancer Res (2009) ;15: (16):5060–72. |
[66] | Black PC , Brown GA , Inamoto T , Shrader M , Arora A , Siefker-Radtke AO , Adam L , Theodorescu D , Wu X , Munsell MF , Bar-Eli M , McConkey DJ , Dinney CP . Sensitivity to epidermal growth factor receptor inhibitor requires E-cadherin expression in urothelial carcinoma cells. Clin Cancer Res (2008) ;14: (5):1478–86. |
[67] | Fernandez-Medarde A , Santos E . Ras in cancer and developmental diseases. Genes Cancer (2011) ;2: (3):344–58. |
[68] | Oxford G , Theodorescu D . The role of Ras superfamily proteins in bladder cancer progression. J Urol (2003) ;170: (5):1987–93. |
[69] | Husain H , Scur M , Murtuza A , Bui N , Woodward B , Kurzrock R . Strategies to overcome bypass mechanisms mediating clinical resistance to EGFR tyrosine kinase inhibition in lung cancer. Mol Cancer Ther (2017) ;16: (2):265–72. |
[70] | Kjaer I , Lindsted T , Frohlich C , Olsen JV , Horak ID , Kragh M , Pedersen MW . Cetuximab resistance in squamous carcinomas of the upper aerodigestive tract is driven by receptor tyrosine kinase plasticity: Potential for mAb mixtures. Mol Cancer Ther (2016) ;15: (7):1614–26. |
[71] | Varadan V , Gilmore H , Miskimen KL , Tuck D , Parsai S , Awadallah A , Krop IE , Winer EP , Bossuyt V , Somlo G , Abu-Khalaf MM , Fenton MA , Sikov W , Harris LN . Immune signatures following single dose trastuzumab predict pathologic response to preoperativetrastuzumab and chemotherapy in HER2-positive early breast cancer. Clin Cancer Res (2016) ;22: (13):3249–59. |
[72] | Akbay EA , Koyama S , Carretero J , Altabef A , Tchaicha JH , Christensen CL , Mikse OR , Cherniack AD , Beauchamp EM , Pugh TJ , Wilkerson MD , Fecci PE , Butaney M , Reibel JB , Soucheray M , Cohoon TJ , Janne PA , Meyerson M , Hayes DN , Shapiro GI , Shimamura T , Sholl LM , Rodig SJ , Freeman GJ , Hammerman PS , Dranoff G , Wong KK . Activation of the PD-1 pathway contributes to immune escape inEGFR-driven lung tumors. Cancer Discov (2013) ;3: (12):1355–63. |
[73] | Kanehisa M , Goto S . KEGG: Kyoto encyclopedia of genes and genomes. Nucleic Acids Res (2000) ;28: (1):27–30. |
[74] | Kanehisa M , Furumichi M , Tanabe M , Sato Y , Morishima K . KEGG: New perspectives on genomes, pathways, diseases and drugs. Nucleic Acids Res (2017) ;45: (D1):D353–D61. |

