
Reproducibility of Alzheimer’s Disease Cerebrospinal Fluid-Biomarker Measurements under Clinical Routine Conditions
Abstract
Analysis of cerebrospinal fluid (CSF) is one of the key tools for the state-of-the-art differential diagnosis of dementias. Dementia due to Alzheimer’s disease (AD) is characterized by elevated CSF levels of total Tau (tTau) and phospho-181-Tau (pTau) and low CSF amyloid-β42 (Aβ42). Discrepancies in the laboratory analysis of human materials are well known and much effort has been put into harmonization procedures. In this study, we measured CSF biomarkers of more than 100 patients obtained under clinical routine conditions in two different clinical laboratories. The CSF biomarker levels obtained from the two different sites were significantly correlated: R2 = 0.7129 (tTau, p < 0.001), 0.7914 (pTau, p < 0.001), 0.5078 (Aβ42, p < 0.001), 0.5739 (Aβ40, p < 0.001), and 0.4308 (Aβ42/40, p < 0.001). However, the diagnostic classifications of the Aβ42, tTau, and pTau levels of identical subjects into normal versus pathological range made by the two different sites showed substantial discrepancies (31.5%, 29.6%, and 25.0% discordant cases, respectively). Applying Aβ42/40, instead of CSF Aβ42 alone, lead to a reduction of the discordant cases to 16.8%. Our findings suggest that CSF Aβ42/40 can outperform Aβ42 as a biomarker for AD neuropathology, not only under well-controlled study conditions but also in real life clinical routine. Thus, we recommend the inclusion of Aβ42/40 as a CSF biomarker in the diagnostic procedure.
INTRODUCTION
The diagnosis of Alzheimer’s disease (AD) is based on different pillars. In addition to medical history, clinical examination, neuropsychological testing, and imaging methods, analysis of the cerebrospinal fluid (CSF) plays an important role in the biomarker-supported differential dementia diagnosis. According to different international [1] and national guidelines (e.g., German “S3-Leitline Demenz” [2]) for the clinical diagnosis of Alzheimer’s disease as well as the recommendations of the “National Institute on Aging and the Alzheimer’s Association working group” [3], increased CSF levels of total-Tau (tTau) and phospho(181)Tau (pTau), and low CSF Amyloid-β42 (Aβ42) can be considered valid AD biomarkers and have been recommended to support an accurate diagnosis.
A non-invasive way to measure the amyloid burden in the central nervous system (CNS) display nuclear medicine imaging methods for in vivo detection of amyloid plaque density. The 18F-labelled amyloid tracer Florbetaben shows high sensitivity and specificity for the detection of cerebral amyloid plaques in correlation to histopathology [4]. Therefore, amyloid PET imaging might be a valuable addition to common CSF-Aβ diagnosis.
In addition to Aβ42, the analysis of the shorter Aβ-variant Aβ40 seems to be useful. Aβ40 is the most abundant C-terminal Aβ-variant in CSF, followed by Aβ38 and Aβ42 [5]. In CSF, Aβ40 correlates well with the total Aβ concentration [6] and thus can serve as a surrogate-marker for total CSF Aβ. In patients with either unusually low or high overall Aβ, the Aβ42 to Aβ40 concentration ratio (Aβ42/40) can be a helpful tool to normalize the Aβ42 levels to Aβ40 (as a proxy of total Aβ) and thereby improve the diagnostic accuracy [7–9].
CSF Aβ42/40 was reported to correlate more closely with tracer retention on Amyloid-PET imaging than Aβ42 alone [10] and appears to be less prone to variances resulting from pre-analytical sample handling [9]. Furthermore, in our hands, Aβ42/40 turned out to provide higher inter-assay and between lot reproducibility than CSF Aβ42 alone, when assessed with a multiplex chemiluminescence immunoassay (Aβ V-PLEX, Mesoscale) [6].
Several studies and meta-analyses described that the core AD CSF biomarkers tTau, pTau, and Aβ42 provide good differentiation between AD and controls as well as mild cognitive impairment (MCI) due to AD and stable MCI. Consequently, their use in clinical practice and clinical research was clearly recommended by these authors [11–13]. However, it appears that the appraisal regarding the clinical use of these biomarkers, in particular in patients with MCI, is quite controversial: For example, in their 2014 Cochrane review, Ritchie et al. did not recommend CSF Aβ levels as an accurate test of AD pathology in patients with MCI [14, 15]. It is important to note that the published biomarker studies presumably have been performed in general according to highly standardized and well controlled operating procedures and with very carefully selected clinical cohorts. Therefore, it is not obvious to what extent these optimized study conditions reflect the situation in everyday clinical routine in memory clinics or at general practitioners (GPs). Although CSF biomarkers are recommended for clinical research, McKhann et al. did not support the use of CSF biomarkers for routine diagnostics [3].
To address this question, we have compared parallel CSF biomarker measurements and their interpretations executed on a fee for service basis by two different certified clinical laboratories. To this end, parallel aliquots of 114 CSF samples were sent to two independent laboratories for the simultaneous determination and interpretation of t-Tau, p-Tau, Aβ42, and Aβ42/40 according to the respective lab-specific standard operating procedures (SOPs) and cut-off points. The measured biomarker levels and corresponding diagnostic classifications obtained from the two different sites for each one of the 114 subjects were compared and the degree of agreement between the different sites in term of the diagnostic interpretations was assessed. An important question to be addressed was whether Aβ42/40 would show a higher level of agreement between the two sites than Aβ42 alone in term of diagnostic classifications.
A small number of patients from this cohort underwent an additional amyloid-PET diagnostic to measure the central amyloid deposition as a marker of amyloid pathology. We have also compared Aβ42 and Aβ42/40 classifications from both centers with the amyloid-load as measured by amyloid-PET.
MATERIALS AND METHODS
Study design
Over a period of two years (September 2014 until August 2016), parallel aliquots of CSF samples of 114 patients who underwent a lumbar puncture for dementia differential diagnostic reasons were sent to two different, independent, certified clinical laboratories for the parallel determination of tTau, pTau, Aβ42, and Aβ42/40. CSF biomarkers were analyzed according to the respective internal laboratory routine procedures and evaluated with regard to the particular diagnostic cut-off points. Lumbar puncture was performed with ether a “Quincke needle” (BD) or “Sprotte cannula” (Pajunk). CSF was collected in polypropylene CSF tubes (Sarstedt). Importantly, this study was not designed as a Round-Robin study. None of the two clinical laboratories had been informed about the parallel measurements and, consequently, no efforts of any kind for standardization between laboratories were made. We have compared the biomarker data and diagnostic classifications obtained from both different clinical laboratories for each one of the 114 subjects included in this study retrospectively. We chose this kind of study design to reflect clinical everyday conditions. The interpretation of the measured biomarkers was done according to the respective reference values of the two clinical laboratories.
Amyloid-PET
Amyloid PET/CT was performed on a Philips Gemini TF16 PET/CT-scanner (Philips Medical Systems, Cleveland, OH, USA) with a 128×128 matrix with 2 mm slice thickness and acquisition time of 20 min. Low-dose-CT with a 512×512 matrix with 2 mm slice thickness was used for attenuation correction (CTAC-SG algorithm). Reconstruction was performed using the LOR-TF-RAMLA (“BLOB-OS-TF”) algorithm. 300 (±20%) MBq 18F-Florbetaben (Piramal Imaging Ltd, Cambridge, UK) was administered intravenously and PET/CT was performed 90 min post injection. PET/CT data were visually assessed by an experienced nuclear medicine physician who underwent a specific reader training for amyloid imaging. Scans were scored ‘negative’ when the amyloid load was within the physiological range and ‘positive’ when the amyloid load was increased.
Study cohort
114 patients from the Department of Psychiatry and Psychotherapy of the University Medical Center Goettingen were included in this study. All patients underwent lumbar puncture for diagnostic reasons within the diagnostic procedure of dementia. Due to the high impact of CSF biomarkers into the clinical diagnosis, we renounced to include the clinical diagnosis. The mean age of this study cohort was 66.46±10.16 years. In total, 59 men (51.75 %) and 55 women (48.25 %) were included (Table 1).
Table 1
Cohort description
| included patients [number] | 114 |
| Male [n] (%) | 59 (51.75) |
| Female [n] (%) | 55 (48.25) |
| Mean age at CSF diagnosis [y] (SD) | 66.46 (10.16) |
Statistics
All results are presented as mean±SD, unless otherwise indicated. Bland-Altman analysis was performed to evaluate systematic center differences. A Pearson correlation and a two-tailed paired student t-test was calculated to compare the CSF biomarker measurements done on parallel aliquots of the same set of CSF samples by the two different centers. To compare the agreement on interpretation of the results between both centers, the inter-rater reliability was calculated as Cohen’s kappa [16].
Ethical commitment
This study was performed according to the Declaration of Helsinki in the current version. The data-collection and analysis was approved by the ethical committee of the University Medical Center Goettingen (ethical vote 4/1/17).
RESULTS
We compared the results from parallel measurements and diagnostic classifications of the CSF levels of tTau, pTau, Aβ42, and Aβ42/40 obtained from two different certified diagnostic clinical laboratories under everyday clinical conditions. In total, n = 114 subjects were included in this study. Bland-Altman method comparisons suggested systematic center differences regarding Aβ42 and Aβ42/40, but not Aβ40, tTau, and pTau (Fig. 1). This can be explained by the use of different assay kits at the two sites for measuring CSF Aβ42 (IBL versus Fujirebio).
Fig.1
Bland-Altman plots for each biomarker. The mean value of the two biomarker measurements was plotted on the X-axis. On the Y-axis the difference between both centers (center 1 – center 2) was pictured. This presentation facilitates the direct comparison between two different centers. While no systematic differences were observed regarding the measurements for tTau, pTau, and Aβ40, the measured Aβ42 levels and, as a result Aβ42/40, were generally higher in center 1.
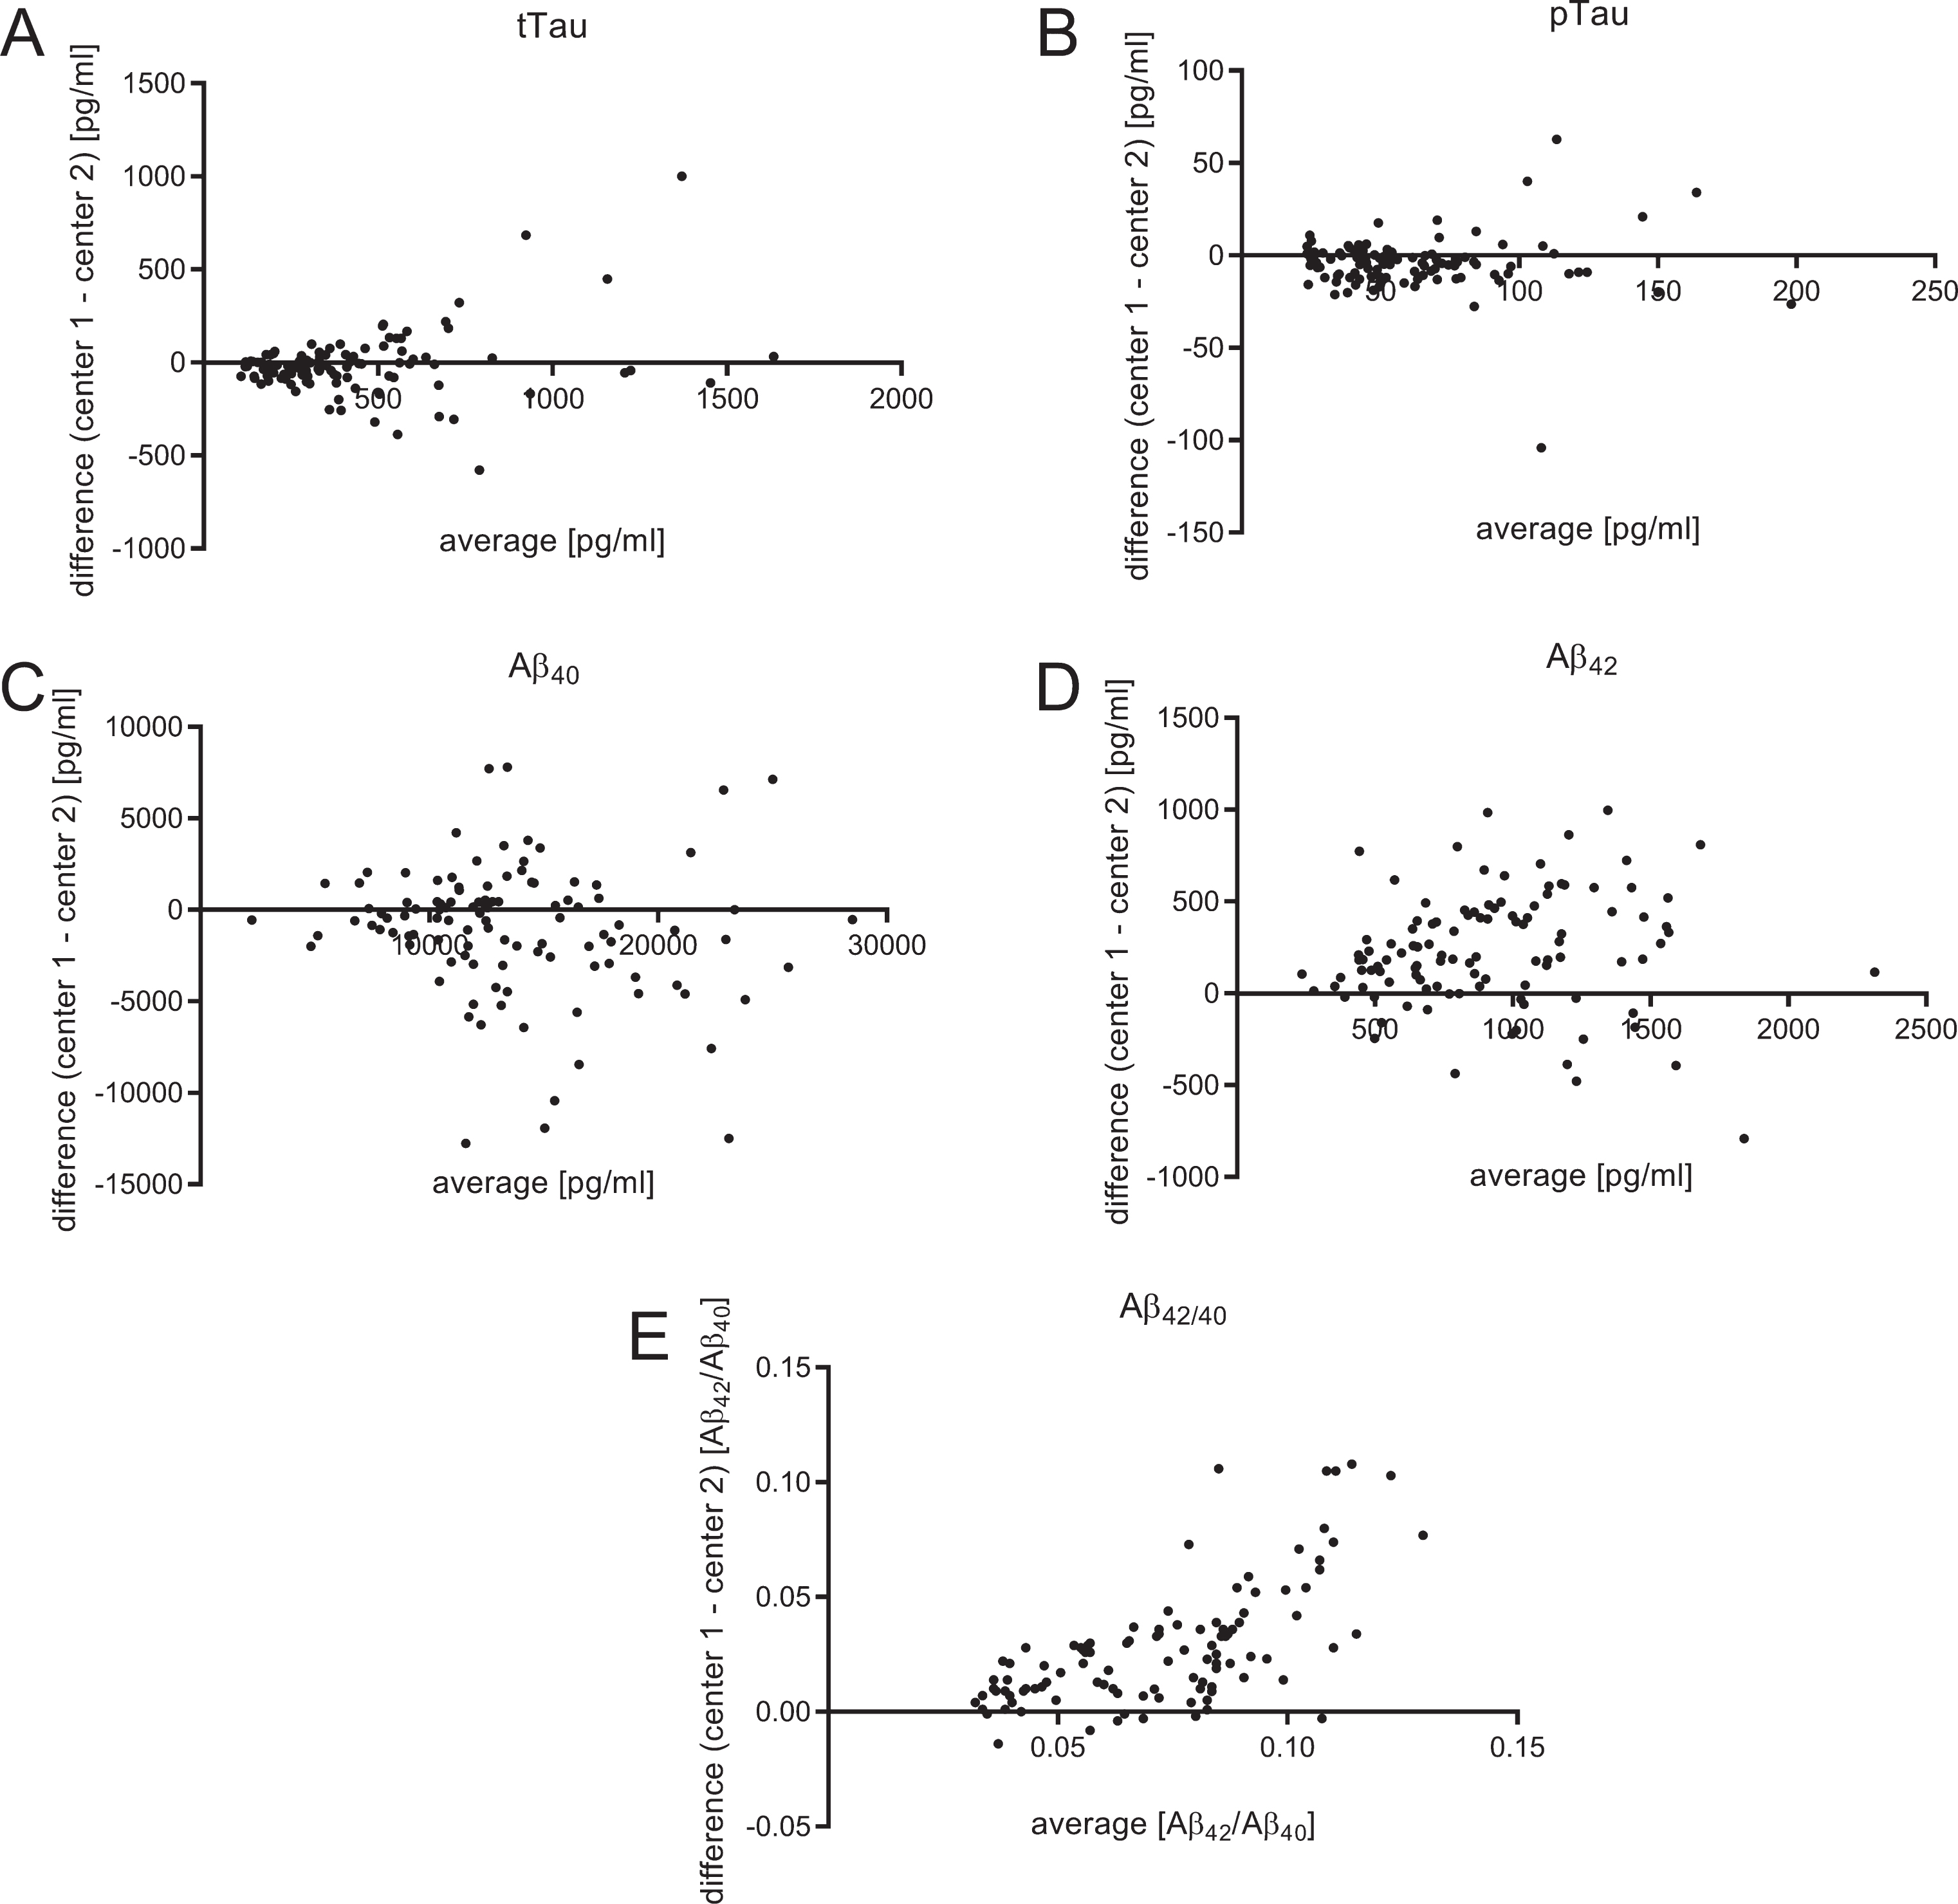
The CSF levels of tTau, pTau, Aβ40, Aβ42, and Aβ42/40 as well as the corresponding cut-off values are summarized in Table 2 and illustrated in Figs. 2 and 3. The mean concentration of CSF Aβ42 was on average 233.4 pg/ml higher in laboratory 1 (1034.0±421.0 pg/ml) compared to laboratory 2 (800.6±398.3 pg/ml) (Fig. 2D). The cut-off point used by laboratory 2 (620 pg/ml) was 170 pg/ml higher than the one used in laboratory 1 (450 pg/ml). Thus, a higher number of pathological Aβ42 samples was found in laboratory 2. For Aβ42/40, identical cut-off points were used (0.05 Aβ42/Aβ40) at the two sites. The mean of the calculated Aβ42/40 ratio was 0.028 higher in laboratory 1 (0.086±0.034 Aβ42/Aβ40) compared to laboratory 2 (0.058±0.018 Aβ42/Aβ40) (Fig. 2E). A substantially higher discrepancy at higher Aβ42/40 (indicating neurochemically healthy subjects) could be seen in the Bland-Altman-Analysis (Fig. 1E).
Table 2
Measured mean values, cut-off points, correlation, inter-rater reliability and discordance rate
| tTau | pTau | Aβ42 | Aβ40 | Aβ42/40 | |||||||
| center 1 | center 2 | center 1 | center 2 | center 1 | center 2 | center 1 | center 2 | center 1 | center 2 | ||
| mean±SD | [pg/ml] | 423.4±328.5 | 433.6±280.3 | 58.96±33.24 | 63.17±32.98 | 1034.0±421.0 | 800.6±398.3 | 13109±4916 | 14128±5386 | 0.086±0.034 | 0.058±0.018 |
| paired t-test | p value | 0.5471 | 0.0059 | <0.0001 | 0.0041 | <0.0001 | |||||
| cut-off | [pg/ml] | 450.0 | 320.0 | 61.00 | 50.00 | 450.0 | 620.0 | – | – | 0.05 | 0.05 |
| correlation | Pearson R2 | 0.7129 | 0.7914 | 0.5078 | 0.5739 | 0.4308 | |||||
| p value | <0.0001 | <0.0001 | <0.0001 | <0.0001 | <0.0001 | ||||||
| Cohen’s kappa | 0.449 | 0.528 | 0.170 | – | 0.589 | ||||||
| discordance | [% ] | 29.6 | 25.0 | 31.5 | – | 16.8 | |||||
Although Aβ42/40 showed the lowest correlation between both centers, Aβ42/40 outperformed the discordance rate and inter-rater reliability, compared to Aβ42, tTau, and pTau.
Fig.2
Measured concentrations of tTau, pTau, Aβ40, and Aβ42 in both centers presented as scatter blots with the corresponding cut-off points. For Aβ42/40, both centers had the same cut-off points (0.05 Aβ42/Aβ40). Interestingly, in center 2, two different subgroups, most likely AD patients and controls, can be seen, which are separated by the cut-off of 0.05 (E). In contrast, no such separations can be seen in center 1. Significant differences are indicated as **p < 0.01 and ***p < 0.001.
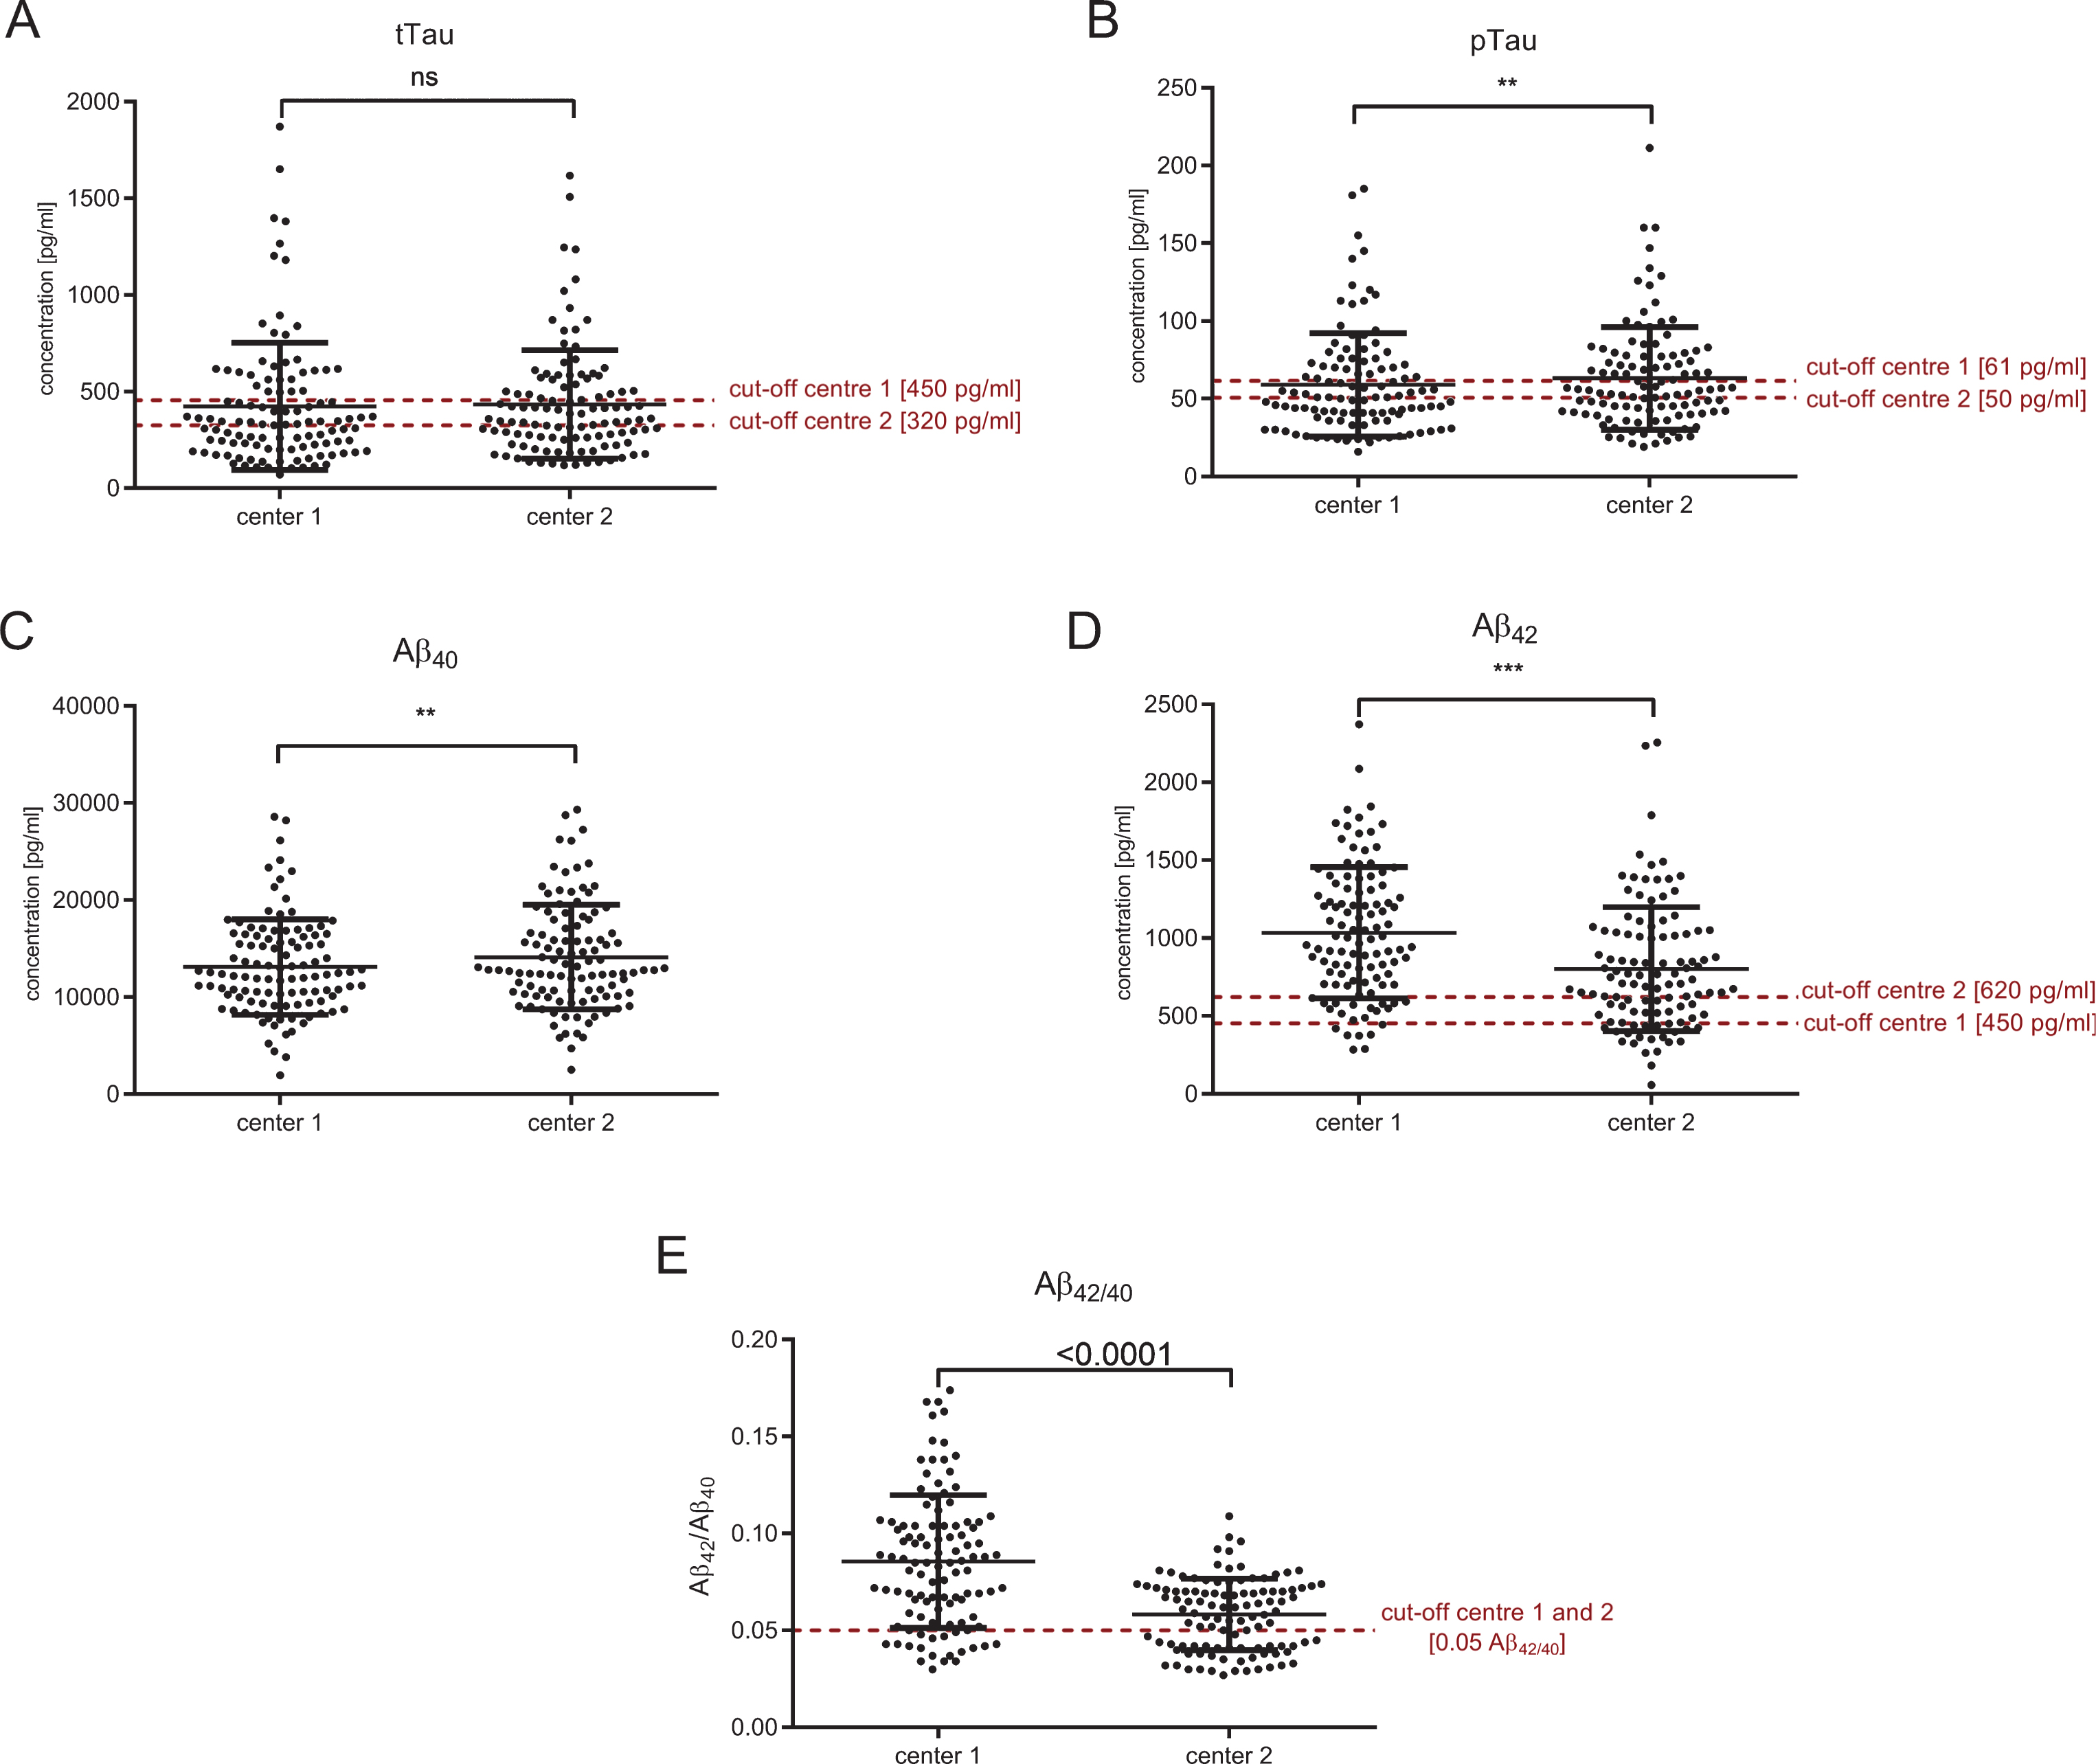
Fig.3
Correlation between CSF-biomarker measurements in the two different centers. Cut-off points of each center are indicated as red horizontal and vertical lines. Patients with discordantly interpreted biomarkers can be found in the upper left square for tTau (A) and pTau (B), whereas for Aβ, discordant biomarkers are mainly in the lower right square (C: Aβ42 and D: Aβ42/40). All biomarkers correlated between both centers: R2 = 0.7129, p < 0.001 (tTau); R2 = 0.7914, p < 0.001 (pTau); R2 = 0.5078, p < 0.001 (Aβ42); R2 = 0.5739, p < 0.001 (Aβ40); R2 = 0.4308, p < 0.001 (Aβ42/40).
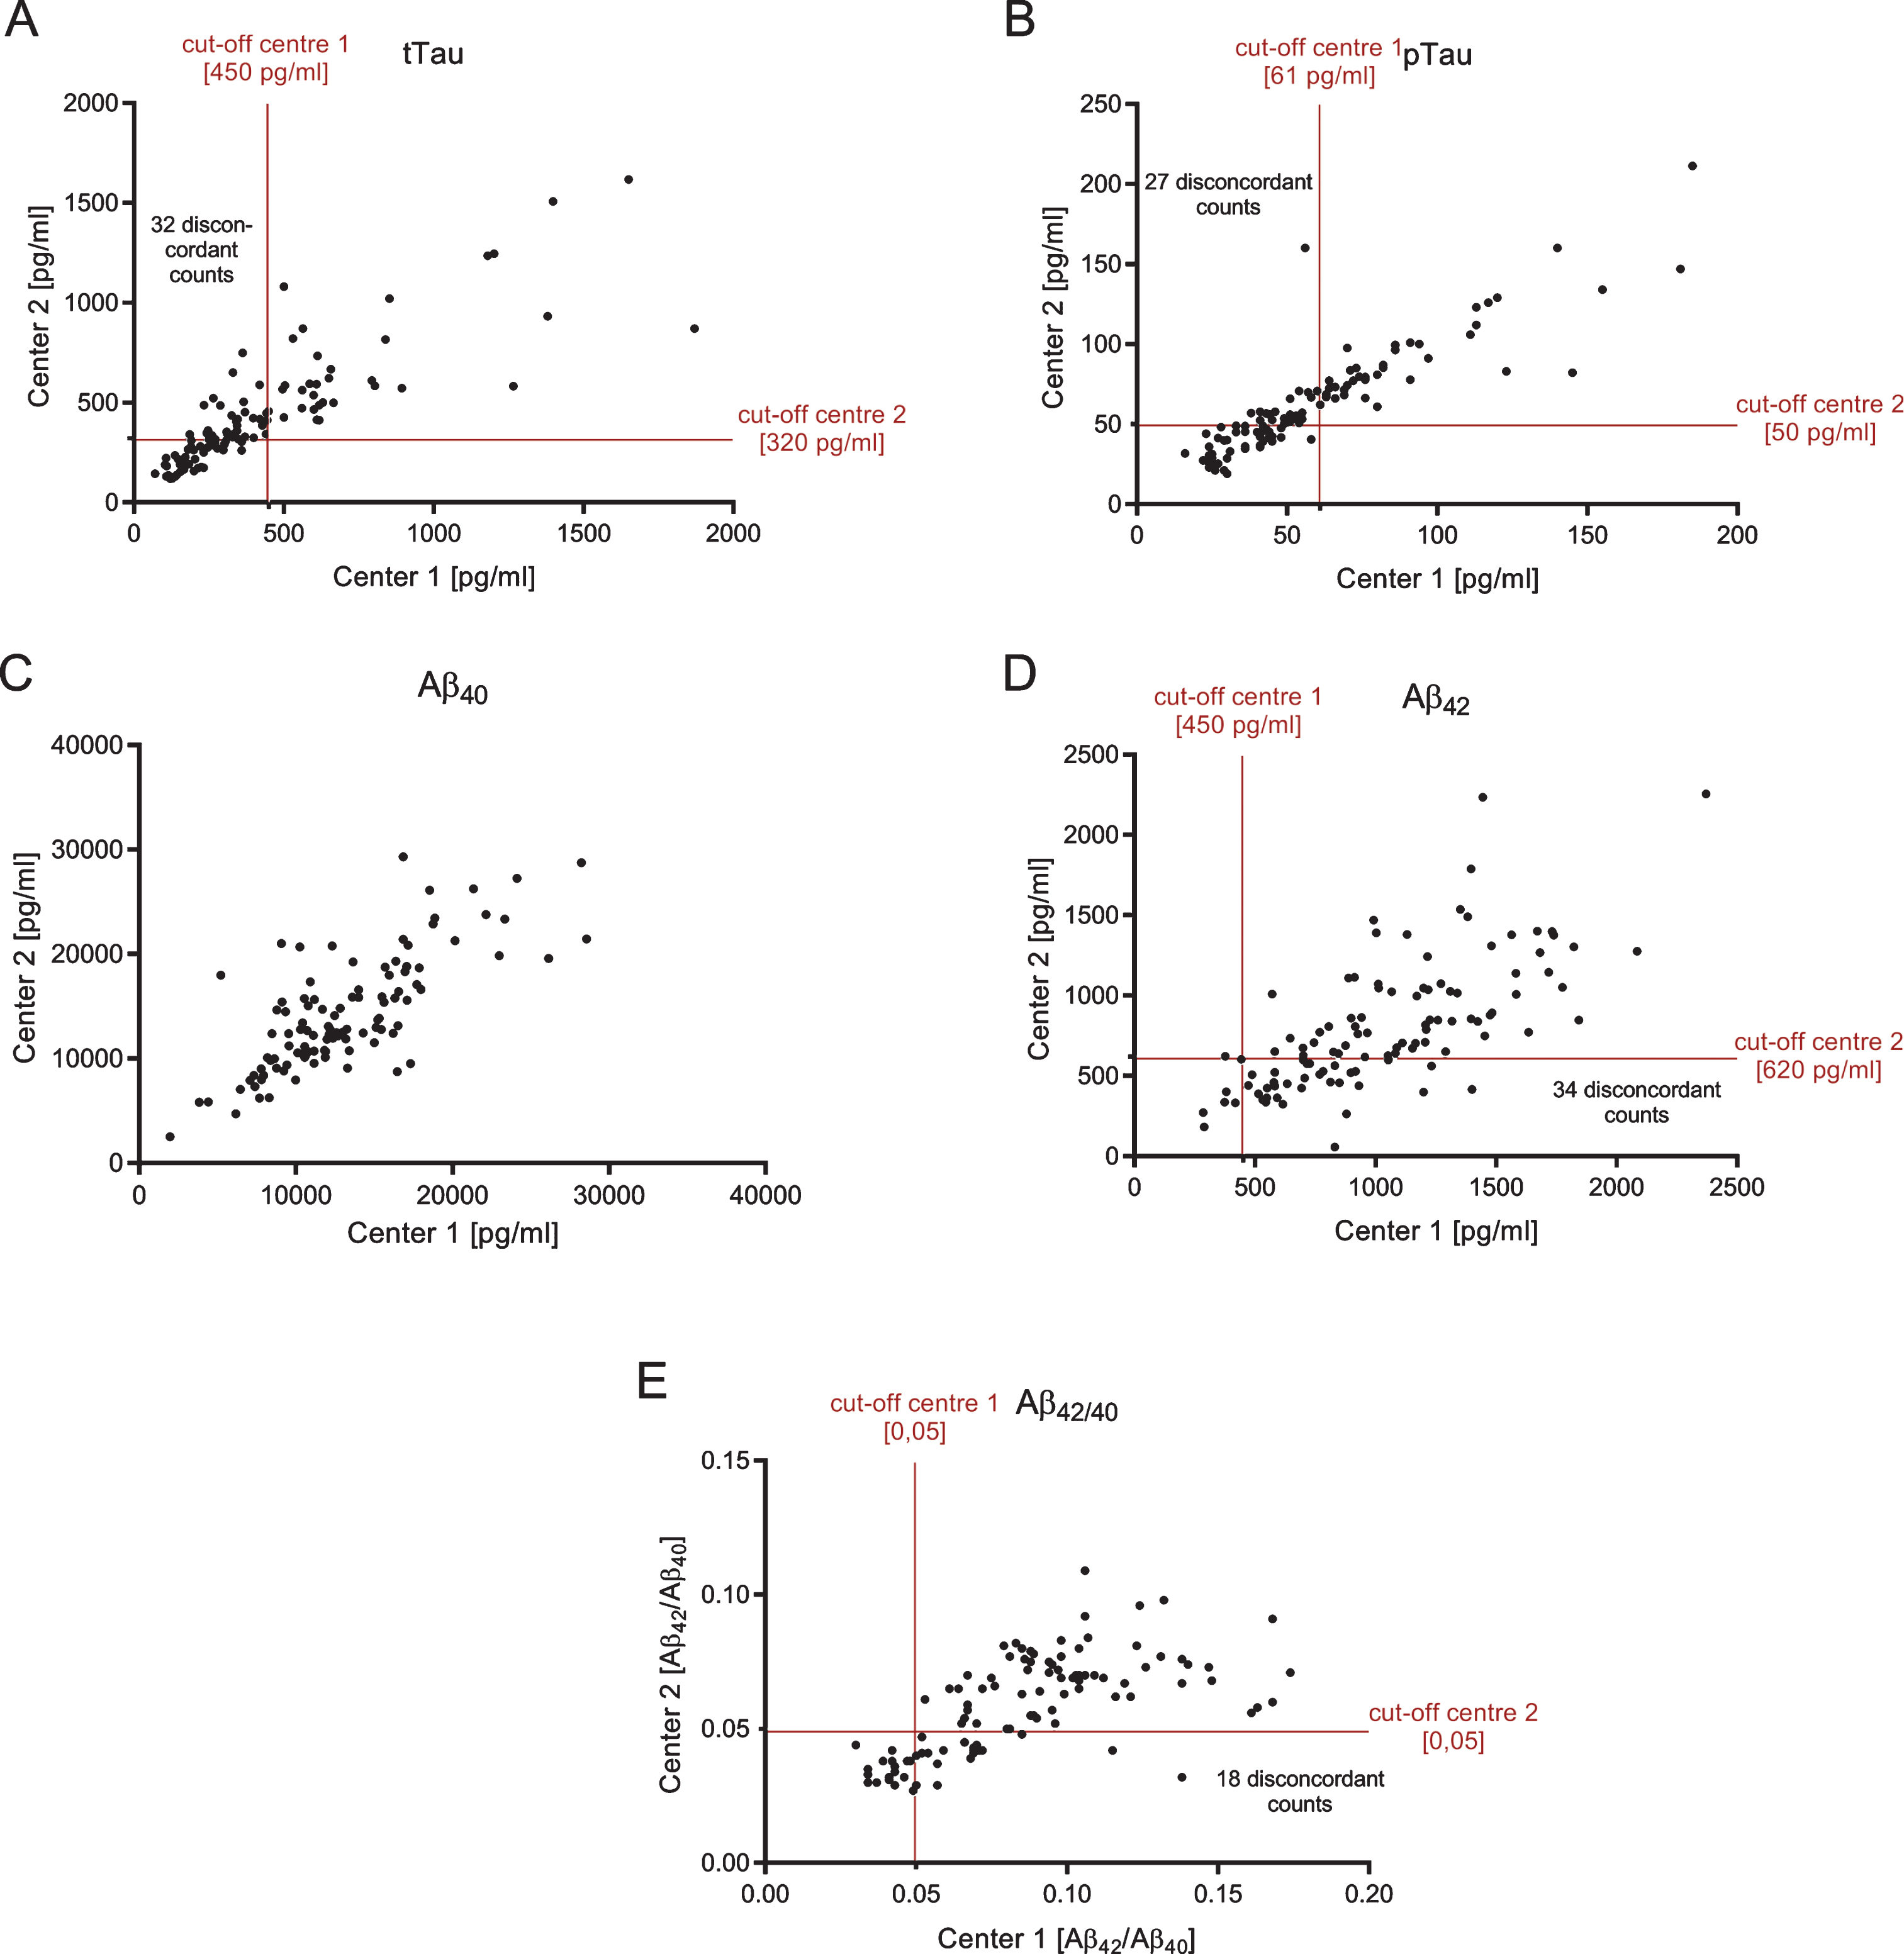
Both tTau and pTau measurements of the two centers were strongly correlated (tTau: R2 = 0.7129, p < 0.0001; pTau: R2 = 0.7914, p < 0.0001) (Fig. 3A, B). However, the diagnostic interpretations (normal CSF level versus pathological level) obtained from the two different laboratories were discordant in 29.6% of the cases with regard to tTau and in 25.0% of the patients with regard to pTau. The Aβ42 and Aβ40 measurements of the two different laboratories also showed statistically significant correlations: R2 = 0.5078 (p < 0.0001) for Aβ42 and R2 = 0.4308 (p < 0.0001) for Aβ42/40, respectively (Fig. 3D, E). CSF Aβ40 correlated with R2 = 0.5739 (p < 0.0001) between both centers (Fig. 3C). Although the cut-off points were different in both centers, this could not explain the different interpretations completely: parallel measured CSF aliquots were significantly different for pTau, Aβ40, Aβ42, and Aβ42/40. Only tTau measurements were similar in both centers (Fig. 2, Table 2).
The diagnostic interpretations of the Aβ42 CSF levels (normal versus pathological range) obtained by the two different sites were discrepant in 31.5% of the cases. The corresponding Cohen’s kappa (κ), as a measure of inter-rater agreement, was 0.170 indicating a poor agreement between the two different clinical laboratories [16]. In contrast, the diagnostic classifications of the subjects according to the Aβ42/40 ratio were discordant in only 16.8% of all cases, with κ= 0.589 indicating a moderate agreement. For tTau and pTau, calculated values of Cohen’s kappa were 0.449 and 0.528 (moderate agreement), respectively.
For a subset of the subjects included in this study, additional in vivo amyloid PET imaging data was available. Seven out of ten patients showed an increased amyloid-load within the CNS. Table 3 summarizes the degree, to which the diagnostic interpretations of the CSF Aβ42 levels and Aβ42/40 obtained from the two different sites were in line with the observations from amyloid PET imaging. On average, in only 55% of the cases both, CSF biomarkers and amyloid imaging suggested concordantly either absence or presence of brain amyloid deposition.
Table 3
Concordance of CSF-biomarkers and amyloid load in the CNS
| Aβ42 | Aβ42/40 | |||
| center 1 | center 2 | center 1 | center 2 | |
| Patient 1 | – | – | + | + |
| Patient 2 | – | + | – | – |
| Patient 3 | – | + | – | + |
| Patient 4 | + | + | + | + |
| Patient 5 | – | + | – | – |
| Patient 6 | + | + | + | + |
| Patient 7 | – | + | – | + |
| Patient 8 | + | – | + | – |
| Patient 9 | + | + | + | + |
| Patient 10 | – | – | – | – |
| In line with | 40% | 70% | 50% | 60% |
| Amyloid-PET | ||||
| 55% | 55% | |||
If CNS amyloid load, measured by Amyloid-PET, corresponds to the CSF biomarkers Aβ42 and Aβ42/40, patients are marked with “+”, if not, patients are marked with “–”. Overall, 55% of all CSF biomarkers were in accordance to the Amyloid-PET.
DISCUSSION
In this study, we report on the comparison of parallel CSF-biomarker measurements in a clinical cohort and their diagnostic interpretations executed under everyday routine conditions in two different clinical laboratories on a fee for service basis. In a sample of more than 100 patients, tTau, pTau, Aβ42, and Aβ42/40 were measured in parallel in two different laboratories according to the respective SOPs and the measured concentrations were classified according to the respective laboratory-specific cut-off points.
We observed substantial discrepancies between the two centers—with regard to the reported CSF Aβ42 concentrations and the Aβ42/40 ratios, which can be easily explained by the use of different assay kits for measuring Aβ42. More importantly, the diagnostic interpretations, provided by the different centers, were often discordant, not only for CSF Aβ42 but also for tTau and pTau. The classifications (normal range versus pathological range) made by the two centers were discrepant in 25.0% of the cases with regard to pTau, in 29.6% of the cases for tTau and in 31.5% of the cases regarding Aβ42. Considerable inter-laboratory variability in the immunological measurements of tTau, pTau, and Aβ peptides in CSF has been reported previously, also in carefully conducted multicenter quality survey studies [17, 18]. In particular, the reliable and reproducible determination of CSF Aβ42 is known to be technically challenging, and consequently efforts on standardization, including, for example, the development of certified reference materials and reference measurements procedures, have been launched [19].
In the samples studied here, the diagnostic classifications of the Aβ42/40 concentration ratios showed substantially less discordance between the different centers than those of the CSF Aβ42 levels. This observation further supports Aβ42/40 to represent the better neurochemical biomarker of pathological cerebral Aβ accumulation than Aβ42 alone [9, 20, 21].
The incorporation of additional diagnostic techniques is particularly important in the case of patients with atypical CSF-constellations or clinical appearance. PET-imaging is expensive and extensive, but might lead to an improved diagnostic accuracy in some individual cases.
In the present cohort, the agreement between CSF biomarkers and Amyloid-PET imaging was moderate. Overall, 55% of the CSF biomarker interpretations were in line with the Amyloid-PET results, whereby the agreement between the different centers and biomarker modalities (Aβ42 versus Aβ42/40) were varying. However, there was only a small number of imaging results available. Mattsson et al. showed that the correlation between CSF Aβ42 and amyloid load, measured with Florbetapir, depends on the diagnosis and clinical stadium [22]. In cognitively healthy subjects, 21% of all cases showed discordant results between Aβ42 and Amyloid-PET with mainly pathologically decreased Aβ42 but normal Amyloid-PET results. In patients with AD, only 6% discordant cases were observed. Hence, the authors concluded that decreased Aβ42 in CSF without Amyloid-PET abnormalities corresponded to early stages of AD, whereas Amyloid imaging changes to pathological in progressed stages [22]. The high discrepancy between the Amyloid-PET results and the measured CSF-biomarkers we observed here could be due to diagnostically inconclusive patients. In this cohort Amyloid-PET was not routinely performed, thus mainly clinical atypical or unclear patients underwent an additional Amyloid-PET.
As Amyloid-PET might not yet be available at many diagnostic sites, most centers will most probably make the diagnosis of AD supported by CSF-biomarkers. This study clearly reveals the importance of improving the possibilities to interpret CSF markers in subjects in order to reduce false negative and particularly false positive AD diagnoses, an issue of enormous importance to subjects suspected to suffer from AD.
In view of the here observed discordance in the diagnostic interpretation of CSF-biomarker data of up to 31.5% between the two centers, there is a great need for multicenter efforts to define valid cut-off points and to harmonize biomarker data interpretation. Different efforts on biomarker harmonization studies have been done so far. For example, a quality control program has been established, the Alzheimer’s Association QC program for CSF biomarkers (http://www.neurochem.gu.se/TheAlzAssQCprogram) [23, 24]. In addition, Bjerke et al. studied certified reference materials for the comparison between different assay techniques, which might be a useful tool for quality controls [25]. Besides, more and more efforts are made on the implementation of fully automated analyzers for CSF measurements [19, 26–28]. Recent data suggest the superiority of these fully automated electrochemiluminescence immunoassay, such as the novel Elecsys β-amyloid (1–42) assay by Roche Diagnostics, over classical ELISAs [29]. Besides Roche Diagnostics, Fujirebio (Lumipulse G600II) and Euroimmun (EUROIMMUN RA Analyzer 15) also provide fully automated immunoassays. All of these systems are supposed to provide a minimal lot-to-lot variation and thus might lead to a higher agreement between different centers and measurements. Further studies on fully validated systems are still pending to evaluate the benefit of automated immunoassays.
Nevertheless, Mattsson et al. could clearly demonstrate that the CSF biomarker variability is too high to calculate general cut-off values using the classical immunoassay based assays [28]. Experiences with fully automated immunoassays to determine general cut-off values are still insufficient. Therefore the determination of center-specific cut-off points, which need to be adapted within certain periods, is of high importance [30].
With a prevalence of estimated 5.4 million affected AD persons in the USA in 2016 [31], there is a substantial need for reliable CSF diagnostics. Thus, there is a big need for an improved inter-laboratory standardization. Since this study did not focus on the reason for the observed discrepancies (e.g., transport, SOP, methods, reference values), further research on the identification of influencing factors and consecutively optimization is required.
Conclusion
The analysis of neurochemical AD biomarkers in CSF can provide important support for the early and differential diagnosis of dementia. However, biomarker data have to be interpreted with caution and always in the context of the available clinical and diagnostic information. Biomarker data cannot serve as the sole basis of a diagnosis and need to be assessed in the context of medical history, neurological examination, and neuropsychological testing [2, 3, 32]. While high sensitivities and specificities of CSF biomarkers for the discrimination between controls and AD patients have been observed in well controlled biomarker studies [2, 33], this may not be feasible to the same extent in clinical every day routine. Measured CSF-biomarkers and their interpretation should be considered critically and taken as one part of a versatile diagnostic process. We could show that under real life clinical routine conditions the use of CSF Aβ42/40 instead of CSF Aβ42 can reduce the discrepancies between two different sites in terms of diagnostic biomarker interpretation. As a result, we support the implementation of Aβ42/40 in routine clinical diagnosis to improve the diagnostic certainty. Nevertheless, it is important to be aware of the limitations of the diagnostic performance of biomarker measurements.
ACKNOWLEDGMENTS
We thank Ulrike Heinze for data management.
Prof. Dr. Jens Wiltfang is supported by an Ilídio Pinho professorship and iBiMED (UID/BIM/04501/2013), at the University of Aveiro, Portugal.
Authors’ disclosures available online (https://www.j-alz.com/manuscript-disclosures/17-0793r1).
REFERENCES
[1] | Cummings JL , Dubois B , Molinuevo JL , Scheltens P ((2013) ) International Work Group Criteria for the diagnosis of Alzheimer disease. Med Clin North Am 97: , 363–368. |
[2] | Deuschl G , Maier W ((2016) ) S3-Leitlinie Demenzen. Deutsche Gesellschaft für Neurologie, Hrsg. Leitlinien für Diagnostik und Therapie in der Neurologie, S3-Leitlinie “Demenzen”, http://www.dgn.org/leitlinien, posted 25 January 2016, Accessed 29 November, 2017. |
[3] | McKhann GM , Knopman DS , Chertkow H , Hyman BT , Jack CR , Kawas CH , Klunk WE , Koroshetz WJ , Manly JJ , Mayeux R , Mohs RC , Morris JC , Rossor MN , Scheltens P , Carrillo MC , Thies B , Weintraub S , Phelps CH ((2011) ) The diagnosis of dementia due to Alzheimer’s disease: Recommendations from the National Institute on Aging-Alzheimer’s Association workgroups on diagnostic guidelines for Alzheimer’s disease. Alzheimers Dement 7: , 263–269. |
[4] | Sabri O , Sabbagh MN , Seibyl J , Barthel H , Akatsu H , Ouchi Y , Senda K , Murayama S , Ishii K , Takao M , Beach TG , Rowe CC , Leverenz JB , Ghetti B , Ironside JW , Catafau AM , Stephens AW , Mueller A , Koglin N , Hoffmann A , Roth K , Reininger C , Schulz-Schaeffer WJ ((2015) ) Florbetaben PET imaging to detect amyloid beta plaques in Alzheimer’s disease: Phase 3 study. Alzheimers Dement 11: , 964–974. |
[5] | Wiltfang J , Esselmann H , Bibl M , Smirnov A , Otto M , Paul S , Schmidt B , Klafki H-W , Maler M , Dyrks T , Bienert M , Beyermann M , Rüther E , Kornhuber J ((2002) ) Highly conserved and disease-specific patterns of carboxyterminally truncated Aβ peptides 1-37/38/39 in addition to 1-40/42 in Alzheimer’s disease and in patients with chronic neuroinflammation. J Neurochem 81: , 481–496. |
[6] | Klafki H-W , Hafermann H , Bauer C , Haussmann U , Kraus I , Schuchhardt J , Muck S , Scherbaum N , Wiltfang J ((2016) ) Validation of a commercial chemiluminescence immunoassay for the simultaneous measurement of three different amyloid-β peptides in human cerebrospinal fluid and application to a clinical cohort. J Alzheimers Dis 54: , 691–705. |
[7] | Lewczuk P , Esselmann H , Otto M , Maler JM , Henkel AW , Henkel MK , Eikenberg O , Antz C , Krause WR , Reulbach U , Kornhuber J , Wiltfang J ((2004) ) Neurochemical diagnosis of Alzheimer’s dementia by CSF Aβ42, Aβ42/Aβ40 ratio and total tau. Neurobiol Aging 25: , 273–281. |
[8] | Dumurgier J , Schraen S , Gabelle A , Vercruysse O , Bombois S , Laplanche J-L , Peoc’h K , Sablonnière B , Kastanenka KV , Delaby C , Pasquier F , Touchon J , Hugon J , Paquet C , Lehmann S ((2015) ) Cerebrospinal fluid amyloid-β 42/40 ratio in clinical setting of memory centers: A multicentric study. Alzheimers Res Ther 7: , 1–9. |
[9] | Lewczuk P , Lelental N , Spitzer P , Maler JM , Kornhuber J ((2015) ) Amyloid-β 42/40 cerebrospinal fluid concentration ratio in the diagnostics of Alzheimer’s disease: Validation of two novel assays. J Alzheimers Dis 43: , 183–191. |
[10] | Lewczuk P , Matzen A , Blennow K , Parnetti L , Molinuevo JL , Eusebi P , Kornhuber J , Morris JC , Fagan AM ((2016) ) Cerebrospinal fluid Aβ42/40 corresponds better than Aβ42 to amyloid PET in Alzheimer’s disease. J Alzheimers Dis 55: , 813–822. |
[11] | Sunderland T , Putnam KT , Friedman DL , Kimmel LH , Bergeson J , Manetti GJ , Bartko JJ , Cohen RM ((2003) ) Tau levels in cerebrospinal fluid of patients with Alzheimer disease. Psychiatry Interpers Biol Process 289: , 2094–2103. |
[12] | Mitchell AJ ((2009) ) CSF phosphorylated tau in the diagnosis and prognosis of mild cognitive impairment and Alzheimer’s disease: A meta-analysis of 51 studies. J Neurol Neurosurg Psychiatry 80: , 966–975. |
[13] | Olsson B , Lautner R , Andreasson U , Öhrfelt A , Portelius E , Bjerke M , Hölttä M , Rosén C , Olsson C , Strobel G , Wu E , Dakin K , Petzold M , Blennow K , Zetterberg H ((2016) ) CSF and blood biomarkers for the diagnosis of Alzheimer’s disease: A systematic review and meta-analysis. Lancet Neurol 15: , 673–684. |
[14] | Ritchie C , Smailagic N , Noel-Storr AH , Takwoingi Y , Flicker L , Mason SE , McShane R ((2014) ) Plasma and cerebrospinal fluid amyloid beta for the diagnosis of Alzheimer’s disease dementia and other dementias in people with mild cognitive impairment (MCI). Cochrane Database Syst Rev 6: , 1–92. |
[15] | Dyer SM , Flicker L , Laver K , Whitehead C , Cumming R ((2016) ) The clinical value of fluid biomarkers for dementia diagnosis. Lancet Neurol 15: , 1204. |
[16] | Landis JR , Koch GG ((1977) ) The measurement of observer agreement for categorical data. Biometrics 33: , 159–174. |
[17] | Lewczuk P , Beck G , Ganslandt O , Esselmann H , Deisenhammer F , Regeniter A , Petereit HF , Tumani H , Gerritzen A , Oschmann P , Schröder J , Schönknecht P , Zimmermann K , Hampel H , Bürger K , Otto M , Haustein S , Herzog K , Dannenberg R , Wurster U , Bibl M , Maler JM , Reubach U , Kornhuber J , Wiltfang J ((2006) ) International quality control survey of neurochemical dementia diagnostics. Neurosci Lett 409: , 1–4. |
[18] | Verwey NA , van der Flier WM , Blennow K , Clark C , Sokolow S , De Deyn PP , Galasko D , Hampel H , Hartmann T , Kapaki E , Lannfelt L , Mehta PD , Parnetti L , Petzold A , Pirttila T , Saleh L , Skinningsrud A , Swieten JCV , Verbeek MM , Wiltfang J , Younkin S , Scheltens P , Blankenstein MA ((2009) ) A worldwide multicentre comparison of assays for cerebrospinal fluid biomarkers in Alzheimer’s disease. Ann Clin Biochem 46: , 235–240. |
[19] | Kuhlmann J , Andreasson U , Pannee J , Bjerke M , Portelius E , Leinenbach A , Bittner T , Korecka M , Jenkins RG , Vanderstichele H , Stoops E , Lewczuk P , Shaw LM , Zegers I , Schimmel H , Zetterberg H , Blennow K ((2015) ) CSF Aβ1-42 - an excellent but complicated Alzheimer’s biomarker - a route to standardisation. Clin Chim Acta 467: , 27–33. |
[20] | Hansson O , Zetterberg H , Buchhave P , Andreasson U , Londos E , Minthon L , Blennow K ((2007) ) Prediction of Alzheimer’s disease using the CSF Aβ42/Aβ40 ratio in patients with mild cognitive impairment. Dement Geriatr Cogn Disord 23: , 316–320. |
[21] | Janelidze S , Zetterberg H , Mattsson N , Palmqvist S , Vanderstichele H , Lindberg O , van Westen D , Stomrud E , Minthon L , Blennow K , Hansson O ((2016) ) CSF Aβ 42/Aβ 40 and Aβ 42/Aβ 38 ratios: Better diagnostic markers of Alzheimer disease. Ann Clin Transl Neurol 3: , 154–165. |
[22] | Mattsson N , Insel PS , Donohue M , Landau S , Jagust WJ , Shaw LM , Trojanowski JQ , Zetterberg H , Blennow K , Weiner W ((2015) ) Independent information from cerebrospinal fluid amyloid-β and florbetapir imaging in Alzheimer’s disease. Brain 138: , 772–783. |
[23] | The Alzheimer’s Association QC program for CSF biomarkers, http://www.neurochem.gu.se/TheAlzAssQCprogram, Last updated 17 November 2017, Accessed 29 November 2017. |
[24] | Mattsson N , Lönneborg A , Boccardi M , Blennow K , Hansson O ((2017) ) Clinical validity of cerebrospinal fluid Aβ42, tau, and phospho-tau as biomarkers for Alzheimer’s disease in the context of a structured 5-phase development framework. Neurobiol Aging 52: , 196–213. |
[25] | Bjerke M , Andreasson U , Kuhlmann J , Portelius E , Pannee J , Lewczuk P , Umek RM , Vanmechelen E , Vanderstichele H , Stoops E , Lewis J , Vandijck M , Kostanjevecki V , Jeromin A , Salamone SJ , Schmidt O , Matzen A , Madin K , Eichenlaub U , Bittner T , Shaw LM , Zegers I , Zetterberg H , Blennow K ((2016) ) Assessing the commutability of reference material formats for the harmonization of amyloid-β measurements. Clin Chem Lab Med 54: , 1177–1191. |
[26] | Blennow K , Dubois B , Fagan AM , Lewczuk P , de Leon MJ , Hampel H ((2014) ) Clinical utility of cerebrospinal fluid biomarkers in the diagnosis of early Alzheimer’s disease. Alzheimers Dement 11: , 1–12. |
[27] | Song L , Lachno DR , Hanlon D , Shepro A , Jeromin A , Gemani D , Talbot JA , Racke MM , Dage JL , Dean RA ((2016) ) A digital enzyme-linked immunosorbent assay for ultrasensitive measurement of amyloid-β 1–42 peptide in human plasma with utility for studies of Alzheimer’s disease therapeutics. Alzheimers Res Ther 8: , 58. |
[28] | Mattsson N , Andreasson U , Persson S , Carrillo MC , Collins S , Chalbot S , Cutler N , Dufour-Rainfray D , Fagan AM , Heegaard NHH , Robin Hsiung GY , Hyman B , Iqbal K , Lachno DR , Lleó A , Lewczuk P , Molinuevo JL , Parchi P , Regeniter A , Rissman R , Rosenmann H , Sancesario G , Schröder J , Shaw LM , Teunissen CE , Trojanowski JQ , Vanderstichele H , Vandijck M , Verbeek MM , Zetterberg H , Blennow K , Käser SA ((2013) ) CSF biomarker variability in the Alzheimer’s Association quality control program. Alzheimers Dement 9: , 251–261. |
[29] | Bittner T , Zetterberg H , Teunissen CE , Ostlund RE , Militello M , Andreasson U , Hubeek I , Gibson D , Chu DC , Eichenlaub U , Heiss P , Kobold U , Leinenbach A , Madin K , Manuilova E , Rabe C , Blennow K ((2016) ) Technical performance of a novel, fully automated electrochemiluminescence immunoassay for the quantitation of β-amyloid (1-42) in human cerebrospinal fluid. Alzheimers Dement 12: , 517–526. |
[30] | IBL International ((2015) ) Tau total ELISA, http://www.iblinternational.com/media/catalog/product/r/e/re59631_ifu_en_tau_total_elisa_2015-12_1.pdf, Accessed 29 November 2017. |
[31] | Alzheimer’s Association ((2015) ) 2015 Alzheimer’s disease facts and figures. Alzheimers Dement 11: , 459–509. |
[32] | Dubois B , Feldman HH , Jacova C , DeKosky ST , Barberger-Gateau P , Cummings J , Delacourte A , Galasko D , Gauthier S , Jicha G , Meguro K , O’Brien J , Pasquier F , Robert P , Rossor M , Salloway S , Stern Y , Visser PJ , Scheltens P ((2007) ) Research criteria for the diagnosis of Alzheimer’s disease: Revising the NINCDS-ADRDA criteria. Lancet Neurol 6: , 734–746. |
[33] | Blennow K ((2004) ) Cerebrospinal fluid protein biomarkers for Alzheimer’s disease. NeuroRX 1: , 213–225. |

