High-flavonoid intake induces cognitive improvements linked to changes in serum brain-derived neurotrophic factor: Two randomised, controlled trials
Abstract
BACKGROUND: Recent clinical studies have indicated the beneficial impact of dietary flavonoid intake on human cognitive performance. Although the mechanisms that mediate such improvements are currently unclear, animal and human trial data suggest that changes in neurotrophin expression, and related signalling apparatus, may be involved.
OBJECTIVE: To investigate the link between changes in serum brain-derived neurotrophic factor (BDNF) and changes in human cognitive performance following flavonoid intake.
METHODS: The relationship between serum levels of BDNF and age, gender, BMI, waist circumference, blood pressure and cognition at baseline, and following flavonoid intake, was investigated in two distinct randomised, controlled clinical trials. Trial 1 was conducted in men and women (aged 26–70 y; consuming an average of 3 portions of fruit and vegetables per day) and delivered high-flavonoid (>15 mg/100 g) or low-flavonoid (<5 mg/100 g) fruit and vegetables and increased intake by 2 portions every 6 weeks. The control arm was habitual diet over the same time frame. Trial 2 was conducted in an older males and female cohort (aged 62–75 y) intervening with a high-flavanol cocoa drink (494 mg total flavanols) and a low-flavanol cocoa drink (23 mg total flavanols) for 12 weeks.
RESULTS: Serum BDNF levels increased linearly to the age of 65, after which BDNF levels were found to decrease markedly. All other physiological and anthropometric measurements proved to not be significantly associated with serum BDNF levels (p > 0.05), although higher levels in males compared to females almost achieved significance (p = 0.056). At baseline, higher serum BDNF levels were associated with significantly better global cognition scores, relative to individuals with lower serum levels. In addition, following intervention for 18 weeks, high-flavonoid, but not low-flavonoid, fruit and vegetable intake induced significant improvements in cognitive performance and increases in serum BDNF levels (p = <0.001). Flavanol intervention for 12 weeks also resulted in significant increases in serum BDNF (p = <0.001), and such increases were correlated with improvements in global cognitive performance.
CONCLUSION: Increases in global cognition induced by high flavonoid fruit and vegetables, and cocoa flavanols were paralleled by concurrent changes in serum BDNF levels, suggesting a role for BDNF in flavonoid-induced cognitive improvements. Furthermore, we provide further data suggesting that serum BDNF levels may represent a biomarker of cognitive function.
1Introduction
Intake of dietary flavonoids, particularly flavanols and anthocyanins, has been reported to improve endothelial (dependent and/ or non-dependent) vasodilatation [1, 2], blood pressure [3], glucose metabolism and insulin resistance [4], and more recently cognitive function and task performance [5]. Collectively, these health-promoting effects may in part support the inverse association between flavonoid intake and risk of chronic disease, including vascular-related diseases and dementia [6–8]. Randomised, controlled dietary intervention trials conducted in animal models and humans investigating flavonoid-rich foods, including Camellia sinensis (tea) [9, 10], Vitis Vinifera (grape) [11–13], Ginkgo biloba [14], Theobroma cacao (cocoa) [15–21], Vaccinium spp (blueberry) [22–24], have indicated such diets may enhance memory and learning [12, 25], although the mechanisms by which they promote such activity is currently unclear.
Previous animal studies have suggested that improvements in cognitive performance in response to flavonoid intake may involve the induction of brain derived-neutrophic factor (BDNF) gene expression and protein synthesis [26]. BDNF is identified as a significant protein for optimal structure and function of hippocampal synapses, supporting the function of long-term memory in humans [27–29]. Previous research has shown that the use of protein synthesis inhibitors and inhibitors of BDNF signalling can lead to impairment of long-term memory and once expressed in neurons of the central nervous system (CNS) BDNF has various functions, including enhancing the survival and activity of a large number of non-neuronal cells [30, 31], as well as critical roles in synaptic plasticity [32], nerve cell growth [33] and neuronal regeneration following nerve injury [34–37]. Changes in BDNF expression have been postulated to influence the size of brain regions, memory functioning and anxiety-related behaviour [38]. Indeed, its growth factor-like effects promote both neurogenesis and angiogenesis, and it may also aid the recruitment of circulating cells to facilitate cellular regeneration after ischemic injury [33]. In support of these hypotheses, both targeted mutations in BDNF or BDNF knockout results in deficient memory and learning and a significantly shorter lifespan [39]. Previous animal data suggest that anthocyanin intake enhances spatial working memory and that such changes are correlated with both increased hippocampal CREB activity and BDNF levels [26]. In support of this, in vitro studies suggest that physiologically relevant, nanomolar levels of flavonoids, in particular flavanols and flavanones, may activate the ERK pathway, leading to downstream CREB phosphorylation/activation[40–44].
Interactions are suggested to exist between BDNF, age-related cognitive decline and other cognitive-behavioural disorders. Age-related hippocampal atrophy is associated with memory-impairment, and therefore it is hypothesised that lower BDNF levels partly mediate this physiological change [45]. Additionally, decreased BDNF functionality has been associated with clinical depression and may also contribute to the pathogenesis of schizophrenia [46–48]. In addition to the brain, synthesis of BDNF also occurs in other cell types, including endothelial cells. An ex vivo study found that synthesis of BDNF in vascular endothelial cells may contribute to the circulating pool of BDNF in humans [49] and undergoes activity-dependent release and may be transported across the blood–brain barrier [50]. Despite the growing number of studies linking the intake of flavonoid-rich foods to cognitive improvements, little is known about the mechanisms of action and whether peripheral factors may also mediate such events in the brain. As such, we hypothesize that the improvements in human cognitive function induced by flavonoid intake are, in part, mediated by increased expression of BDNF in both the brain and periphery. Additionally, we investigate the potential use of serum BDNF measurement as a biomarker of cognitive performance in humans. To address this, we have conducted a human RCT administering both high- and low-flavonoid interventions in order to establish whether flavonoid intake influences human cognition and whether such improvements are linked to concurrent changes in serum BDNF levels. Results of this trial aim to support the evidence that suggests a causal relationship between flavonoid intake and associated improvements in cognitivefunction.
2Materials and methods
2.1Study design
During this study two clinical trials were performed. Clinical trial 1: Two cohorts (totaling 154 individuals) of men and women aged 26–70 y were recruited to the FLAVURS trial according to inclusion and exclusion criteria, as previously reported [51, 52] Notably, individuals consuming less than the UK population average of 4.4 portions F&Vs/d and those assessed to score more than 2 on a modified Framingham CVD risk assessment [51, 53] were recruited and randomly assigned to 1 of 3 dietary groups via use of a minimisation procedure matching for age, sex, BMI, red wine and tea consumption, and smoking. Risk markers were scored as follows: BP [either systolic BP (SBP) of 130–139 mm Hg (1 point) or ≥140 mm Hg (2 points) or diastolic BP (DBP) ≥90 mm Hg (2 points)]; serum total cholesterol [5.2–6.1 mmol/L (1 point) or 6.2–7.2 mmol/L (2 points)]; HDL cholesterol [in men: 1.0–1.1 (1 point) or <0.9 mmol/L (2 points); in women: 1.2–1.3 mmol/L (1 point) or <0.9–1.1 mmol/L (2 points)]; obesity/adiposity [either waist circumference in women of 80–87 cm (1 point) or >88 cm (2 points) and waist circumference in men of 94–101 cm (1 point) or >102 cm (2 points) or a BMI (in kg/m2) of 25–30 (1 point) or >30 (2 points); BMI for Asian populations: 23–27.5 (1 point) or >27.5 (2 points)]; and smoking status [> 10 cigarettes/d (2 points)]. Before baseline measures, all groups were blinded to the interventions after assignment;. In total, 307 individuals were screened; after identification of CVD risk, 221 were recruited into the study, 174 were randomly assigned to 1 of the 3 intervention groups, and 154 completed all study visits.
A randomized, controlled, dose-dependent, parallel designed trial with 2 sequentially increasing dose-response dietary treatments consisting of high-flavonoid fruit and vegetables (HF) or low-flavonoid fruit and vegetables (LF), against a control group where habitual diet is maintained (control). Incrementally, 2, 4 and 6 portions of fruit and vegetable intake delivered 3, 6 and 7 mg/d (low-flavonoid intervention) and 49, 121 and 198 mg/d (high-flavonoid intervention) total flavonoids, respectively. The trial was registered as a randomized clinical trial (ISRCTN47748735) and conducted according to the guidelines laid down in the Declaration of Helsinki. Ethical approval for the study was obtained from the Local Research Ethics Committee of the Isle of Wight, Portsmouth and South East Hampshire (REC: 07/H0501/81), and the University of Reading’s Research (REC: 07/22) Ethics Committee. Informed consent was obtained before participation. After screening and random assignment, participants were invited to the university for a familiarization visit to acquaint them with the clinical setting and measurements that would be performed on study visits. This was followed by a 2-wk run-in period, during which volunteers were asked to maintain their current habitual diet and lifestyle. Following run-in, participants attended a baseline visit (week 0), where they were randomized onto either the HF, LF or control intervention. The target intake of F&Vs was increased over and above habitual intake by 2, 4, and 6 (+2, +4, and +6) 80 g portions/d over 3 consecutive 6-wk periods. Participants attended 4 study visits at the Hugh Sinclair Unit of Human Nutrition (weeks 0, 6, 12, and 18), where measures of cognitive function were assessed and blood samples were collected for BDNF analysis. Throughout the study, participants were asked to maintain a constant weight, minimize other health and lifestyle changes, and to immediately report changes in medication status or other factors that may influence CVDrisk profile.
At the baseline visit (week 0), participants were provided with information on the diet to which they had been assigned, and close contact with the study dietitian/nutritionist was maintained during the 18-week period to provide dietary advice, motivation and support. Portions of F&Vs were defined as 80 g for fresh, frozen, or canned items, or 40 g for dried items and ≥150 mL fresh juice. With the use of the USDA flavonoids database [54], HF and LF foods were defined as >15 mg/100 g and as <5 mg/100 g of total flavonoids, respectively, with adjustments made to account for fresh, dry, or canned F&V weight. All F&Vs were provided to participants, and considerable effort was devoted to matching the intake of other potentially bioactive components of the F&Vs such as carotenoids, vitamin C, folate, and non-starch polysaccharides. A variety of food sources were provided, including fresh, canned, frozen, and dried F&Vs and juices and composite foods such as fruit smoothies and pasta sauces. To aid compliance, all F&Vs were provided to those in the LF and HF groups and delivered to participants’ homes on a weekly basis. Full details of the dietary intervention have been reported previously [51].
2.2Clinical trial 2
40 healthy volunteers (18 women and 22 men; mean +/–SD age: 68.3 +/–3 y) were recruited from the University of Reading and surrounding area. All volunteers were assessed as ‘healthy’ based on absence of medical treatment and/or supervision, response to a standard medical questionnaire, a ‘Brief Symptom Inventory’ (a screening tool for underlying depression), blood pressure measurements and blood parameters (i.e. normal liver enzymes, hemoglobin, hematocrit and leukocyte counts). Volunteers were selected according to the following inclusion/exclusion criteria: Inclusion criteria: Aged 62–75 years, absence of food allergies or sensitivity to chocolate, dairy, nuts or gluten; consumers of less than 15 units (120 g) of alcohol per week, native English speaker, MMSE ≥25. Exclusion criteria: those under medical supervision and medical treatment, including prescribed blood pressure medication, anti-depressants, anticoagulants, and sufferers of chronic fatigue syndrome, liver disease, diabetes mellitus, myocardial infarction and gall bladder or gastrointestinal abnormalities. Those with hypertension (systolic blood pressure above 160 mm Hg and/or a diastolic blood pressure above 90 mm Hg), anemia (hemoglobin >11.5), alcohol abuse (gamma GT <80 IU/l), hearing impairments and color blindness were also excluded. Those selected for the study were asked to refrain from the consumption of the following foods for 24 h prior to the study (including the washout period): consumption of flavanol-rich foods, including cocoa, chocolate, apples, and red wine. They were also requested to refrain from participating in vigorous exercise (>3×20 min/week) and consuming caffeine and were requested to arrive at each study appointment fasted, having only consumed low-nitrate mineral water..
The study was conducted according to the guidelines of the Declaration of Helsinki, and all procedures involving human subjects were approved by the University of Reading Research Ethics committee (ref: 08/49). The study was also registered with the National Institutes of Health (NIH)-randomised trial records held on the NIH ClinicalTrials.gov website (NCT01344551). The study was designed as a randomised, controlled, double-masked, cross over dietary intervention, in the course of which volunteers were asked to consume either a high-flavanol cocoa drink (494 mg total flavanols) or a low-flavanol cocoa drink (23 mg total flavanols) for 28 days. Intervention drinks were provided by Mars Incorporated (Hackettstown, NJ, USA) as dry, dairy-based cocoa beverage mixes. All cocoa drinks were standardized for their total cocoa flavanol content and profile, and closely matched for macro- and micro-nutrient content, caloric load, theobromine (HCF: 185 mg; LCF: 177 mg) and caffeine content (HCF: 15 mg; LCF: 17 mg) levels. All cocoa drinks were similar in taste and appearance and were supplied in individual sachets labeled with an anonymous three-digit code. The amount of total cocoa flavanols referenced here is defined as the sum of all monomeric flavanols and their oligomeric derivatives (dimers to decamers, i.e. 2–10 monomeric subunits). Each treatment was reconstituted in 200 mL of warm, nitrate/nitrite free water and stirred until well mixed. Volunteers were asked to consume drinks immediately on preparation.
All subjects and researchers involved in the conduction of the study and assessment of study outcomes were masked with regard to the nature of the test materials consumed. An independent researcher generated a random allocation sequence (using restricted randomization), and allocated participants into their groups. After the first intervention period, there was a 4-week wash out period prior to switching volunteers to the alternate arm of the study. Following an overnight fast, volunteers consumed a low-flavonoid breakfast (toast (200 g), butter 7 g), honey (10 g)), subjects were asked to complete a cognitive test battery (2 sets of 40 minutes with a 10 minute break). Following this, they were asked to consume one cocoa beverage (one cocoa sachet in ∼150 mL of water) every day after breakfast for 28 days before attending the unit to undertake a second round of cognitive testing (2 sets of 40 minutes with a 10 minute break), with individual cognitive tests administered in the same order. Subjects were advised not to alter their usual calorie intake, were asked to document any unusual symptoms or side effects and to keep a diary of illness and medication.
2.3Cognitive function
Trained, blinded, research assistants administered the neuropsychological test battery, which included the primary measures of executive function and episodic memory and secondary measures of working memory, spatial memory, implicit memory, attention and information processing and psychomotor speed. The battery took approximately 1.5 hours to administer and on each visit a different, randomly assigned, version of each task was administered. Global ‘Executive function’ was assessed using the following tasks, which were combined to provide a composite score: (1) The inhibitory component of executive function by Go-NoGo task [55–57] and Stroop [58, 59] (2) The ‘shifting’ component of executive function by the plus-minus [60] and trail making tasks [61–64] and (3) the updating component of executive function by letter memory task [65, 66], whilst episodic memory was assessed by free and delayed recall [67–69], word recognition and face recognition [67]. Other cognitive domains assessed were working memory: assessed by serial sevens task [70–73]; spatial memory assessed by spatial delayed recall task (SDRT) [74]; spatial memory using a virtual 3D radial arm maze task; implicit memory by the word stem completion task [75]; and attention and processing speed by the digital symbol substitution task (DSST) [76–78] and rapid visual information processing (RVIP) task [79].
2.4BDNF measurement
Serum BDNF was assessed using a commercially available, mature BNDF rapid ELISA kit (Biosensis, mature BDNF; human, rat, mouse). It is generally considered better to measure circulating BDNF in the serum as its concentration in serum is about 100 folds higher than plasma levels [80] and its concentration in plasma is affected by blood handling due to the degranulation of platelets [81, 82]. After collection of whole blood, serum was separated by centrifugation at 1800×g for 10 minutes at 4°C, aliquoted and stored at –80°C until use. Serum levels of BDNF were quantified at baseline and following the intake of increasing amounts of fruit and vegetables, or high- and low-flavanol intake. Flat-bottom 96-well plates were coated with anti-BDNF monoclonal antibody (mAb; 1 : 1000) and left overnight. Following this, plates were washed with TBST (20 mM Tris-HCl (pH 7.6), 150 mM NaCl and 0.05% (v/v) Tween® 20), and blocked using a commercial block buffer and incubated for 1 hour. Following an additional wash step, defrosted serum samples were diluted 1 : 4 and added to wells (100 μl) and incubated for 2 h, before being washed with TBST. A second, specific BDNF polyclonal antibody (pAb) (anti-human BDNF pAb; 1 : 500 dilution) was then added to wells and incubated for 2 h. Plates were then washed bound BDNF pAb was detected using a species-specific anti-IgY antibody conjugated to horseradish peroxidase (HRP). Follwoing 1 h incubation, unbound conjugate was removed by washing and 100 ml of TMB (tetramethyl benzidine) was added to each well and after a 10 min incubation the reaction was stopped with 100 ml of 1 N HCl. Colour change was measured at 450 nm within 30 min using Tecan GENios multiplate reader (Tecan GENios, Theale, U.K). The BDNF concentration was calculated using a standard curves constructed using authentic BDNF protein (0–500 pg/ml).
2.5Statistical analysis
All statistical analyses of data occurred in advance of the authors being un-blinded and analysis was carried out on the basis of intention-to-treat. Prior to analysis, normality checks were performed on all data and log transformations were carried out. All statistical analysis was performed with Prism 5.0f (GraphPad, San Diego, CA). Based on a medium effect size (d = 0.65) in our preliminary work, using young adults and the GoNogo task, we calculated that a sample size of 60 participants would provide considerable power (0.97) to detect a similar sized effect in older adults (p = 0.05). For consistency, interpretability and in agreement with other studies [83, 84] all cognitive test data were pooled to calculate overall means and SD’s per test and then converted to ‘Z’ scores. For the majority of tests a higher score represented a better cognitive performance so those where a higher score represented a poorer performance (GoNogo and Stroop response times, Trails, Plus Minus, Vr Radial Maze) those scores were multiplied by –1. In agreement with another studies [83], data for the executive function and episodic memory tasks were used to create a set of z scores that were grouped for analysis into the two separate domains of cognitive function: executive function = (Z Letter memory + Z Gonogo + Z Stroop + Z Trails + Z Plus Minus)/5 and episodic memory = (Z Free recall + Z Delayed recall + Z Word recognition + Z Face recognition)/4. All effects were reported as significant if P < 0.05. To determine differences in baseline test performance between arms, a paired t-test was used. Significant differences in the primary variables of executive function and episodic memory and all anthropometric and biochemical variables were calculated by a 2 factor repeated measures ANOVA with treatment and time as the two factors. Pearson correlation analysis was performed to correlate BDNF values with age, gender, BMI, WC and BP (SBP & DBP) as well as z-score. Paired t-test used in order to compare mean serum BDNF level in both male and female subjects. When the BDNF data was split into tertiles of age (35–50, 51–65 and 66–90), we have used a one-way analysis of variance in order to indicate that the 3 means were significantly different from each other. Moreover Post hoc analysis, using Bonferroni’s Multiple Comparison Test used to compare BDNF levels in these three aged groups.
3Results
3.1Baseline correlation of serum BDNF with anthropometric and cognitive markers
At baseline, correlation of BDNF values with age (dividing volunteers in 2 age groups <65 and >65 years old) indicated a significant positive correlation at 5% level (95% confidence interval) between the serum BDNF levels and age in volunteers aged less than 65 years (P = <0.001; R2 = 0.203) (Fig. 1A). In contrast, in those aged 65 years and above, a significant negative correlation was observed between the two variables (p = <0.001; R2 = –0.5274) (Fig. 1B). Moreover when the BDNF data was split into tertiles of age (35–50, 51–65 and 66–90 years), a one-way analysis of variance indicated that the 3 means were significantly different from each other (p < 0.001) (Fig. 1C). Post hoc analysis, using a Bonferroni multiple comparison test, indicated that the 51–65 group had significantly higher BDNF levels compared to the 35–50 age group (P < 0.01), whilst the 66–90 group had significantly lower BDNF levels than the 35–50 group (P < 0.05) and the 51–65 group (P < 0.001). Mean serum BDNF levels were also found to be significantly higher in males (214.1 pg/ml) compared to females (246.4 pg/ml), albeit weakly (p = 0.046) (Fig. 2A). No significant correlation between the serum BDNF level and SBP (p > 0.05) and DBP (p > 0.05) (Fig. 2B), or BMI (p > 0.05) (Fig. 3A) and waist circumference (p > 0.05] (Fig. 3B) was observed. At baseline, tertile analysis (serum BDNF: <200 pg/ml; 200–300 pg/ml;>300 pg/ml) indicated that as serum BDNF levels increased, there was a significant increase in global cognitive performance (<200 v > 300 pg/ml, p < 0.01; (200–300 v >300 pg/ml, p < 0.05) (Fig. 4).
3.2Influence of fruit and vegetable intake on global cognition and serum BDNF
A two factor repeated measures ANOVA (time×treatment) indicated that there was a significant effect of time (p = 0.003), treatment (p = 0.069) and an interaction (p = 0.033) between dietary intake and cognitive performance (Fig. 5A). Post hoc analysis, using a Bonferroni correction indicated that following HF F&V intake global cognitive performance was significantly improved at 12 and 18 weeks (p < 0.01), relative to both habitual diet (control) and LF F&V intake (Fig. 5A). In parallel, a two factor repeated measures ANOVA indicated significant time (p = 0.008), treatment (P < 0.005) and an interaction (p = 0.026) between serum BDNF and dietary intake across the 12 weeks (Fig. 5B). Post hoc analysis indicated a significantly higher serum BDNF level at 12 weeks in the HF F&V group, relative to the habitual diet (control) group (p < 0.001)(Fig. 5B).
3.3Influence of 12 week flavanol intake on cognition and serum BDNF
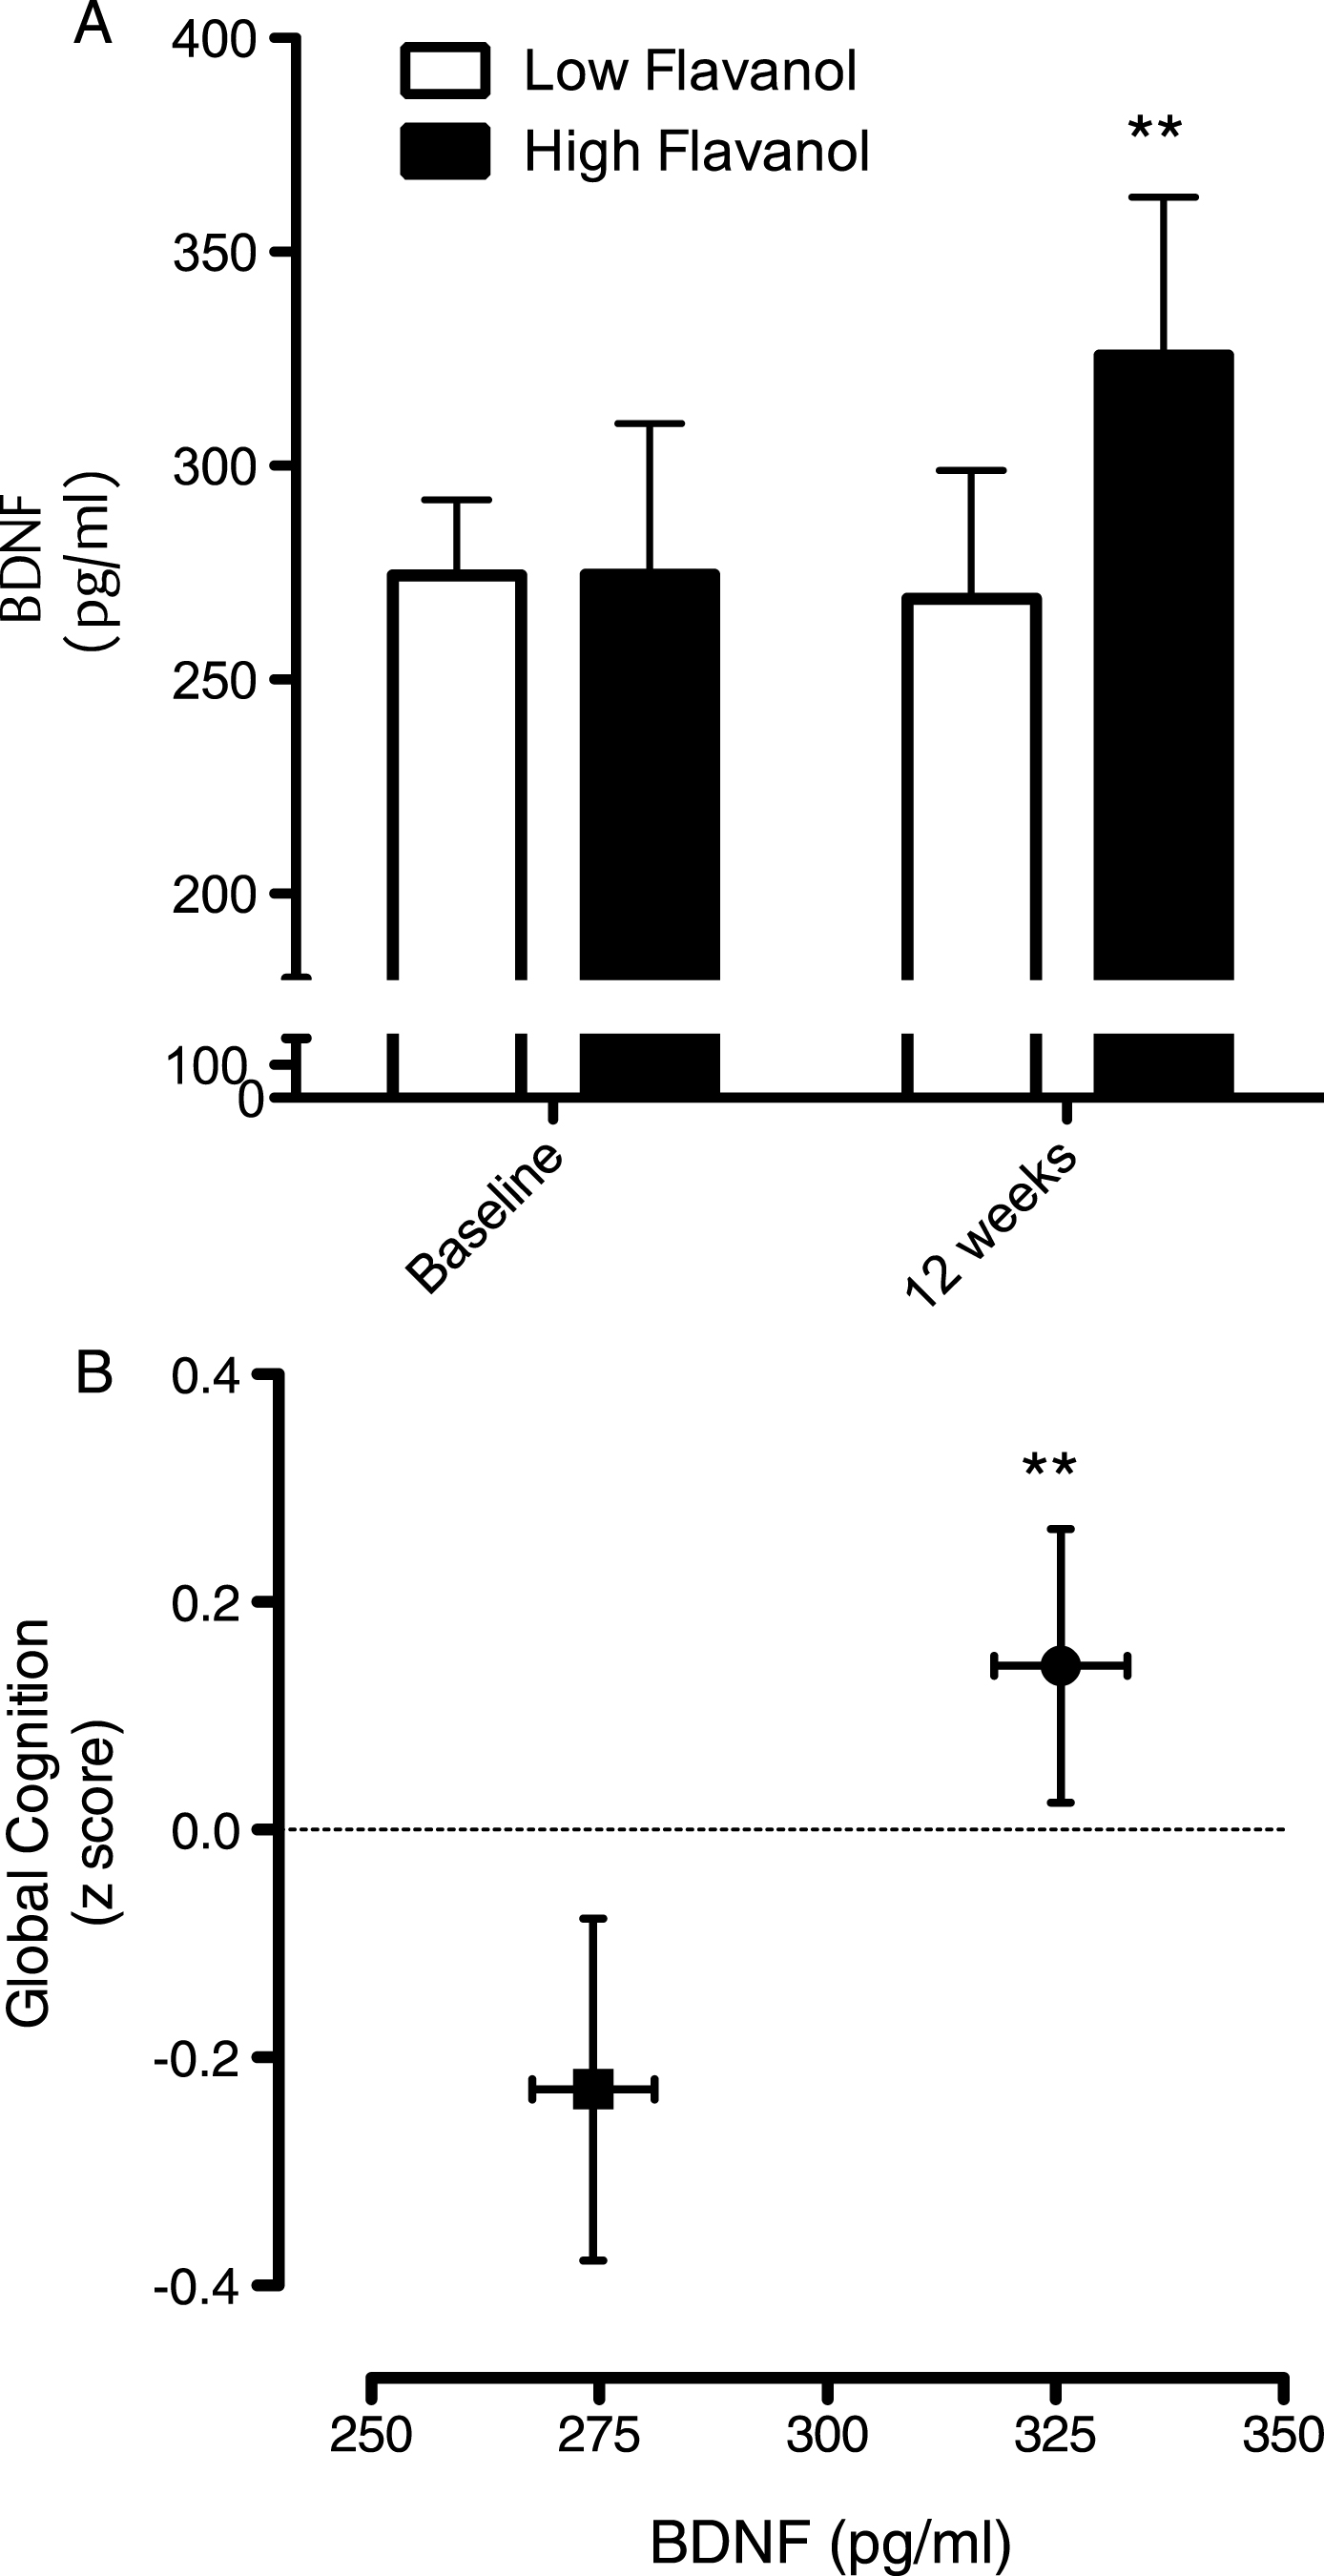
Intake of the high flavanol cocoa intervention for 12 weeks led to a significant increase serum BDNF levels, relative to the low flavanol cocoa intervention (Fig. 6A; p < 0.01) and global cognitive function (Fig. 6B; p < 0.01). Plotted together, the data indicate increases on both global cognition and serum BDNF increase concurrently (Fig. 6B).
4Discussion
Improvements in human cognitive function brought about by the intake of dietary flavonoids may be, in part, mediated by increased expression of BDNF in both the brain and periphery and additionally, such serum levels of this neurotrophin may act as a potential biomarker of cognitive performance in humans. We show that with the exception of age, where there was a steady increase in serum BDNF levels up to the age of 65, and a sharp decline after 65 years, other anthropometric measures showed no correlation with serum BDNF levels. This observation, broadly agrees with previous studies suggesting that the most significant changes in BDNF occur in the elderly (∼70 years and above) where cognitive decline is most marked [85, 86], For example, [85] previous data indicate declines in serum BDNF with age in a group of elderly subjects aged between 70 and 103 years (r = –0.15), although other studies have shown no significant age-related changes in blood BDNF concentrations [50, 87] and animal studies suggest that brain BDNF levels which reflect serum BDNF concentrations [88] do not alter with age [89, 90].
All other physiological and anthropometric measurements proved to not be associated with serum BDNF levels, although levels were slightly higher in males compared to females. This fits with previous observations [50, 86, 87, 91], although data concerning the differences between males and females are generally small and variable. We found no influence of either BMI or waist circumference on BDNF levels, which also agrees with previous data [50]. Furthermore, observations that there are no significant differences between serum BDNF in subjects grouped as ‘underweight’ (<18.5 kg/m2), ‘normal’ (18.5–23.99 kg/m2) and ‘overweight’ (>24 kg/m2) [86] similarly reflects our findings, although it has been suggested that a positive correlation between BMI and BDNF concentration may exist in individuals that were obese or very underweight [50, 92–94].
At baseline, there was a clear relationship between the fasted serum BDNF level and cognitive performance, which was most marked between the lowest and highest serum BDNF groups. Previous analyses of existing clinical studies have reported significantly lower BDNF levels in patients with major depression [95, 96], schizophrenia [96], bipolar disorders [97] or autism spectrum disorders [98, 99]. Our data supports a relationship between BDNF and z-score (global cognitive score), suggesting that serum BDNF may be able to predict cognitive performance and could therefore present as a good biomarker for cognitive activity. However, the use of serum BDNF levels as a biomarker of global cognitive performance should be considered with caution as a wide range of BDNF levels in serum have been reported [87, 88, 101, 102] presumably reflecting the multitude of cellular sources of serum BDNF, including endothelial cells and the brain [87], and its ability to readily cross the blood–brain barrier in both directions [103, 104]. Moreover, studies have suggested that neuronal BDNF synthesis and secretion is influenced by several factors including exercise, stress and/or active learning and memory [105–108]. Despite this, we suggest that serum BDNF levels may represent a rapid, crude indication of an individual’s global cognitive performance, and therefore may present as a useful biomarker of cognitive outcomes in future research.
With regards to the diet-dependent changes in BDNF levels, we found a significant impact of high-flavonoid fruit and vegetable intake on serum BDNF levels over an 18-week period but no changes following low-flavonoid fruit and vegetable intake. It has been previously suggested that a flavonoid-mediated mechanism may impact on cognition, which in turn may affect the expression of BDNF [26]. In support of this, the intake of cocoa flavanols in this study also led to higher serum BDNF levels and better cognitive performance following 12 weeks of intake, relative to a well-matched, low flavanol control. Whilst this suggests a correlative relationship between BDNF levels and flavonoid-induced improvements in cognition, it is presently difficult to assign precise mechanisms, although it is assumed that circulating flavonoid metabolites may induce expression of BDNF, either within the brain, or in the periphery, via activation of intracellular MAP kinase and PI3 kinase signalling pathways [5, 12, 25, 109]. As discussed earlier, animal data have indicated that mutations within BDNF exons result in deficient memory and learning [39], whilst anthocyanin and flavanol intake has been shown to enhances spatial working memory with concurrent increases in both hippocampal CREB activity and BDNF levels [26]. I n vitro data suggest that such activity may proceed via flavonoid metabolite activation of the ERK pathway, leading to downstream CREB phosphorylation/activation [40–44]. Alternatively, flavonoid intake may induce BDNF expression in the periphery, for example from the endothelium, where it may influence vascular function [49, 110] or may cross the blood brain barrier as influence neuronal and glial cells directly.
In summary, the evidence from both trials suggests that diet-induced changes in BDNF levels seemingly reflect variations in cognitive performance in young and old subjects following high-flavonoid interventions. Thus, we suggest that changes in serum BDNF levels may be, in part, related to the mechanism by which flavonoids induce changes in global cognitive function. Future directions of this work highlights the potential to investigate the impact of age as a factor determining the magnitude of change in cognitive in response to flavonoid intake.
References
[1] | Rodriguez-Mateos A , Rendeiro C , Bergillos-Meca T , et al. Intake and time dependence of blueberry flavonoid-induced improvements in vascular function: A randomized, controlled, double-blind, crossover intervention study with mechanistic insights into biological activity. The American Journal of Clinical Nutrition. (2013) ;98: :1179–91. |
[2] | Heiss C , Dejam A , Kleinbongard P , et al. Vascular effects of cocoa rich in flavan-3-ols. JAMA. (2003) ;290: :1030–1. |
[3] | Taubert D , Roesen R , Lehmann C , et al. Effects of low habitual cocoa intake on blood pressure and bioactive nitric oxide. JAMA: The Journal of the American Medical Association. (2007) ;298: :49–60. |
[4] | Dower JI , Geleijnse JM , Gijsbers L , et al. Effects of the pure flavonoids epicatechin and quercetin on vascular function and cardiometabolic health: A randomized, double-blind, placebo-controlled, crossover trial. The American Journal of Clinical Nutrition. (2015) ;101: :914–21. |
[5] | Spencer JP . Food for thought: The role of dietary flavonoids in enhancing human memory, learning and neuro-cognitive performance. Proceedings of the Nutrition Society. (2008) ;67: :238–52. |
[6] | Hertog MGL , Feskens EJM , Kromhout D , et al. Dietary antioxidant flavonoids and risk of coronary heart disease: The Zutphen Elderly Study. The Lancet. (1993) ;342: :1007–11. |
[7] | Commenges D , Scotet V , Renaud S , et al. Intake of flavonoids and risk of dementia. European Journal of Epidemiology. (2000) ;16: :357–63. |
[8] | Devore EE , Kang JH , Breteler M , et al. Dietary intakes of berries and flavonoids in relation to cognitive decline. Annals of Neurology. (2012) ;72: :135–43. |
[9] | Unno K , Takabayashi F , Kishido T , et al. Suppressive effect of green tea catechins on morphologic and functional regression of the brain in aged mice with accelerated senescence (SAMP10). Experimental Gerontology. (2004) ;39: :1027–34. |
[10] | Haque AM , Hashimoto M , Katakura M , et al. Long-term administration of green tea catechins improves spatial cognition learning ability in rats. The Journal of Nutrition. (2006) ;136: :1043–7. |
[11] | Wang J , Ho L , Zhao W , et al. Grape-derived polyphenolics prevent Aß oligomerization and attenuate cognitive deterioration in a mouse model of Alzheimer’s disease. The Journal of Neuroscience. (2008) ;28: :6388–92. |
[12] | Spencer JP . The impact of fruit flavonoids on memory and cognition. British Journal of Nutrition. (2010) ;104: :S40–7. |
[13] | Sarkaki A , Farbood Y , Badavi M . The effect of grape seed extract (GSE) on spatial memory in aged male rats. Pakistan Journal of Medical Sciences. (2007) ;23: :561. |
[14] | Le Bars PL , Katz MM , Berman N , et al. A placebo-controlled, double-blind, randomized trial of an extract of Ginkgo biloba for dementia. JAMA. (1997) ;278: :1327–32. |
[15] | Francis S , Head K , Morris P , et al. The effect of flavanol-rich cocoa on the fMRI response to a cognitive task in healthy young people. Journal of Cardiovascular Pharmacology. (2006) ;47: :S215–20. |
[16] | Field DT , Williams CM , Butler LT . Consumption of cocoa flavanols results in an acute improvement in visual and cognitive functions. Physiology & Behavior. (2011) ;103: :255–60. |
[17] | Scholey AB , French SJ , Morris PJ , et al. Consumption of cocoa flavanols results in acute improvements in mood and cognitive performance during sustained mental effort. Journal of Psychopharmacology. (2010) ;24: (10):1505–14. |
[18] | Field DT , Williams CM , Butler LT . Consumption of cocoa flavanols results in an acute improvement in visual and cognitive functions. Physiology & Behavior. (2011) ;103: :255–60. |
[19] | Desideri G , Kwik-Uribe C , Grassi D , et al. Benefits in cognitive function, blood pressure, and insulin resistance through cocoa flavanol consumption in elderly subjects with mild cognitive impairment the cocoa, cognition, and aging (CoCoA) study. Hypertension. (2012) ;60: :794–801. |
[20] | Mastroiacovo D , Kwik-Uribe C , Grassi D , et al. Cocoa flavanol consumption improves cognitive function, blood pressure control, and metabolic profile in elderly subjects: The Cocoa, Cognition, and Aging (CoCoA) Study— a randomized controlled trial. The American Journal of Clinical Nutrition. (2015) ;101: :538–48. |
[21] | Park E , Edirisinghe I , Choy YY , et al. Effects of grape seed extract beverage on blood pressure and metabolic indices in individuals with pre-hypertension: A randomised, double-blinded, two-arm, parallel, placebo-controlled trial. British Journal of Nutrition. (2016) ;115: :226–38. |
[22] | Bensalem J , Dal-Pan A , Gillard E , et al. Protective effects of berry polyphenols against age-related cognitive impairment. Nutrition and Aging. (2016) ;3: :89–106. |
[23] | Youdim K , Shukitt-Hale B , Martin A , et al. Short-term dietary supplementation of blueberry polyphenolics: Beneficial effects on aging brain performance and peripheral tissue function. Nutr Neurosci. (2000) ;3: :383–97. |
[24] | Rendeiro C , Vauzour D , Rattray M , et al. Dietary levels of pure flavonoids improve spatial memory performance and increase hippocampal brain-derived neurotrophic factor. Plos One. (2013) ;8. |
[25] | Spencer JP . The impact of flavonoids on memory: Physiological and molecular considerations. Chemical Society Reviews. (2009) ;38: :1152–61. |
[26] | Williams CM , El Mohsen MA , Vauzour D , et al. Blueberry-induced changes in spatial working memory correlate with changes in hippocampal CREB phosphorylation and brain-derived neurotrophic factor (BDNF) levels. Free Radical Biology and Medicine. (2008) ;45: :295–305. |
[27] | Lu Y , Christian K , Lu B . BDNF: A key regulator for protein synthesis-dependent LTP and long-term memory? Neurobiology of Learning and Memory. (2008) ;89: :312–23. |
[28] | Bekinschtein P , Cammarota M , Igaz LM , et al. Persistence of long-term memory storage requires a late protein synthesis-and BDNF-dependent phase in the hippocampus. Neuron. (2007) ;53: :261–77. |
[29] | Bekinschtein P , Cammarota M , Katche C , et al. BDNF is essential to promote persistence of long-term memory storage. Proceedings of the National Academy of Sciences. (2008) ;105: :2711–6. |
[30] | Aloe L , Fiore M , Santucci D , et al. Effect of hypergravity on the mouse basal expression of NGF and BDNF in the retina, visual cortex and geniculate nucleus: Correlative aspects with NPY immunoreactivity. Neuroscience Letters. (2001) ;302: :29–32. |
[31] | Donovan MJ , Lin MI , Wiegn P , et al. Brain derived neurotrophic factor is an endothelial cell survival factor required for intramyocardial vessel stabilization. Development. (2000) ;127: :4531–40. |
[32] | Mitoma M , Yoshimura R , Sugita A , et al. Stress at work alters serum brain-derived neurotrophic factor (BDNF) levels and plasma 3-methoxy-4-hydroxyphenylglycol (MHPG) levels in healthy volunteers: BDNF and MHPG as possible biological markers of mental stress? Progress in Neuro-Psychopharmacology and Biological Psychiatry (2008) ;32: :679–85. |
[33] | Kermani P , Hempstead B . Brain-derived neurotrophic factor: A newly described mediator of angiogenesis. Trends in Cardiovascular Medicine. (2007) ;17: :140–43. |
[34] | Hashimoto K , Shimizu E , Iyo M . Critical role of brain-derived neurotrophic factor in mood disorders. Brain Research Reviews. (2004) ;45: :104–14. |
[35] | Lindvall O , Kokaia Z , Bengzon J , et al. Neurotrophins and brain insults. Trends in Neurosciences. (1994) ;17: :490–6. |
[36] | McAllister AK , Katz LC , Lo DC . Neurotrophins and synaptic plasticity. Annual Review of Neuroscience. (1999) ;22: :295–318. |
[37] | Smith MA . Hippocampal vulnerability to stress and aging: Possible role of neurotrophic factors. Behavioural Brain Research. (1996) ;78: :25–36. |
[38] | Tang SW , Chu E , Hui T , et al. Influence of exercise on serum brain-derived neurotrophic factor concentrations in healthy human subjects. Neuroscience Letters. (2008) ;431: :62–5. |
[39] | Zheng F , Zhou X , Moon C , et al. Regulation of brain-derived neurotrophic factor expression in neurons. Int J Physiol Pathophysiol Pharmacol. (2012) ;4: :188–200. |
[40] | Schroeter H , Bahia P , Spencer JP , et al. (-) Epicatechin stimulates ERK-dependent cyclic AMP response element activity and up-regulates GluR2 in cortical neurons. Journal of Neurochemistry. (2007) ;101: :1596–606. |
[41] | Vauzour D , Vafeiadou K , Rodriguez-Mateos A , et al. The neuroprotective potential of flavonoids: A multiplicity of effects. Genes & Nutrition. (2008) ;3: :115–26. |
[42] | Maher P , Akaishi T , Abe K . Flavonoid fisetin promotes ERK-dependent long-term potentiation and enhances memory. Proceedings of the National Academy of Sciences. (2006) ;103: :16568–73. |
[43] | Spencer JP , Rice-Evans C , Williams RJ . Modulation of pro-survival Akt/protein kinase B and ERK1/2 signaling cascades by quercetin and its in vivo metabolites underlie their action on neuronal viability. Journal of Biological Chemistry. (2003) ;278: :34783–93. |
[44] | Schroeter H , Spencer JPE , Rice-Evans C , et al. Flavonoids protect neurons from oxidized low-density-lipoprotein-induced apoptosis involving c-Jun N-terminal kinase (JNK), c-Jun and caspase-3. Biochemical Journal. (2001) ;358: :547–57. |
[45] | Erickson KI , Miller DL , Roecklein KA . The aging hippocampus interactions between exercise, depression, and BDNF. The Neuroscientist. (2012) ;18: :82–97. |
[46] | Vinogradov S , Fisher M , Holland C , et al. Is Serum Brain-Derived Neurotrophic Factor a Biomarker for Cognitive Enhancement in Schizophrenia? Biological Psychiatry (2009) ;66: :549–53. |
[47] | Martinowich K , Manji H , Lu B . New insights into BDNF function in depression and anxiety. Nature Neuroscience. (2007) ;10: :1089–93. |
[48] | Brunoni AR , Lopes M , Fregni F . A systematic review and meta-analysis of clinical studies on major depression and BDNF levels: Implications for the role of neuroplasticity in depression. International Journal of Neuropsychopharmacology. (2008) ;11: :1169–80. |
[49] | Nakahashi T , Fujimura H , Altar CA , et al. Vascular endothelial cells synthesize and secrete brain-derived neurotrophic factor. FEBS Letters. (2000) ;470: :113–7. |
[50] | Trajkovska V , Marcussen AB , Vinberg M , et al. Measurements of brain-derived neurotrophic factor: Methodological aspects and demographical data. Brain Research Bulletin. (2007) ;73: :143–9. |
[51] | Chong MF , George TW , Alimbetov D , et al. Impact of the quantity and flavonoid content of fruits and vegetables on markers of intake in adults with an increased risk of cardiovascular disease: The FLAVURS trial. European Journal of Nutrition. (2013) ;52: :361–78. |
[52] | Macready AL , George TW , Chong MF , et al. Flavonoid-rich fruit and vegetables improve microvascular reactivity and inflammatory status in men at risk of cardiovascular disease— FLAVURS: A randomized controlled trial. The American Journal of Clinical Nutrition, AJCN. (2014) ;074237. |
[53] | Macready AL , George TW , Chong MF , et al. Flavonoid-rich fruit and vegetables improve microvascular reactivity and inflammatory status in men at risk of cardiovascular disease–FLAVURS: A randomized controlled trial. The American Journal of Clinical Nutrition. (2014) ;99: :479–89. |
[54] | Group FSR. USDA Food and nutrient database for dietary studies, 3.0. Beltsville, MD: US Department of Agriculture. Agricultural Research Service. (2008) . |
[55] | Garavan H , Ross T , Stein E . Right hemispheric dominance of inhibitory control: An event-related functional MRI study. Proceedings of the National Academy of Sciences. (1999) ;96: :8301–6. |
[56] | Bokura H , Yamaguchi S , Kobayashi S . Electrophysiological correlates for response inhibition in a Go/NoGo task. Clinical Neurophysiology. (2001) ;112: :2224–32. |
[57] | Hester R , Fassbender C , Garavan H . Individual differences in error processing: A review and reanalysis of three event-related fMRI studies using the GO/NOGO task. Cerebral Cortex. (2004) ;14: :986–94. |
[58] | Stroop JR . Studies of interference in serial verbal reactions. Journal of Experimental Psychology. (1935) ;18: :643. |
[59] | Stroop JA . Hand held computer cursor controller and command input device: Google Patents (1996) . |
[60] | Miyake A , Friedman NP , Emerson MJ , et al. The unity and diversity of executive functions and their contributions to complex “frontal lobe” tasks: A latent variable analysis. Cognitive Psychology. (2000) ;41: :49–100. |
[61] | Reitan R . Trail making manual for administration, scoring, and interpretation. Department of Neurology, Section of Neuropsychology, Indiana University Medical Center, Indianapolis. (1958) . |
[62] | Gaudino EA , Geisler MW , Squires NK . Construct validity in the Trail Making Test: What makes Part B harder? Journal of Clinical and Experimental Neuropsychology. (1995) ;17: :529–35. |
[63] | Arbuthnott K , Frank J . Trail making test, part B as a measure of executive control: Validation using a set-switching paradigm. Journal of Clinical and Experimental Neuropsychology. (2000) ;22: :518–28. |
[64] | Sanchez-Cubillo I , Perianez J , Adrover-Roig D , et al. Construct validity of the Trail Making Test: Role of task-switching, working memory, inhibition/interference control, and visuomotor abilities. Journal of the International Neuropsychological Society. (2009) ;15: :438–. |
[65] | Morris N , Jones DM . Memory updating in working memory: The role of the central executive. British Journal of Psychology. (1990) ;81: :111–21. |
[66] | Salmon E , Van der Linden M , Collette F , et al. Regional brain activity during working memory tasks. Brain. (1996) ;119: :1617–25. |
[67] | Morris RG , Baddeley AD . Primary and working memory functioning in Alzheimer-type dementia. Journal of Clinical and Experimental Neuropsychology. (1988) ;10: :279–96. |
[68] | Delis DC , Freeland J , Kramer JH , et al. Integrating clinical assessment with cognitive neuroscience: Construct validation of the California Verbal Learning Test. Journal of Consulting and Clinical Psychology. (1988) ;56: :123. |
[69] | Dominique J-F , Roozendaal B , Nitsch RM , et al. Acute cortisone administration impairs retrieval of long-term declarative memory in humans. Nature Neuroscience. (2000) ;3: :313–4. |
[70] | Hayman M . Two minute clinical test for measurement of intellectual impairment in psychiatric disorders. Archives of Neurology & Psychiatry. (1942) ;47: :454–64. |
[71] | Folstein MF , Folstein SE , McHugh PR . “Mini-mental state”: A practical method for grading the cognitive state of patients for the clinician. Journal of Psychiatric Research. (1975) ;12: :189–98. |
[72] | Tombaugh TN , McIntyre NJ . The mini-mental state examination: A comprehensive review. Journal of the American Geriatrics Society. (1992) ;40: :922–35. |
[73] | Escobar JI , Burnam A , Karno M , et al. Use of the Mini-Mental State Examination (MMSE) in a community population of mixed ethnicity: Cultural and linguistic artifacts. The Journal of Nervous and Mental Disease. (1986) ;174: :607–14. |
[74] | Zuffante P , Leonard CM , Kuldau JM , et al. Working memory deficits in schizophrenia are not necessarily specific or associated with MRI-based estimates of area 46 volumes. Psychiatry Research: Neuroimaging. (2001) ;108: :187–209. |
[75] | Roediger HL , Weldon MS , Stadler ML , et al. Direct comparison of two implicit memory tests: Word fragment and word stem completion. Journal of Experimental Psychology: Learning, Memory, and Cognition. (1992) ;18: :1251–. |
[76] | Wechsler D . Wechsler memory scale. (1945) . |
[77] | Wechsler D . Wais-r manual. New York: Psychological Corporation (1981) . |
[78] | McLeod DR , Griffiths RR , Bigelow GE , et al. An automated version of the digit symbol substitution test (DSST). Behavior Research Methods & Instrumentation. (1982) ;14: :463–6. |
[79] | Coull J , Frith C , Frackowiak RSJ , et al. A fronto-parietal network for rapid visual information processing: A PET study of sustained attention and working memory. Neuropsychologia. (1996) ;34: :1085–95. |
[80] | Radka SF , Hoist PA , Fritsche M , et al. Presence of brain-derived neurotrophic factor in brain and human and rat but not mouse serum detected by a sensitive and specific immunoassay. Brain Research. (1996) ;709: :122–30. |
[81] | Fujimura H , Altar CA , Chen R , et al. Brain-derived neurotrophic factor is stored in human platelets and released by agonist stimulation. Thrombosis and Haemostasis-Stuttgart-. (2002) ;87: :728–34. |
[82] | Karege F , Bondolfi G , Gervasoni N , et al. Low brain-derived neurotrophic factor (BDNF) levels in serum of depressed patients probably results from lowered platelet BDNF release unrelated to platelet reactivity. Biological Psychiatry. (2005) ;57: :1068–72. |
[83] | Dangour AD , Allen E , Elbourne D , et al. Effect of 2-yn- 3 long-chain polyunsaturated fatty acid supplementation on cognitive function in older people: A randomized, double-blind, controlled trial. The American Journal of Clinical Nutrition. (2010) ;91: :1725–32. |
[84] | Durga J , van Boxtel MP , Schouten EG , et al. Effect of 3-year folic acid supplementation on cognitive function in older adults in the FACIT trial: A randomised, double blind, controlled trial. The Lancet. (2007) ;369: :208–16. |
[85] | Ziegenhorn AA , Schulte-Herbrüggen O , Danker-Hopfe H , et al. Serum neurotrophins—a study on the time course and influencing factors in a large old age sample. Neurobiology of Aging. (2007) ;28: :1436–45. |
[86] | Chan KL , Tong KY , Yip SP . Relationship of serum brain-derived neurotrophic factor (BDNF) and health-related lifestyle in healthy human subjects. Neuroscience Letters. (2008) ;447: :124–8. |
[87] | Lommatzsch M , Zingler D , Schuhbaeck K , et al. The impact of age, weight and gender on BDNF levels in human platelets and plasma. Neurobiology of Aging. (2005) ;26: :115–23. |
[88] | Karege F , Perret G , Bondolfi G , et al. Decreased serum brain-derived neurotrophic factor levels in major depressed patients. Psychiatry Research. (2002) ;109: :143–8. |
[89] | Rage F , Silhol M , Binamé F , et al. Effect of aging on the expression of BDNF and TrkB isoforms in rat pituitary. Neurobiology of Aging. (2007) ;28: :1088–98. |
[90] | Webster MJ , Weickert CS , Herman MM , et al. BDNF mRNA expression during postnatal development, maturation and aging of the human prefrontal cortex. Developmental Brain Research. (2002) ;139: :139–150. |
[91] | Lang UE , Hellweg R , Gallinat J . BDNF serum concentrations in healthy volunteers are associated with depression-related personality traits. Neuropsychopharmacology: Official Publication of the American College of Neuropsychopharmacology. (2004) ;29: :795–8. |
[92] | Chiaretti A , Piastra M , Polidori G , et al. Correlation between neurotrophic factor expression and outcome of children with severe traumatic brain injury. Intensive Care Medicine. (2003) ;29: :1329–38. |
[93] | El-Gharbawy AH , Adler-Wailes DC , Mirch MC , et al. Serum brain-derived neurotrophic factor concentrations in lean and overweight children and adolescents. The Journal of Clinical Endocrinology & Metabolism. (2006) ;91: :3548–52. |
[94] | Nakazato M , Hashimoto K , Shimizu E , et al. Decreased levels of serum brain-derived neurotrophic factor in female patients with eating disorders. Biological Psychiatry. (2003) ;54: :485–90. |
[95] | Sen S , Duman R , Sanacora G . Serum brain-derived neurotrophic factor, depression, and antidepressant medications: Meta-analyses and implications. Biological Psychiatry. (2008) ;64: :527–32. |
[96] | Molendijk M , Spinhoven P , Polak M , et al. Serum BDNF concentrations as peripheral manifestations of depression: Evidence from a systematic review and meta-analyses on 179 associations (N = = 9484). Molecular Psychiatry (2014) ;19: :791–800. |
[97] | Fernandes BS , Gama CS , Ceresér KM , et al. Brain-derived neurotrophic factor as a state-marker of mood episodes in bipolar disorders: A systematic review and meta-regression analysis. Journal of Psychiatric Research. (2011) ;45: :995–1004. |
[98] | Hashimoto K , Iwata Y , Nakamura K , et al. Reduced serum levels of brain-derived neurotrophic factor in adult male patients with autism. Progress in Neuro-Psychopharmacology and Biological Psychiatry. (2006) ;30: :1529–31. |
[99] | Katoh-Semba R , Wakako R , Komori T , et al. Age-related changes in BDNF protein levels in human serum: Differences between autism cases and normal controls. International Journal of Developmental Neuroscience. (2007) ;25: :367–72. |
[100] | Park S , Cho S-C , Hong Y-C , et al. Association between dietary behaviors and attention-deficit/hyperactivity disorder and learning disabilities in school-aged children. Psychiatry Research. (2012) ;198: :468–76. |
[101] | Karege F , Schwald M , Cisse M . Postnatal developmental profile of brain-derived neurotrophic factor in rat brain and platelets. Neuroscience Letters. (2002) ;328: :261–4. |
[102] | Toyooka K , Asama K , Watanabe Y , et al. Decreased levels of brain-derived neurotrophic factor in serum of chronic schizophrenic patients. Psychiatry Research. (2002) ;110: :249–57. |
[103] | Pan W , Banks WA , Fasold MB , et al. Transport of brain-derived neurotrophic factor across the blood– brain barrier. Neuropharmacology. (1998) ;37: :1553–61. |
[104] | Poduslo JF , Curran GL . Permeability at the blood-brain and blood-nerve barriers of the neurotrophic factors: NGF, CNTF, NT-3, BDNF. Molecular Brain Research. (1996) ;36: :280–6. |
[105] | Hall J , Thomas KL , Everitt BJ . Rapid and selective induction of BDNF expression in the hippocampus during contextual learning. Nature Neuroscience. (2000) ;3: :533–5. |
[106] | Neeper SA , Gómez-Pinilla F , Choi J , et al. Physical activity increases mRNA for brain-derived neurotrophic factor and nerve growth factor in rat brain. Brain Research. (1996) ;726: :49–56. |
[107] | Smith MA , Makino S , Kvetňanský R , et al. Effects of stress on neurotrophic factor expression in the rat brain. Annals of the New York Academy of Sciences. (1995) ;771: :234–9. |
[108] | Smith MA , Makino S , Kim S , et al. Stress increases brain-derived neurotropic factor messenger ribonucleic acid in the hypothalamus and pituitary. Endocrinology. (1995) ;136: :3743–50. |
[109] | Spencer JPE , Vauzour D , Rendeiro C . Flavonoids and cognition: The molecular mechanisms underlying their behavioural effects. Archives of Biochemistry and Biophysics. (2009) ;492: :1–9. |
[110] | Donovan MJ , Miranda RC , Kraemer R , et al. Neurotrophin and neurotrophin receptors in vascular smooth muscle cells: Regulation of expression in response to injury. The American Journal of Pathology. (1995) ;147: :309. |
Figures and Tables
Fig.1
Correlation between serum BDNF and age: (A) correlation between BDNF and age for individuals up to 65 years; (B) BDNF and age ages 65–90 years; C: Whisker Plot showing tertiles of age against serum BDNF levels at baseline. A one-way analysis of variance indicated that the 3 means were significantly different from each other (P < 0.001). Post hoc analysis, using a Bonferroni multiple comparison test, indicated that the 51–65 group had significantly higher serum BDNF levels compared to the 35–50 age group (a: p < 0.01), whilst the 66–90 group had significantly lower BDNF levels than the 35–50 group (b: p < 0.05) and the 51–65 group (c: p < 0.001). Horizontal lines within bars indicates mean level and bars indicates 25–75% distribution; Error lines indicate the min and max serum BDNF levels measured.
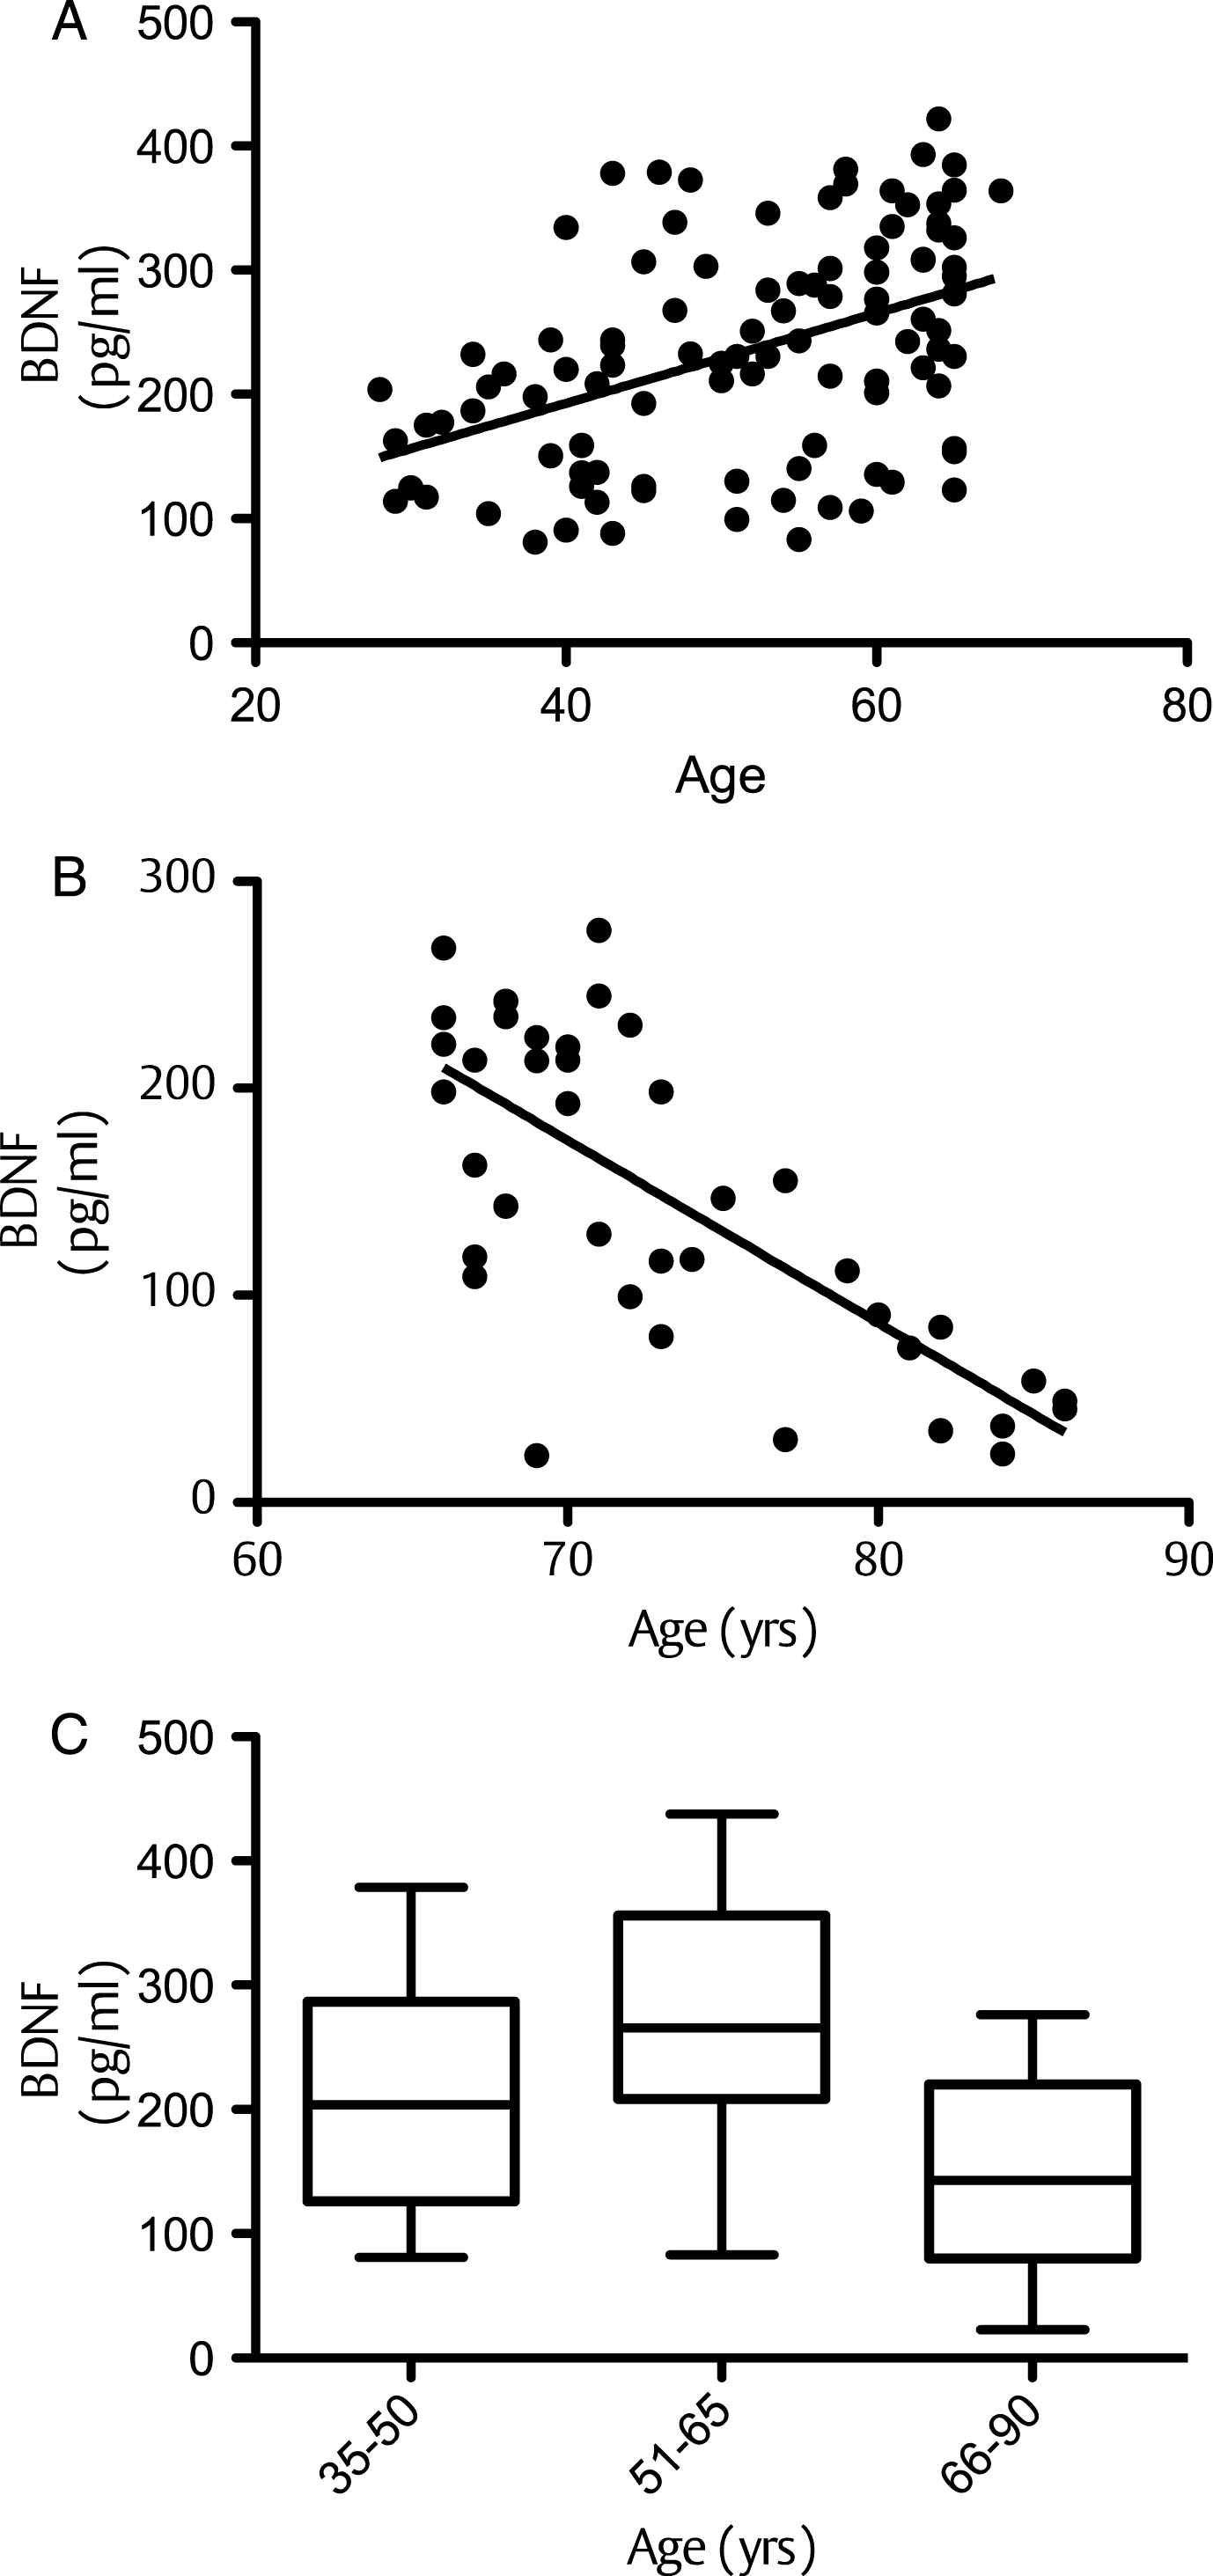
Fig.2
Corellation of BDNF with anthopometric measures: (A) Serum BDNF levels measured in males and females at baseline. (B) Correlation of BDNF level with Systolic Blood Pressure (SBP) and Diastolic Blood Pressure (DBP). Mean serum BDNF levels showed a trend to be higher in males compared to females (p = 0.056), whilst no significant differences between BDNF level and either SBP (p > 0.05) or DBP (p > 0.05) were observed.
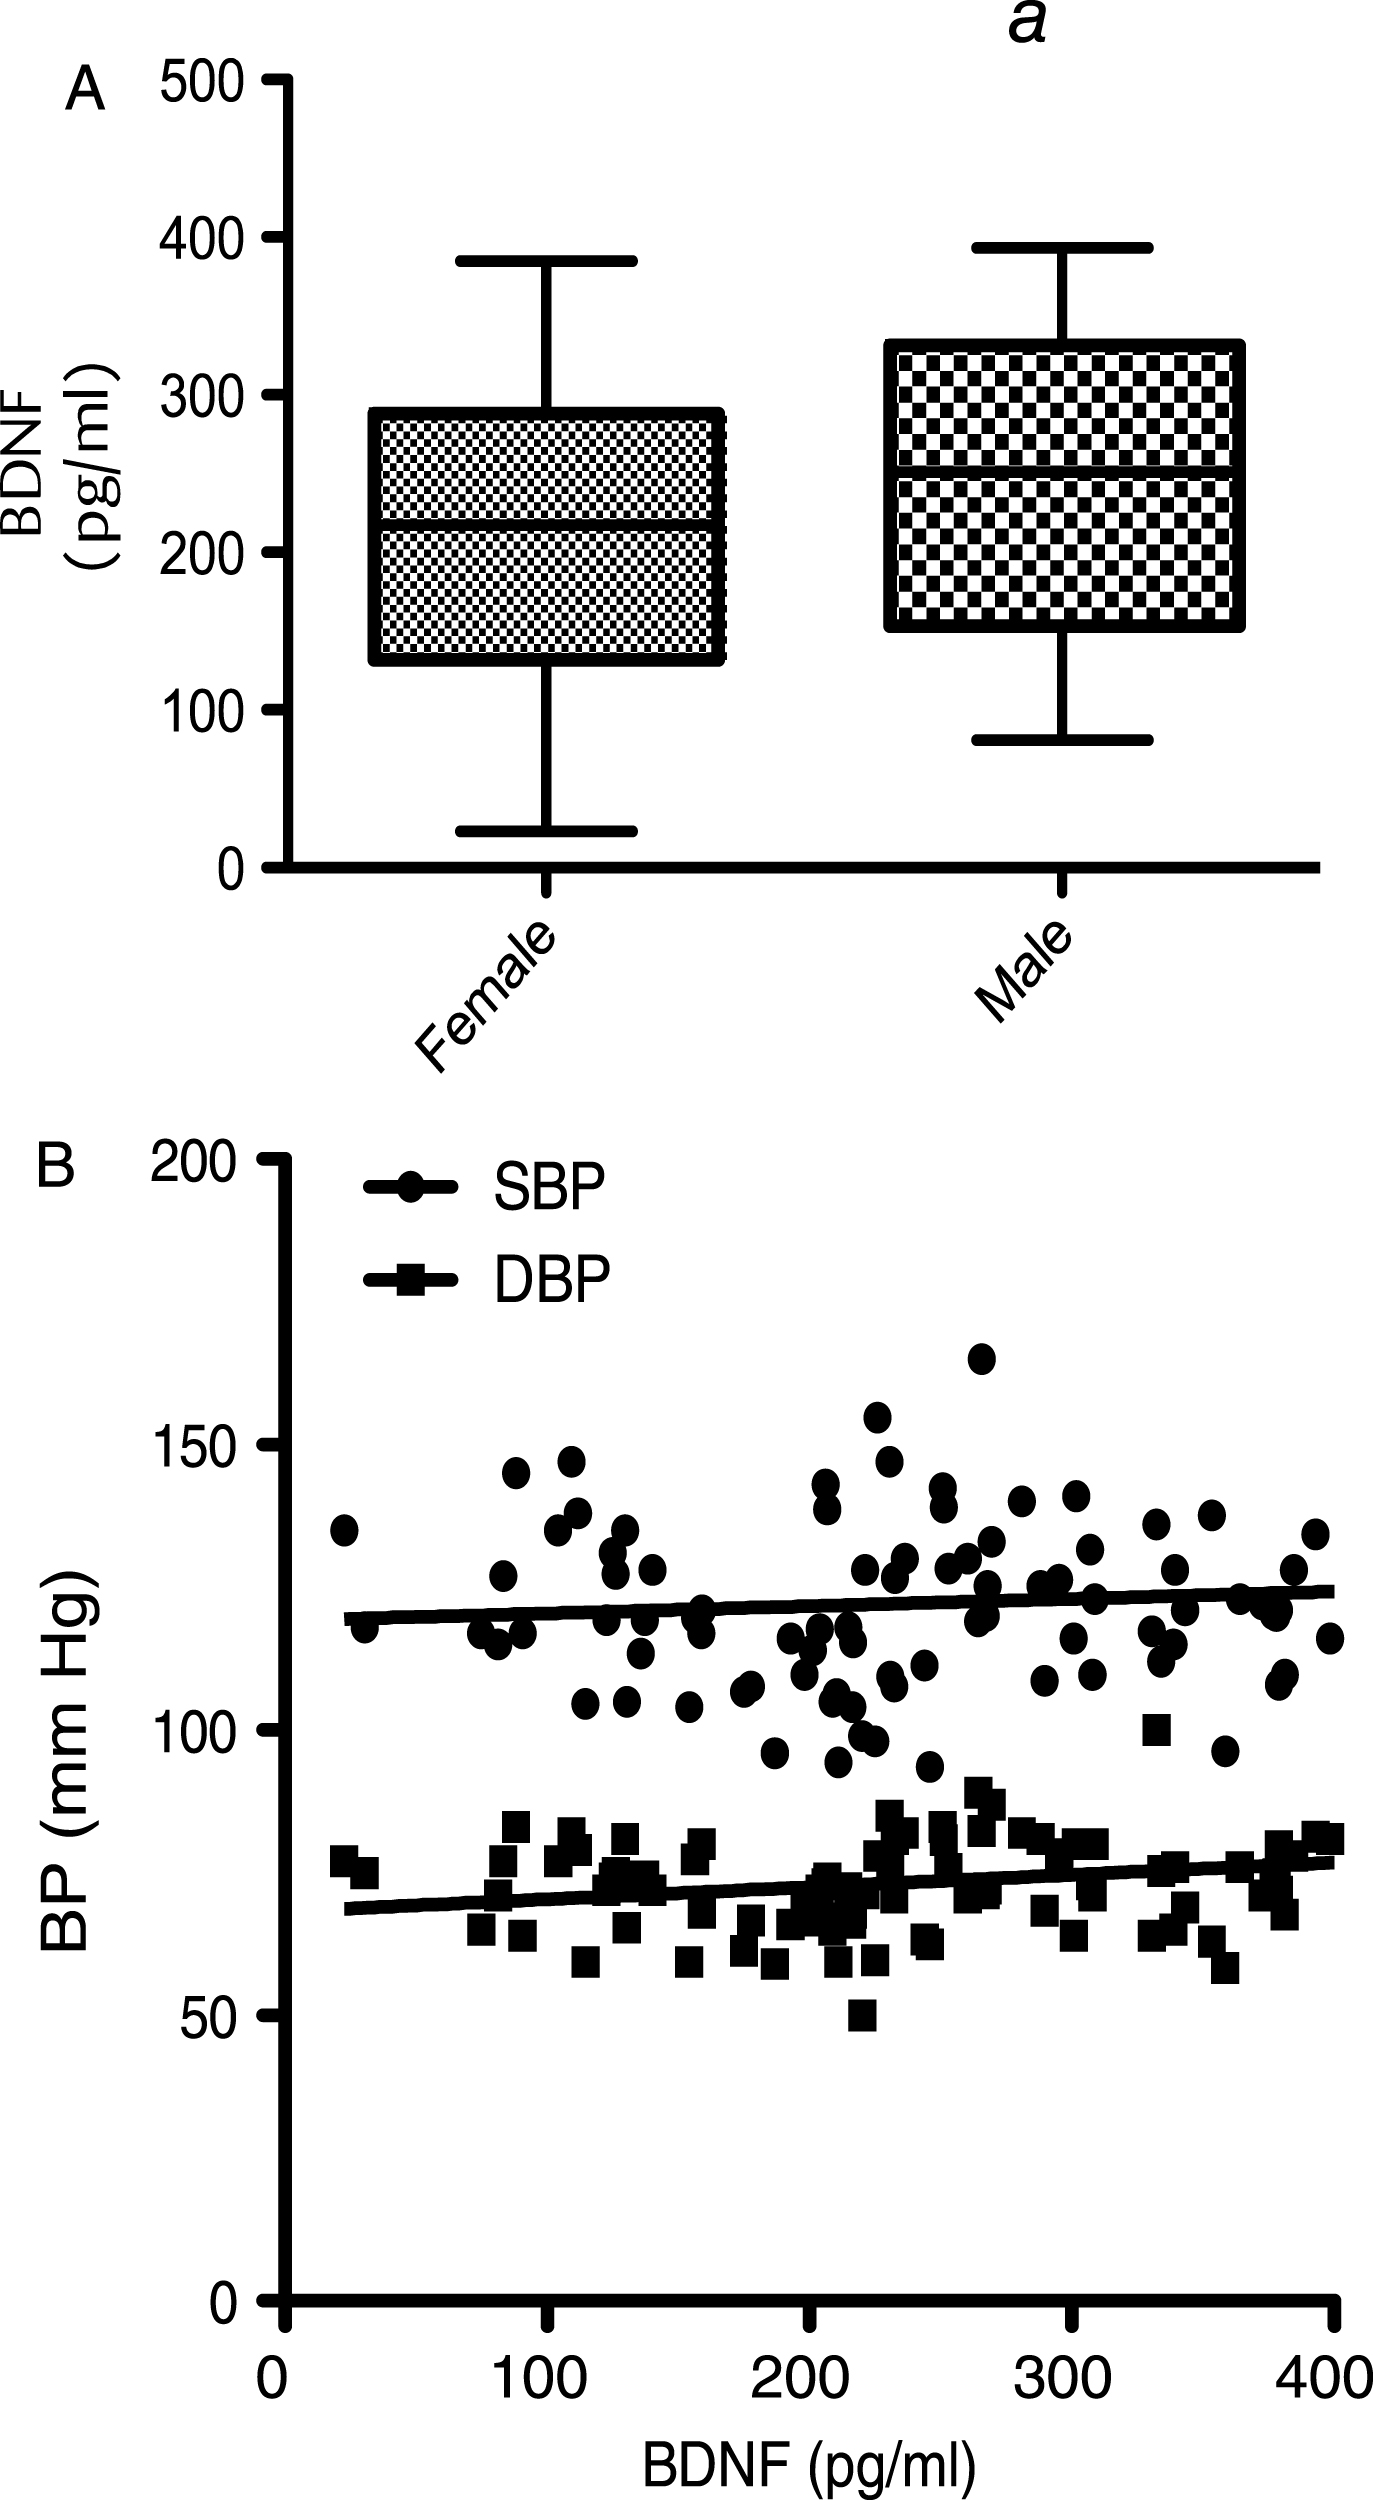
Fig.3
Corellation of BDNF with bidy mass index (BMI; panel A) and waist circumferance (WC; panel B). No signitivent correlations were observed (p > 0.05; n = 112)
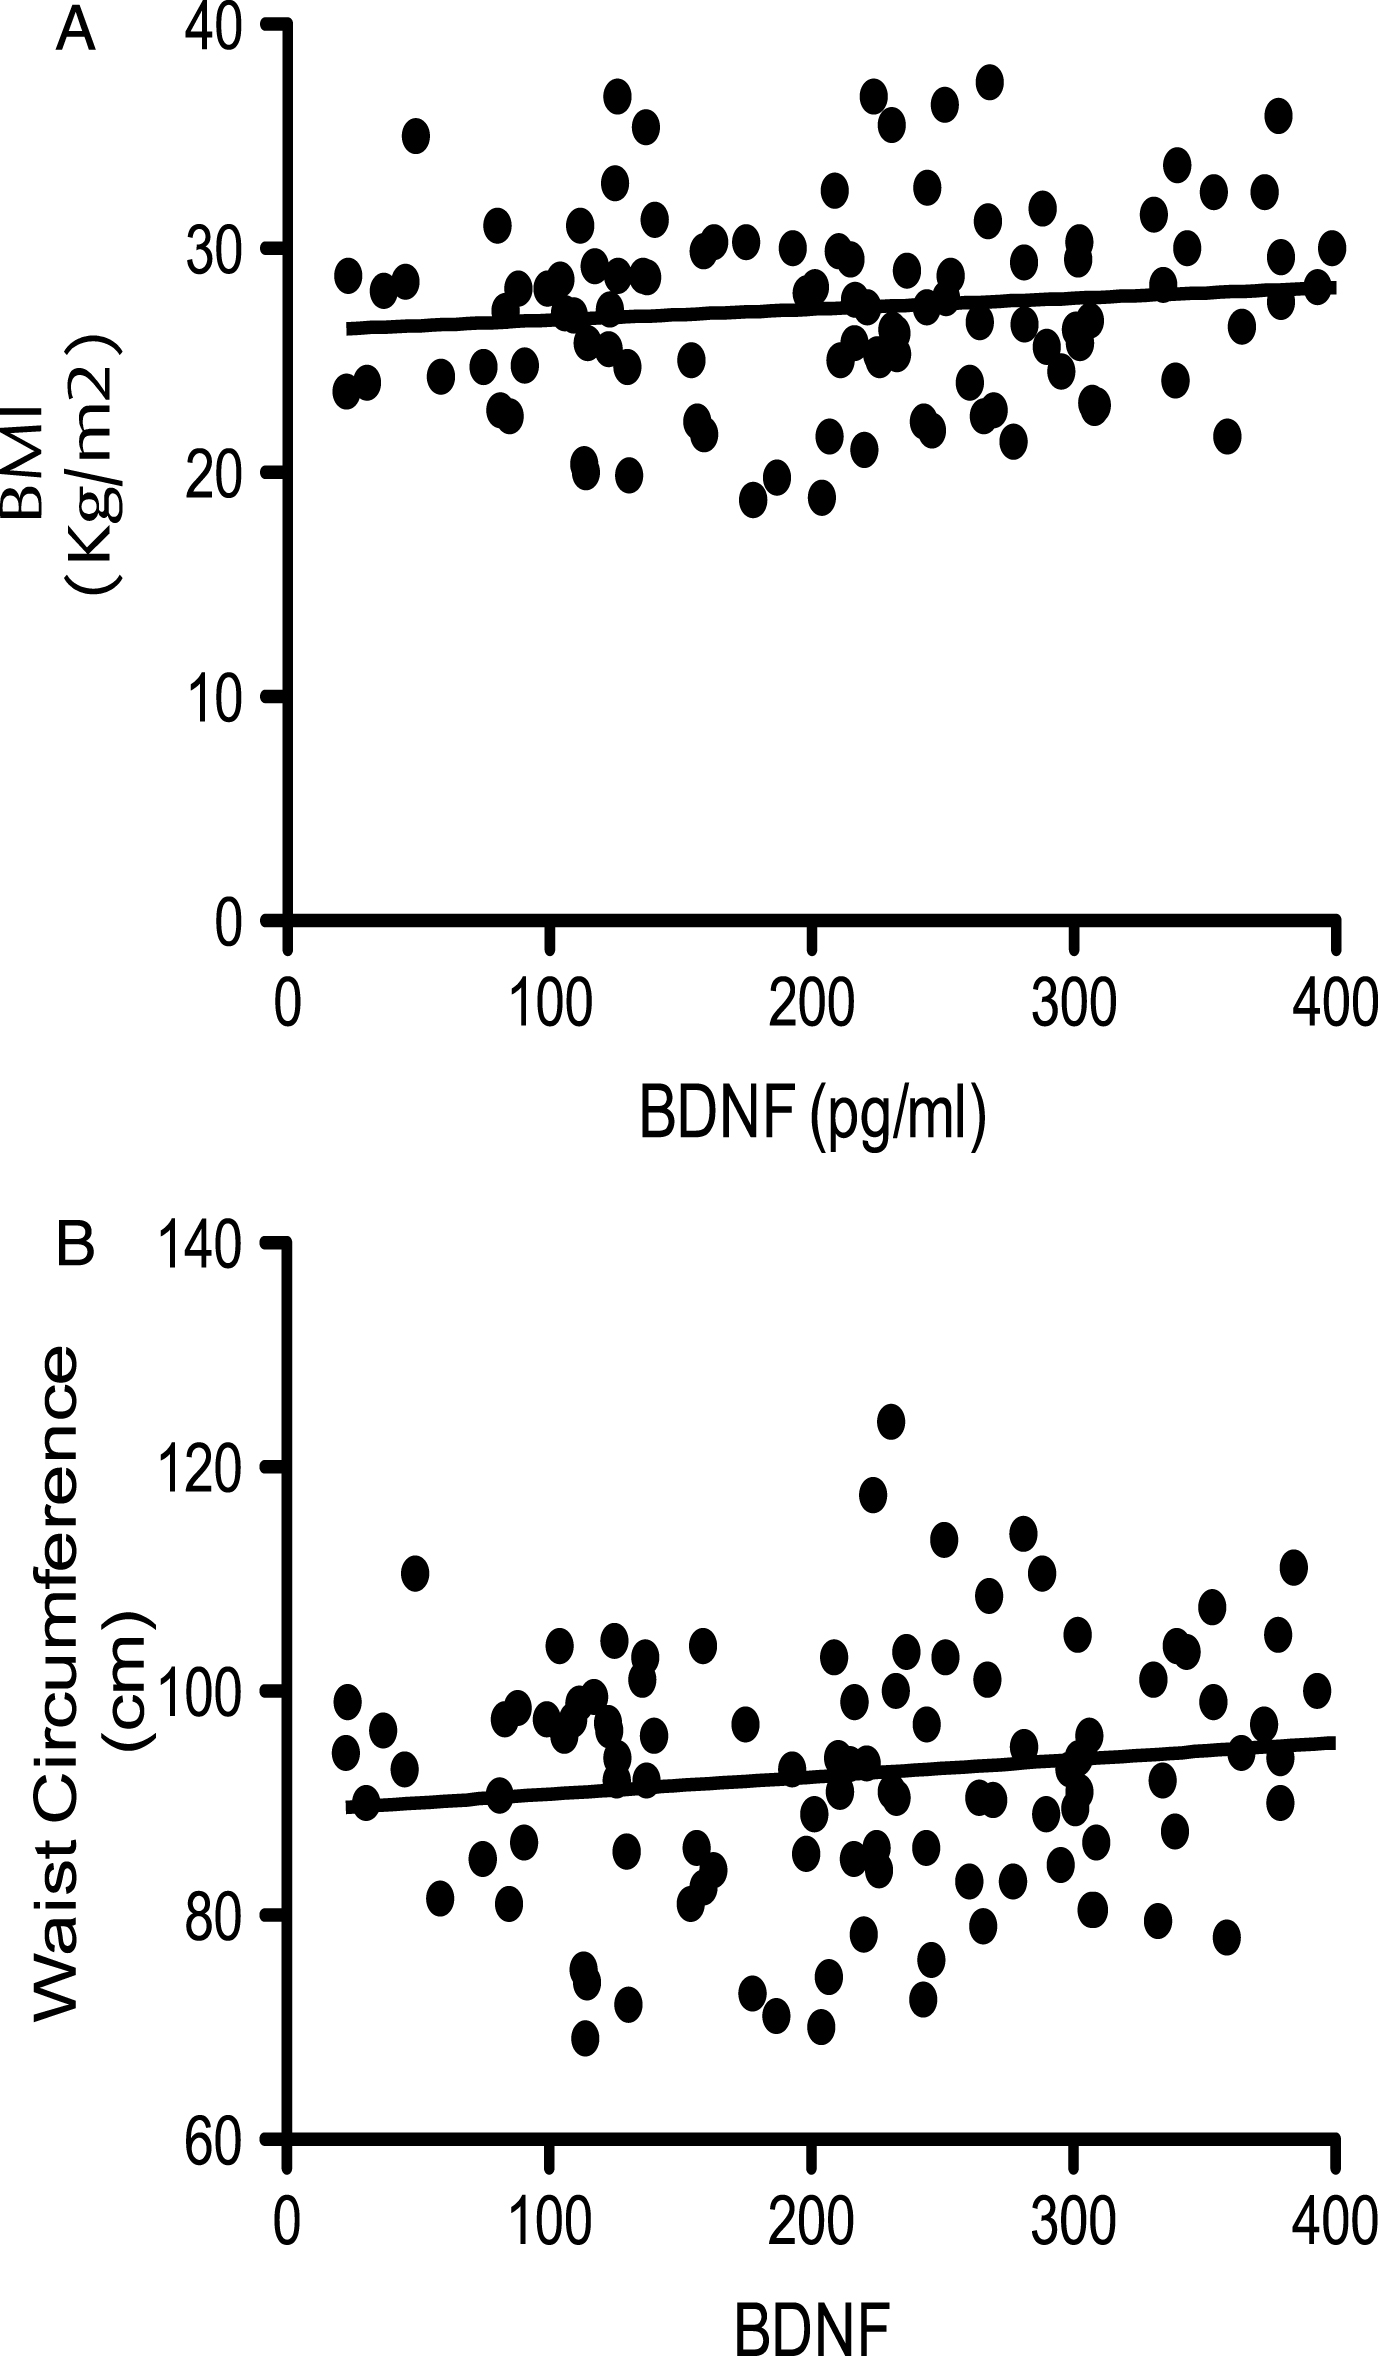
Fig.4
A) The relationship between Cognitive score (z-score) in 3 dietary groups over the period of 12 weeks. B) The relationship between BDNF level and z-score (cognitive score) Each point represents a dietary group at a specific visit and is an average of their z score and BDNF level for each. Hence there are 12 points.
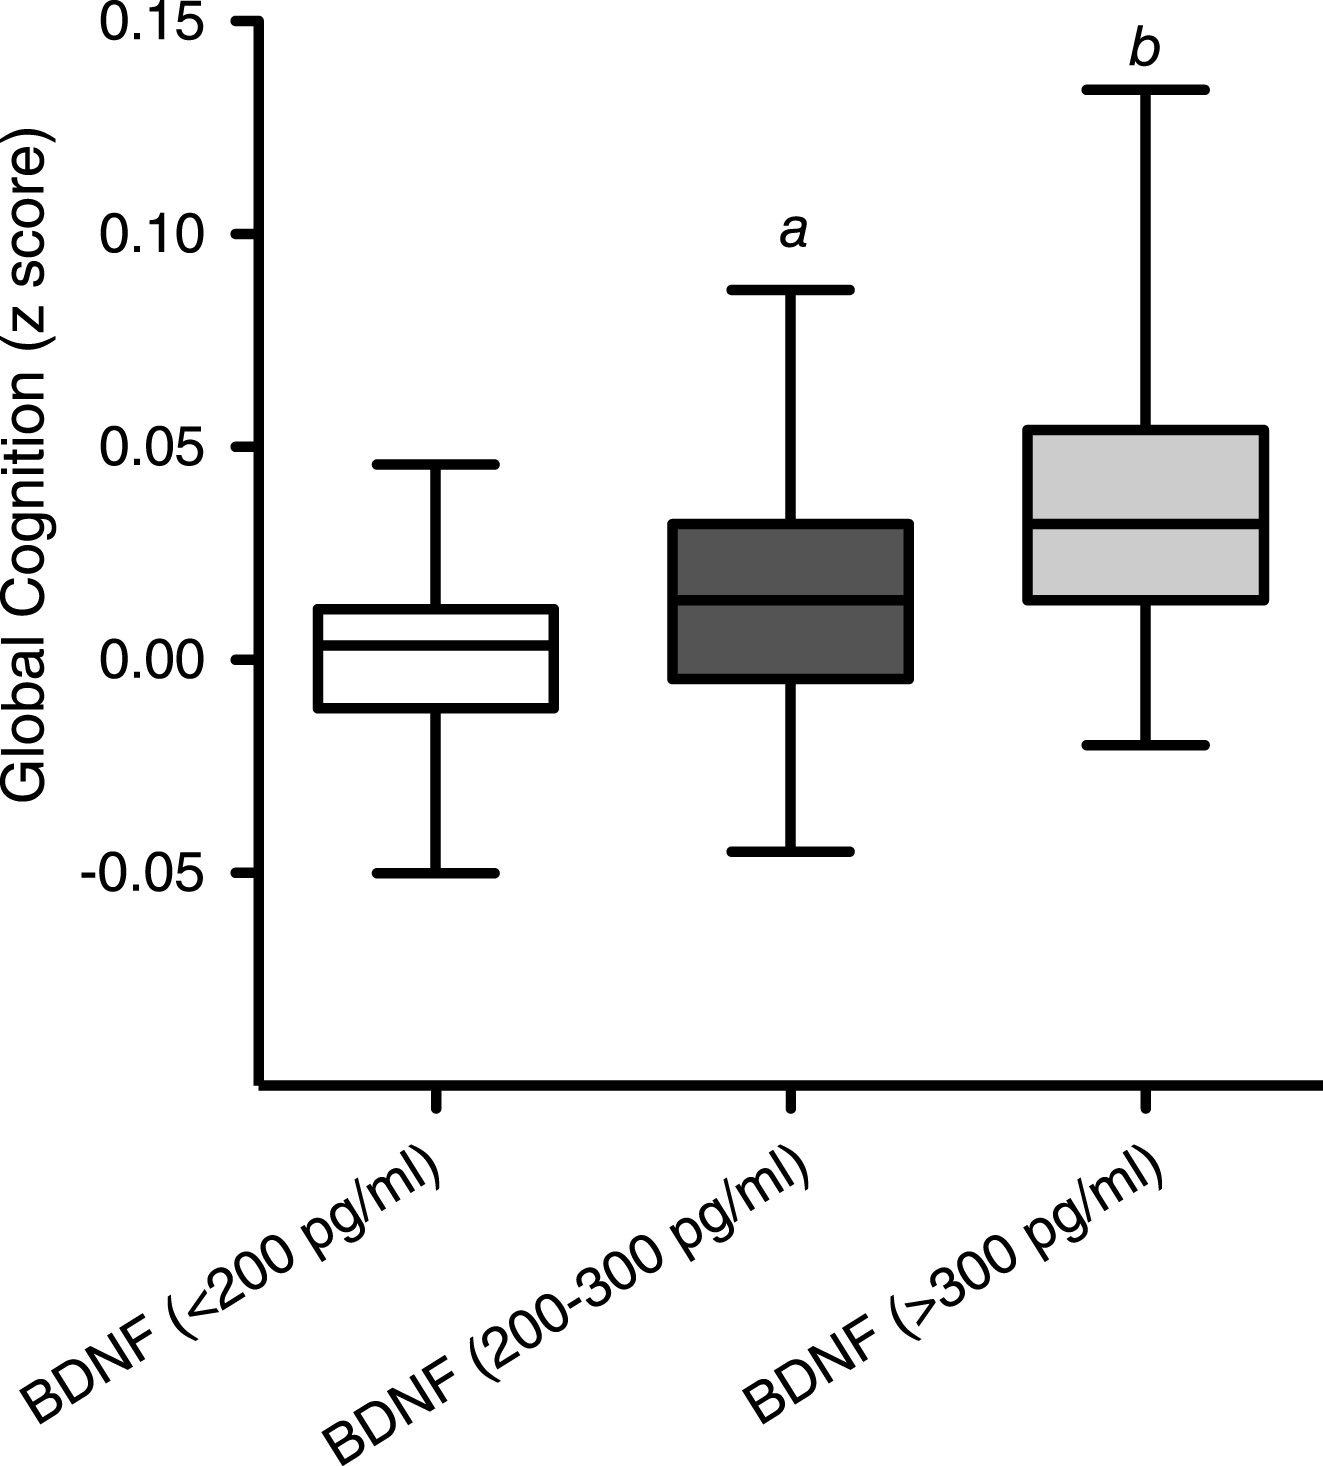
Fig.5
Influence of fruit and vegetable intake on cognition and BDNF. (A) Time-course of changes in cognitive function following consumption of high flavonoid F&Vs; low flavonoid F&Vs; and after following habitual diet (Control). Data were analyzed using two-way repeated measures ANOVA with time and treatment as the two factors (significant effect of time (p = 0.003), treatment (p = 0.069) and an interaction (p = 0.033) between dietary intake and cognitive performance. Post hoc analysis, (Bonferroni) indicated significantly greater cognitive performance at both 8 (***p < 0.001) and 12 weeks (**p < 0.01), relative to both habitual diet (control) and LF F&V intake. (B) Impact of fruit and vegetable intake on serum BDNF levels. A two way ANOVA with repeated measures indicated significant time (p = 0.008), treatment (P < 0.005) and an interaction (p = 0.026) between serum BDNF and dietary intake across the 12 weeks. Post hoc analysis indicated a significantly higher serum BDNF level at 12 weeks in the HF F&V group, relative to the habitual diet (control) group (**p < 0.001). Details of the high and low classification of F&V are outlined in the Materials and Methods section. All data are plotted as mean values±SEM (n = 112).
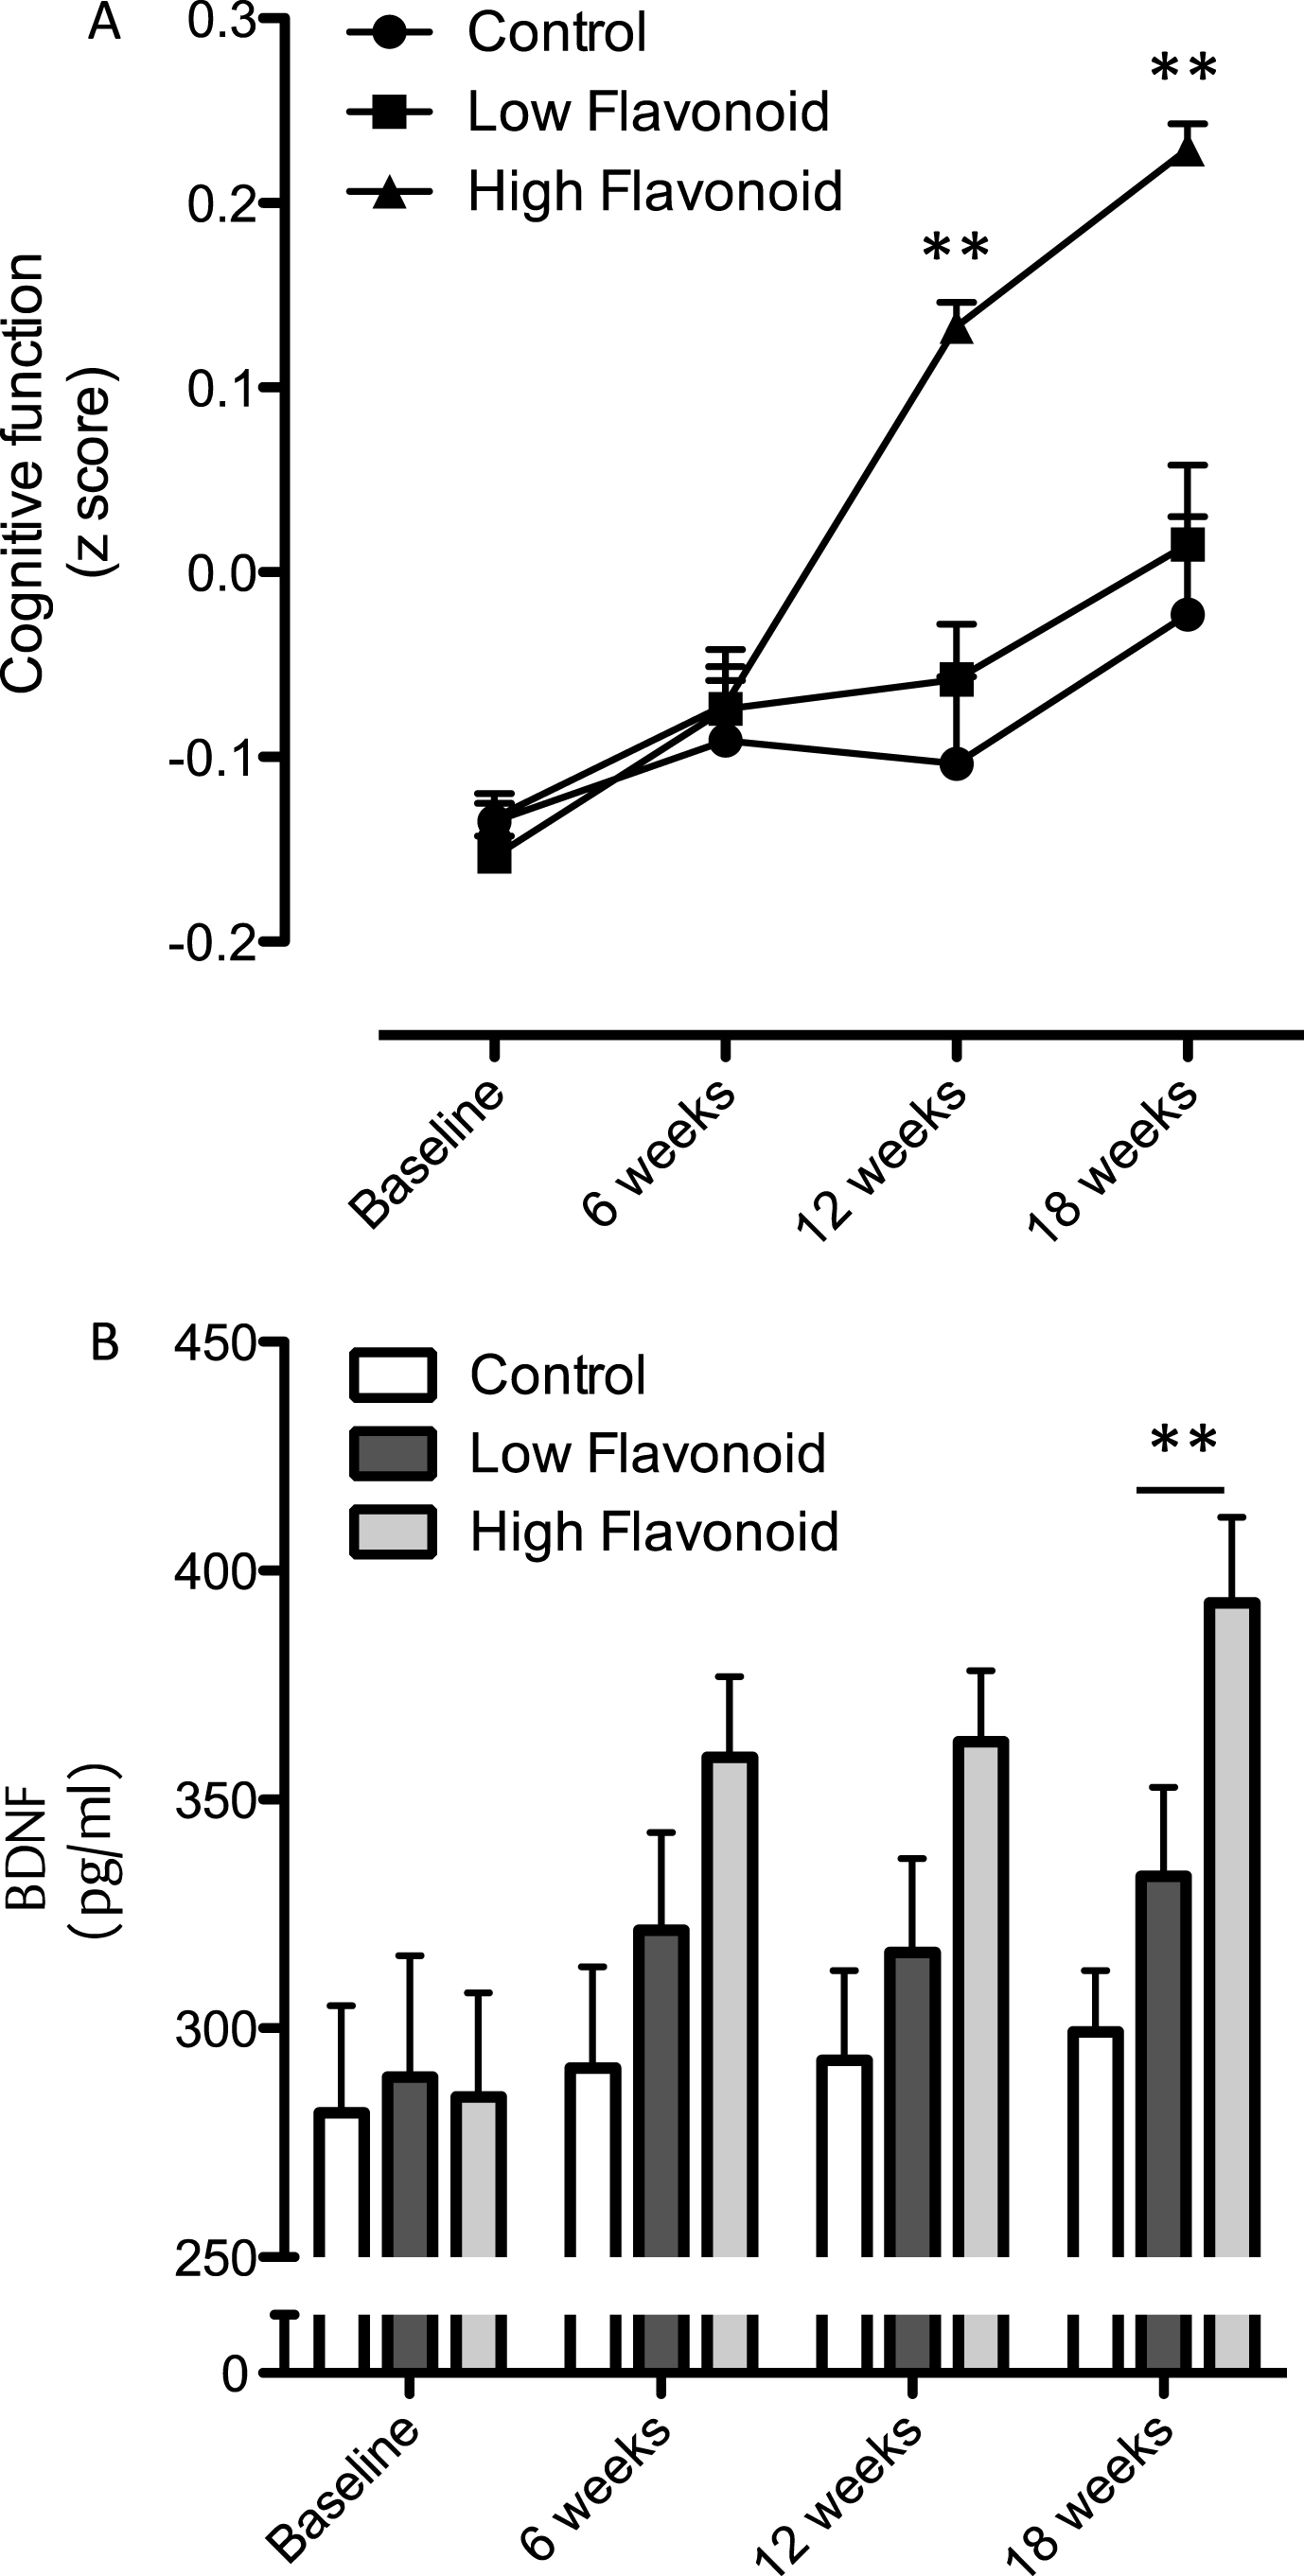
Fig.6
Influence of cocoa flavanol intake on cognition and serum BDNF. (A) Intake of cocoa flavanols for 12 weeks led to a significant increase serum BDNF levels, relative to the low flavanol cocoa intervention (**p < 0.01). (B) Impact of cocoa flavanol intake on global cognition function, plotted with serum BDNF levels (Baseline: ν= 40; 12 weeks). Cognitive performance was significantly greater (**p < 0.01) following high flavanol intake relative to the low flavanol control. All data are plotted as mean values±SEM (n = 40).