
The Cerebrospinal Fluid Neurogranin/BACE1 Ratio is a Potential Correlate of Cognitive Decline in Alzheimer’s Disease
Abstract
Background: In diagnosing Alzheimer’s disease (AD), ratios of cerebrospinal fluid (CSF) biomarkers, such as CSF Aβ1-42/tau, have an improved diagnostic performance compared to the single analytes, yet, still a limited value to predict cognitive decline. Since synaptic dysfunction/loss is closely linked to cognitive impairment, synaptic proteins are investigated as candidate CSF AD progression markers.
Objective: We studied CSF levels of the postsynaptic protein neurogranin and protein BACE1, predominantly localized presynaptically, and their relation to CSF total-tau, Aβ1-42, Aβ1-40, and Aβ1-38. All six analytes were considered as single parameters as well as ratios.
Methods: Every ELISA involved was based on monoclonal antibodies, including the BACE1 and neurogranin immunoassay. The latter specifically targets neurogranin C-terminally truncated at P75, a more abundant species of the protein in CSF. We studied patients with MCI due to AD (n = 38) and 50 dementia due to AD patients, as well as age-matched cognitively healthy elderly (n = 20). A significant subset of the patients was followed up by clinical and neuropsychologically (MMSE) examinations for at least one year.
Results: The single analytes showed statistically significant differences between the clinical groups, but the ratios of analytes indeed had a higher diagnostic performance. Furthermore, only the ratio of CSF neurogranin trunc P75/BACE1 was significantly correlated with the yearly decline in MMSE scores in patients with MCI and dementia due to AD, pointing toward the prognostic value of the ratio.
Conclusion: This is the first study demonstrating that the CSF neurogranin trunc P75/BACE1 ratio, reflecting postsynaptic/presynaptic integrity, is related to cognitive decline.
INTRODUCTION
The revised diagnostic criteria for Alzheimer’s disease (AD), the world’s leading cause of dementia, rely on a combination of biochemical and imaging biomarkers [1, 2]. Cerebrospinal fluid (CSF) levels of protein tau and amyloid-β (Aβ) peptides, such as Aβ1-42, Aβ1-40, and Aβ1-38 represent the biochemical biomarkers. Increased CSF concentrations of protein tau reveal the ongoing cortical neurodegeneration while the typical Aβ plaque pathology in the AD brain is mirrored by decreased CSF levels of Aβ1-42 [3]. Combining these analytes apparently provides an even higher diagnostic accuracy [4–6]. Nonetheless, CSF tau and CSF Aβ are state markers and their prognostic value regarding the actual start of cognitive deterioration or monitoring its progression is limited. Tangles and plaques are indeed only weakly correlated with cognitive impairment, in contrast to synaptic dysfunction or loss [7–9]. Thus, in the search for stage biomarkers that can predict the onset and/or course of the disease, there is a growing interest in synaptic proteins, like neurogranin.
The post-synaptic protein neurogranin has a pivotal role in long-term potentiation and learning [10–13], and while highly expressed in the brain [14, 15], neurogranin is also present in CSF as a pool of several C-terminal fragments, with an intact or truncated C-terminus [16]. Interestingly, in case of mild cognitive impairment (MCI) and AD, elevated CSF neurogranin levels were noted in various independent studies [17–20]. Furthermore, CSF neurogranin was analyzed in the ADNI cohort, revealing an association with hippocampal atrophy or FDG-PET [21]. Also a link with cognitive decline was shown in the latter study, which confirmed previous studies where high CSF neurogranin levels were predictive for conversion from MCI to AD [16, 19]. Although this association with cognitive decline could not yet be verified by other research groups [17, 18], the potential of CSF neurogranin reflecting synaptic dysfunction/degeneration is obvious. Finally, although neurogranin is also present in plasma, no confounding effects by the high plasma levels of neurogranin could be noted on the CSF levels of the protein, as studied in paired CSF-plasma samples [17, 22]. Besides the promising results from these CSF studies, some limitations were identified. The assays involved were based on at least one polyclonal antibody and/or the assays lacked the analytical sensitivity to allow the quantification of neurogranin in CSF samples from cognitively healthy controls, whom display low CSF neurogranin levels. These limitations in mind, in combination with the recent insights that neurogranin C-terminally truncated at P75 (neurogranin trunc P75) is a more abundant type of fragment in CSF, we aimed in our current study to develop a new research ELISA to continue assessing neurogranin as CSF biomarker. Our goal was to design an immunoassay, entirely based on two monoclonal antibodies (mAbs), specific for neurogranin trunc P75, and with improved analytical sensitivity.
In our previous, exploratory CSF study [17], we noted a clear reverse relationship between CSF neurogranin and the CSF Aβ1-42/Aβ1-40 ratio, possibly linking synaptic loss with pathologically altered AβPP metabolism. This agrees with studies where amyloid-β protein precursor (AβPP) processing is linked to synaptic activity [23] or where AβPP cleavage by BACE1 is localized in the synaptic compartment [24]. BACE1 or the β-site AβPP cleaving enzyme 1, is the transmembrane aspartyl protease that initiates the production of the toxic, aggregation-prone Aβ1-42 [25]. While an increase in protein levels as well as activity of BACE1 occurs in the brain of AD patients [26, 27], analyses in CSF remain inconclusive so far [28–34]. Several of these CSF studies were focused on BACE1 activity though [29–32, 34] and since it is a challenge differentiating the enzymatic activity by BACE1 from other aspartyl proteases, this could explain the conflicting results. We therefore selected a research prototype BACE1 ELISA, which is entirely based on mAbs and which is specific for BACE1 total protein levels, as previously described [28].
Using these two new ELISAs, targeting neurogranin trunc P75 and BACE1, we assessed the CSF levels of both synaptic proteins in samples from cognitively healthy persons (n = 20), patients suffering from MCI with high probability for AD (n = 38) and AD dementia (n = 50). We studied these levels in parallel with the CSF concentrations of the classic AD biomarkers, i.e., tau and Aβ1-42, but also Aβ1-40 and Aβ1-38. Hereby, we compared the diagnostic value of neurogranin trunc P75 and BACE1 versus the classic AD biomarkers, and as well considered the added value of the ratio of these analytes. Finally, we explored the relationship of neurogranin trunc P75 and BACE1 with cognitive decline, based on neuropsychological follow-up.
MATERIAL AND METHODS
Study population
CSF samples were selected from the Biobank of Institute Born-Bunge (Antwerp, Belgium), encompassing samples from patients of the Memory Clinic and Department of Neurology of Hospital Network Antwerp, Middelheim and Hoge Beuken. The samples were obtained by lumbar puncture (LP) at the L3/L4 or L4/L5 interspace, collected in polypropylene tubes, immediately frozen in liquid nitrogen and stored at –80°C until analysis. Within 3 months prior to or after LP, neuropsychological examinations, at least consisting of Mini-Mental State Examination (MMSE) scores, were performed for each patient.
Patients with MCI due to AD (referred to as ‘MCI’ hereafter; n = 38) as well as age-matched patients with dementia due to AD (‘AD’; n = 50) were included, diagnosed according to the NIA-AA criteria [1, 2]. To discriminate AD from cognitively normal, CSF biomarkers Aβ1-42, T-tau, and P-tau181P were already analyzed prior to this study at the BIODEM lab using commercial kits (Innotest β-AMYLOID(1-42), Innotest hTAU-Ag and Innotest PHOSPHO-TAU(181P); Fujirebio Europe, Ghent, Belgium), whereby the lab’s cutoff values were applied [35]. All MCI patients, of which 2 patients with a pathogenic AD gene mutation, had high probability of AD etiology according to the NIA-AA criteria (see also Supplementary Table 1). Regarding the participants of the age- and gender-matched cognitively healthy control group (‘CTRL’; n = 20), cognitive deterioration was ruled out by means of a neuropsychological screening. CTRL subjects had no neurological or psychiatric antecedents, central nervous system disorders, or inflammatory syndromes.
If available, MMSE total scores from follow-up neuropsychological examinations (at least one year after LP (= baseline)) were included in the study (see also Supplementary Table 2). This allowed calculating the rate of cognitive decline based on a linear mixed model adjusted for age and gender. The study was approved by the local ethics committee (University of Antwerp). All subjects gave written informed consent.
Postmortem brain samples (with high or intermediate AD neuropathologic changes (n = 20) or with low or no AD neuropathologic changes (n = 5) [36]) were also studied. Twenty-one cases belonged to a brain donation program (GIE NeuroCEB Brain Bank) where the patient (or his/her next of kin in his/her name) had signed a consent for research before death. In the other cases, a consent for research had been signed postmortem by the next of kin. All the cases had been neuropathologically studied. Both Braak stages for neurofibrillary tangles [37] and Thal phases for amyloid deposition [38] had been assessed.
Research neurogranin ELISA for CSF
Ninety-six-well microtiter plates were coated with mAb ADxNGCI2 in PBS, for 1 h at 21°C. After washing the wells with Phosphate-buffered Saline (PBS) containing Tween-20 (PBST), the plates were blocked with blocking reagent for 2 h at 21°C. The calibrator, a synthetic peptide containing the C-terminus of neurogranin truncated at Pro75 (custom-made by Proteogenix, France), was prepared in sample diluent (SD; PBS-based buffer with blocking reagent and detergents) at an initial concentration of 900 pg/mL and subsequent three-fold dilutions were made. Samples as well as calibrator dilutions were simultaneously incubated during 3 h at 21°C with the biotinylated mAb ADxNGCT1 in SD. After washing the plates with PBST, horseradish peroxidase-conjugated streptavidin was added. After incubation of 30 min at 21°C, the plates were washed and a 3,3’,5,5’-tetramethylbenzidine solution was added to engage development. After 30 min at 21°C, the coloring reaction was stopped with 1M sulfuric acid and plates were read spectrophotometrically in a BioTek microplate reader, at 450 nm (630 nm as reference wavelength). Levels of neurogranin trunc P75 were calculated via intrapolation (5PL curve fit; log(X)) based on the calibrator curve.
BACE1 ELISA for CSF
Barão and colleagues described earlier the design of an ELISA specific for BACE1 total protein levels, involving the mAbs ADx401 (clone 5G7) and 10B8 [28]. Before initiating our current study, we revised their protocol to harmonize the procedure with the ELISA procedures for the classic AD CSF biomarkers, such as CSF total-tau and CSF Aβ1-42, commercialized by Euroimmun AG (Lübeck, Germany). Summarized, we reduced the three-day protocol of Barão and co-workers into a one-day procedure, including a simultaneous incubation (during 3 h) of 15μL undiluted CSF sample and the detector antibody. Also, since the production of mAb 10B8 decreased in function of time, we performed additional rounds of subcloning of its hybridoma cell line to ensure the monoclonal character and production of the antibody. This resulted in the mAb ADx402 (clone 10B8F1), which is the detector Ab in the new ELISA, and which is biotinylated instead of conjugated with peroxidase as in the previous format [28]. In our study, we analyzed the BACE1 levels according to the new protocol, where concentrations were calculated via intrapolation (5PL curve fit; log (X)) based on a calibrator curve.
ELISA for the CSF biomarkers total-tau, Aβ1-42, Aβ1-40, and Aβ1-38
CSF levels of total-tau, Aβ1-42 and Aβ1-40 were re-analyzed during this study, using the total-tau ELISA, Beta-Amyloid (1-42) ELISA and Beta-Amyloid (1-40) ELISA by Euroimmun. Also, we measured CSF Aβ1-38 with an assay that was recently used in a large (n = 1,182) clinical study on the improved diagnostic performance of Aβ ratios in AD diagnosis [39]. The CSF Aβ1-38 assay uses the same detector antibody, i.e., ADx101 (clone 3D6), as the other Aβ ELISAs and a C-terminal specific Aβ1-38 antibody, i.e., ADx104 (clone 4H9), as capture mAb. The lower limit of quantification of the Aβ1-38 ELISA is approximately 32 pg/mL, while the linearity, based on three CSF samples (range 900–3800 pg/mL) is 81 to 113% (correlation r = 0.982). Based on three other CSF samples (range 500–1500 pg/mL), the intra-assay precision (coefficient of variation, CV) for 24 replicates is 1.9%, 2.2%, and 1.6%, respectively, whereas the inter-assay precision is 3.6%, 5.3%, and 5.0% respectively, based on 3 replicates in 10 runs. Finally, the inter-lot variability was determined on duplicates of these three samples, in 4 runs of 3 different lots, i.e., 3.5%, 5.0%, and 7.3% respectively. All three Aβ-assays and the total-tau ELISA use lyophilized, ready-to-use calibrators and standardized protocols, and were performed according to the kit-insert. Except for Aβ1-38, all kits are CE-certified.
Immunohistochemistry
Immunostaining was performed on a Ventana BenchMark automated slide stainer. The slides were incubated for one hour with the ADxNGCI2 antibody at a dilution of 1/1000 in Dako antibody diluent (Dako, Courtaboeuf, France) containing a Tris-HCL buffer and sodium azide. Pretreatment included incubation for 30 minutes in Cell Conditioning CC1 (Ventana, Ilkirch, France) at pH 8.4. The detection step made use of the UltraView Universal DAB Detection Kit (Ventana, Ilkirch, France). The slides were counterstained with Harris haematoxylin.
Statistical analyses
GraphPad Prism 6.02 and R version 3.1.2 were used for statistical analyses and figures. The strength of the correlation between analytes and/or parameters was expressed by Spearman’s correlation coefficient. To compare quantitative variables data between groups, a Kruskal-Wallis test was applied. Linear mixed models were fitted with MMSE as depend variable, fixed effects included time (continuous variable), CSF marker value and their interaction. The random effects included a random intercept for individual and a random slope for time. The significance of the interaction between the CSF marker value and time entailed whether the level of CSF marker had a significant effect on the MMSE change over time. The significance of this term was tested using a F-test with a Kenward-Roger correction for the number of degrees of freedom. Results were considered significant for p-values <0.05.
RESULTS
Generation of neurogranin monoclonal antibodies
The anti-neurogranin mAbs ADxNGCI2 and ADxNGCT1 were generated by immunization of mice with synthetic peptides encompassing theC-terminus of neurogranin. The mAb ADxNGCI2 (isotype IgG2a) was produced at PharmAbs (KU Leuven, Belgium) in Balb/c mice after injections with a KLH-coupled peptide containing an internal sequence of C-terminal neurogranin (R51-D78) and additional boosts with full-length synthetic neurogranin. Both the peptide and full-size neurogranin were synthesized at Proteogenix (France). The mAb ADxNGCT1 (isotype IgG1) was isolated (at BIOTEM, France) from OF1 mice following an immunization with a KLH-conjugated peptide (synthesized at BIOTEM) corresponding to theC-terminus truncated at P75 (G60-P75). These two mAbs ADxNGCI2 and ADxNGCT1 each recognize a different epitope on neurogranin as depicted in Fig. 1a. A scan by ELISA with streptavidin coating and biotinylated peptides covering the C-terminal end of neurogranin revealed that the epitope of ADxNGCI2 is located within the sequence R51-A66. The mAb ADxNGCT1 targets the amino acid range from G62, ending at P75. This specificity of both mAbs was also confirmed by gel electrophoresis on synthetic neurogranin, full size as well as truncated at P75. Three abundant types of human collagen were included as well since ADxNGCI2 and ADxNGCT1 target the collagen like domain of neurogranin (Fig. 1b). Finally, the mAb ADxNGCI2 labeled the cell body of many, but not all, neurons during immunostaining of brain tissue (Fig. 2a). Both pyramidal and granular neurons were labeled. The dendritic shaft of pyramidal cells was also immunostained, sometimes over a long distance (Fig. 2a). The dendrites of the dentate gyrus were strongly positive (Fig. 2b). On some dendrites, dendritic spines were visible (Fig. 2e). Some axons were labeled in the white matter (Fig. 2d), whereas the mossy fibers (axons of the granule cells of the dentate gyrus) were particularly immunostained (Fig. 2c). A granular and strong positivity was noticed in the cortical neuropil, probably in relation with the labeling of synapses. Glia were not labeled. The senile plaques were unstained and appeared as negative structures in the immunopositive neuropil (Fig. 2f). Neurofibrillary tangles were but weakly stained and tangle-bearing neurons were unstained or only lightly stained (Fig. 2g).
Design of an ELISA targeting neurogranin truncated at P75
During our exploratory study on neurogranin as CSF biomarker [17], we selected the mAb Ng7 [16] as capture antibody and a polyclonal Ab, 07-425, by Merck Millipore as detector antibody. However, since the mAb ADxNGCI2 shares the same epitope as Ng7 but has a higher affinity, we selected ADxNGCI2 to develop the new immunoassay described below. We determined the affinity of these two mAbs by bio-layer interferometry measurements on the BLItz system by fortéBIO (Supplementary Figure 1). The KD of Ng7 corresponded to 0.6nM whereas the KD of ADxNGCI2 was less than 10 pM. Additionally, the pAb 07-425 was replaced with ADxNGCT1, due to the monoclonal character of the latter as well as its specificity towards the truncated C-terminus of neurogranin (at P75), which is more abundant in human CSF than the intact C-terminus [16]. As such, combining ADxNGCI2 as capture antibody and ADxNGCT1 as biotinylated detector antibody resulted in the research sandwich ELISA specific for neurogranin truncated at P75 (Fig. 1c). To assess the sensitivity of the new mAbs based assay, three CSF samples with low endogenous levels of neurogranin trunc P75 were run in 4 replicates and the lowest quantifiable concentration with a coefficient of variation (% CV) of 20 was 26 pg/mL (based on the standard curve in duplicate). Three-fold serial dilutions of a synthetic peptide encompassing the C-terminal sequence of neurogranin, ending at P75, were used to generate the standard curve, ranging from 900 to 4 pg/mL. Lastly, to preliminary explore the stability of neurogranin trunc P75 in CSF, we performed a stress experiment where 3 CSF samples were stored at 21°C, 4°C, or –20°C for 1 to 15 days before storing at –80°C until analysis. As reference, an aliquot of each sample was stored directly at –80°C at the start of the experiment (day 0). Analysis of the samples with the prototype ELISA revealed stable levels of neurogranin trunc P75 in case of storage at –20°C or even 4°C, while levels decreased by 30% after 15 days of storage at 21°C (Supplementary Figure 2).
Age dependence of CSF neurogranin, CSF BACE1, and the classic CSF AD biomarkers
In preparation of the clinical study, we first verified the neurogranin trunc P75 assay as a proof-of-concept in a large set of CSF samples. Specifically, we analyzed the control group for the clinical study (n = 20) in addition to a cohort of diagnostically undefined CSF samples (n = 161; Biomnis, France). We selected the latter group of samples within a wide range of age and with a similar number of male and female subjects. In total, 181 samples (104 female/77 male subjects) were analyzed with a median age of 50.3 y (range 7.0–92.1). Apart from neurogranin trunc P75, we analyzed the CSF levels of BACE1, tau, Aβ1-42, Aβ1-40, and Aβ1-38. Table 1 summarizes the concentrations of all analytes. As depicted, only in a very minor number of samples neurogranin trunc P75 levels could not be determined, i.e., 2.8%, which was highly comparable to the other five analytes, i.e., 1.7% for total-tau, Aβ1-42, and Aβ1-40; 1.1% for Aβ1-38; and 0% for BACE1. In addition, all CSF analytes showed an association with age, albeit very weak in case of Aβ1-42: neurogranin trunc P75 (ρ= 0.253; p = 0.0007), BACE1 (ρ= 0.412; p < 0.0001), tau (ρ= 0.366; p < 0.0001), Aβ1-42 (ρ= 0.147; p = 0.050), Aβ1-40 (ρ= 0.305; p < 0.0001), and Aβ1-38 (ρ= 0.326; p < 0.0001). Figure 3, which illustrates this relationship between the several CSF analytes and age, also confirms the accurate selection of the age-matched control group for the clinical study. Finally, there was a strong correlation between neurogranin trunc P75, BACE1, and tau on the one hand, and a solid relationship between the three Aβ-species on the other hand (Table 2).
CSF levels of neurogranin trunc P75, BACE1, and the classic CSF AD biomarkers in MCI and AD patients
After establishing the proof-of-concept of the research assay for neurogranin, we investigated the levels of neurogranin trunc P75 and BACE1 in the CSF of MCI (n = 38) and AD (n = 50) patients versus cognitively normal participants (CTRL) (n = 20). In addition, total-tau, Aβ1-42, Aβ1-40, and Aβ1-38 were quantified in the samples, which were tested blinded from clinical diagnosis. Table 3 sums up the levels of every analyte, combined with the demographic and clinical data of the population.
Compared to the CTRL group, CSF neurogranin trunc P75 was significantly increased in MCI patients (p < 0.01), but was not significantly different in AD patients (Table 3, Fig. 4). Likewise, no significant differences were noted between the MCI and AD groups. On the contrary, CSF BACE1 levels were higher in the MCI group compared to the AD patients (p < 0.01), whereas no significant differences were seen between CTRL and MCI, nor between CTRL and AD. For both proteins, there was a trend of increasing group levels when progressing fromcognitively normal to MCI, followed by a decrease in case of progression to AD. These findings are reflected by Receiver Operating Characteristics (ROC) analyses, comparing the CTRL group versus both groups of patients (Table 4). CSF neurogranin trunc P75, as single analyte, performed well in discriminating MCI from cognitively healthy with an area under the ROC curve (AUC) of 0.741 (p = 0.003), but failed to distinguish AD from control (AUC = 0.615, ns). Regarding BACE1, no significant discriminating power was noted for CSF BACE1 as single analyte, for MCI (AUC = 0.620, ns), nor for AD (AUC = 0.554, ns). As expected, the ROC statistics demonstrated strong diagnostic value of the classic CSF biomarkers total-tau and Aβ1-42. AUC values for CSF total-tau were 0.842 (p < 0.0001) in case of MCI and 0.854 (p < 0.0001) for AD, whereas for CSF Aβ1-42, AUC values were 0.765 (p = 0.001) in case of MCI and 0.849 (p < 0.0001) for AD. Combining the biomarkers into ratios clearly resulted in higher AUC values and/or increased statistical strength (Table 4). The AUC value for the ratio of CSF neurogranin trunc P75/Aβ1-42 was 0.874 (p < 0.0001) for discriminating MCI from CTRL and 0.903 (p < 0.0001) in case of AD versus CTRL, paralleling the largestdiscriminating performance of the ratio CSF Aβ1-42/total-tau (AUC(MCI) = 0.871, p < 0.0001; AUC(AD) = 0.923, p < 0.0001). The combination of both synaptic proteins neurogranin trunc P75 and BACE1 also resulted in an AUC value that was superior to the values of both analytes as single parameter. The AUC value for CSF neurogranin trunc P75/BACE1 was 0.715 (p = 0.008) regarding MCI patients and 0.806 (p < 0.0001) for the AD group.
Also, we investigated the relationship between all CSF analytes in the clinical groups, and similar to the proof-of-concept analyses described above, there was a strong correlation between neurogranin trunc P75 and BACE1, in MCI (0.793, p < 0.0001) as well as AD patients (0.711, p < 0.0001; Table 5). Moderately strong correlations between these synaptic analytes and total-tau were observed as well, i.e., neurogranin trunc P75 and tau were both correlated in MCI (0.635, p < 0.0001), and AD (0.617, p < 0.0001), as were BACE1 and tau in MCI (0.588, p < 0.001), and AD (0.497, p < 0.001). Even though neurogranin trunc P75, BACE1, and tau appeared closely associated, subtle differences became apparent when studying their respective associations with the Aβ-species. Neurogranin trunc P75 correlated with both Aβ1-40 and Aβ1-38 in MCI as well as AD, but in neither case with Aβ1-42. On the other hand, tau showed an albeit weak, yet significant, correlation with Aβ1-42 in MCI (0.383, p < 0.05), while BACE1 correlated with Aβ1-42 in AD (0.408, p < 0.01). When considering the ratios of CSF Aβ1-42/Aβ1-40 and CSF Aβ1-42/Aβ1-38 more differences were found (Table 6). In the MCI population, both neurogranin trunc P75 and BACE1 were correlated with both ratios, whereas tau was not. Curiously, in the patients with AD dementia, only neurogranin trunc P75 was related to the ratio CSF Aβ1-42/Aβ1-38 in contrast to CSF Aβ1-42/Aβ1-40 with which all three analytes significantly correlated.
Relationship of CSF biomarkers with MMSE decline
In addition to their diagnostic performance, we evaluated the analytes as possible progression biomarkers by assessing their relationship with cognitive decline. Therefore, we considered the CSF levels of all analytes, as single parameters as well as ratios, in a subset of MCI (n = 36) and AD (n = 45) patients where MMSE was monitored. Adjusted for age and gender, a linear mixed model analysis, with the longitudinal MMSE measurements as outcome, demonstrated that none of the single analytes at baseline, i.e., neurogranin trunc P75, BACE1 nor the classic CSF AD biomarkers, were associated with the rate of cognitive decline (Table 7). Also the majority of biomarker ratios was not correlated, although there was one specific ratio of CSF biomarkers showing a consistently significant impact on the longitudinal decline in MMSE in both MCI and AD patients, i.e., CSF neurogranin trunc P75/BACE1 (β= –0.018; p < 0.05 for MCI; β= –0.051; p < 0.01 for AD). Statistical significance remained unchanged in case two possible confounders, CSF levels of tau and Aβ1-42, were added to the model as fixed effects. To illustrate this correlation between the neurogranin trunc P75/BACE1 ratio and cognitive deterioration, the subset of patients with MMSE at and follow-up after LP was partitioned into three tertiles according to the ratio levels (Fig. 5, Supplementary Table 2). In both the MCI and AD group, individuals (each represented by the thin lines) with the highest ratio levels, i.e., in the lower panels, had the steepest slope or the biggest change in MMSE. This effect was more pronounced in AD patients. There was one additional ratio that was also significantly correlated with cognitive decline, albeit only in AD patients: CSF neurogranin trunc P75/Aβ1-42 (β= –3.589; p < 0.05).
DISCUSSION
The biochemical markers in the current revised diagnostic criteria for AD, i.e., CSF tau and CSF Aβ1-42, are state markers and their prognostic value with respect to cognitive deterioration is limited. Recent results on a novel biomarker, i.e., CSF neurogranin, have consistently demonstrated that this post-synaptic protein could be a candidate progression or stage marker. Among the six analytes tested in the current study, we found a significant correlation between the ratio of CSF neurogranin trunc P75 with the protease BACE1 and cognitive decline. None of the single analytes or other combinations demonstrated the same prognostic value.
In our previous, exploratory study, we observed increased levels of neurogranin in CSF of MCI and AD patients [17], which was in accordance with other independent studies [16, 20]. However, similar to the immunoassay described by Kvartsberg and colleagues [16], the ELISA used in the exploratory study lacked adequate analytical sensitivity to measure the lower concentrations of neurogranin in CSF from cognitively healthy persons. To address this issue, we developed a new ELISA with increased sensitivity and thereby bore in mind that neurogranin is present in CSF, but also in brain and plasma, as a range of truncated species. Since fragments truncated at amino acid P75 or S76 seem to be more abundant than species with an intact C-terminus [16], we generated new monoclonal antibodies targeting the C-terminus of neurogranin, truncated at Pro75 (neurogranin trunc P75). The analytical sensitivity of the resulting new neurogranin ELISA was tested in a large cohort of clinically undefined CSF samples, covering a wide age-range and the performance appeared comparable to the other assays used in the study. As we noted an age-dependent increase for CSF neurogranin trunc P75, similar to the other analytes, we additionally explored whether we could calculate reference ranges using the CLSI C28 criteria [40]. However, a substantial number of outliers, even after log-transformation, demonstrated that this set of CSF samples was not suitable to set such reference ranges (data not shown). As defining these values was beyond the scope of the current clinical study, a more focused study should be performed, including CSF from well-defined healthy controls as delineated by Teunissen et al.[41].
After confirming adequate analytical sensitivity of the novel neurogranin ELISA, we compared the levels in MCI and AD patients and similar to neurogranin with an intact C-terminus [17], CSF concentrations of neurogranin trunc P75 were increased in MCI. Yet, based on ROC analysis, there was no added diagnostic value compared to CSF tau or CSF Aβ1-42, as reported earlier on neurogranin [18, 19]. However, combining CSF neurogranin trunc P75 with CSF Aβ1-42, or with the CSF levels of the protease BACE1, resulted noticeably in higher AUC values. Possibly combining the biomarkers into a ratio might eliminate confounding factors, such as inter-individual differences, or they might reflect pathological processes more efficiently as ratio, as was suggested by several recent studies on CSF tau and CSF Aβ [4–6, 42]. For example, the CSF Aβ1-42/Aβ1-40 ratio appears to be a much more sensitive and accurate measure of amyloid plaque load in the brain than the levels of the individual markers [43, 44]. Actually, we noticed a strong correlation between neurogranin and tau, reflecting synaptic/axonal loss, but the correlation between neurogranin and BACE1 was even higher, in the same order as the correlation between the different Aβ analytes (see tables). This robust association of BACE1 with neurogranin might be related to their co-localization in the synaptic compartment. While neurogranin has a crucial post-synaptic role [13], electron microscopy demonstrated that BACE1 predominantly concentrates in vesicles within the pre-synapse [24] where it would process AβPP upon neuronal activity [23]. As a ratio, the CSF levels of neurogranin and BACE1 might be a more solid reflection of synaptic function or integrity than the single concentrations. Although combining individual analytes into a ratio is, analytically speaking, a challenge, i.e., the imprecision of the ratio is the sum of the imprecision of the individual analytes, it definitely seems meaningful to continue investigating the value of combining BACE1 and neurogranin in additional studies, with longer (clinical) follow-up and larger independent study populations, or even combining these analytes with other synaptic proteins that can be measured in CSF, such as SNAP-25 [45]. Additionally, other cognitive measures, e.g., ADAS-cog, or other, non-AD, cognitive disorders, such as depression, may be explored.
Next to representing synaptic dysfunction and/or degeneration, one may wonder whether this CSF ratio could also function as biomarker for cognitive deterioration because of the link between loss of synaptic proteins and cognitive impairment in AD dementia [7, 8, 46]. The ratio of CSF neurogranin trunc P75/BACE1 was indeed the sole parameter in this study, which was significantly correlated with cognitive decline. A high ratio predicted a more rapid decrease in MMSE scores. No correlation with decrease in MMSE was observed for the other analytes, such as CSF tau and CSF Aβ, as single biomarker nor combined as ratio. These findings are in line with previous reports where only weak correlations are described between tangles and/or plaque pathology and cognitive impairment [9, 47]. So even though CSF tau and CSF Aβ are excellent early diagnostic biomarkers, representing the mentioned tangles respectively plaque pathology, their prognostic value is limited.
We would like to emphasize that although several independent studies on neurogranin have demonstrated a consistent increase in the CSF levels of the protein in MCI and AD [16–22], these studies involve varying research assays and it will be necessary to compare these different assay set-ups. We need to define which form(s) is (are) diagnostically relevant for AD and/or other forms of neurodegeneration as characterization studies of neurogranin in CSF are already showing different forms of the protein [16]. Comparison studies on the same clinical groups, where the different assay formats for neurogranin are compared, are ongoing to assess their concordance. Ideally, an analytical method is developed that can measure specific neurogranin metabolites independent of antibodies, similar to what has been developed for Aβ1-42 [48]. In addition, harmonization studies are preferably conducted collaboratively, as it has also been done for the Aβ1-42 immuno-assays[49].
Finally, our postmortem analysis on human brain tissue with the mAb ADxNGCI2 confirmed data acquired in the rat brain. Golgi methods and electron microscopy, in the rat, demonstrated a post-synaptic localization of neurogranin [13] where it mediates long-term potentiation through its interaction with calmodulin [10, 13, 50]. Yet, ADxNGCI2 also labeled the cell body of the neurons, a large part of their dendritic tree as well as synapses. Moreover, the distribution of the protein was not limited to the somato-dendritic compartment but also involved some axons and particularly the mossy fibers of the hippocampus. This somato-dendritic topography suggests that neurogranin is synthesized in the cell body before being targeted to the synapses in the dendrites, as already put forward in rat brain data analysis [51]. The importance and role of axonal neurogranin remains to be elucidated. However, since several neurogranin fragments have been detected in the brain, e.g., truncated at P75, using additional monoclonal antibodies directed against those specific species of the protein, such as mAb ADxNGCT1, might offer new insights. We plan on performing postmortem studies in both AD and control cases using several neurogranin antibodies to improve our understanding of neurogranin as potential biomarker.
In conclusion, this study presents the ratio of CSF neurogranin trunc P75/BACE1 as potential progression marker for AD. Ideally, multicenter studies are performed, or established clinical consortia cohorts and/or samples from clinical trials targeting synaptic integrity are analyzed on both markers to verify this synaptic profile as progression marker, in AD or other forms of neurodegeneration. The ELISAs designed during the current study, entirely based on monoclonal antibodies, allowing standardization, provide impeccable tools for these analyses.
ACKNOWLEDGMENTS
The authors kindly acknowledge Leentje Demeyer, Kimberley Mauroo, and Erik Stoops for their technical assistance in the development of the BACE1 assay. We also would like to thank the team of Wim Maes and Nick Geukens (PharmAbs, KU Leuven, Belgium) as well as the team of Els Saesen and Laurence Padel (BIOTEM, France) for the joined efforts in the generation of neurogranin mAbs. Finally, we acknowledge Jill Luyckx, Naomi De Roeck, Joery Goossens, and Ellis Niemantsverdriet (BIODEM, UAntwerp) for CSF sample processing and classical biomarker analyses with Innotest kits. This work was in part supported by the University Research Fund of the University of Antwerp; the Institute Born-Bunge; the Alzheimer Research Foundation (SAO-FRA); the Research Foundation - Flanders (FWO); the Agency for Innovation by Science and Technology (IWT O&O 140105; IWT Baekeland 140262); the Interuniversity Attraction Poles (IAP) program of the Belgian Science Policy Office; the Flanders Impulse Program on Networks for Dementia Research (VIND). This work has received support from the EU/EFPIA Innovative Medicines Initiative Joint Undertaking (EMIF grant n° 115372).
Authors’ disclosures available online (http://j-alz.com/manuscript-disclosures/16-0227r1).
Appendices
Supplementary material can be found here: http://dx.doi.org/10.3233/JAD-160227.
REFERENCES
[1] | Albert MS , DeKosky ST , Dickson D , Dubois B , Feldman HH , Fox NC , Gamst A , Holtzman DM , Jagust WJ , Petersen RC , Snyder PJ , Carrillo MC , Thies B , Phelps CH ((2011) ) The diagnosis of mild cognitive impairment due to Alzheimer’s disease: Recommendations from the National Institute on Aging-Alzheimer’s Association workgroups on diagnostic guidelines for Alzheimer’s disease. Alzheimers Dement 7: , 270–279. |
[2] | McKhann GM , Knopman DS , Chertkow H , Hyman BT , Jack CR , Kawas CH , Klunk WE , Koroshetz WJ , Manly JJ , Mayeux R , Mohs RC , Morris JC , Rossor MN , Scheltens P , Carrillo MC , Thies B , Weintraub S , Phelps CH ((2011) ) The diagnosis of dementia due to Alzheimer’s disease: Recommendations from the National Institute on Aging-Alzheimer’s Association workgroups on diagnostic guidelines for Alzheimer’s disease. Alzheimers Dement 7: , 263–269. |
[3] | Jack CR , Knopman DS , Jagust WJ , Petersen RC , Weiner MW , Aisen PS , Shaw LM , Vemuri P , Wiste HJ , Weigand SD , Lesnick TG , Pankratz VS , Donohue MC , Trojanowski JQ ((2013) ) Tracking pathophysiological processes in Alzheimer’s disease: An updated hypothetical model of dynamic biomarkers. Lancet Neurol 12: , 207–216. |
[4] | Duits FH , Teunissen CE , Bouwman FH , Visser PJ , Mattsson N , Zetterberg H , Blennow K , Hansson O , Minthon L , Andreasen N , Marcusson J , Wallin A , Rikkert MO , Tsolaki M , Parnetti L , Herukka SK , Hampel H , De Leon MJ , Schröder J , Aarsland D , Blankenstein MA , Scheltens P , van der Flier WM ((2014) ) The cerebrospinal fluid “Alzheimer profile”: Easily said, but what does it mean?. Alzheimers Dement 10: , 713–723. |
[5] | Lewczuk P , Lelental N , Spitzer P , Maler JM , Kornhuber J ((2015) ) Amyloid-β 42/40 cerebrospinal fluid concentration ratio in the diagnostics of Alzheimer’s disease: Validation of two novel assays. J Alzheimers Dis 43: , 183–191. |
[6] | Sauvée M , DidierLaurent G , Latarche C , Escanyé MC , Olivier JL , Malaplate-Armand C ((2014) ) Additional use of Aβ42/Aβ40 ratio with cerebrospinal fluid biomarkers P-tau and Aβ42 increases the level of evidence of Alzheimer’s disease pathophysiological process in routine practice. J Alzheimers Dis 41: , 377–386. |
[7] | Reddy PH , Mani G , Park BS , Jacques J , Murdoch G , Whetsell W , Kaye J , Manczak M ((2005) ) Differential loss of synaptic proteins in Alzheimer’s disease: Implications for synaptic dysfunction. J Alzheimers Dis 7: , 103–117; discussion 173–180. |
[8] | Selkoe DJ ((2002) ) Alzheimer’s disease is a synaptic failure. Science 298: , 789–791. |
[9] | Terry RD , Masliah E , Salmon DP , Butters N , DeTeresa R , Hill R , Hansen LA , Katzman R ((1991) ) Physical basis of cognitive alterations in Alzheimer’s disease: Synapse loss is the major correlate of cognitive impairment. Ann Neurol 30: , 572–580. |
[10] | Díez-Guerra FJ ((2010) ) Neurogranin, a link between calcium/calmodulin and protein kinase C signaling in synaptic plasticity. IUBMB Life 62: , 597–606. |
[11] | Represa A , Deloulme JC , Sensenbrenner M , Ben-Ari Y , Baudier J ((1990) ) Neurogranin: Immunocytochemical locaization of a brain-specific protein kinase C substrate. J Neurosci 10: , 3782–3792. |
[12] | Watson JB , Sutcliffe JG , Fisher RS ((1992) ) Localization of the protein kinase C phosphorylation/calmodulin-binding substrate RC3 in dendritic spines of neostriatal neurons. Proc Natl Acad Sci U S A 89: , 8581–8585. |
[13] | Zhong L , Cherry T , Bies CE , Florence MA , Gerges NZ ((2009) ) Neurogranin enhances synaptic strength through its interaction with calmodulin. EMBO J 28: , 3027–3039. |
[14] | Baudier J , Deloulme JC , Van Dorsselaer A , Black D , Matthes HW ((1991) ) Purification and characterization of a brain-specific protein kinase C substrate, neurogranin (p17). Identification of a consensus amino acid sequence between neurogranin and neuromodulin (GAP43) that corresponds to the protein kinase C phosphorylation site and the calmodulin-binding domain. J Biol Chem 266: , 229–237. |
[15] | Sjöstedt E , Fagerberg L , Hallström BM , Häggmark A , Mitsios N , Nilsson P , Pontén F , Hökfelt T , Uhlén M , Mulder J ((2015) ) Defining the human brain proteome using transcriptomics and antibody-based profiling with a focus on the cerebral cortex. PLoS One 10: , e0130028. |
[16] | Kvartsberg H , Duits FH , Ingelsson M , Andreasen N , Öhrfelt A , Andersson K , Brinkmalm G , Lannfelt L , Minthon L , Hansson O , Andreasson U , Teunissen CE , Scheltens P , Van der Flier WM , Zetterberg H , Portelius E , Blennow K ((2015) ) Cerebrospinal fluid levels of the synaptic protein neurogranin correlates with cognitive decline in prodromal Alzheimer’s disease. Alzheimers Dement 11: , 1180–1190. |
[17] | De Vos A , Jacobs D , Struyfs H , Fransen E , Andersson K , Portelius E , Andreasson U , De Surgeloose D , Hernalsteen D , Sleegers K , Robberecht C , Van Broeckhoven C , Zetterberg H , Blennow K , Engelborghs S , Vanmechelen E ((2015) ) C-terminal neurogranin is increased in cerebrospinal fluid but unchanged in plasma in Alzheimer’s disease. Alzheimers Dement 11: , 1461–1469. |
[18] | Janelidze S , Hertze J , Zetterberg H , Landqvist Waldö M , Santillo A , Blennow K , Hansson O ((2015) ) Cerebrospinal fluid neurogranin and YKL-40 as biomarkers of Alzheimer’s disease. Ann Clin Transl Neurol 3: , 12–20. |
[19] | Kester MI , Teunissen CE , Crimmins DL , Herries EM , Ladenson JH , Scheltens P , van der Flier WM , Morris JC , Holtzman DM , Fagan AM ((2015) ) Neurogranin as a cerebrospinal fluid biomarker for synaptic loss in symptomatic Alzheimer disease. JAMA Neurol 72: , 1275–1280. |
[20] | Thorsell A , Bjerke M , Gobom J , Brunhage E , Vanmechelen E , Andreasen N , Hansson O , Minthon L , Zetterberg H , Blennow K ((2010) ) Neurogranin in cerebrospinal fluid as a marker of synaptic degeneration in Alzheimer’s disease. Brain Res 1362: , 13–22. |
[21] | Portelius E , Zetterberg H , Skillbäck T , Törnqvist U , Andreasson U , Trojanowski JQ , Weiner MW , Shaw LM , Mattsson N , Blennow K ((2015) ) Cerebrospinal fluid neurogranin: Relation to cognition and neurodegeneration in Alzheimer’s disease. Brain 138: (Pt 11), 3373–3385. |
[22] | Kvartsberg H , Portelius E , Andreasson U , Brinkmalm G , Hellwig K , Lelental N , Kornhuber J , Hansson O , Minthon L , Spitzer P , Maler JM , Zetterberg H , Blennow K , Lewczuk P ((2015) ) Characterization of the postsynaptic protein neurogranin in paired cerebrospinal fluid and plasma samples from Alzheimer’s disease patients and healthy controls. Alzheimers Res Ther 7: , 40. |
[23] | Kamenetz F , Tomita T , Hsieh H , Seabrook G , Borchelt D , Iwatsubo T , Sisodia S , Malinow R ((2003) ) APP processing and synaptic function. Neuron 37: , 925–937. |
[24] | Kandalepas PC , Sadleir KR , Eimer WA , Zhao J , Nicholson DA , Vassar R ((2013) ) The Alzheimer’s β-secretase BACE1 localizes to normal presynaptic terminals and to dystrophic presynaptic terminals surrounding amyloid plaques. Acta Neuropathol 126: , 329–352. |
[25] | Vassar R , Bennett BD , Babu-Khan S , Kahn S , Mendiaz EA , Denis P , Teplow DB , Ross S , Amarante P , Loeloff R , Luo Y , Fisher S , Fuller J , Edenson S , Lile J , Jarosinski MA , Biere AL , Curran E , Burgess T , Louis JC , Collins F , Treanor J , Rogers G , Citron M ((1999) ) Beta-secretase cleavage of Alzheimer’s amyloid precursor protein by the transmembrane aspartic protease BACE. Science 286: , 735–741. |
[26] | Ahmed RR , Holler CJ , Webb RL , Li F , Beckett TL , Murphy MP ((2010) ) BACE1 and BACE2 enzymatic activities in Alzheimer’s disease. J Neurochem 112: , 1045–1053. |
[27] | Fukumoto H , Cheung BS , Hyman BT , Irizarry MC ((2002) ) Beta-secretase protein and activity are increased in the neocortex in Alz heimer disease. Arch Neurol 59: , 1381–1389. |
[28] | Barao S , Zhou L , Adamczuk K , Vanhoutvin T , van Leuven F , Demedts D , Vijverman AC , Bossuyt X , Vandenberghe R , De Strooper B ((2013) ) BACE1 levels correlate with phospho-tau levels in human cerebrospinal fluid. Curr Alzheimer Res 10: , 671–678. |
[29] | Pera M , Alcolea D , Sánchez-Valle R , Guardia-Laguarta C , Colom-Cadena M , Badiola N , Suárez-Calvet M , Lladó A , Barrera-Ocampo AA , Sepulveda-Falla D , Blesa R , Molinuevo JL , Clarimón J , Ferrer I , Gelpi E , Lleó A ((2013) ) Distinct patterns of APP processing in the CNS in autosomal-dominant and sporadic Alzheimer disease. Acta Neuropathol 125: , 201–213. |
[30] | Rosén C , Andreasson U , Mattsson N , Marcusson J , Minthon L , Andreasen N , Blennow K , Zetterberg H ((2012) ) Cerebrospinal fluid profiles of amyloid β-related biomarkers in Alzheimer’s disease. Neuromolecular Med 14: , 65–73. |
[31] | Savage MJ , Holder DJ , Wu G , Kaplow J , Siuciak JA , Potter WZ ((2015) ) Soluble BACE-1 activity and sAβPPβ concentrations in Alzheimer’s disease and age-matched healthy control cerebrospinal fluid from the Alzheimer’s Disease Neuroimaging Initiative-1 baseline cohort. J Alzheimers Dis 46: , 431–440. |
[32] | Zetterberg H , Andreasson U , Hansson O , Wu G , Sankaranarayanan S , Andersson ME , Buchhave P , Londos E , Umek RM , Minthon L , Simon AJ , Blennow K ((2008) ) Elevated cerebrospinal fluid BACE1 activity in incipient Alzheimer disease. Arch Neurol 65: , 1102–1107. |
[33] | Zhong Z , Ewers M , Teipel S , Bürger K , Wallin A , Blennow K , He P , McAllister C , Hampel H , Shen Y ((2007) ) Levels of beta-secretase (BACE1) in cerebrospinal fluid as a predictor of risk in mild cognitive impairment. Arch Gen Psychiatry 64: , 718–726. |
[34] | Mulder SD , van der Flier WM , Verheijen JH , Mulder C , Scheltens P , Blankenstein MA , Hack CE , Veerhuis R ((2010) ) BACE1 activity in cerebrospinal fluid and its relation to markers of AD pathology. J Alzheimers Dis 20: , 253–260. |
[35] | Van der Mussele S , Fransen E , Struyfs H , Luyckx J , Mariën P , Saerens J , Somers N , Goeman J , De Deyn PP , Engelborghs S ((2014) ) Depression in mild cognitive impairment is associated with progression to Alzheimer’s disease: A longitudinal study. J Alzheimers Dis 42: , 1239–1250. |
[36] | Montine TJ , Phelps CH , Beach TG , Bigio EH , Cairns NJ , Dickson DW , Duyckaerts C , Frosch MP , Masliah E , Mirra SS , Nelson PT , Schneider JA , Thal DR , Trojanowski JQ , Vinters HV , Hyman BT , National Institute on Aging, Alzheimer’s, Association ((2012) ) National Institute on Aging-Alzheimer’s Association guidelines for the neuropathologic assessment of Alzheimer’s disease: A practical approach. Acta Neuropathol 123: , 1–11. |
[37] | Braak H , Braak E ((1991) ) Neuropathological stageing of Alzheimer-related changes. Acta Neuropathol 82: , 239–259. |
[38] | Thal DR , Rüb U , Orantes M , Braak H ((2002) ) Phases of A beta-deposition in the human brain and its relevance for the development of AD. Neurology 58: , 1791–1800. |
[39] | Janelidze S , Zetterberg H , Mattsson N , Palmqvist S , Vanderstichele H , Lindberg O , van Westen D , Stomrud E , Minthon L , Blennow K , for the Swedish BioFINDER, study group, Oskar Hansson ((2016) ) CSF Aβ42/Aβ40 and Aβ42/Aβ38 ratios: Better diagnostic markers of Alzheimer disease. Ann Clin Transl Neurol 3: , 154–165. |
[40] | Wayne PA ((2000) ) Clinical and Laboratory Standards Institute. How to define and determine reference intervals in the clinical laboratory: Approved guideline. CLSI Document C28-A2. |
[41] | Teunissen C , Menge T , Altintas A , Álvarez-Cermeño JC , Bertolotto A , Berven FS , Brundin L , Comabella M , Degn M , Deisenhammer F , Fazekas F , Franciotta D , Frederiksen JL , Galimberti D , Gnanapavan S , Hegen H , Hemmer B , Hintzen R , Hughes S , Iacobaeus E , Kroksveen AC , Kuhle J , Richert J , Tumani H , Villar LM , Drulovic J , Dujmovic I , Khalil M , Bartos A ((2013) ) Consensus definitions and application guidelines for control groups in cerebrospinal fluid biomarker studies in multiple sclerosis. Mult Scler 19: , 1802–1809. |
[42] | Slaets S , Le Bastard N , Martin JJ , Sleegers K , Van Broeckhoven C , De Deyn PP , Engelborghs S ((2013) ) Cerebrospinal fluid Aβ1-40 improves differential dementia diagnosis in patients with intermediate P-tau181P levels. J Alzheimers Dis 36: , 759–767. |
[43] | Bateman RJ , Xiong C , Benzinger TL , Fagan AM , Goate A , Fox NC , Marcus DS , Cairns NJ , Xie X , Blazey TM , Holtzman DM , Santacruz A , Buckles V , Oliver A , Moulder K , Aisen PS , Ghetti B , Klunk WE , McDade E , Martins RN , Masters CL , Mayeux R , Ringman JM , Rossor MN , Schofield PR , Sperling RA , Salloway S , Morris JC , Dominantly Inherited Alzheimer, Network ((2012) ) Clinical and biomarker changes in dominantly inherited Alzheimer’s disease. N Engl J Med 367: , 795–804. |
[44] | Palmqvist S , Zetterberg H , Mattsson N , Johansson P , Minthon L , Blennow K , Olsson M , Hansson O , Detailed comparison of amyloid PET and CSF biomarkers for identifying early Alzheimer disease. ((2015) ) Detailed comparison of amyloid PET and CSF biomarkers for identifying early Alzheimer disease. Neurology 85: , 1240–1249. |
[45] | Brinkmalm A , Brinkmalm G , Honer WG , Frölich L , Hausner L , Minthon L , Hansson O , Wallin A , Zetterberg H , Blennow K , Öhrfelt A ((2014) ) SNAP-25 is a promising novel cerebrospinal fluid biomarker for synapse degeneration in Alzheimer’s disease. Mol Neurodegener 9: , 53. |
[46] | Coleman PD , Yao PJ ((2003) ) Synaptic slaughter in Alzheimer’s disease. Neurobiol Aging 24: , 1023–1027. |
[47] | Blennow K , Bogdanovic N , Alafuzoff I , Ekman R , Davidsson P ((1996) ) Synaptic pathology in Alzheimer’s disease: Relation to severity of dementia, but not to senile plaques, neurofibrillary tangles, or the ApoE4 allele. J Neural Transm (Vienna) 103: , 603–618. |
[48] | Pannee J , Gobom J , Shaw LM , Korecka M , Chambers EE , Lame M , Jenkins R , Mylott W , Carrillo MC , Zegers I , Zetterberg H , Blennow K , Portelius E ((2016) ) Round robin test on quantification of amyloid-β 1-42 in cerebrospinal fluid by mass spectrometry. Alzheimers Dement 12: , 55–59. |
[49] | Bjerke M , Andreasson U , Kuhlmann J , Portelius E , Pannee J , Lewczuk P , Umek RM , Vanmechelen E , Vanderstichele H , Stoops E , Lewis J , Vandijck M , Kostanjevecki V , Jeromin A , Salamone SJ , Schmidt O , Matzen A , Madin K , Eichenlaub U , Bittner T , Shaw LM , Zegers I , Zetterberg H , Blennow K ((2016) ) Assessing the commutability of reference material formats for the harmonization of amyloid beta measurements. Clin Chem Lab Med 54: , 1177–1191. |
[50] | Zhabotinsky AM , Camp RN , Epstein IR , Lisman JE ((2006) ) Role of the neurogranin concentrated in spines in the induction of long-term potentiation. J Neurosci 26: , 7337–7347. |
[51] | Alvarez-Bolado G , Rodríguez-Sánchez P , Tejero-Díez P , Fairén A , Díez-Guerra FJ ((1996) ) Neurogranin in the development of the rat telencephalon. Neuroscience 73: , 565–580. |
Figures and Tables
Fig.1
a) Epitope mapping of both mAbs ADxNGCI2 and ADxNGCT1 was performed with overlapping synthetic peptides, ranging from R51 to D78. b) Specificity of the mAbs ADxNGCI2 and ADxNGCT1 was evaluated by western blot analysis where both synthetic full-length neurogranin, as well as a synthetic neurogranin peptide that is truncated at P75, were included in the gel electrophoresis, next to human collagen type I, III, and IV. ADxNGCI2 positively stained both synthetic peptides, whereas ADxNGCT1 only labeled the truncated form. None of the mAbs detected the collagen proteins. c) To confirm the specificity of the prototype ELISA towards neurogranin species truncated at P75, different concentrations were analyzed of several synthetic neurogranin peptides that differ in their C-terminus, i.e., intact (Peptide intact C-term) or either truncated at P75 (Peptide trunc P75) or at S76 (Peptide trunc S76).
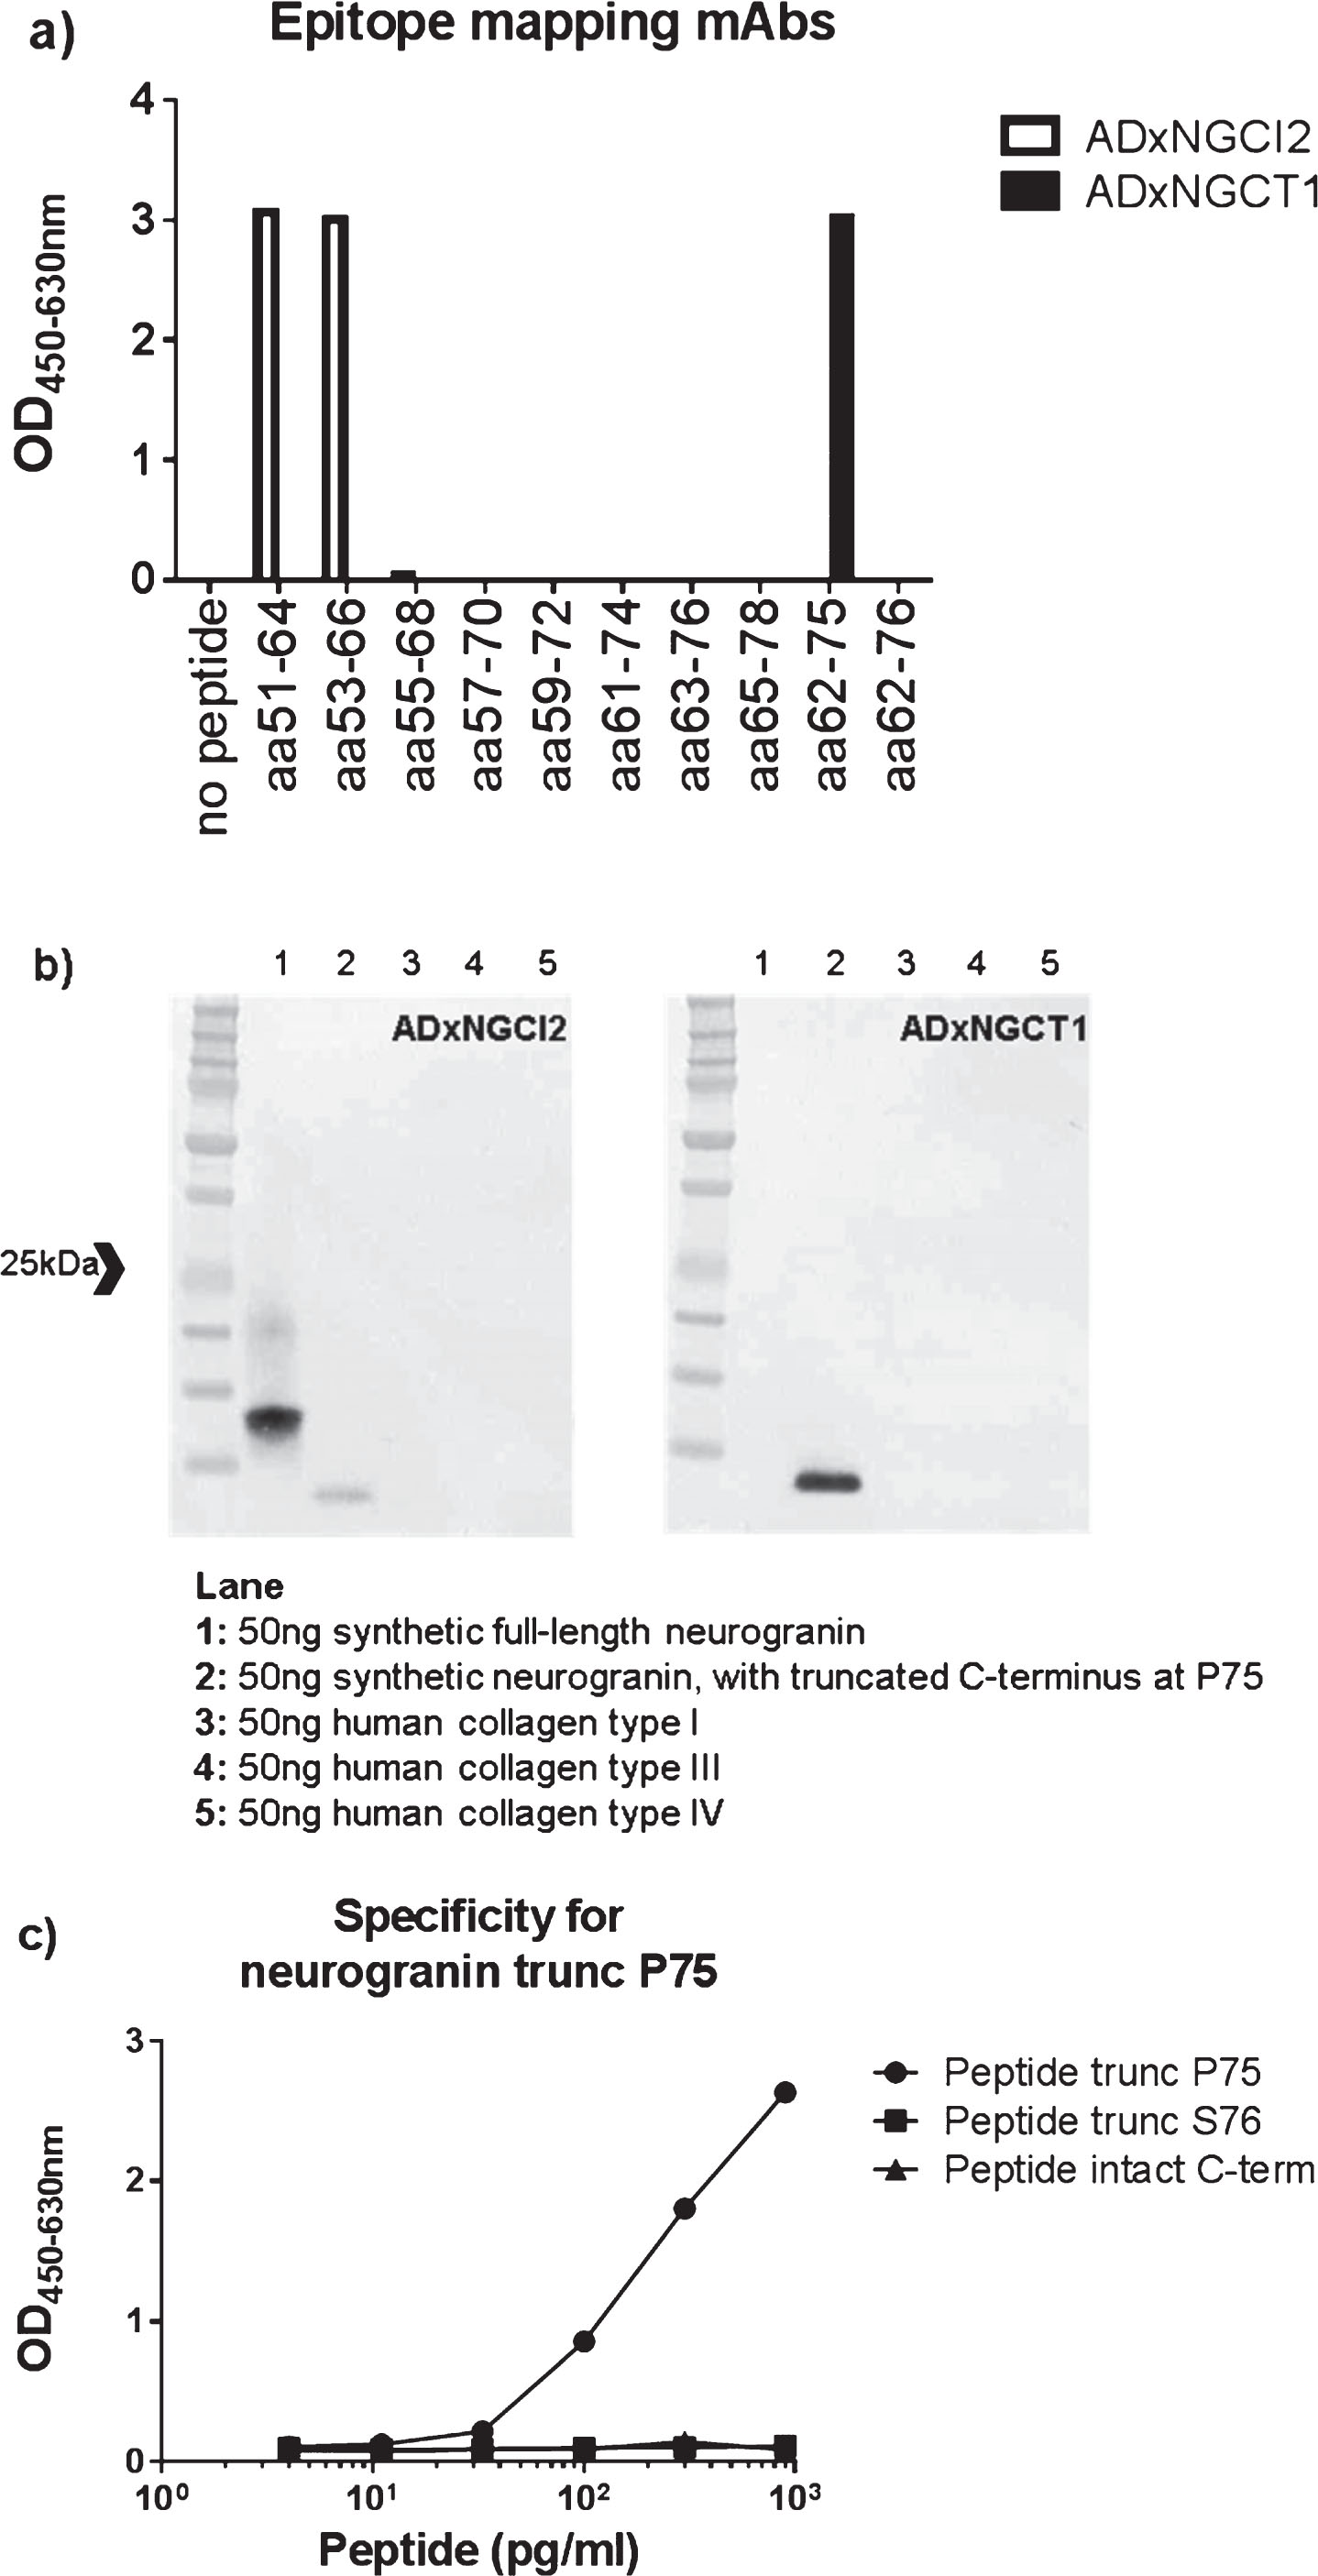
Fig.2
a) The cell body (black arrow) and dendritic shaft (white arrow) of a hippocampal pyramidal neuron immunostained by the ADxNGCI2 mAb. Granular material, probably synapses, are visible in the neuropil. Control case. Scale bar = 20μm. b) Granular (*) and molecular (between white arrows) layers of the dentate gyrus. The inner and outer sub-layers are indicated by black arrows. Neurogranin immunoreactivity is more homogeneous and dense in the inner sublayer. Control case. Scale bar = 40μm. c) Mossy fibers getting out of the hilus of the dentate gyrus and reaching the CA2 sector are indicated by black arrows. The granular layer is visible at the upper right of the picture. Control case. Scale bar = 100μm. d) White matter of the cortex. An immunolabelled axon is visible (black arrows). Scale bar = 20μm. e) Immunolabelled dendrites. Two spines are indicated by the black arrows. Control case. Scale bar = 10μm. f) Senile plaques. They appear negatively stained on the intensely positive neuropil (the three senile plaques are indicated by arrows). AD patient. Scale bar = 50μm. g) Neurofibrillary tangle. A neurofibrillary tangle (white arrow) appears but weakly stained in the cell body of a neuron in which the immunostain was lower than in unaffected neurons. AD patient. Scale bar = 10μm.
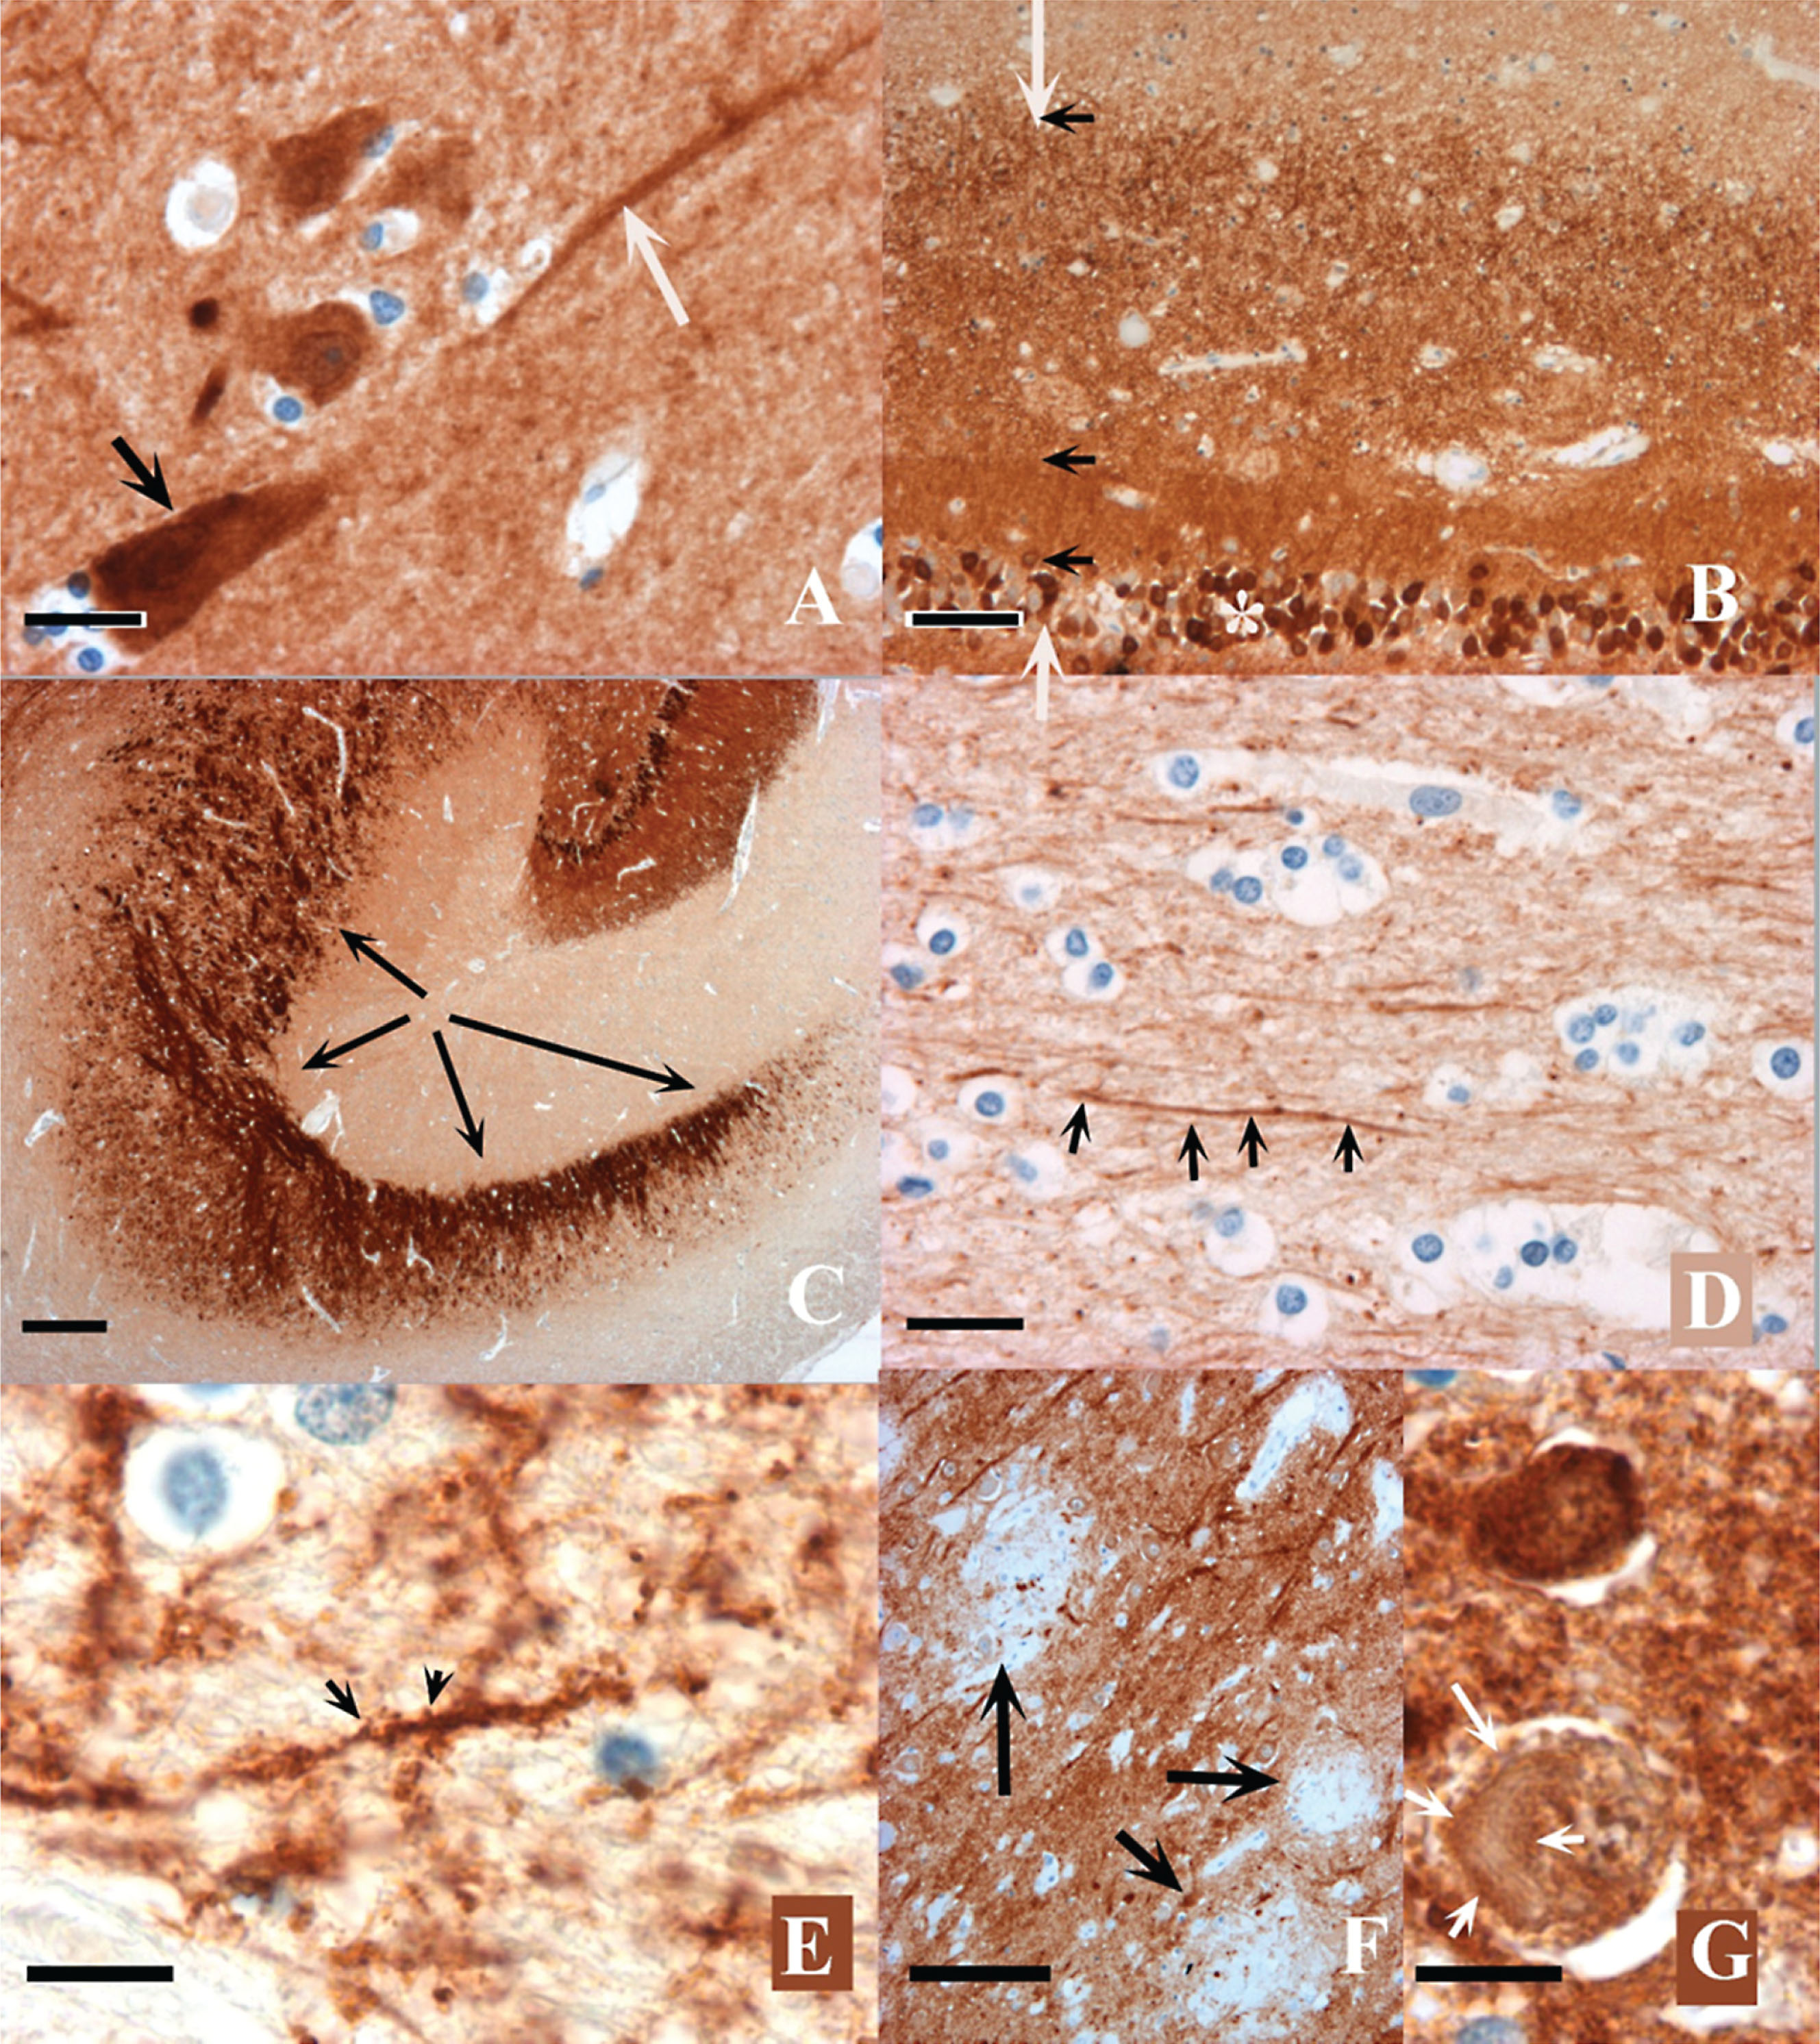
Fig.3
CSF levels of neurogranin trunc P75 (a), BACE1 (b), total-tau (c), Aβ1-42 (d), Aβ1-40 (e), and Aβ1-38 (f) in 20 cognitively healthy persons (black boxes) and 161 unselected CSF samples within a wide age-range (open circles) were plotted against age.
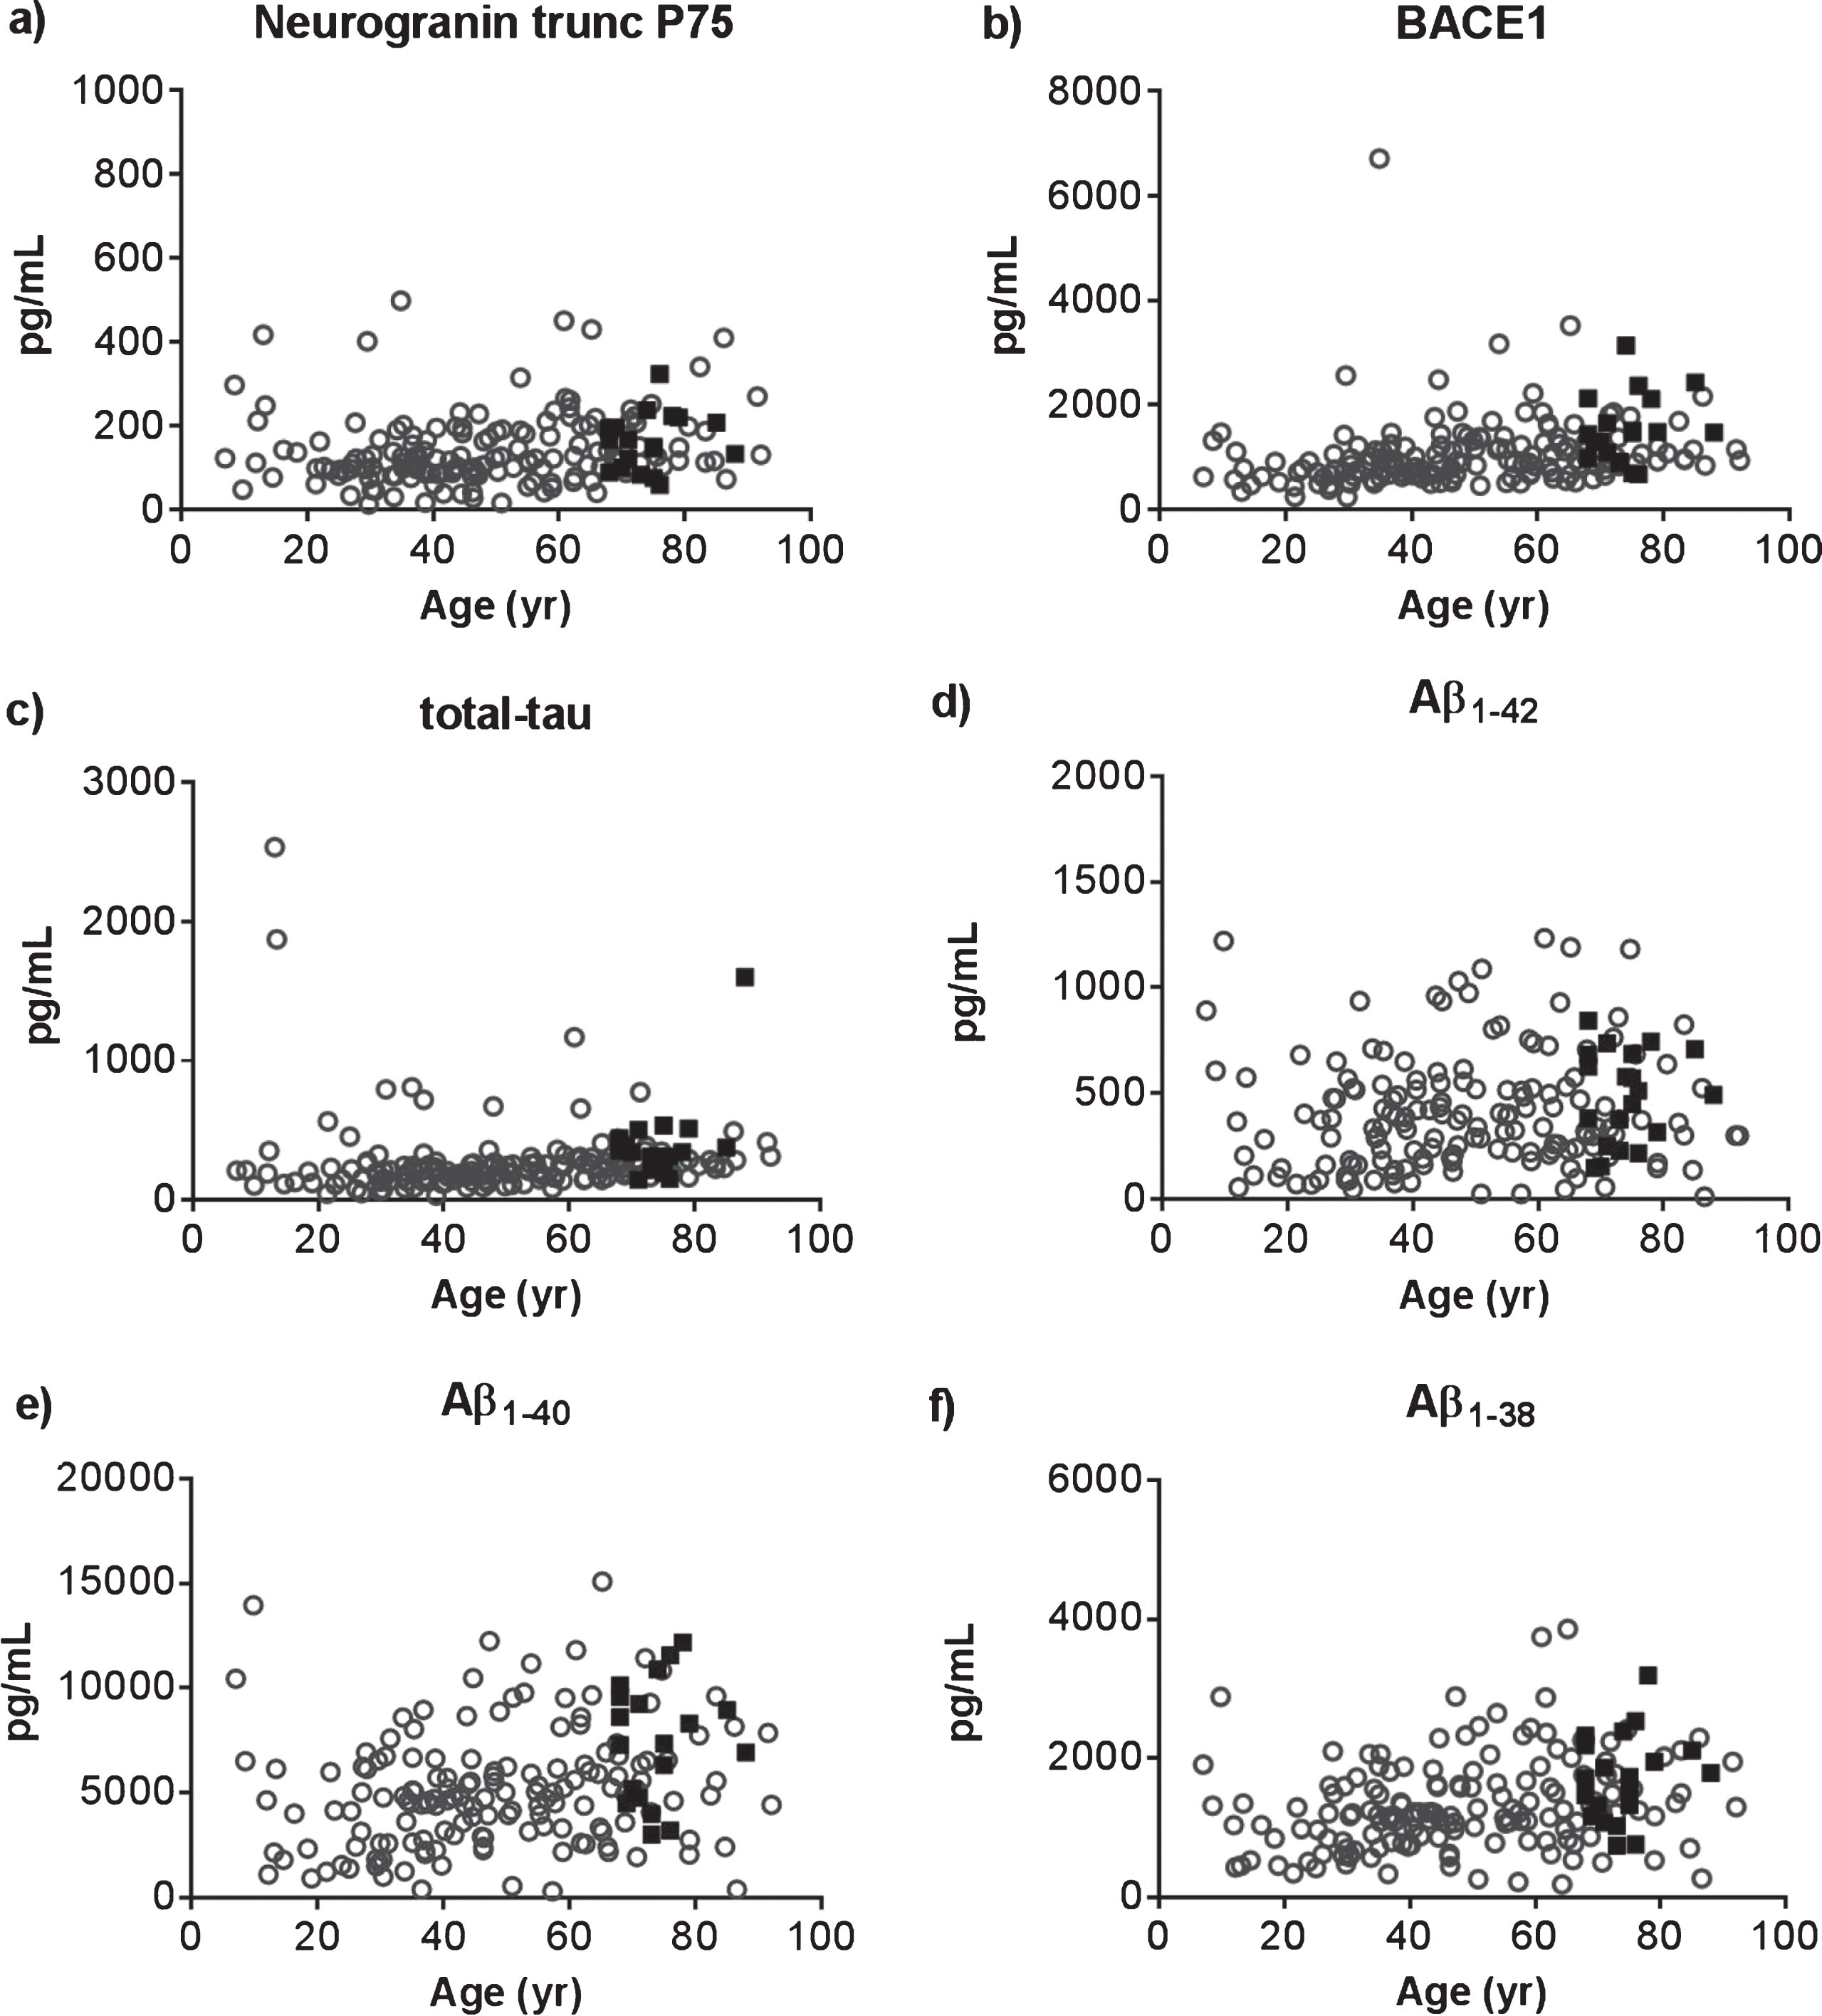
Fig.4
Scatter dot plots demonstrating the concentrations of neurogranin trunc P75 (a) or BACE1 (b) in CSF in the different diagnostic groups: mild cognitive impairment with high probability for Alzheimer’s disease (MCI) (n = 38); dementia due to Alzheimer’s disease (AD) (n = 50); and cognitively healthy participants (CTRL) (n = 20). Presented as a line in each dot plot are the median levels. The bars represent the interquartile range. Statistical significant differences between the groups are presented on the graphs by **p < 0.01.
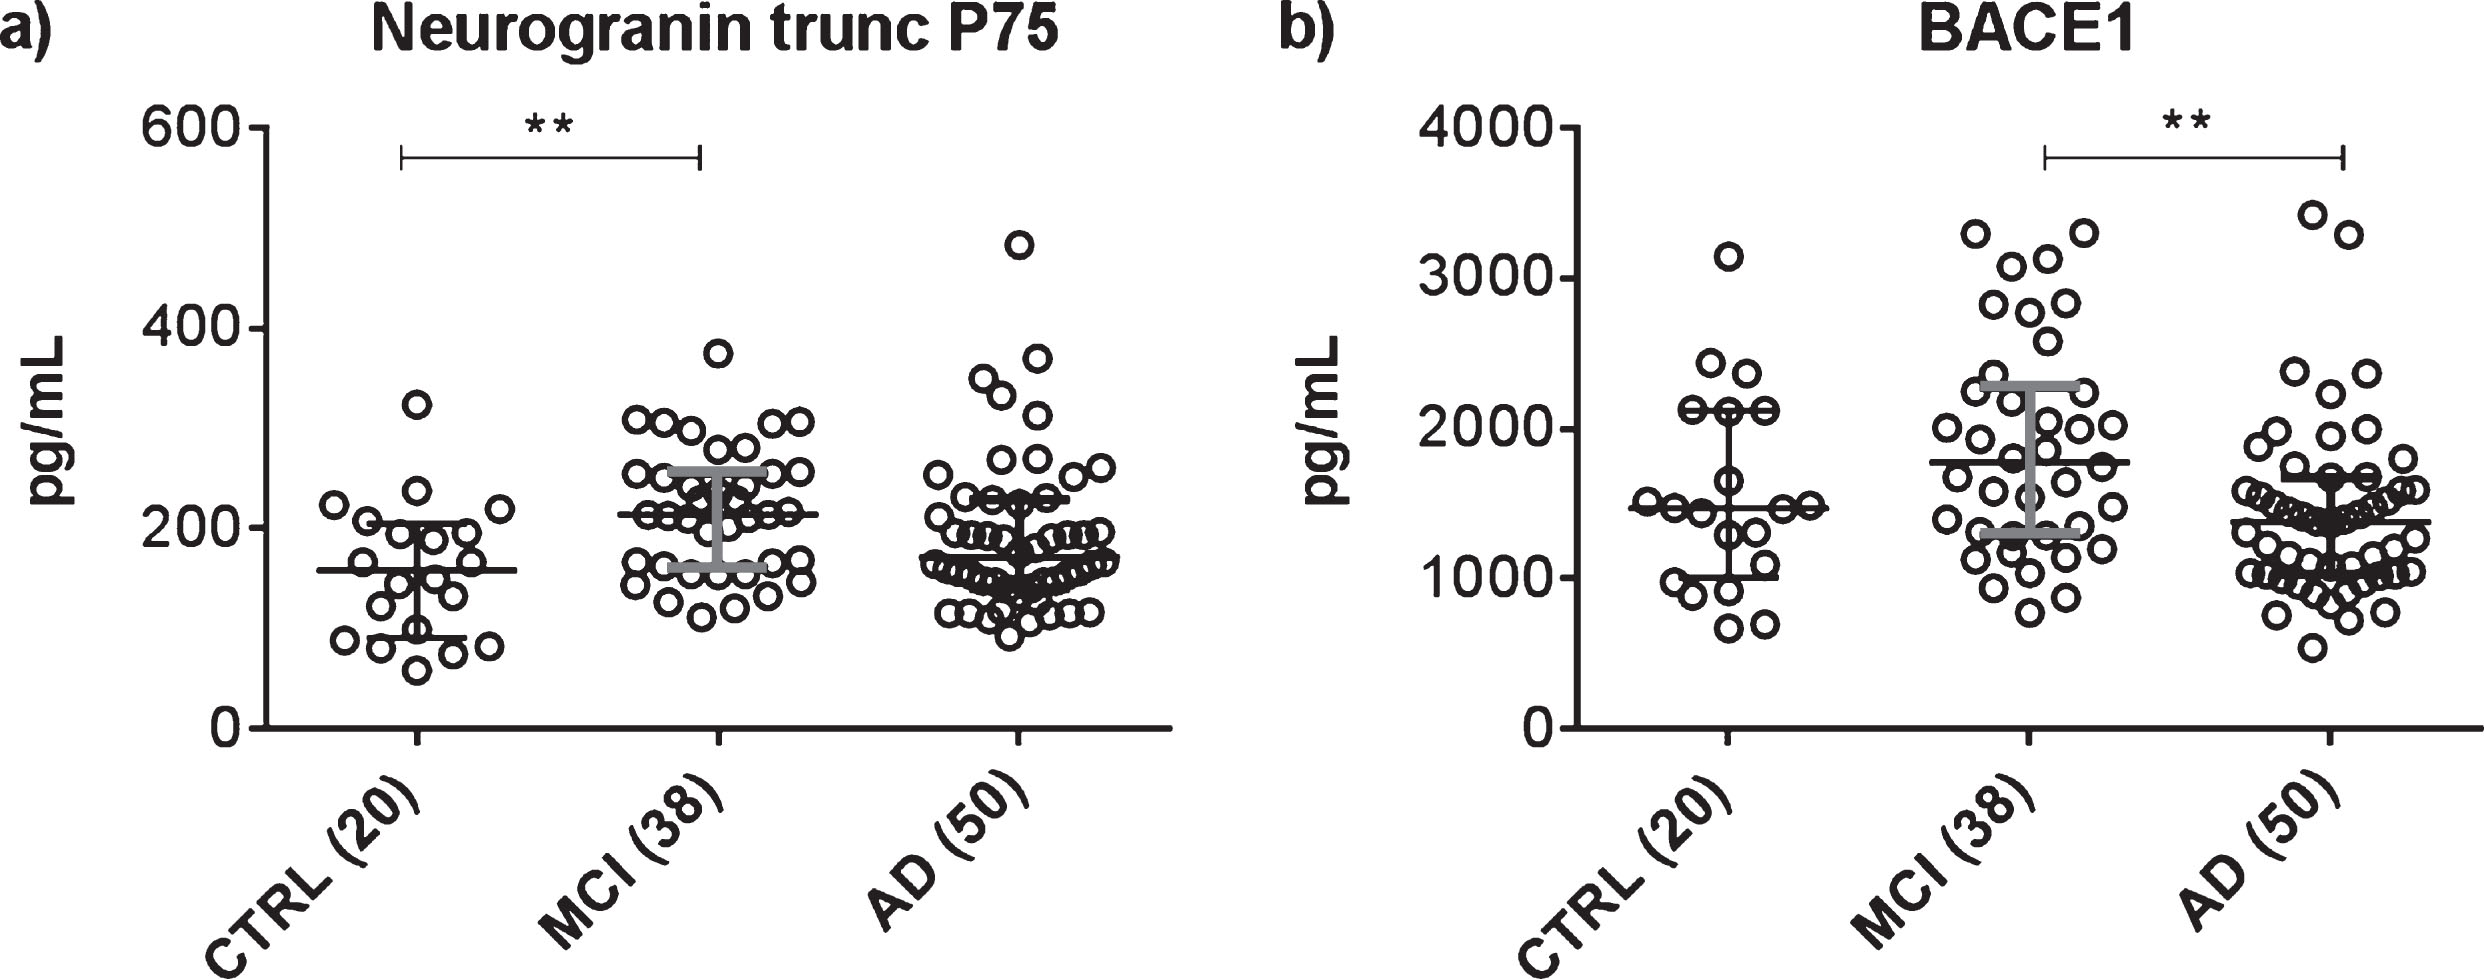
Fig.5
The subset of patients with MMSE at time of LP (time = 0) and/or after LP were divided into tertiles of the ratio levels to illustrate the effect of the CSF neurogranin trunc P75/BACE1 levels on evolution of MMSE over time. The panels show the low (upper panels), medium (mid panels), and high (lower panels) range of levels of CSF neurogranin trunc P75/BACE1. Separate panels were created for both MCI (a) and AD patients (b). For both the MCI and AD group, the observed MMSE was plotted versus time for each range. The thin lines represent the observed MMSE data for individual patients, (upper panels: MCI: n = 11, AD: n = 9; mid panels: MCI: n = 9, AD: n = 11; lower panels: MCI: n = 11, AD: n = 11) the thick lines symbolize the linear regression line of mean MMSE versus time. Patients where MMSE scores at time of LP were available but not post-LP, were included to delineate the tertiles. However, these individuals were not represented by a thin line, since no longitudinal data post-LP was collected in these cases.
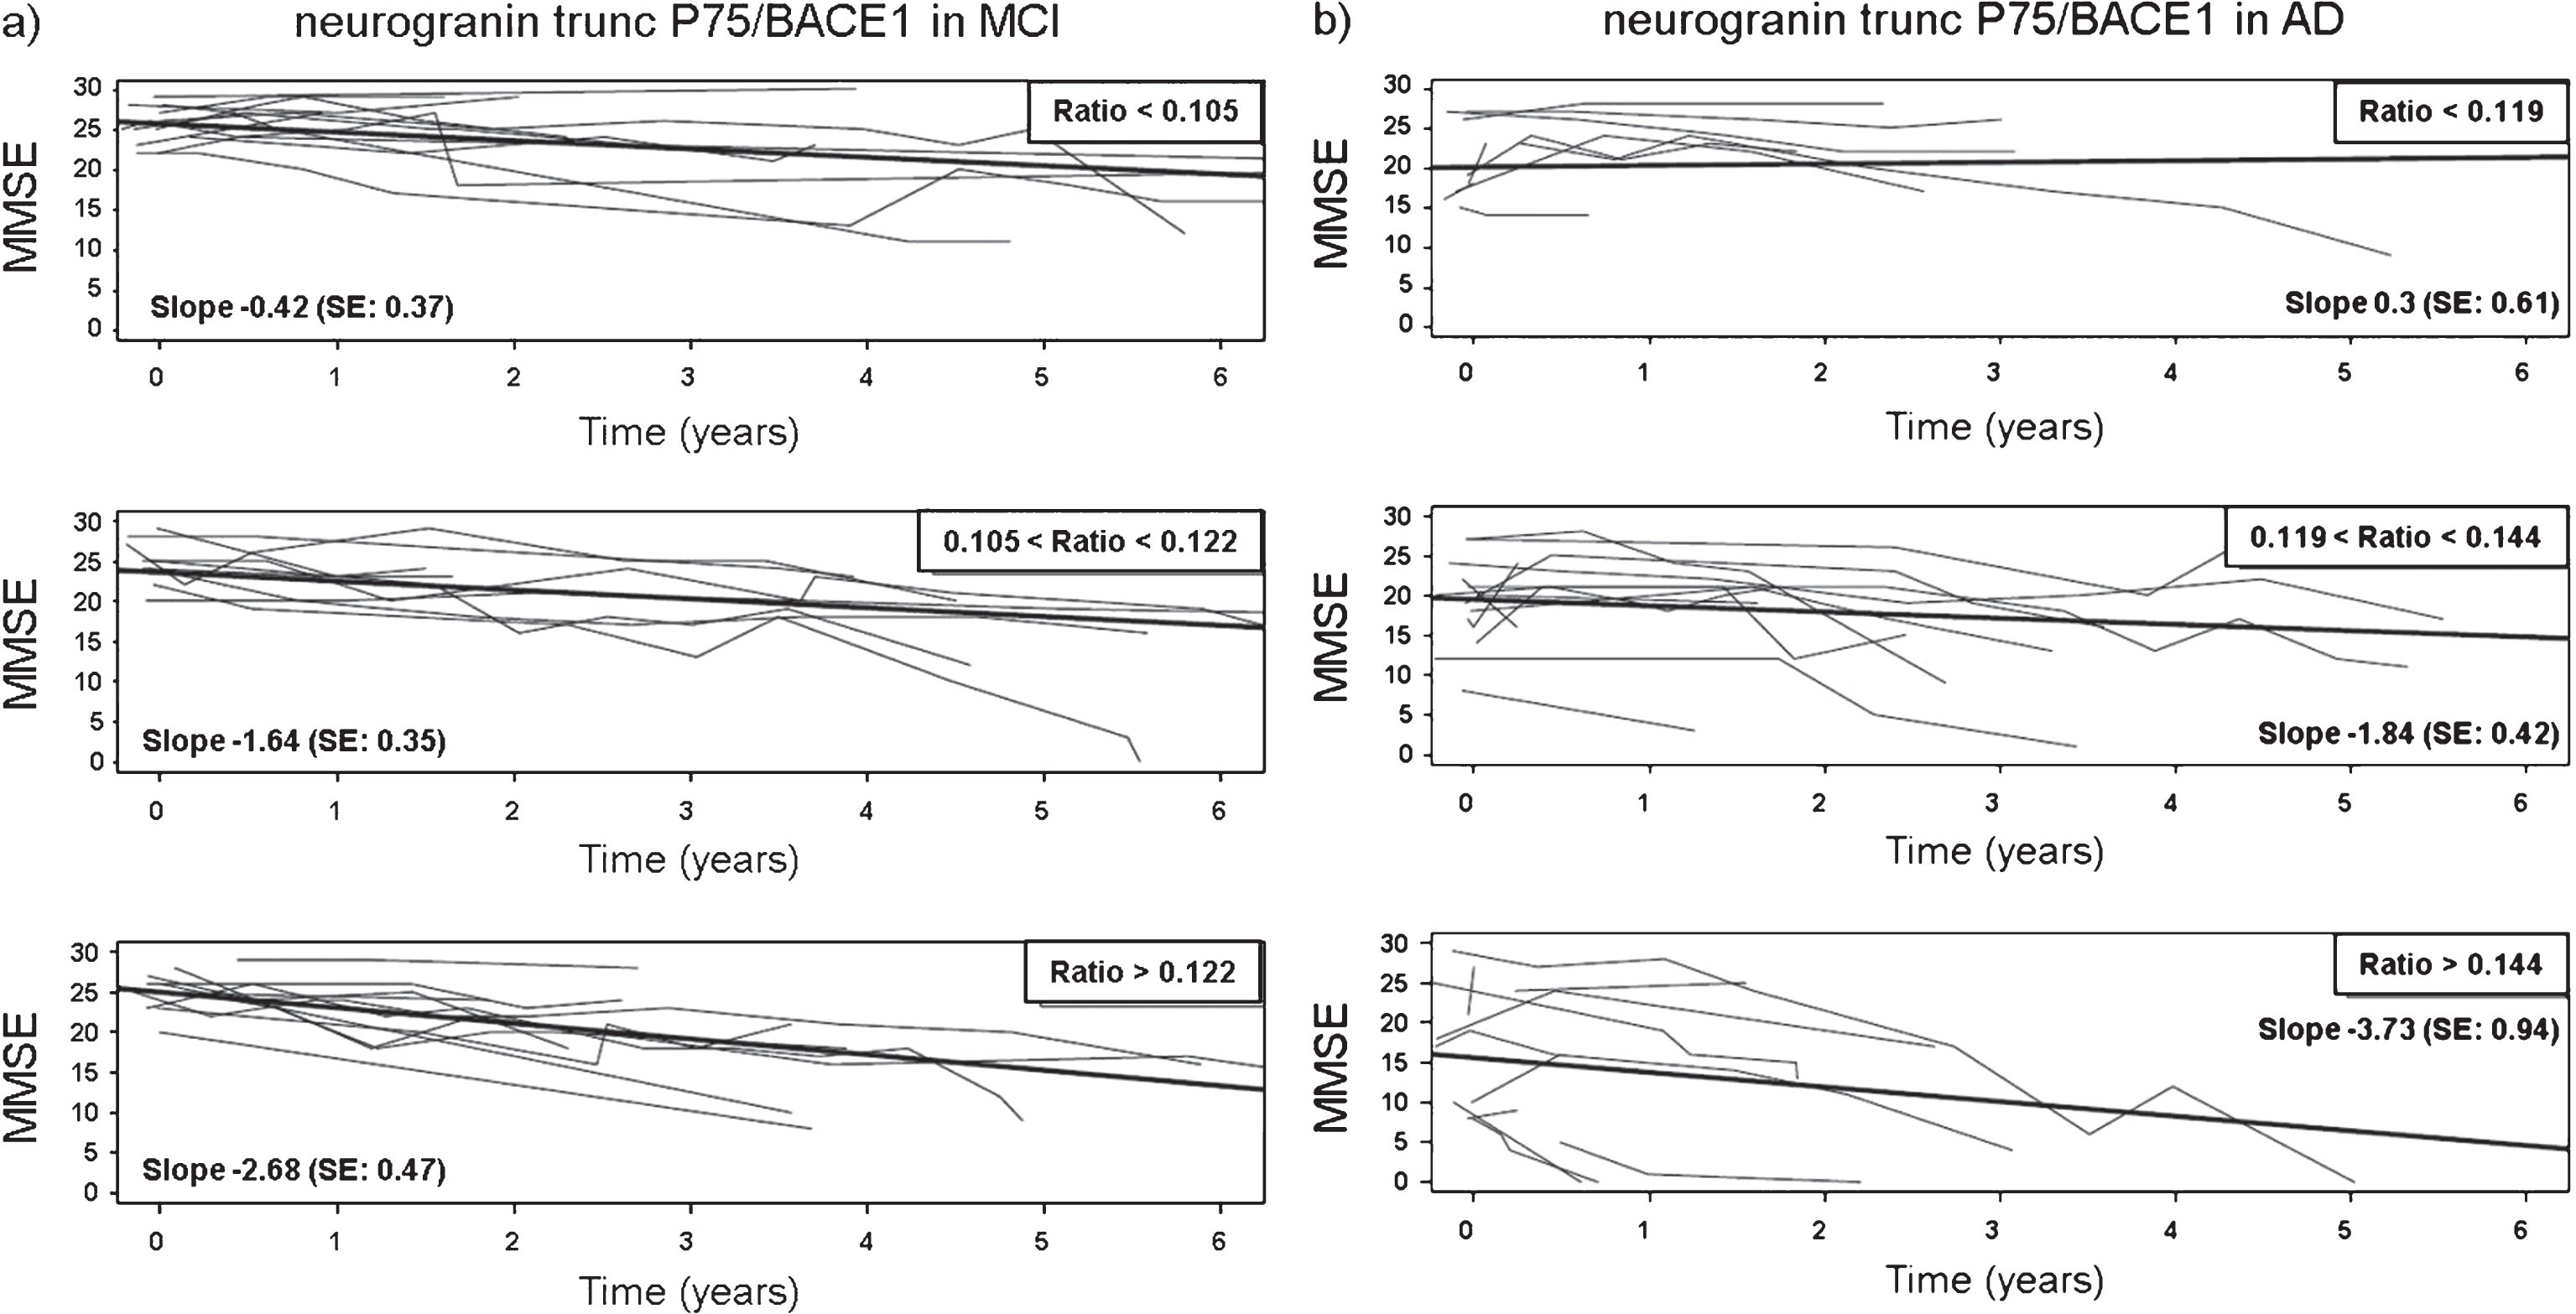
Table 1
Overview of all quantified analytes and their correlation with age, in the cohort of unselected CSF samples and the age-matched control group for the clinical study
| Analytes | % N | Median (p25-p75) | Correlation with age (Spearman’s ρ-value) | p-value of age dependency |
| CSF neurogranin trunc P75 (pg/mL) | 2.8 | 122 (89–191) | 0.253 | 0.0007 |
| CSF BACE1 (pg/mL) | 0 | 934 (702–1304) | 0.412 | <0.0001 |
| CSF total-tau (pg/mL) | 1.7 | 213 (163–301) | 0.366 | <0.0001 |
| CSF Aβ1-42 (pg/mL) | 1.7 | 373 (211–557) | 0.147 | 0.050 |
| CSF Aβ1-40 (pg/mL) | 1.7 | 4872 (3177–6772) | 0.305 | <0.0001 |
| CSF Aβ1-38 (pg/mL) | 1.1 | 1229 (869–1761) | 0.326 | <0.0001 |
% N, percentage of samples not quantifiable (out of 181).
Table 2
Spearman’s correlation analysis on the CSF biomarkers in the age-matched controls from the clinical study and the cohort of diagnostically unselected samples. Each studied relationship between analytes, represented by Spearman’s ρ-values in the table, was statistically significant (p < 0.0001)
| neurogranin trunc P75 | BACE1 | total-tau | Aβ1-42 | Aβ1-40 | Aβ1-38 | |
| neurogranin trunc P75 | ||||||
| BACE1 | 0.746 | |||||
| total-tau | 0.668 | 0.550 | ||||
| Aβ1-42 | 0.448 | 0.474 | 0.306 | |||
| Aβ1-40 | 0.595 | 0.625 | 0.488 | 0.888 | ||
| Aβ1-38 | 0.658 | 0.688 | 0.519 | 0.806 | 0.948 |
Table 3
Summary of the demographic, clinical, and biomarker data of the clinical groups, where data on the analytes are summarized as median values with 25th and 75th quartiles. Median differences between the age-matched control group (CTRL) and the MCI and AD groups were tested using a Kruskal-Wallis test
| CTRL | MCI | AD | |
| Demographic | |||
| Gender, N (F/M) | 20 (10/10) | 38 (23/15) | 50 (27/23) |
| Age at LP (y) | 74 (69–76) | 73 (69–79) | 75 (68–78) |
| Clinical | |||
| MMSE at LP (/30) | 27 (24–30) | 25 (23–27) | 18 (12–23) |
| Biochemical | |||
| CSF neurogranin trunc P75 (pg/mL) | 159 (92–205) | 214 (161–256)** | 172 (141–230) |
| CSF BACE1 (pg/mL) | 1472 (1012–2121) | 1777 (1291–2276) | 1378 (1031–1679) |
| CSF total-tau (pg/mL) | 349 (242–434) | 567 (446–706)**** | 535 (454–711)**** |
| CSF Aβ1-42 (pg/mL) | 503 (267–687) | 283 (219–350)* | 208 (166–287)**** |
| CSF Aβ1-40 (pg/mL) | 7352 (4884–9514) | 7685 (6604–9881) | 5662 (4307–7413) |
| CSF Aβ1-38 (pg/mL) | 1728 (1206–2169) | 1802 (1539–2385) | 1316 (1075–1659) |
| CSF Aβ1-42/total-tau | 1.539 (0.911–1.916) | 0.502 (0.380–0.622)*** | 0.354 (0.290–0.470)**** |
| CSF Aβ1-42/Aβ1-40 | 0.070 (0.052–0.080) | 0.035 (0.028–0.040)**** | 0.038 (0.029–0.045)**** |
| CSF Aβ1-42/Aβ1-38 | 0.286 (0.225–0.364) | 0.154 (0.111–0.179)**** | 0.162 (0.115–0.191)**** |
| CSF neurogranin trunc P75/BACE1 | 0.095 (0.088–0.111) | 0.120 (0.101–0.142)* | 0.136 (0.114–0.157)*** |
| CSF neurogranin trunc P75/Aβ1-42 | 0.297 (0.228–0.492) | 0.767 (0.560–1.026)**** | 0.843 (0.626–1.135)**** |
AD, Alzheimer’s disease; CTRL, cognitively healthy; F, female; LP, lumbar puncture; M, male; MCI, mild cognitive impairment with high probability for AD; MMSE, Mini-Mental State Examination; N, number of samples; y, years. The statistical significance (versus CTRL) is represented by *p < 0.05; **p < 0.01; ***p < 0.001; ****p < 0.0001.
Table 4
ROC-statistics on the CSF biomarkers as single analytes or as ratio, where the set of data of the CTRL group was aligned with the MCI or AD group. The p-values <0.05 are emphasized in bold font
| MCI versus CTRL (n = 38) | AD versus CTRL (n = 50) | |||
| Single analyte | AUC | p-value | AUC | p-value |
| neurogranin trunc P75 | 0.741 | 0.003 | 0.615 | 0.137 |
| BACE1 | 0.620 | 0.137 | 0.554 | 0.487 |
| total-tau | 0.842 | < 0.0001 | 0.854 | < 0.0001 |
| Aβ1-42 | 0.765 | 0.001 | 0.849 | < 0.0001 |
| Aβ1-40 | 0.559 | 0.467 | 0.660 | 0.038 |
| Aβ1-38 | 0.622 | 0.130 | 0.645 | 0.059 |
| Ratio of analytes | AUC | p-value | AUC | p-value |
| Aβ1-42/Aβ1-40 | 0.904 | < 0.0001 | 0.887 | < 0.0001 |
| Aβ1-42/Aβ1-38 | 0.894 | < 0.0001 | 0.876 | < 0.0001 |
| Aβ1-42/total-tau | 0.871 | < 0.0001 | 0.923 | < 0.0001 |
| neurogranin trunc P75/Aβ1-42 | 0.874 | < 0.0001 | 0.903 | < 0.0001 |
| neurogranin trunc P75/BACE1 | 0.715 | 0.008 | 0.806 | < 0.0001 |
AD, Alzheimer’s disease; AUC, Area Under the ROC; CTRL, cognitively healthy; MCI, mild cognitive impairment with high probability for AD; ROC, receiver operating curve.
Table 5
Spearman’s correlation analysis on the CSF biomarkers in MCI (above diagonal) and AD patients (below diagonal)
| MCI (n = 38) neurogranin trunc P75 | BACE1 | tau | Aβ1-42 | Aβ1-40 | Aβ1-38 | ||
| AD (n = 50) | neurogranin trunc P75 | 0.793**** | 0.635**** | 0.048 | 0.544*** | 0.731**** | |
| BACE1 | 0.711**** | 0.588*** | 0.238 | 0.619**** | 0.763**** | ||
| tau | 0.617**** | 0.497*** | 0.383* | 0.649**** | 0.631**** | ||
| Aβ1-42 | 0.196 | 0.408** | 0.277 | 0.649**** | 0.320 | ||
| Aβ1-40 | 0.565**** | 0.679**** | 0.522*** | 0.781**** | 0.770**** | ||
| Aβ1-38 | 0.706**** | 0.726**** | 0.478*** | 0.526**** | 0.819**** |
AD, Alzheimer’s disease; MCI, mild cognitive impairment with high probability for AD. The statistical significance is represented by *p < 0.05; **p < 0.01; ***p < 0.001; ****p < 0.0001.
Table 6
Spearman’s correlation analysis on CSF neurogranin trunc P75, BACE1, and total-tau with the ratios CSF Aβ1-42/Aβ1-40 and CSF Aβ1-42/Aβ1-38 in CTRL as well as MCI and AD
| Aβ1-42/Aβ1-40 | Aβ1-42/Aβ1-38 | |||||
| CTRL (n = 20) | MCI (n = 38) | AD (n = 50) | CTRL (n = 20) | MCI (n = 38) | AD (n = 50) | |
| neurogranin trunc P75 | –0.371 | –0.608**** | –0.651**** | –0.430 | –0.662**** | –0.365** |
| BACE1 | –0.063 | –0.485** | –0.497*** | –0.140 | –0.551*** | –0.167 |
| total-tau | 0.092 | –0.275 | –0.465*** | –0.012 | –0.293 | –0.080 |
AD, Alzheimer’s disease; CTRL, cognitively healthy; MCI, mild cognitive impairment with high probability for AD. The corresponding statistical significance is represented by **p < 0.01; ***p < 0.001; ****p < 0.0001.
Table 7
Statistical significance of the association between cognitive decline and the single analytes and ratios, based on linear mixed model analysis (MCI n = 36; AD n = 45), adjusted for age and gender. The p-values <0.05 are underlined and emphasized in bold font
| Single analyte | MCI (n = 36) p-value | AD (n = 45) p-value |
| total-tau | 0.684 | 0.245 |
| Aβ1-40 | 0.534 | 0.927 |
| Aβ1-42 | 0.192 | 0.490 |
| Aβ1-38 | 0.888 | 0.493 |
| BACE1 | 0.524 | 0.996 |
| Neurogranin trunc P75 | 0.766 | 0.203 |
| Ratio of analytes | ||
| Aβ1-42/Aβ1-40 | 0.434 | 0.605 |
| Aβ1-42/total-tau | 0.122 | 0.092 |
| Neurogranin trunc P75/Aβ1-42 | 0.286 | 0.023 |
| Neurogranin trunc P75/total-tau | 0.999 | 0.615 |
| BACE1/Aβ1-42 | 0.888 | 0.458 |
| BACE1/total-tau | 0.099 | 0.098 |
| Neurogranin trunc P75/BACE1 | 0.036 | 0.005 |

