Gene Expression-Based Predication of RNA Pseudouridine Modification in Tumor Microenvironment and Prognosis of Glioma Patients
 Lin-jian Wang
 Peipei Lv
 Yongli Lou1*
 - 1Department of Neurosurgery, Zhengzhou Central Hospital Affiliated to Zhengzhou University, Zhengzhou, China
- 2Metabolic Disease Research Center, Zhengzhou Central Hospital Affiliated to Zhengzhou University, Zhengzhou, China
- 3Department of Radiology, Zhengzhou Central Hospital Affiliated to Zhengzhou University, Zhengzhou, China
- 4Center for Advanced Medicine, College of Medicine, Zhengzhou University, Zhengzhou, China
Aberrant expression of methyltransferases and demethylases may augment tumor initiation, proliferation and metastasis through RNA modification, such as m6A and m5C. However, activity of pseudouridine (Ψ) modification of RNA remains unknown in glioma, the most common malignant intracranial tumor. In this study, we explored the expression profiles of the Ψ synthase genes in glioma and constructed an efficient prediction model for glioma prognosis based on the CGGA and TCGA datasets. In addition, the risk-score signature was positively associated with malignancy of gliomas and the abundance of tumor-infiltrating immune cells such as macrophages M0 and regulatory T cells (Tregs), but negatively associated with the abundance of monocytes, NK cell activation and T cell CD4+ naive. In terms of mechanism, the risk-score signature was positively associated with the expression of inflammatory molecules such as S100A11 and CASP4 in glioma. Overall, this study provided evidence for the activity of RNA Ψ modification in glioma malignancy and local immunity.
Introduction
More than 160 distinct chemical modifications have been identified in RNA molecules (Boccaletto et al., 2018), which may regulate RNA stability and function in eukaryotic cells. N6-methyladenosine (m6A) modification (Dominissini et al., 2012) is involved in regulation of a broad range of cellular activities, such as viral infection, vascular development, autoinflammatory disorders and cancer (Wang L. J. et al., 2020; Zhou et al., 2020; Tang et al., 2021). The study of m6A promotes investigation of other RNA modifications, such as 5-methylcytidine (m5C), N1-methyladenosine (m1A), N7-methylguanosine (m7G), ribose methylations (Nm), N4-acetylcytidine (ac4C) and pseudouridine (Ψ) modification (Wiener and Schwartz, 2021). These RNA modifications may directly affect the activities of mRNA in several ways, including decay, translation efficiency and stability, and thus shape the transcriptomic landscapes (Frye et al., 2018). Ψ is a prevalent type of nucleoside modification that occurs in both non-coding RNA and mRNA (Carlile et al., 2014). Ψ plays an essential role in various molecular mechanisms, such as the stabilization of RNA structure (Davis et al., 1998; Charette and Gray, 2000), RNA-RNA and RNA-protein interactions (Basak and Query, 2014) and the metabolism of RNAs (Ma et al., 2003; Carlile et al., 2014). Pseudouridylation is catalyzed by pseudouridine synthases. In eukaryotic cells, there are 17 different pseudouridine synthases, while 12 pseudouridine synthase genes have been discovered in humans: PUS1, PUS3, PUS7, PUS7L, PUS10, DKC1, RPUSD1, RPUSD2, RPUSD3, RPUSD4, TRUB1, and TRUB2 (Penzo et al., 2017). The abnormality of Ψ modification is associated with various diseases. For instance, DKC1 stabilizes the mRNA of some ribosomal proteins depending on its pseudouridine synthase activity, thereby promoting colorectal cancer progression in vitro and in vivo (Kan et al., 2021). Increasing evidences have suggested an association between abnormal expression of Ψ synthases (such as PUS1, PUS7, PUS10 and DKC1) and tumor malignant progression (Jana et al., 2017; Elsharawy et al., 2020; Du et al., 2021; Stockert et al., 2021). In addition, Ψ synthase inhibitors have been shown to repress tumor growth (Gmeiner, 2020; Kan et al., 2021). However, the activity of Ψ synthases remains unclear in glioma.
Primary gliomas are graded from I to IV according to the classification scheme specified by the World Health Organization (WHO) (Ostrom et al., 2018). WHO grade II and III gliomas, including astrocytomas, oligodendrogliomas and mixed oligoastrocytomas, are defined as lower-grade gliomas (LGG). WHO grade IV gliomas (Glioblastoma, GBM) are highly malignant, and its characteristics are significantly different from those of LGG (Ostrom et al., 2019). A wide range of efforts have been made during the past decades to improve the diagnosis and prognosis of glioma. Notably, RNA modification, especially m6A and m5C modification, have been proposed as a new class of epigenetic markers in the diagnosis of glioma malignancies, and the related enzymes have shown a great value in prognostic of glioma (Wang P. et al., 2020; Lin et al., 2020). However, there is no report on the relationship between Ψ synthase gene expression and characteristics of glioma.
In this study, we explored the expression profiles of Ψ synthases and found abnormal expression of seven synthase genes (PUS1, PUS7, RPUSD1, RPUSD3, DKC1, TRUB1 and PUS7L) in GBM relative to LGG in the CGGA dataset. The Ψ synthase genes that are closely related to overall survival (OS) were extracted to perform the least absolute shrinkage and selection operator (LASSO) multivariate Cox regression algorithm. Five positive genes (PUS1, PUS7, RPUSD1, DKC1 and TRUB1) were selected to construct a high efficacy prediction model. We identified differentially expressed genes (DEGs) between the high-risk group and the low-risk group to explore the mechanism by which risk-score signature affect prognosis. The results of GO analysis suggested that the up-regulated DEGs were significantly enriched in the signaling pathway of immune-related reactions. Moreover, analysis of immune landscape suggested that the tumor microenvironment (TME) and tumor-infiltrating lymphocytes (macrophages M0, monocytes, NK cell activation, T cell CD4+ naive and Tregs) were significantly different between the high-risk group and low-risk group. Weighted correlation network analysis (WGCNA) was applied to identify the candidate hub genes that may regulate TME and immune cell infiltration of glioma based on the CGGA dataset. Finally, we found the expression of inflammatory molecules CASP4 and S100A11 were positively associated with Ψ synthase-related risk-score signature. In summary, we identified the link of Ψ synthase genes to glioma prognosis, and potential value of Ψ modification in glioma malignancy and local immunity.
Methods and Materials
Datasets and Samples
The Chinese Glioma Genome Atlas (CGGA) RNA-seq data (#325) and clinical data were downloaded from the CGGA data portal (http://www.cgga.org.cn/) as the training set. The merged GBMLGG datasets (The Cancer Genome Atlas, TCGA) were downloaded from the cBio Cancer Genomics Portal (cBioPortal, http://www.cbioportal.org) as the validation set (Cerami et al., 2012). After excluding samples with missing clinical data such as survival and WHO grade, 309 (CGGA dataset) and 674 (TCGA dataset) glioma patients were finally enrolled in this study. In addition, the CGGA RNA-seq data (#693), CGGA mRNA array data and the GSE59612 expression data were downloaded from CGGA data portal and GEO website (https://www.ncbi.nlm.nih.gov/geo/), respectively.
Five WHO grade II/III and five WHO grade IV glioma samples were collected from patients undergoing surgical treatment from November 2019 to December 2020 in Zhengzhou Central Hospital Affiliated to Zhengzhou University. The clinical diagnosis was confirmed by immunohistochemical staining. This study was approved by the institutional review board of Zhengzhou Central Hospital Affiliated to Zhengzhou University, and informed consents were obtained from all patients.
Construction of the Risk Score Model
The difference in Ψ synthase gene expression between LGG and GBM was identified in the datasets of CGGA, TCGA and GSE59612. Univariate Cox regression analysis was performed to identify the genes related to overall survival (OS). Five Ψ synthase genes were screened out by performing the least absolute shrinkage and selection operator (LASSO) multivariate Cox regression algorithm in the R package “glmnet”. Finally, the signature genes and coefficients in the risk-score signature were constructed based on the most suitable penalty parameter λ. The risk score formula used in this study was:
where
Identification of DEGs and GO Enrichment Analysis
The differentially expressed genes (DEGs) were identified by executing the “limma” package in R software (Ritchie et al., 2015). EDGs were determined with adjusted p-value < 0.05 and |log2FC| ≥ 1 in fold change between the high-risk and low-risk groups in the CGGA and TCGA datasets, respectively. Gene Ontology (GO) enrichment analysis was conducted using the R package “clusterprofiler” (Yu et al., 2012).
Immune Landscape Analysis
The immune scores, stromal scores and ESTIMATE scores of gliomas were calculated using the “estimate” package in R software. The Immunophenoscores of gliomas were calculated using IPS algorithm (Charoentong et al., 2017). The abundance of tumor-infiltrating immune cells were evaluated on the TIMER2 platform (http://timer.cistrome.org/) based on gene expression profiles (Li et al., 2020).
Weighted Correlation Network Analysis (WGCNA)
In order to identify the clinical traits-related modules and hub genes, DEGs identified in both CGGA and TCGA datasets and clinical traits were incorporated to perform Weighted correlation network analysis (WGCNA) using R package “WGCNA”. The adjacency matrix was then transformed into topological overlap matrix (TOM). Genes were divided into different gene modules according to the TOM-based dissimilarity measure. The soft-thresholding power was set at five in the scale-free network. Hub genes of each module were computed and the close modules were integrated with setting the height to 0.25, the deep split to two and the min module size to 20.
Immunohistochemical Staining
After deparaffinization and rehydration, the tissue slices were submerged in the peroxidase blocking solution which was mixed with one part 30% hydrogen peroxide and nine parts methanol for 10 min. After that, the slices were treated with 0.01 M citrate buffer and incubated with serum blocking solution for 20 min, and followed by incubation with anti-DKC1 (Abcam, ab156877, 1:100) or anti-RPUSD1 (Merck, HPA041144, 1:500) primary antibody overnight at 4°C. Thereafter, the slices were incubated with biotin-labeled secondary antibody for 20 min, and followed by incubation with horseradish peroxidase-conjugated avidin for 20 min. Finally, the sections were stained with diaminobenzidine, and nuclei were counterstained with hematoxylin.
Statistical Analysis
One-way ANOVA, wilcox test, and t test were used to identify significant difference in gene expression and infiltration of immune cells in gliomas with different WHO grades and different risk groups. Univariate, multivariate, LASSO Cox regression and Kaplan-Meier analyses were performed to construct and evaluate the risk signature using the R packages “glmnet” and “survival”. Roc curve analysis was performed to predict the OS of glioma patients through the R package “survivalROC”. All statistical analyses were conducted using GraphPad Prism six software, R software v4.0.1 and SPSS v26, and a p value of less than 0.05 was considered statistically significant.
Results
Identification of Pseudouridine Synthase Genes in Glioma
Abnormal expression of certain Ψ synthases can affect the phenotype of cancer cells and behavior of tumor progression (Jana et al., 2017; Elsharawy et al., 2020; Du et al., 2021). As illustrated in the flowchart (Figure 1), we first analyzed the RNA-seq data of the CGGA, TCGA and GSE59612 datasets to characterize the expression pattern of 12 Ψ synthase genes in glioma. In the CGGA cohort, compared with LGG, the expression of PUS1, PUS7, RPUSD1, RPUSD3 and DKC1 were distinctly up-regulated in GBM; meanwhile, the expression of TRUB1 and PUS7L were significantly down-regulated in GBM (Figures 2A,B). In the TCGA cohort, except that PUS7L was not differentially expressed, the expression of other genes between LGG and GBM was similar to that of CGGA dataset (Figure 2C). In the GSE59612 dataset, the expression of PUS1, PUS7, RPUSD1 and DKC1 were significantly increased in the tumor core tissues relative to tumor marginal tissues and paracancerous tissues; and the expression of TRUB1 was decreased from paracancerous tissue to tumor core tissue (Figure 2D). Furthermore, the expression levels of these seven genes were significantly different in the groups compartmentalized by IDH-mutant status, MGMT promoter status, 1p/19q codel status and age in the CGGA dataset (Supplementary Figure S1).
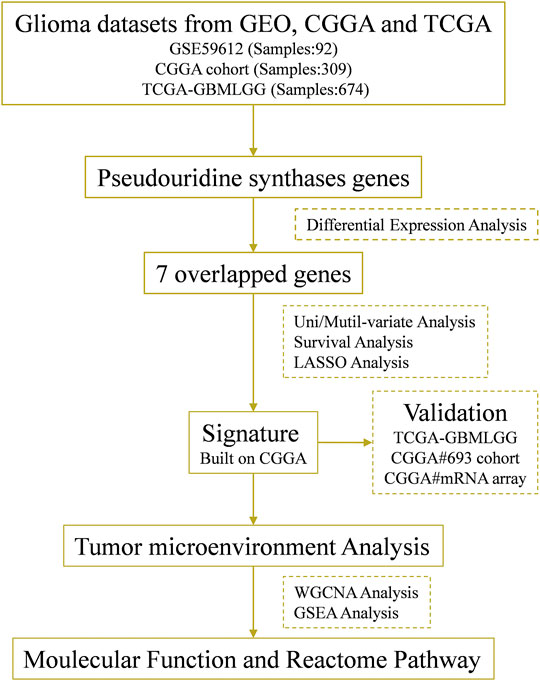
FIGURE 1. Flow chart of this study.
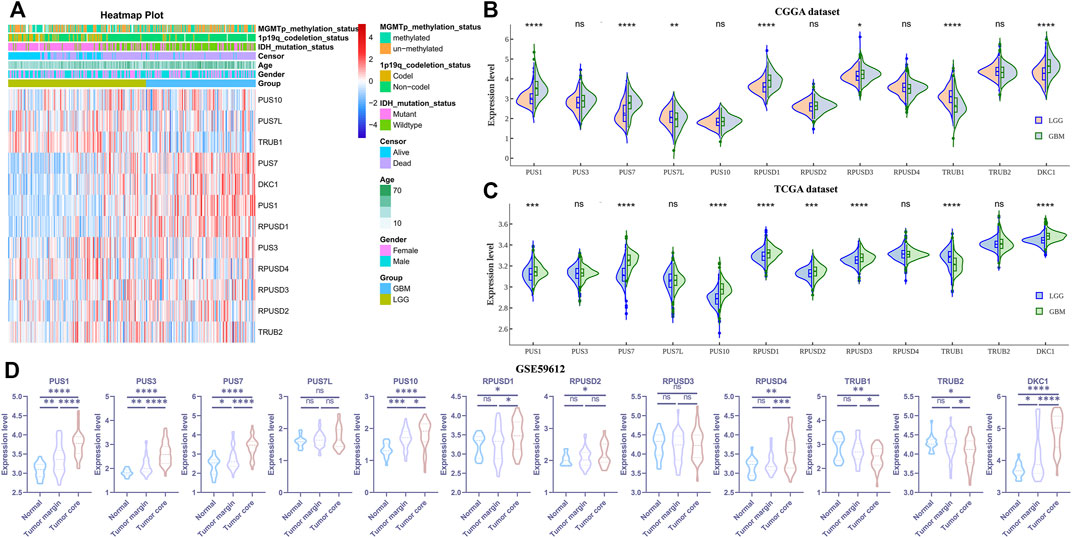
FIGURE 2. The expression levels of the 12 pseudouridine synthase genes in glioma (A) Heatmap depicting the expression levels of the 12 pseudouridine synthase genes in the CGGA dataset (B–C) Violin plot showing the expression levels of the 12 pseudouridine synthase genes between LGG and GBM in the CGGA and TCGA datasets, respectively (D) Violin plot showing the expression levels of the 12 pseudouridine synthase genes between paracancerous tissue (n = 17), tumor marginal tissues (n = 36) and tumor core tissue (n = 39) in the GSE59612 dataset. p values were calculated using wilcox test (B–C) and Student’s t-test (D). *, p < 0.05; **, p < 0.01; ***, p < 0.001, ****, p < 0.0001.
Construction of the Risk-Score Signature
Univariate Cox regression analysis was performed to identify relationship between Ψ synthase genes and patient survival in the CGGA and TCGA datasets. Six Ψ synthase genes were associated with the prognosis, of which the expression of PUS1, PUS7, RPUSD1 and RPUSD3 was positively associated with the malignancy of glioma (HR > 1), and TRUB1 was negatively associated with the malignant grade (HR < 1) (Figure 3). Moreover, univariate Cox regression analysis was performed in different subgroups stratified according to pathological grade and IDH status. The results showed that PUS1, PUS7, and DKC1 were significantly correlated with the prognosis of gliomas in different subgroups (Supplementary Table S1).
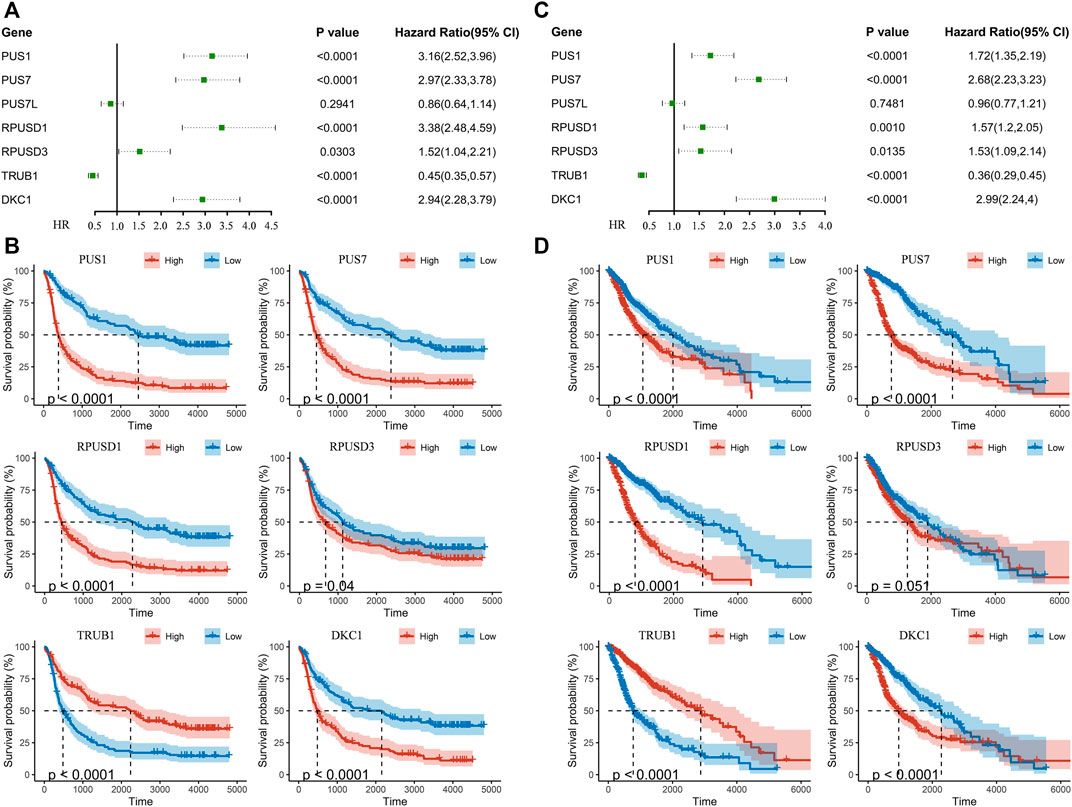
FIGURE 3. Identification of pseudouridine synthase genes that correlate with overall survival (A) Univariate Cox regression analysis of seven pseudouridine synthase genes in the CGGA dataset (B) Kaplan-Meier overall survival curves of certain genes in the CGGA dataset (C) Univariate Cox regression analysis of seven pseudouridine synthase genes in the TCGA dataset (D) Kaplan-Meier overall survival curves of certain genes in the TCGA dataset.
To predict the clinical outcomes of gliomas, the least absolute shrinkage and selection operator (LASSO) Cox regression algorithm was subsequently used to analyze the six Ψ synthase genes in the CGGA dataset (Figures 4A–C). Finally, five genes were screened out to construct the risk-score signature based on the minimum criteria in the training dataset (CGGA) (Figure 4D), and the signature was verified in the TCGA dataset, CGGA RNA-seq (#693) and CGGA mRNA array dataset (Figure 4G, Supplementary Figure S2). In order to assess the difference of overall survival between the low-risk and high-risk glioma patients, Kaplan-Meier analysis was performed both in the CGGA dataset and TCGA dataset. The results showed that the OS of glioma patients in the high-risk group was much shorter than that in low-risk group (Figures 4E,H, Supplementary Figure S2). Thereafter, ROC curve analysis was performed to assess the sensitivity and specificity of risk score in prediction of the 1-, three- and 5-years survival of glioma patients. The results showed that the risk score had high accuracy in the prediction of OS of glioma patients in the CGGA and TCGA datasets (Figures 4F,I, Supplementary Figure S2).

FIGURE 4. Construction of the risk-score signature using five pseudouridine synthase genes (A) LASSO coefficient profiles of the six pseudouridine synthase genes in the CGGA dataset (B) Partial likelihood deviance of different numbers of variables revealed by the LASSO regression model (C) Barplot displaying the coefficients constructed using the LASSO method (D) Distribution of risk score, patients’ survival status, and expression pattern of the five pseudouridine synthase genes in the CGGA dataset (E) Kaplan-Meier curves of overall survival according to risk score in the CGGA dataset (F) ROC curves showing the sensitivity and specificity of risk score in predicting the 1-, 3- and 5-years survival of glioma patients in CGGA dataset (G) Distribution of risk score, patients’ survival status, and expression pattern of the five pseudouridine synthase genes in the TCGA dataset (H) Kaplan-Meier curves of overall survival according to risk score in the TCGA dataset (I). ROC curves showing the sensitivity and specificity of risk score in predicting the 1-, 3- and 5-years survival of glioma patients in TCGA dataset.
Considering age, WHO grade, IDH mutation status and 1p/19q coding status are related to the prognosis of gliomas, we analyzed the risk score signature in different subtypes stratified according to these pathological conditions. As shown in Supplementary Figure 3A, the risk scores of gliomas in GBM, IDH wild-type, older and 1p/19q non-coding subtypes were significantly higher than the corresponding subtypes. In addition, risk-score signature also exhibited high prognostic value in different WHO grade, IDH-mutant status, age and 1p/19q coding status subtypes (Supplementary Figure S3B–E).
Univariate and multivariate Cox regression analysis was performed to investigate whether the risk score was an independent prognostic factor for glioma. The results of univariate analysis showed that risk score, age, WHO grade and IDH status were significantly correlated with prognosis (Supplementary Figure S4A). Multivariate analysis also determined that risk score was significantly related to prognosis (Supplementary Figure S4B). A survival nomogram prediction model was then built based on independent prognostic parameters for the OS of glioma patients in the CGGA dataset (Supplementary Figure S4C). In addition, the calibration curves for the probability of 1-, three- and 5-years survival displayed excellent agreement between observation and prediction in the CGGA dataset (Supplementary Figure S4D). These results suggested that the risk-score signature of the five Ψ synthase genes was a reliable and independent prognostic indicator for gliomas.
Verify the Expression of the Prognostic Ψ Synthase Genes
To validate the expression of the prognostic Ψ synthase genes in glioma, we performed immunohistochemical staining on tissue samples collected from glioma patients undergoing surgical treatment. As shown in Figure 5, the expression levels of RPUSD1 and DKC1 in high-grade gliomas were higher than that in low-grade gliomas.
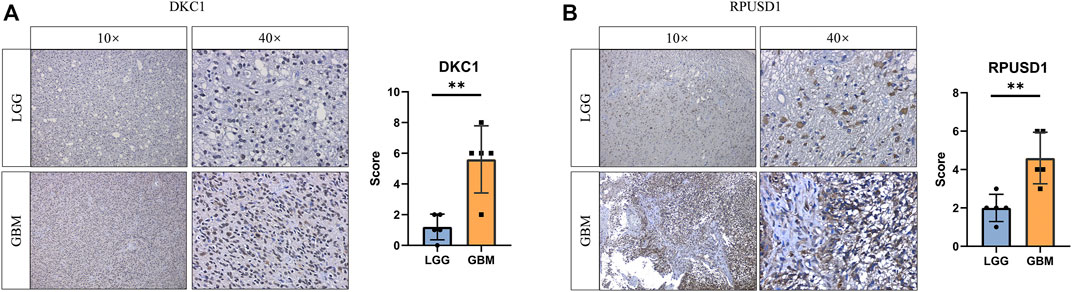
FIGURE 5. Validation the expression of prognostic pseudouridine synthase genes (A–B) Immunohistochemical staining analysis of the protein levels of DKC1 and RPUSD1 between the low-grade (n = 5) and high-grade gliomas (n = 5). p values were calculated using Student’s t-test. *, p < 0.05; **, p < 0.01; ***, p < 0.001.
Identification and Enrichment Analysis of DEGs Between High-Risk and Low-Risk Groups
To understand the impact of risk-score signature in the prognosis, we used R package “limma” to screen DEGs between the high-risk and low-risk groups. In the CGGA and TCGA datasets, 10,515 and 2,508 DEGs were screened, respectively (Figure 6A). 1794 genes that could be identified in both two datasets, including 1,008 up-regulated genes and 786 down-regulated genes, were selected for GO enrichment analysis (Figures 6A,B). Notably, the up-regulated genes were significantly enriched in immune-related signaling pathways such as the regulation of immune effector process, the regulation of T cell activation, the regulation of cell adhesion, and the mononuclear cell proliferation signaling pathway (Figures 6C,D).
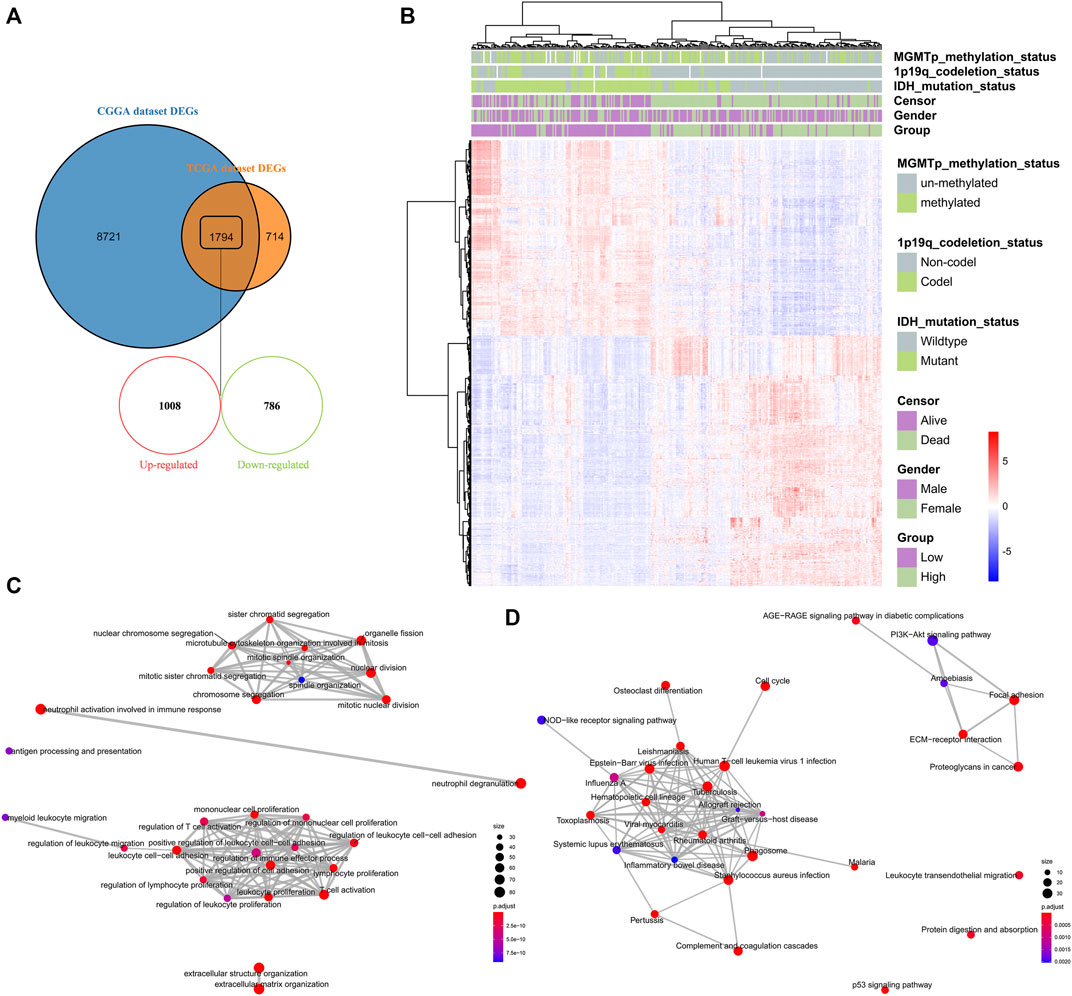
FIGURE 6. Identification and enrichment analysis of DEGs between high-risk and low-risk groups (A) Venn diagram showing the differentially expressed genes between the high-risk and low-risk groups in the CGGA and TCGA datasets (B) Heatmap depicting 1794 selected differentially expressed genes between the high-risk and low-risk groups in the CGGA dataset (C–D) GO analysis of the 1,008 up-regulated genes and 786 down-regulated genes, respectively.
Immune Microenvironment Landscape of Glioma
The DEGs between the high-risk and low-risk groups were enriched in the immune-related signaling pathways, suggesting that the risk scores might be related to the tumor immune microenvironment. To test the possibility, we analyzed the distribution of immune scores, stromal scores and ESTIMATE scores in the groups with different risk scores. The results revealed that the higher risk scores were significantly correlated with the higher immune scores, stromal scores and ESTIMATE scores, respectively (Figures 7A–D). Moreover, correlation analysis suggested that the expression levels of the five prognostic Ψ synthase genes were associated with the immune scores, stromal scores and ESTIMATE scores, especially TRUB1 (Figures 7A,B). Immunophenotype were analyzed by IPS algorithm, the IPS scores of the high-risk group were lower than that of the low-risk group (Supplementary Figure 5), indicating the immunogenicity of gliomas in high-risk group was reduced. We examined the expression of immune-related genes, and found the expression of most immunosuppressive genes in the high-risk group was up-regulated, including the checkpoint genes such as PD-1, PD-L1 and CTLA4 (Figures 7E,F). Therefore, the Ψ synthase genes and risk-score might be related to the immunosuppressive microenvironment of glioma.
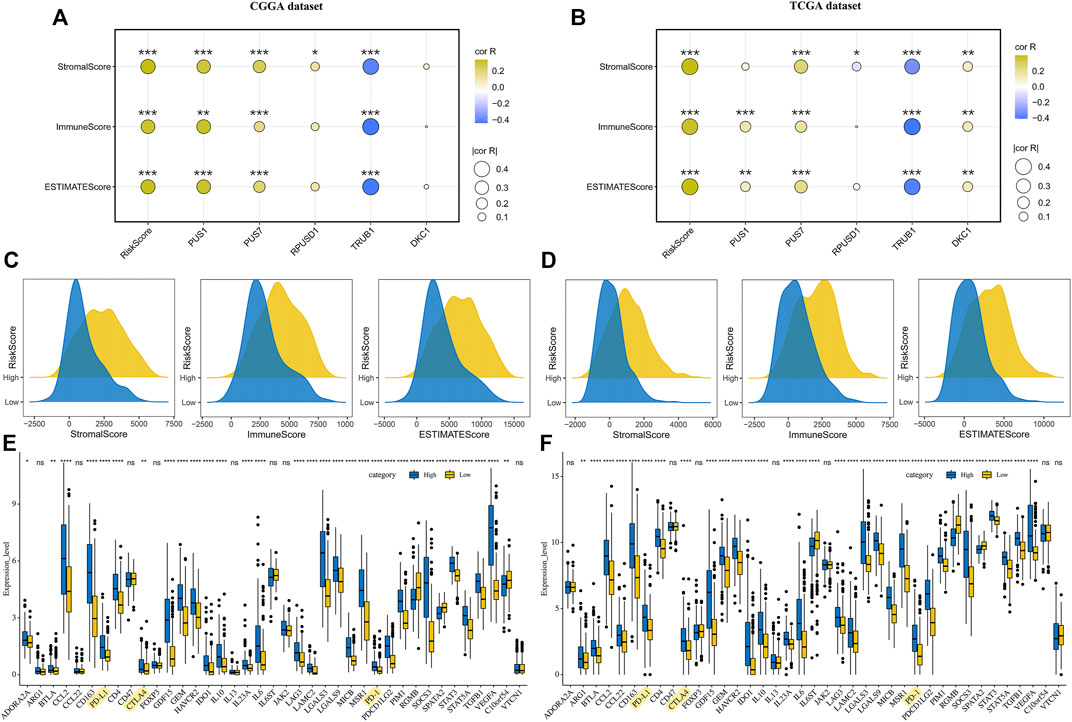
FIGURE 7. Correlation analysis of risk-score and immune microenvironment in glioma (A–B) Correlation analysis of risk-score and five pseudouridine synthase genes with immune scores, stromal scores and ESTIMATE scores in the CGGA and TCGA datasets, respectively (C–D) Ridge plot showing the distribution of immune scores, stromal scores and ESTIMATE scores of different risk groups in the CGGA and TCGA datasets, respectively (E–F) Boxplot displaying the expression levels of 39 immune signature genes in the CGGA and TCGA datasets, respectively. *, p < 0.05; **, p < 0.01; ***, p < 0.001.
Thereafter, we investigated the association of risk scores and immune infiltration in CGGA and TCGA datasets. Twenty-two types of immune cells were analyzed using the CIBERSORT algorithm in the online tool TIMER2 (Figures 8A,B). The results suggested that the tumor infiltrating leukocytes including macrophages M0, monocytes, NK cell activation, T cell CD4+ naive and T cell regulatory (Tregs) were significantly different in number between the high-risk and low-risk groups. In detail, the infiltration of M0 and Tregs were increased in the high-risk group, while the infiltration of other cell types was decreased (Figures 8C,D,F,G). Based on the correlation analysis, we found the five types of immune cells were significantly associated with the risk scores (Figures 8E,H) and the expression of the five prognostic Ψ synthase genes (Supplementary Figure S6). As shown in Figures 9A,D, there were also significant differences in the infiltration levels of these five immune cells in different WHO grades. Similar to the comparison between different risk-score groups, the infiltration levels of M0 and Tregs increased in high grade gliomas, while the infiltration levels of the other three immune cells were significantly reduced in high grade gliomas (Figures 9B,E). Moreover, Kaplan-Meier survival analysis revealed that high infiltration levels of M0 or Tregs, and low infiltration levels of monocytes, NK cell activation or T cell CD4+ naive were associated with poor prognosis and low survival rates of gliomas (Figures 9C,F). In addition, the immune cell infiltration of different risk groups was analyzed in LGG and GBM subtypes, respectively. The infiltration levels of M0 and Tregs increased in high-risk gliomas, while the infiltration levels of other immune cells were significantly reduced in high-risk gliomas (Supplementary Figure S7).
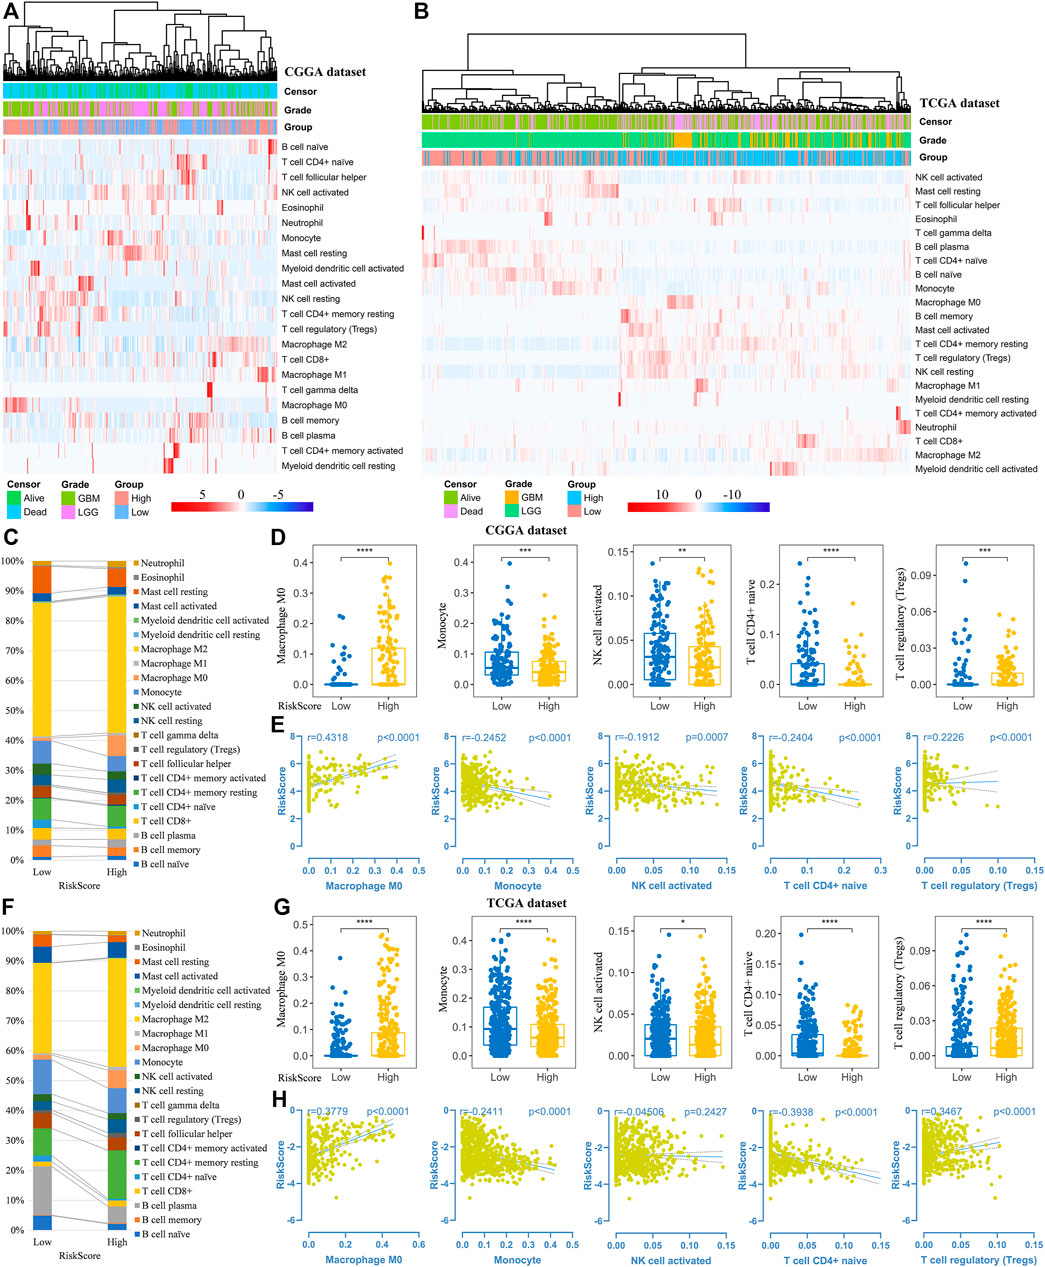
FIGURE 8. Analysis of immune cell infiltration in different risk-score groups (A–B) Heatmap depicting the infiltration levels of 22 immune cells in the CGGA and TCGA datasets, respectively (C,F) The average frequencies of 22 immune cells in low-risk and high-risk groups in the CGGA and TCGA datasets, respectively (D,G) Boxplot displaying the infiltration levels of macrophages M0, monocytes, NK cell activation, T cell CD4+ naive and Tregs between the high-risk and low-risk groups in the CGGA and TCGA datasets, respectively (E,H) Correlation analysis of risk-score with the infiltration levels of macrophages M0, monocytes, NK cell activation, T cell CD4+ naive and Tregs in the CGGA and TCGA datasets, respectively. p values were calculated using wilcox test. *, p < 0.05; **, p < 0.01; ***, p < 0.001, ****, p < 0.0001.
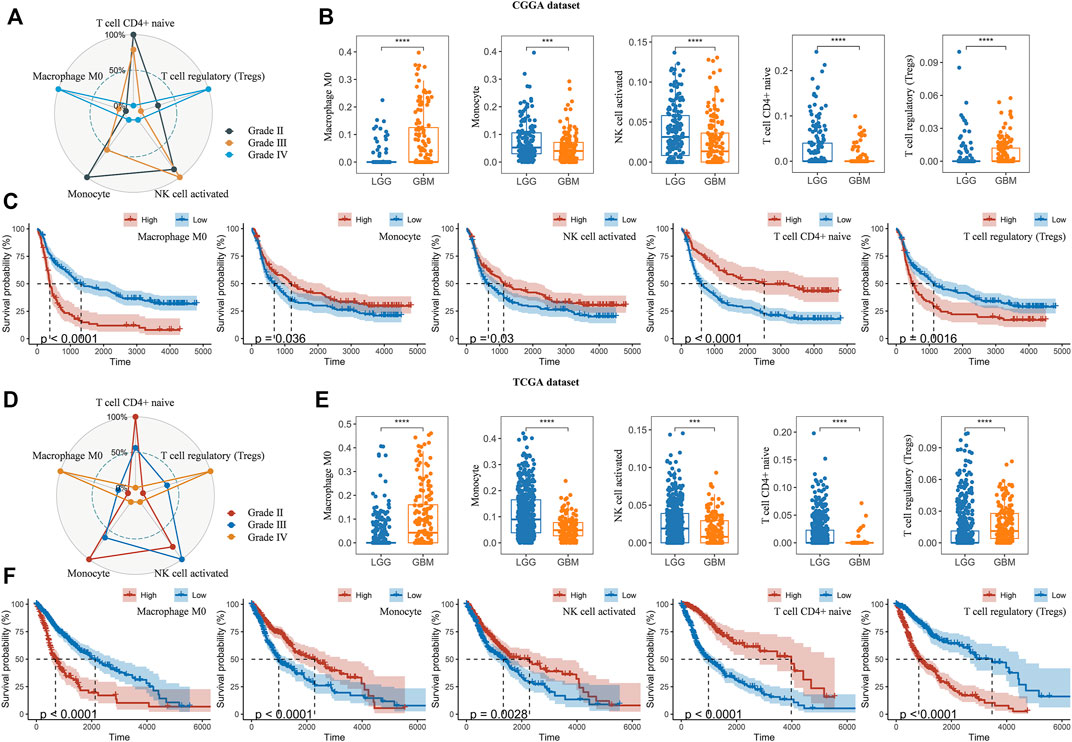
FIGURE 9. Analysis of immune cell infiltration in different WHO grades (A,D) Radar chart depicting the infiltration levels of macrophages M0, monocytes, NK cell activation, T cell CD4+ naive and Tregs between different WHO grades in the CGGA and TCGA datasets, respectively (B,E) Boxplot displaying the infiltration levels of macrophages M0, monocytes, NK cell activation, T cell CD4+ naive and Tregs between LGG and GBM in the CGGA and TCGA datasets, respectively (C,F) Kaplan-Meier overall survival curves of the infiltration levels of macrophages M0, monocytes, NK cell activation, T cell CD4+ naive and Tregs in the CGGA and TCGA datasets, respectively. p values were calculated using wilcox test. *, p < 0.05; **, p < 0.01; ***, p < 0.001, ****, p < 0.0001.
WGCNA and Module Analysis
We performed WGCNA to determine the hub genes that regulated TME and immune infiltration. The expression profile of 1794 DEGs and clinical traits of the CGGA samples were incorporated to construct a gene co-expression network. After merging similar modules with a threshold of 0.25, a total of eight modules were identified from the co-expression network (Figure 10A). As shown in the heatmap of module-trait relationships, the blue module was most relevant to clinical traits, especially traits such as immune scores, stromal scores, ESTIMATE scores, macrophages M0 infiltration (Figure 10B). In addition, two hub genes, CASP4 and S100A11, were identified from the blue module by setting the correlation relevant threshold to 0.9 (Figure 10C). Correlation analysis showed that the expression levels of CASP4 and S100A11 were correlated with the expression levels of the five prognostic Ψ synthase genes, and were significantly related to the infiltration levels of M0, monocytes, NK cell activation, T cell CD4+ naive and Tregs (Supplementary Figure S8, 9). Gene set enrichment analysis (GSEA) was further used to explore potential functional mechanisms or immunological associations of hub genes, the immune pathways such as antigen processing and presentation, leukocyte transendothelial migration, natural killer cell mediated cytotoxicity, JAK STAT signaling pathway, cytokine receptor interaction were significantly enriched (Figures 10D,E). Therefore, the risk-score signature might affect the expression of CASP4 and S100A11, resulting in changes in TME and the infiltration levels of the five immune cells.
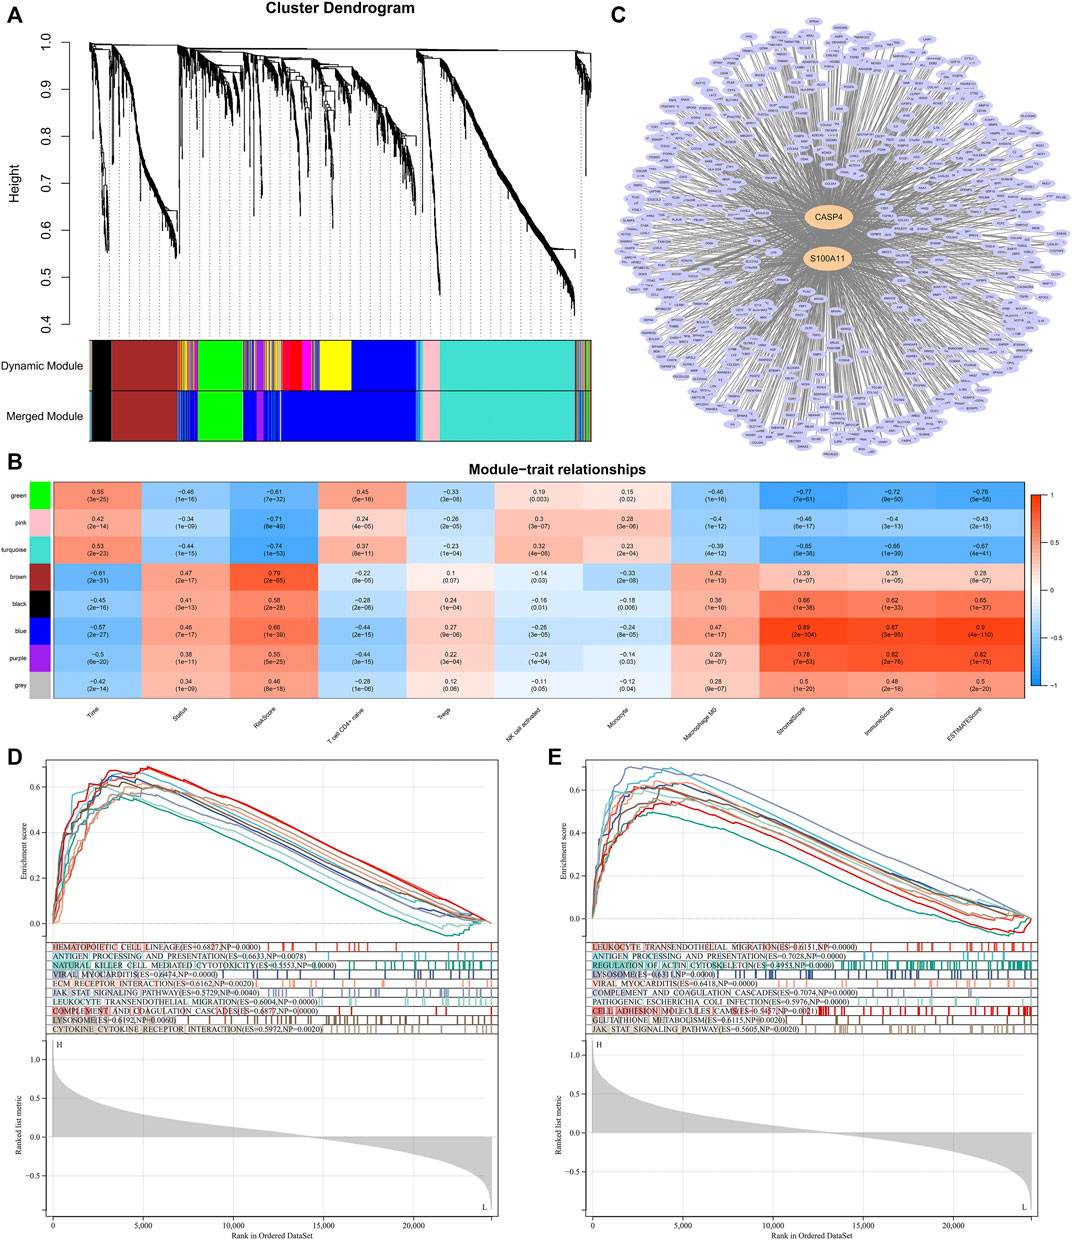
FIGURE 10. WGCNA and Module Analysis (A) Dendrogram of the differentially expressed genes clustered with dissimilarity measure based on topological overlap (B) Heatmap of the correlation between module eigengenes and clinical traits (C) Cytoscape analysis of the intersecting genes in the blue module (D) GSEA analysis based on the expression of CASP4 in the CGGA dataset (E) GSEA analysis based on the expression of S100A11 in the CGGA dataset.
Discussion
Glioma is the most common malignant tumor in the brain of adults, and is considered one of the most devastating cancers due to the aggressive behavior and lack of effective therapies (Ostrom et al., 2017). It is necessary to find new prognostic biomarkers and therapeutic strategies. In recent years, increasing evidence suggests that RNA modifications, especially m6A and m5C, play a crucial role in tumorigenesis, and the corresponding regulatory enzymes are potential candidates of prognostic biomarkers and therapeutic targets (Wang P. et al., 2020; Lin et al., 2020). In this line, Ψ synthase genes have been found to be involved in tumor progression and prognosis (Jana et al., 2017; Elsharawy et al., 2020; Du et al., 2021). In current study, we demonstrated the value of Ψ synthase genes in prediction of the prognosis of gliomas, and constructed a novel five-gene-based prognostic model (Figures 2–4).
Since a large amount of Ψ can be detected in urine of various malignant neoplasms, the level of Ψ in urine has been proposed as a potential tumor marker (Nombela et al., 2021). The level of Ψ in urine mainly depends on the metabolism and turnover of RNA, thus dysregulation of Ψ synthases may cause Ψ to accumulate in urine (Gehrke et al., 1979). Although the relationship between elevated Ψ level and imbalance of pseudouridine synthases remains to be elucidated, performing transcriptomic analysis of Ψ synthases and evaluating Ψ levels in the blood, urine or tissue of patients in relevant clinical characteristics such as WHO grade, IDH status, may greatly aid in identifying the differences between gliomas of various clinicopathological parameters, and potentially promote the diagnosis and treatment of glioma. Notably, the DKC1 inhibitor pyrazofurin and the MEK1/2 inhibitor trametinib can synergistically suppress colorectal cancer growth, suggesting the Ψ synthases are very promising therapeutic targets for cancer (Kan et al., 2021). 5-Fluorouracil (5-FU), the most widely used fluorinated pyrimidine in cancer treatment (Gmeiner, 2020), has been shown to inhibit pseudouridine synthases. Regardless of whether the related cytotoxicity of 5-FU is due to the overall decrease of RNA pseudouridylation or the loss of specific modified RNAs, evaluating the expression model of Ψ synthases may contribute to accurate application of 5-FU in cancer treatment and improve the prognosis. For glioma, small-molecule inhibitors that can cross the blood-brain barrier and specifically target Ψ synthases urgently need to be developed.
Among all of the post-transcriptional modifications identified on RNA molecules, Ψ is the most abundant modification (Charette and Gray, 2000; Ge and Yu, 2013). Pseudouridylation in the 3′-UTRs of mRNA may serve as a key factor in stabilization of mRNA (Kierzek et al., 2014; Schwartz et al., 2014; He et al., 2021). In addition, pseudouridylation fine-tunes the effects of codon bias to affect translation fidelity and efficiency (Karijolich and Yu, 2011; Karijolich et al., 2015; He et al., 2021). PUS1, PUS7, DKC1 and TRUB1 have been reported to modify pseudouridylation in mRNA (Li et al., 2015). In current study, the prognostic model was constructed based on expression of these Ψ synthase genes and RPUSD1 (Figure 4). The Ψ synthase genes might shape a new component in the signature of transcriptomic landscapes of gliomas (Figure 6).
Intriguingly, the up-regulated genes were significantly enriched in the immune-related signaling pathways, including the regulation of immune effector process, the regulation of T cell activation, the regulation of cell adhesion, and the mononuclear cell proliferation signaling pathway (Figures 6C,D). Therefore, the relationship of Ψ modification and landscape of immune microenvironment in gliomas was subsequently analyzed based on the expression data (Figures 7, 8). Consistent with previous studies, the immune scores, matrix scores, and ESTIMATE scores of high-risk gliomas were higher (Figure 7), but the immunophenoscores were lower (Supplementary Figure S5), indicating that the immune microenvironment had undergo significant suppressive changes (Fu et al., 2020a; Fu et al., 2020b). To characterize whether the risk scores were associated with the suppressive immunophenotype, an immune signature containing 39 immunosuppressive genes were analyzed. As expected, almost all of the immunosuppressive genes were up-regulated in the high-risk group, including the checkpoint genes such as PD-1, PD-L1 and CTLA4 (Figures 7E,F). Moreover, decreased infiltration of monocytes, NK cell activation and T cell CD4+ naive, as well as increased infiltrating of M0 and Tregs were found in the tumor microenvironment, which may contribute to the characteristic of local immune suppression in the high-risk group (Figure 8). These findings provide a novel insight into the relationship between Ψ modification and immunosuppressive microenvironment.
An association of the inflammatory molecules, CASP4 and S100A11, with the immune cell infiltration (including M0, monocytes, NK cell activation, T cell CD4+ naive and Tregs) was identified in TME through WGCNA analysis. In addition, their expression levels may be regulated by the five prognostic Ψ synthase genes, especially TRUB1 (Figure 10, Supplementary Figure S8, 9). CASP4 (Caspase-4) is the key molecule in the noncanonical inflammasome pathway, which can result in inflammatory cell death (pyroptosis) via cleavage of gasdermin D in monocytes and macrophages, accompanied with release of inflammatory cytokines (Schmid-Burgk et al., 2015). S100A11 is a member of S100 protein family (S100s), which participates in a variety of physiological and pathological processes, including inflammation, cell proliferation, apoptosis and cancer development (Zheng et al., 2021). S100A11 can induce chemokine response and regulate monocyte recruitment in vivo, but its release depends on activation of caspase (Safronova et al., 2019). Whether CASP4 (Caspase-4) and S100A11 act synergistically in gliomas remains unclear. Tumor cells may promote the inflammatory status by releasing a wide range of cytokines (Coussens and Werb, 2002; Sharma and Kanneganti, 2021). Chronic inflammation at the local and/or systemic level contributes to tumor pathobiology, progression, metastasis and drug resistance by reprogramming tumor cells and reorganizing the tumor immune microenvironment (Faria et al., 2021). Up-regulation of CASP4 and S100A11 may contribute to the inflammatory status in the tumor immune microenvironment for the proliferation, differentiation and survival of tumor cells. However, whether Ψ synthase genes can directly regulate the expression of CASP4 and S100A11, and whether the abnormal expression of CASP4 and S100A11 will affect the abundance of immune cell infiltration still requires experimental research.
Data Availability Statement
The datasets presented in this study can be found in online repositories. The names of the repository/repositories and accession number(s) can be found in the article/Supplementary Material.
Ethics Statement
The studies involving human participants were reviewed and approved by the medical ethics committee of the Zhengzhou Central Hospital Affiliated to Zhengzhou University. The patients/participants provided their written informed consent to participate in this study.
Author Contributions
L-jW, YL and JY conceived and designed the experiments. PL contributed data analysis. L-jW wrote the manuscript. PL, YL and JY revised the manuscript. L-jW, JY and YL approved final version of manuscript.
Funding
This study was supported by grants from Zhengzhou Central Hospital Affiliated to Zhengzhou University (No. KYQDJJ2021008), and National Natural Science Fundation of China (82101401).
Conflict of Interest
The authors declare that the research was conducted in the absence of any commercial or financial relationships that could be construed as a potential conflict of interest.
Publisher’s Note
All claims expressed in this article are solely those of the authors and do not necessarily represent those of their affiliated organizations, or those of the publisher, the editors and the reviewers. Any product that may be evaluated in this article, or claim that may be made by its manufacturer, is not guaranteed or endorsed by the publisher.
Supplementary Material
The Supplementary Material for this article can be found online at: https://www.frontiersin.org/articles/10.3389/fcell.2021.727595/full#supplementary-material
References
Basak, A., and Query, C. C. (2014). A Pseudouridine Residue in the Spliceosome Core is Part of the Filamentous Growth Program in Yeast. Cell reports 8 (4), 966–973. doi:10.1016/j.celrep.2014.07.004
Boccaletto, P., Machnicka, M. A., Purta, E., Piątkowski, P., Bagiński, B., Wirecki, T. K., et al. (2018). MODOMICS: a Database of RNA Modification Pathways. 2017 Update. Nucleic Acids Res. 46, D303–D307. doi:10.1093/nar/gkx1030
Carlile, T. M., Rojas-Duran, M. F., Zinshteyn, B., Shin, H., Bartoli, K. M., and Gilbert, W. V. (2014). Pseudouridine Profiling Reveals Regulated mRNA Pseudouridylation in Yeast and Human Cells. Nature 515 (7525), 143–146. doi:10.1038/nature13802
Cerami, E., Gao, J., Dogrusoz, U., Gross, B. E., Sumer, S. O., Aksoy, B. A., et al. (2012). The cBio Cancer Genomics Portal: An Open Platform for Exploring Multidimensional Cancer Genomics Data: Figure 1. Cancer Discov. 2 (5), 401–404. doi:10.1158/2159-8290.cd-12-0095
Charette, M., and Gray, M. W. (2000). Pseudouridine in RNA: what, where, How, and Why. IUBMB life 49 (5), 341–351. doi:10.1080/152165400410182
Charoentong, P., Finotello, F., Angelova, M., Mayer, C., Efremova, M., Rieder, D., et al. (2017). Pan-cancer Immunogenomic Analyses Reveal Genotype-Immunophenotype Relationships and Predictors of Response to Checkpoint Blockade. Cell reports 18 (1), 248–262. doi:10.1016/j.celrep.2016.12.019
Coussens, L. M., and Werb, Z. (2002). Inflammation and Cancer. Nature 420 (6917), 860–867. doi:10.1038/nature01322
Davis, D. R., Veltri, C. A., and Nielsen, L. (1998). An RNA Model System for Investigation of Pseudouridine Stabilization of the Codon-Anticodon Interaction in tRNALys, tRNAHisand tRNATyr. Journal of Biomolecular Structure and Dynamics 15 (6), 1121–1132. doi:10.1080/07391102.1998.10509006
Dominissini, D., Moshitch-Moshkovitz, S., Schwartz, S., Salmon-Divon, M., Ungar, L., Osenberg, S., et al. (2012). Topology of the Human and Mouse m6A RNA Methylomes Revealed by m6A-Seq. Nature 485 (7397), 201–206. doi:10.1038/nature11112
Du, J., Gong, A., Zhao, X., and Wang, G. (2021). Pseudouridylate Synthase 7 Promotes Cell Proliferation and Invasion in Colon Cancer Through Activating PI3K/AKT/mTOR Signaling Pathway. Dig Dis Sci. doi:10.1007/s10620-021-06936-0
Elsharawy, K. A., Mohammed, O. J., Aleskandarany, M. A., Hyder, A., El-Gammal, H. L., Abou-Dobara, M. I., et al. (2020). The Nucleolar-Related Protein Dyskerin Pseudouridine Synthase 1 (DKC1) Predicts Poor Prognosis in Breast Cancer. Br. J. Cancer 123 (10), 1543–1552. doi:10.1038/s41416-020-01045-7
Faria, S. S., Costantini, S., de Lima, V. C. C., de Andrade, V. P., Rialland, M., Cedric, R., et al. (2021). NLRP3 Inflammasome-Mediated Cytokine Production and Pyroptosis Cell Death in Breast Cancer. J. Biomed. Sci. 28 (1), 26. doi:10.1186/s12929-021-00724-8
Frye, M., Harada, B. T., Behm, M., and He, C. (2018). RNA Modifications Modulate Gene Expression during Development. Science 361 (6409), 1346–1349. doi:10.1126/science.aau1646
Fu, W., Wang, W., Li, H., Jiao, Y., Huo, R., Yan, Z., et al. (2020a). Single-Cell Atlas Reveals Complexity of the Immunosuppressive Microenvironment of Initial and Recurrent Glioblastoma. Front. Immunol. 11, 835. doi:10.3389/fimmu.2020.00835
Fu, W., Wang, W., Li, H., Jiao, Y., Weng, J., Huo, R., et al. (2020b). High Dimensional Mass Cytometry Analysis Reveals Characteristics of the Immunosuppressive Microenvironment in Diffuse Astrocytomas. Front. Oncol. 10, 78. doi:10.3389/fonc.2020.00078
Ge, J., and Yu, Y.-T. (2013). RNA Pseudouridylation: New Insights into an Old Modification. Trends in Biochemical Sciences 38 (4), 210–218. doi:10.1016/j.tibs.2013.01.002
Gehrke, C. W., Kuo, K. C., Waalkes, T. P., and Borek, E. (1979). Patterns of Urinary Excretion of Modified Nucleosides. Cancer Res. 39 (4), 1150–1153.
Gmeiner, W. H. (2020). Chemistry of Fluorinated Pyrimidines in the Era of Personalized Medicine. Molecules 25 (15), 3438. doi:10.3390/molecules25153438
He, X., Zhang, S., Zhang, Y., Lei, Z., Jiang, T., and Zeng, J. (2021). Characterizing RNA Pseudouridylation by Convolutional Neural Networks. Genomics proteomics bioinformatics S1672-0229 (21), 00027-9. doi:10.1016/j.gpb.2019.11.015
Jana, S., Hsieh, A. C., and Gupta, R. (2017). Reciprocal Amplification of Caspase-3 Activity by Nuclear export of a Putative Human RNA-Modifying Protein, PUS10 during TRAIL-Induced Apoptosis. Cell Death Dis 8 (10), e3093. doi:10.1038/cddis.2017.476
Kan, G., Wang, Z., Sheng, C., Chen, G., Yao, C., Mao, Y., et al. (2021). Dual Inhibition of DKC1 and MEK1/2 Synergistically Restrains the Growth of Colorectal Cancer Cells. Adv. Sci. 8 (10), 2004344. doi:10.1002/advs.202004344
Karijolich, J., Yi, C., and Yu, Y.-T. (2015). Transcriptome-wide Dynamics of RNA Pseudouridylation. Nat. Rev. Mol. Cell Biol 16 (10), 581–585. doi:10.1038/nrm4040
Karijolich, J., and Yu, Y.-T. (2011). Converting Nonsense Codons into Sense Codons by Targeted Pseudouridylation. Nature 474 (7351), 395–398. doi:10.1038/nature10165
Kierzek, E., Malgowska, M., Lisowiec, J., Turner, D. H., Gdaniec, Z., and Kierzek, R. (2014). The Contribution of Pseudouridine to Stabilities and Structure of RNAs. Nucleic Acids Res. 42 (5), 3492–3501. doi:10.1093/nar/gkt1330
Li, T., Fu, J., Zeng, Z., Cohen, D., Li, J., Chen, Q., et al. (2020). TIMER2.0 for Analysis of Tumor-Infiltrating Immune Cells. Nucleic Acids Res. 48, W509–W514. doi:10.1093/nar/gkaa407
Li, X., Zhu, P., Ma, S., Song, J., Bai, J., Sun, F., et al. (2015). Chemical Pulldown Reveals Dynamic Pseudouridylation of the Mammalian Transcriptome. Nat. Chem. Biol. 11 (8), 592–597. doi:10.1038/nchembio.1836
Lin, S., Xu, H., Zhang, A., Ni, Y., Xu, Y., Meng, T., et al. (2020). Prognosis Analysis and Validation of m6A Signature and Tumor Immune Microenvironment in Glioma. Front. Oncol. 10, 541401. doi:10.3389/fonc.2020.541401
Ma, X., Zhao, X., and Yu, Y. (2003). Pseudouridylation (Psi) of U2 snRNA in S.Cerevisiae is Catalyzed by an RNA-independent Mechanism. The EMBO journal 22 (8), 1889–1897. doi:10.1093/emboj/cdg191
Nombela, P., Miguel-López, B., and Blanco, S. (2021). The Role of m6A, m5C and Ψ RNA Modifications in Cancer: Novel Therapeutic Opportunities. Mol. Cancer 20 (1), 18. doi:10.1186/s12943-020-01263-w
Ostrom, Q. T., Cioffi, G., Gittleman, H., Patil, N., Waite, K., Kruchko, C., et al. (2019). CBTRUS Statistical Report: Primary Brain and Other Central Nervous System Tumors Diagnosed in the United States in 2012-2016. Neuro-oncology 21, v1–v100. doi:10.1093/neuonc/noz150
Ostrom, Q. T., Gittleman, H., Liao, P., Vecchione-Koval, T., Wolinsky, Y., Kruchko, C., et al. (2017). CBTRUS Statistical Report: Primary Brain and Other central Nervous System Tumors Diagnosed in the United States in 2010-2014. Neuro-oncology 19, v1–v88. doi:10.1093/neuonc/nox158
Ostrom, Q. T., Gittleman, H., Truitt, G., Boscia, A., Kruchko, C., and Barnholtz-Sloan, J. S. (2018). CBTRUS Statistical Report: Primary Brain and Other Central Nervous System Tumors Diagnosed in the United States in 2011-2015. Neuro-oncology 20, iv1–iv86. doi:10.1093/neuonc/noy131
Penzo, M., Guerrieri, A. N., Zacchini, F., Treré, D., and Montanaro, L. (2017). RNA Pseudouridylation in Physiology and Medicine: For Better and for Worse. Genes (Basel) 8 (11). doi:10.3390/genes8110301
Ritchie, M. E., Phipson, B., Wu, D., Hu, Y., Law, C. W., Shi, W., et al. (2015). Limma powers Differential Expression Analyses for RNA-Sequencing and Microarray Studies. Nucleic Acids Res. 43 (7), e47. doi:10.1093/nar/gkv007
Safronova, A., Araujo, A., Camanzo, E. T., Moon, T. J., Elliott, M. R., Beiting, D. P., et al. (2019). Alarmin S100A11 Initiates a Chemokine Response to the Human Pathogen Toxoplasma Gondii. Nat. Immunol. 20 (1), 64–72. doi:10.1038/s41590-018-0250-8
Schmid-Burgk, J. L., Gaidt, M. M., Schmidt, T., Ebert, T. S., Bartok, E., and Hornung, V. (2015). Caspase-4 Mediates Non-canonical Activation of the NLRP3 Inflammasome in Human Myeloid Cells. Eur. J. Immunol. 45 (10), 2911–2917. doi:10.1002/eji.201545523
Schwartz, S., Bernstein, D. A., Mumbach, M. R., Jovanovic, M., Herbst, R. H., León-Ricardo, B. X., et al. (2014). Transcriptome-wide Mapping Reveals Widespread Dynamic-Regulated Pseudouridylation of ncRNA and mRNA. Cell 159 (1), 148–162. doi:10.1016/j.cell.2014.08.028
Sharma, B., and Kanneganti, T. (2021). NLRP3 Inflammasome in Cancer and Metabolic Diseases. Nat Immunol. 2, 550-9. doi:10.1038/s41590-021-00886-5
Stockert, J. A., Weil, R., Yadav, K. K., Kyprianou, N., and Tewari, A. K. (2021). Pseudouridine as a Novel Biomarker in Prostate Cancer. Urologic Oncology: Seminars and Original Investigations 39 (1), 63–71. doi:10.1016/j.urolonc.2020.06.026
Tang, L., Wei, X., Li, T., Chen, Y., Dai, Z., Lu, C., et al. (2021). Emerging Perspectives of RNA N6-Methyladenosine (m6A) Modification on Immunity and Autoimmune Diseases. Front. Immunol. 12, 630358. doi:10.3389/fimmu.2021.630358
Wang, L. J., Xue, Y., Li, H., Huo, R., Yan, Z., Wang, J., et al. (2020). Wilms' Tumour 1‐associating Protein Inhibits Endothelial Cell Angiogenesis by m6A‐dependent Epigenetic Silencing of Desmoplakin in Brain Arteriovenous Malformation. J. Cell Mol Med 24 (9), 4981–4991. doi:10.1111/jcmm.15101
Wang, P., Wu, M., Tu, Z., Tao, C., Hu, Q., Li, K., et al. (2020). Identification of RNA: 5-Methylcytosine Methyltransferases-Related Signature for Predicting Prognosis in Glioma. Front. Oncol. 10, 1119. doi:10.3389/fonc.2020.01119
Wiener, D., and Schwartz, S. (2021). The Epitranscriptome beyond m6A. Nat. Rev. Genet. 22 (2), 119–131. doi:10.1038/s41576-020-00295-8
Yu, G., Wang, L.-G., Han, Y., and He, Q.-Y. (2012). clusterProfiler: an R Package for Comparing Biological Themes Among Gene Clusters. OMICS: A Journal of Integrative Biology 16 (5), 284–287. doi:10.1089/omi.2011.0118
Zheng, S., Liu, L., Xue, T., Jing, C., Xu, X., Wu, Y., et al. (2021). Comprehensive Analysis of the Prognosis and Correlations with Immune Infiltration of S100 Protein Family Members in Hepatocellular Carcinoma. Front. Genet. 12, 648156. doi:10.3389/fgene.2021.648156
Keywords: glioma, pseudouridine, prognostic model, tumor microenvironment, inflammatory molecule
Citation: Wang L-j, Lv P, Lou Y and Ye J (2022) Gene Expression-Based Predication of RNA Pseudouridine Modification in Tumor Microenvironment and Prognosis of Glioma Patients. Front. Cell Dev. Biol. 9:727595. doi: 10.3389/fcell.2021.727595
Received: 19 June 2021; Accepted: 22 December 2021;
Published: 18 January 2022.
Edited by:
Cecilia Ana Suarez, Consejo Nacional de Investigaciones Científicas y Técnicas (CONICET), ArgentinaReviewed by:
Jiye Li, Capital Institute of Pediatrics, ChinaLei Wu, Second Affiliated Hospital of Nanchang University, China
Zeyu Wang, Central South University, China
Copyright © 2022 Wang, Lv, Lou and Ye. This is an open-access article distributed under the terms of the Creative Commons Attribution License (CC BY). The use, distribution or reproduction in other forums is permitted, provided the original author(s) and the copyright owner(s) are credited and that the original publication in this journal is cited, in accordance with accepted academic practice. No use, distribution or reproduction is permitted which does not comply with these terms.
*Correspondence: Lin-jian Wang, wljgnn@126.com; Yongli Lou, yongli322@163.com
†These authors have contributed equally to this work and share first authorship