Differentiation of otitis media-causing bacteria and biofilms via Raman spectroscopy and optical coherence tomography
 Andrea K. Locke1,2,3†
  Farzana R. Zaki4†
  Sean T. Fitzgerald1,2
  Kavya Sudhir4,5
  Guillermo L. Monroy4
  Honggu Choi4
  Jungeun Won4,5
  Anita Mahadevan-Jansen1,2,6,7,8* Stephen A. Boppart4,5,9,10*
- 1Vanderbilt Biophotonics Center, School of Engineering, Vanderbilt University, Nashville, TN, United States
- 2Department of Biomedical Engineering, School of Engineering, Vanderbilt University, Nashville, TN, United States
- 3Department of Chemistry, College of Arts and Science, Vanderbilt University, Nashville, TN, United States
- 4Beckman Institute for Advanced Science and Technology, University of Illinois at Urbana–Champaign, Urbana, IL, United States
- 5Department of Bioengineering, The Grainger College of Engineering, University of Illinois at Urbana–Champaign, Urbana, IL, United States
- 6Department of Otolaryngology - Head & Neck Surgery, Vanderbilt University Medical Center, Nashville, TN, United States
- 7Department of Surgery, Vanderbilt University Medical Center, Nashville, TN, United States
- 8Department of Neurological Surgery, Vanderbilt University Medical Center, Nashville, TN, United States
- 9Carle Illinois College of Medicine, University of Illinois at Urbana–Champaign, Urbana, IL, United States
- 10Department of Electrical and Computer Engineering, University of Illinois Urbana-Champaign, Urbana, IL, United States
In the management of otitis media (OM), identification of causative bacterial pathogens and knowledge of their biofilm formation can provide more targeted treatment approaches. Current clinical diagnostic methods rely on the visualization of the tympanic membrane and lack real-time assessment of the causative pathogen(s) and the nature of any biofilm that may reside behind the membrane and within the middle ear cavity. In recent years, optical coherence tomography (OCT) has been demonstrated as an improved in vivo diagnostic tool for visualization and morphological characterization of OM biofilms and middle ear effusions; but lacks specificity about the causative bacterial species. This study proposes the combination of OCT and Raman spectroscopy (RS) to examine differences in the refractive index, optical attenuation, and biochemical composition of Haemophilus influenzae, Streptococcus pneumoniae, Moraxella catarrhalis, and Pseudomonas aeruginosa; four of the leading otopathogens in OM. This combination provides a dual optical approach for identifying and differentiating OM-causing bacterial species under three different in vitro growth environments (i.e., agar-grown colonies, planktonic cells from liquid cultures, and biofilms). This study showed that RS was able to identify key biochemical variations to differentiate all four OM-causing bacteria. Additionally, biochemical spectral changes (RS) and differences in the mean attenuation coefficient (OCT) were able to distinguish the growth environment for each bacterial species.
Introduction
Otitis media (OM), an inflammatory disease of the middle ear, is one of the most common diagnoses for pediatric patients and often follows upper respiratory tract infections (Danishyar and Ashurst, 2017). It is one of the leading causes of outpatient antibiotic use for children (Palms et al., 2019), resulting in more than 25 million physician visits and $4.3 billion in public healthcare costs, annually, in the United States alone (Tong et al., 2018). Approximately 80-90% of children present with some form of OM by the age of three. Thus, an appropriate diagnosis and treatment regimen is crucial to minimize the risk of delayed speech development and socialization skills that may result from the long-term reduction of auditory acuity during chronic states of the disease. OM involves the accumulation of a middle ear effusion (MEE) caused by Eustachian tube dysfunction. In the absence of acute infection, this condition is termed OM with effusion (OME). However, planktonic bacteria from the upper respiratory tract can migrate into the middle ear through the Eustachian tube and colonize within the nutrient-rich MEE. This migration may lead to the onset of an acute OM (AOM) infection by one or more pathogens that presents with physical symptoms (e.g., otalgia, otorrhea, fever, irritability, restlessness, and poor feeding) and tympanic membrane (TM) bulging or erythema in children. Cases of OME can resolve spontaneously within months, and many AOM cases typically resolve within 1-2 weeks with appropriate administration of antibiotics. However, identifying and appropriately treating a single persistent/chronic or multiple recurrent infections is still an ongoing challenge as most of these cases do not respond to antibiotic therapy and surgical intervention is advised (Hoberman et al., 2011).
Evidence has pointed towards the importance of biofilm formation in the occurrence and persistence of chronic OM. Bacterial biofilms are self-assembling microenvironments that provide a protective habitat for microorganisms to colonize and grow. The biopolymeric matrix adheres to tissue structures and protects the pathogens from external agents like host immune cells or antimicrobial drugs. Researchers have reported findings up to 92% of middle ear mucosal biopsies sampled from patients with chronic OM showed the presence of biofilms (Kaya et al., 2013; Gu et al., 2014). OM-related biofilms usually contain one or multiple species of the primary otopathogenic bacteria, including: Streptococcus pneumoniae, non-typeable Haemophilus influenzae (NTHI), Moraxella catarrhalis, Pseudomonas aeruginosa, and Staphylococcus aureus (Fergie et al., 2004; Thornton et al., 2011). Although targeted therapies like species-specific antibiotic agents can be more effective than broad-spectrum antibiotics when pathogens are in free-floating (i.e., planktonic) form, biofilms exhibit unique antibiotic resistance mechanisms that affect drug treatment efficacy (Sharma et al., 2019). Therefore, detection and characterization of infection in a planktonic or biofilm state are critical diagnostic criteria needed to monitor the progression of chronic forms of OM. Consideration of these aspects of OM pathology would not only improve procedures for prescribing antibiotic therapies, but allow for tracking of drug treatment response in chronic OM.
Another challenge in the administration of treatment is identifying the cause of OM. Although a large number of AOM cases are associated with bacterial pathogens, in approximately 5-30% of AOM cases in children, the causative pathogen is viral or a combination of both (Shoichi et al., 2019). With viral infections, the administration of antibiotics is unnecessary, or in combined viral/bacterial infections, monitoring of antibiotic response over a longer period of time may be needed. This is because the bacterial infection could have resolved, but symptoms relating to a viral presence persisted. There are also instances where the presence of an effusion in the middle ear is serous (i.e., OME) without signs of infection (Vanneste and Page, 2019). In these cases, antibiotics treatments are not recommended under current guidelines, and “watchful waiting” is recommended (Lambert, 2016). Therefore, an OM diagnostic tool capable of real-time identification of bacterial presence and pathogen speciation is needed to help guide clinical decision making for the most appropriate treatment regimen.
Visual or digital otoscopy is the current clinical standard for the diagnosis of OM, but can be subjective amongst practitioners. Alternative methods like pneumatic otoscopy or tympanometry examine the motility of the TM in response to pressure oscillations in the ear canal to determine the presence of MEE, but lack the specificity of pathogen identification and the ability to identify or track the evolution of the effusion or biofilm over the course of treatment and progression/regression of the disease. Tympanocentesis, a minor surgical procedure to aspirate a MEE from the middle ear cavity with a small gauge needle, remains the gold standard for typing of OM-causing bacterial species, but is only used in complex cases that do not respond to first-line antibiotics like amoxicillin or penicillin. However, in some cases (~40%) the extracted middle ear fluid is culture-negative, and more time consuming and complex tools like polymerase chain reaction (PCR) and DNA sequencing are needed to determine speciation (Xu et al., 2011). These limitations imposed by current diagnostic methods have resulted in treatment guidelines for OM recommending the use of broad-spectrum antibiotics that often adds to the risk of antibiotic resistance (Center for Disease Control and Prevention, 2019). This risk includes increases in the incidence of adverse effects such as disruption of the gut microbiome (Francino, 2016), upset stomach, or diarrhea (Gerber et al., 2017), which can lead to other poor health outcomes and diseases (Holmes et al., 2011; Chen et al., 2021). Thus, advances in more specific and less labor-intensive diagnostic tools are essential to improve clinical treatment decisions and patient outcomes.
Building off of existing visual and digital otoscopy platforms, optical methods have garnered interest in OM diagnostics as they are inherently non-invasive, fast, can be readily applied in vivo, and offer a wide range of compositional or structural information about microbes and the microenvironment they inhabit. Optical coherence tomography (OCT) is an interferometric imaging modality that provides micron-scale resolution of tissue morphology. This optical modality has been investigated for application in OM to detect the presence of middle ear effusions and biofilms (Nguyen et al., 2012; Monroy et al., 2015; Won et al., 2021b), correlate TM thickness to a chronic state of the disease (Dsouza et al., 2018), and study the longitudinal effects of antibiotic treatment on biofilm growth and MEEs (Won et al., 2021a). To date, OCT is the only technique that can provide direct visualization of biofilms adherent on the TM in vivo. Raman spectroscopy (RS) is a vibrational spectroscopic modality that excels in its ability to probe molecular composition through the inelastic scattering of light. It has previously been reported for use in OM diagnostics by identifying causative bacterial species, grown on agar in vitro, with 97% classification accuracy (Ayala et al., 2017). Also, RS has been used to characterize compositional differences in non-infected MEEs in vitro, where thicker mucoid MEE could be discriminated from thinner serous effusions with 92% accuracy (Pandey et al., 2018). This is significant because mucoid MEEs are less easily cleared by middle ear ciliary action and are associated with more chronic episodes of OM (Matković et al., 2007). In a recent study, a combined Raman coupled low-coherence interferometry (LCI) probe was developed for the real-time detection and differentiation of microbial pathogens (i.e., Pseudomonas aeruginosa and Streptococcus pneumoniae) in the middle ear (Zhao et al., 2016). Therein, RS was employed to identify the planktonic bacterial species, and LCI was utilized to determine the depth-resolved structural information from the TM and to visually guide the placement of the RS probing beam. Thus, this work demonstrated the advantages of combining spectroscopy with imaging to provide a more informed description of the nature of bacterial infection within the middle ear.
The two modalities, OCT and RS, offer very different but complementary information about effusion scattering properties and biofilm microstructure, and cellular biochemical composition, respectively. While OCT can identify MEEs and biofilm formation, track film thickness, and investigate optical properties like refractive index, attenuation, or other scattering properties (Tearney et al., 1995; Balaev et al., 2003; Chang and Bowden, 2019), it lacks chemical specificity which could be used to determine which species are responsible for any persistent disease like chronic OM. On the other hand, RS provides a comprehensive biomolecular identification of the bacterial, biofilm, and MEE, but cannot provide information about the structural organization of functional characteristics of tissue when applied in vivo. Thus, there is a growing interest in exploring a combined multimodal optical system that utilizes the advantages of both techniques. In the context of acute and chronic OM, a multimodal RS-OCT platform would be able to detect MEE and biofilm formation and identify the causative bacterial pathogen(s) to better inform the clinical guidance of appropriate treatment, and allow for longitudinal observation of a patient’s response to the antibiotic therapy.
The goal of this study is to characterize OM-causative bacterial species, grown in different in vitro environments, through the independent techniques of RS and OCT. This will facilitate an understanding of the key biochemical and structural differences between bacteria found on agar, in a fluidic environment (i.e., planktonic), and within established biofilms. In particular to OM, this study aims to identify discriminatory markers that can be used to distinguish the four most common causative bacterial species: Haemophilus influenzae, Streptococcus pneumoniae, Moraxella catarrhalis, and Pseudomonas aeruginosa.
Results
To characterize differences between OM-causing bacterial species when grown as colonies on brain heart infusion (BHI) agar, in a fluidic environment, or a biofilm matrix, RS and OCT measurements were acquired from four of the most common otopathogenic OM bacterial species: H. influenzae, S. pneumoniae, M. catarrhalis, and P. aeruginosa under all three growth conditions.
Raman characterization of OM-causing bacteria in different microbial growth environments
Raman spectra were acquired using a benchtop inVia™ confocal Raman microscope (Renishaw, United Kingdom) fitted with a 785 nm excitation light. Raman spectra from colonies grown on brain heart infusion (BHI) agar, liquid cultures, and biofilm samples were acquired in triplicate, processed for noise smoothing and fluorescence background subtraction, then averaged before analysis. Sparse Multinomial Logistic Regression (SMLR), a supervised classification model, was used to analyze the Raman spectra by only selecting spectral bands that were most important to species/growth form differentiation. By simultaneously performing both feature selection and classification, the SMLR model demonstrated the ability for RS to discriminate between the experimental groups as well as identify which Raman biochemical components were adept at accurate differentiation. The SMLR classification model was trained using spectra from each bacterial species in colonies, planktonic cells, and biofilm samples to determine important spectral differences. The penalty term, lambda (λ), was set to 1 and represented a high degree of sparsity (i.e., the degree by which the set of features are reduced to important weighted features). The k-fold cross-validation was set to 5, which allowed the data to be randomly divided into k-number of groups to retrain and ensure that the model was not overfitted to any particular subset of data. Figure 1 highlights the key Raman spectral bands identified by the SMLR model, that contribute to the differentiation of each growth environment with a threshold weighted percentage of ≥60%.
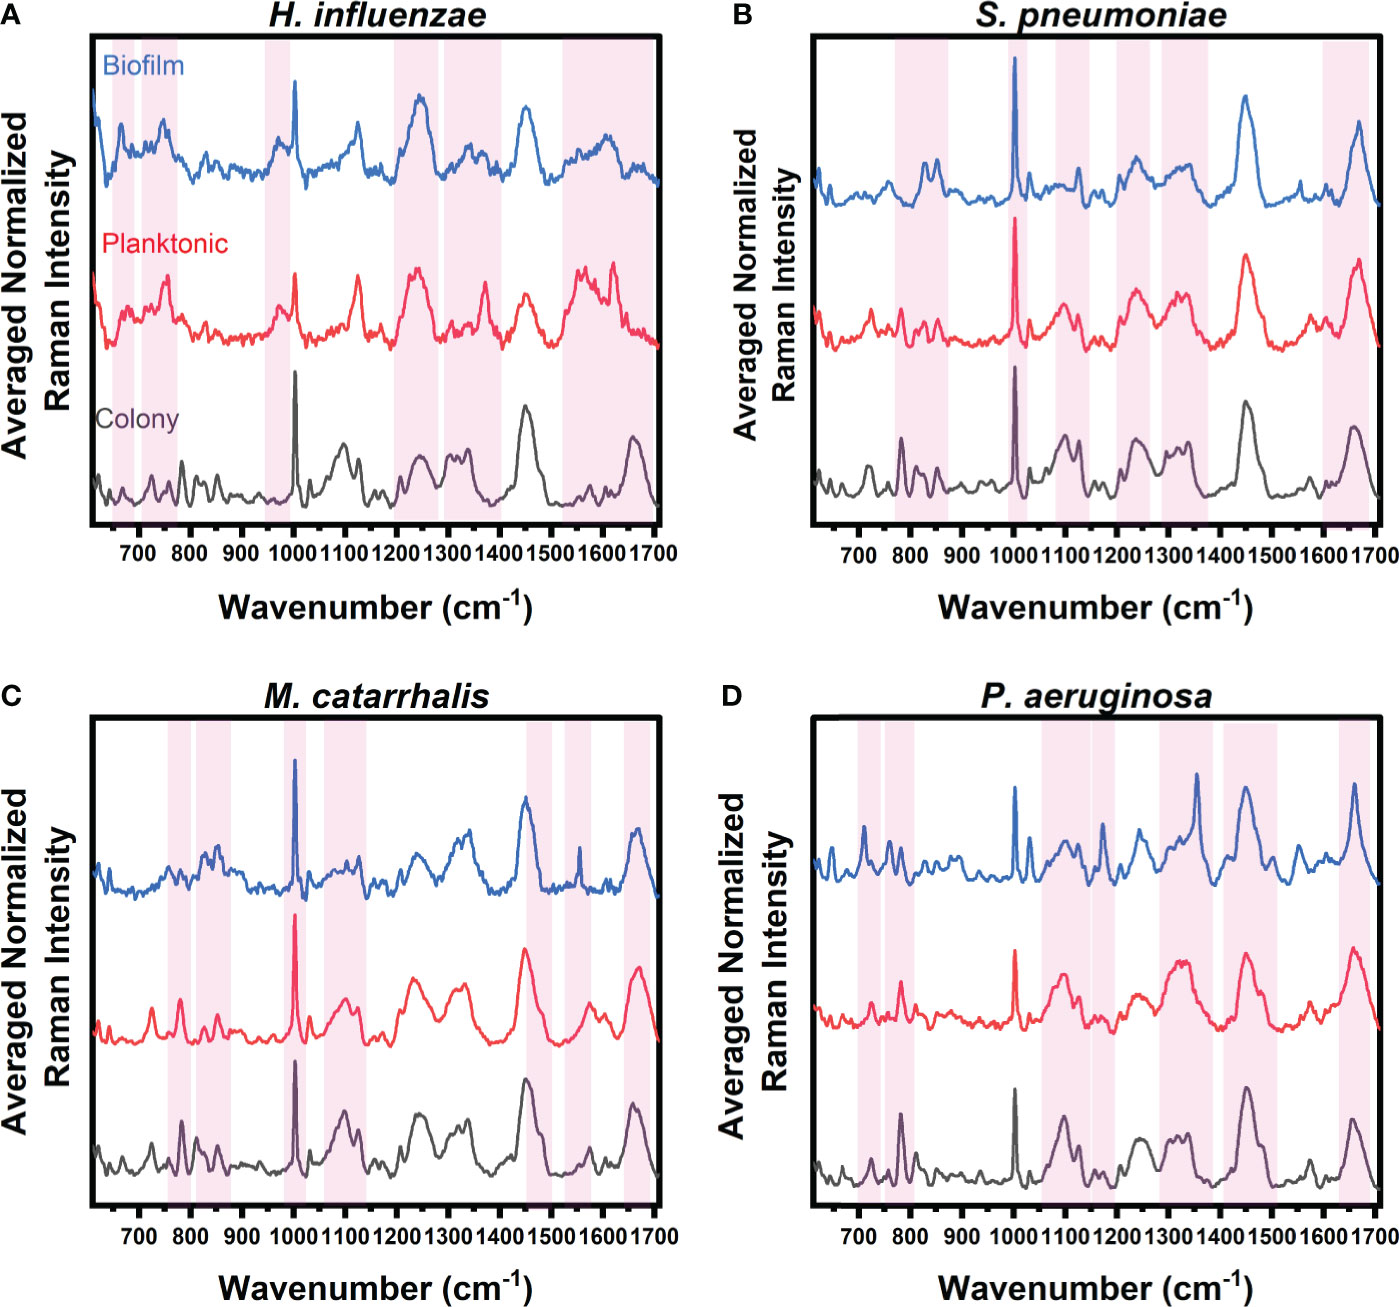
Figure 1 Average Raman spectra of (A) H. influenzae, (B) S. pneumoniae, (C) M. catarrhalis, and (D) P. aeruginosa comparing key Raman spectral differences relating to bacterial growth under three different environments (grey: colony on agar, red: planktonic form, and blue: biofilms on CaF2 substrates). The red bands highlight the wavenumbers with SMLR weighted features contributing ≥60% in differentiating each species’ growth forms.
The Raman spectra from the three forms of bacterial growth environments of H. influenzae show distinct Raman differences, as seen in Figure 1A. The colony, planktonic (pelleted) cells (i.e., planktonic form), and biofilm forms display changes in the Amide I protein structural bonds between 1643 and 1650 cm-1. Also, the Raman spectra of the biofilms show a relative intensity increase as shown in the broad Raman band at ~1610 cm-1 (cytosine: NH2). Additional intensity increase is also observed at ~663 cm-1 (Guanine and tyrosine) for the biofilms of H. influenzae compared to the other growth forms. Figure 1A also highlights differences in the Raman spectra of the planktonic form of H. influenzae. Of note is the reduction in the Raman peak intensity at ~1342 cm-1 (Guanine: DNA/RNA; CH deformation of proteins and carbohydrates) in comparison to its colony and biofilm forms.
Figure 1B highlights the main Raman spectral features of S. pneumoniae that contribute to bacterial differentiation in the three different growth environments. These features include a shift in the Amide I band from 1660 cm-1 (C=C cis, lipids, structural proteins) to 1670 cm-1 (C=C trans, lipids) for bacteria residing in colonies compared to those in both planktonic and biofilm forms. A reduction in the intensities of the Raman bands relating to Guanine at 1320 and ~1357 cm-1 is also seen in planktonic and biofilm forms compared to the bacterial colonies. Also shown is a reduction in the relative Raman intensity of asymmetric phosphate stretching modes at 1230 cm-1 and phosphodioxy groups in nucleic acids of the biofilms, compared to the signal intensity of the agar colonies.
Spectral band differences from M. catarrhalis in colonies, and planktonic and biofilm forms are shown in Figure 1C. Compared to both agar colonies and planktonic form, biofilms of M. catarrhalis demonstrated a reduction in relative Raman intensity at 1098 cm-1 (C-N in lipids) but maintained a relatively similar Raman intensity at 1124 cm-1 (C-C skeletal acyl backbone in lipids). Also seen were a reduction in the relative intensity at ~780 cm-1 (uracil/cytosine ring breathing) and the presence of a sharp Raman peak at ~1554 cm-1 (tryptophan and exopolysaccharide) for the biofilms compared to the other forms. In differentiating the agar colonies from the other environments, the Amide I band was observed at 1660 cm-1 (C=C cis, lipids, fatty acids, structural proteins) while the corresponding peak for planktonic and biofilm forms resided at 1670 cm-1 (C=C trans, lipids, fatty acids).
Raman spectroscopy was also able to differentiate amongst P. aeruginosa in the three different growth environments, as highlighted in Figure 1D. Raman peaks relating to pyocyanin secretion in the biofilm environment at 1174 and 1355 cm-1 were significant in differentiating the biofilms from both planktonic and colony forms. Other key differences included the presence of a strong band at 1315 cm-1 relating to the CH3CH2 twisting in lipids, and a shift of the 1675 cm-1 Raman peak relating to the β-sheet of Amide I vibrational bonds of the biofilms, when compared to the agar colony and planktonic forms. Also, the important key features to differentiate bacterial agar colonies from the other growth forms are observed to be differences in Raman bands at 1098 cm-1 (Phosphodioxy group in nucleic acids), 1328 cm-1 (CH3CH2 wagging in purine bases of nucleic acids), 1360 cm-1 (tryptophan), 1456 cm-1 (DNA), and between 1675 and 1700 cm-1 (Amide I disordered structure).
Based on these key changes among growth environments across each bacterium, the SMLR model demonstrated the ability to accurately differentiate bacterial forms with a minimum sensitivity of 95% and specificity of 98%, as summarized in Table 1.
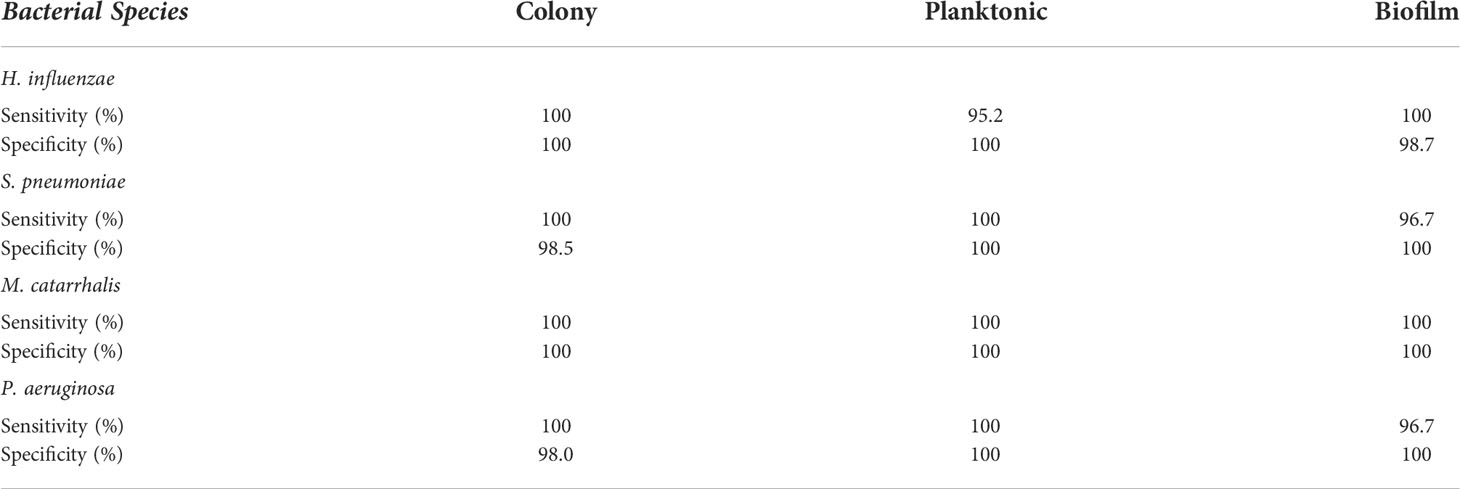
Table 1 A summary of the sensitivity and specificity for SMLR differentiation of three different growth environments for individual bacterial species using RS.
Raman characterization and comparison across bacterial species
To determine the key Raman spectral features that would allow for differentiation amongst the four species, an SMLR model (λ = 1; k-fold = 5) was used to identify discriminatory factors in each growth environment.
In Figure 2, the key Raman bands with the highest weighted percentages for (**≥ 80%, *≥ 60%) biofilm differentiation between the four species are identified and highlighted. In differentiating each species from the other three bacteria, the SMLR model result in sensitivities and specificities greater than 92.3% for all four species (Table 2). Compared to all species, biofilms of H. influenzae showed a significant reduction in intensity of the Amide I Raman band at 1655-1665 cm-1. Raman spectra of S. pneumoniae biofilms show a redistribution of nucleic acid with a relative lower intensity in the 740-782 cm-1 Raman bands, and a relatively higher intensity in the 800-850 cm-1 region. M. catarrhalis exhibits increased relative Raman intensity at 1554 cm-1 relating to tryptophan and exopolysaccharide content (Ayala et al., 2017). On the other hand, the Raman spectra of P. aeruginosa biofilms show a strong Raman band at 1355 cm-1 and a narrow but strong band at 1659 cm-1 that is not evident in the other bacterial species and is likely the result of the secretion of pyocyanin, a known bi-product of P. aeruginosa biofilms (Bodelón et al., 2016; Žukovskaja et al., 2017; Turasan, 2020).
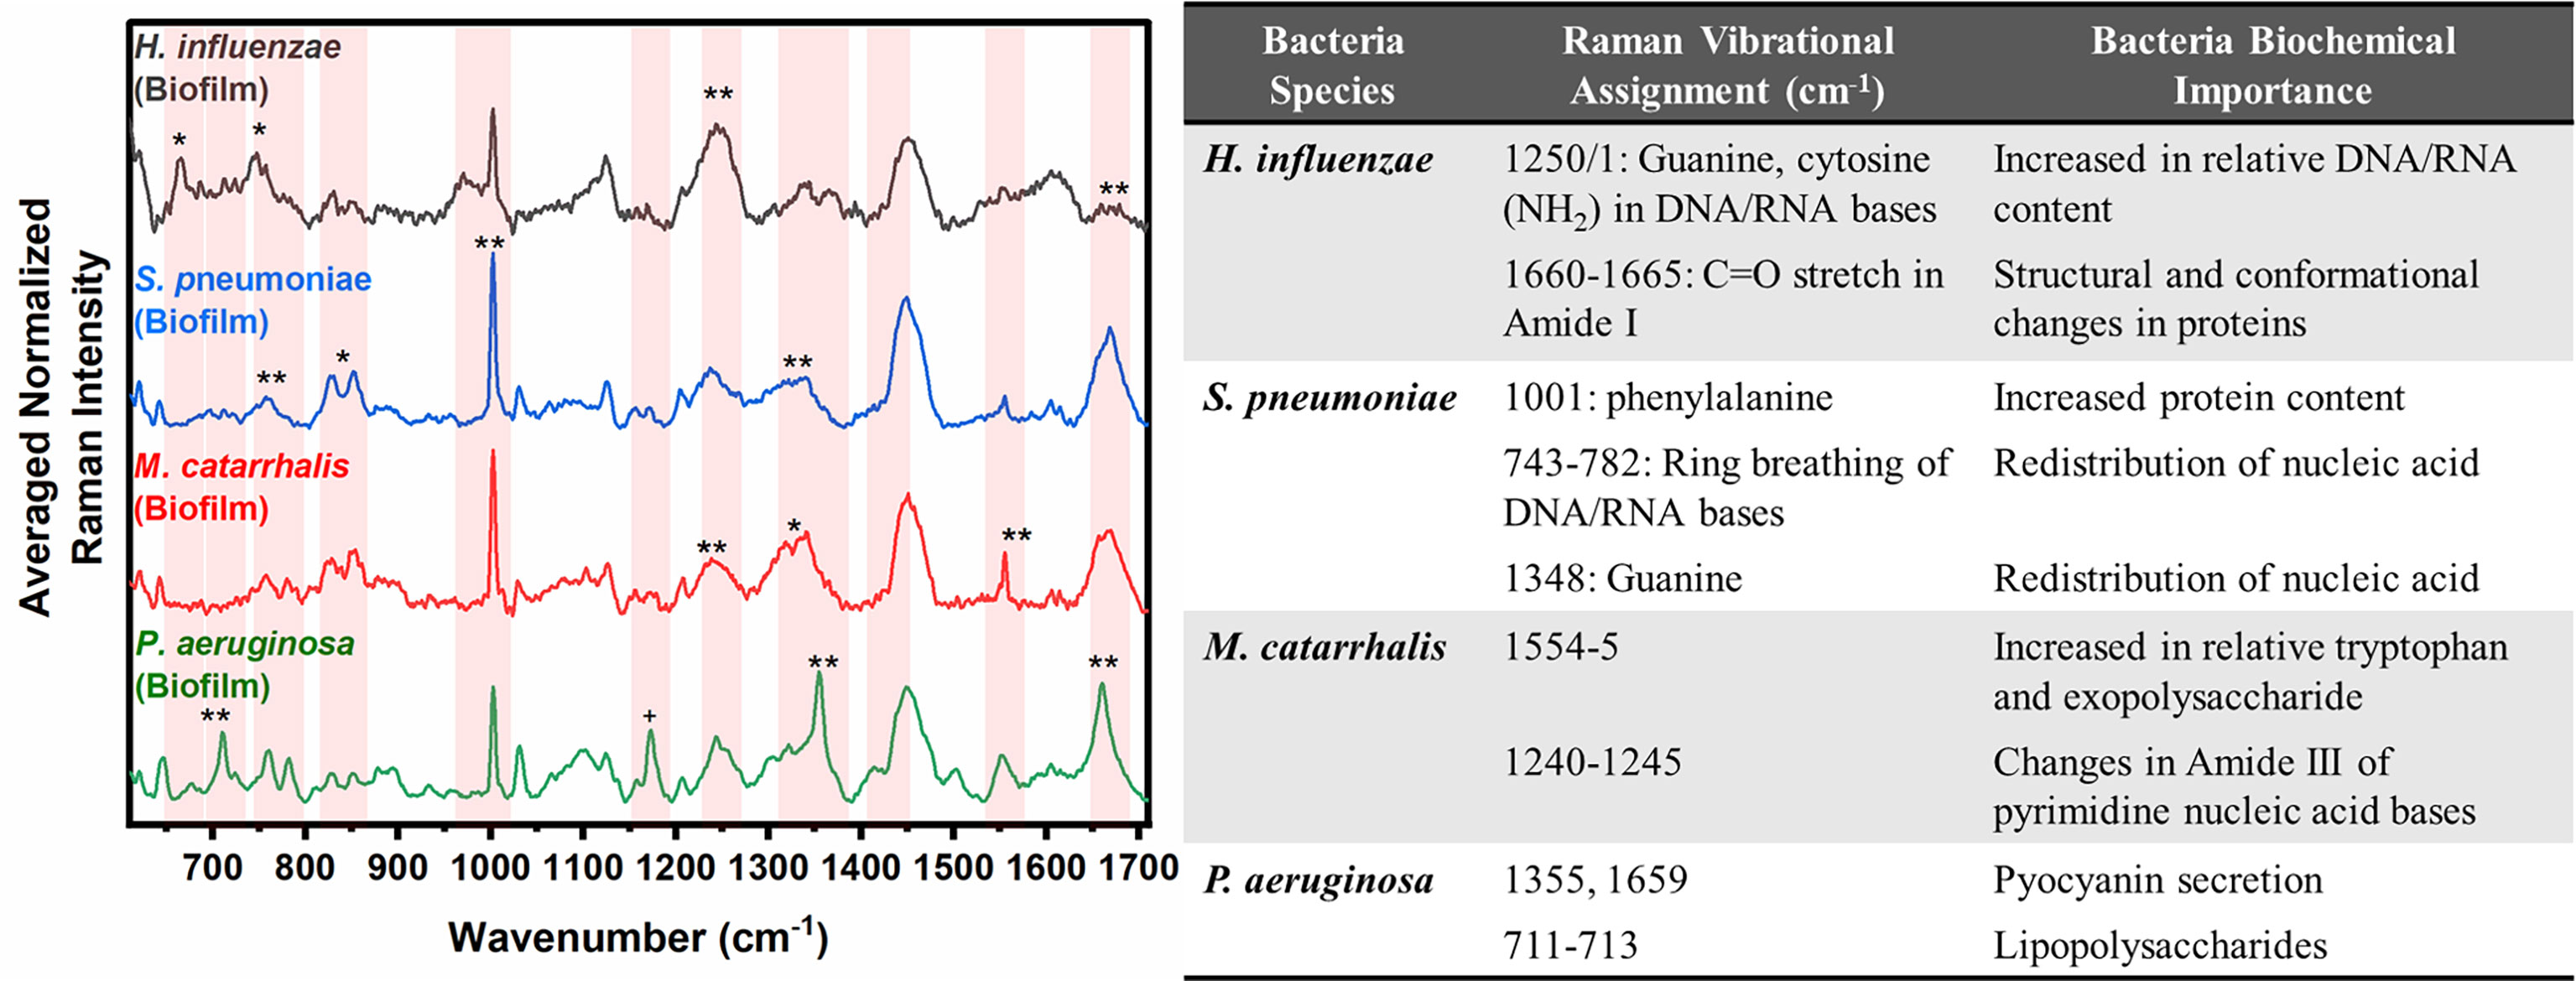
Figure 2 Averaged Raman spectra (left) highlighting key Raman features identified by SMLR to differentiate OM-causing bacterial biofilms. The table (right) provides a summary of the tentative biochemical assignments for the Raman peaks with 80% and above weighted feature contribution to the differentiation. The red bands highlight the wavenumbers with SMLR weighted features contributing to *60-79% and **≥80% in differentiating amongst the species’ biofilms.
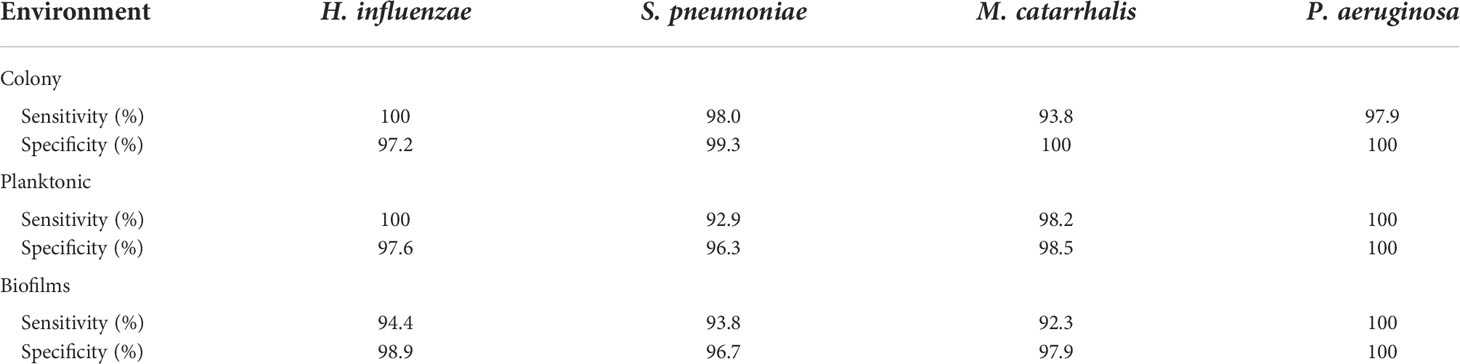
Table 2 A summary of the sensitivity and specificity using SMLR to differentiate the four bacterial species for a given environment using RS.
Herein, bacterial cells grown for 24 hours in liquid cultures were also measured to assess for any differences in the biochemical signatures of the cells grown as free-floating (i.e., planktonic) entities versus those grown on solid media or in a biofilm form. Prior to measurements, the free-floating cells were concentrated into a pellet to improve the signal-to-noise of the spectra. The key Raman peaks in differentiating each species from each other are highlighted in Figure 3. The corresponding SMLR model result in sensitivities and specificities greater than 92.9% in discriminating all four bacteria from each other (Table 2). The planktonic (pelleted) cells of H. influenzae show a significant redistribution of protein related content such as the Amide I Raman band between 1660-1670 cm-1 and phenylalanine at 1003 and 1104 cm-1. Spectral features of planktonic S. pneumoniae were difficult to differentiate from those of M. catarrhalis. However, compared to S. pneumoniae, M. catarrhalis exhibits a redistribution of nucleic acid content in the Raman spectra regions of 763 cm-1 and 810-830 cm-1. Raman spectra of planktonic P. aeruginosa show the absence of the Raman band at 1605 cm-1 (cytosine: NH2; ring C-C stretch of phenyl). Also, P. aeruginosa Amide I Raman band resides at 1659 cm-1, compared to S. pneumoniae and M. catarrhalis, both having the Amide I band residing at ~1670 cm-1.
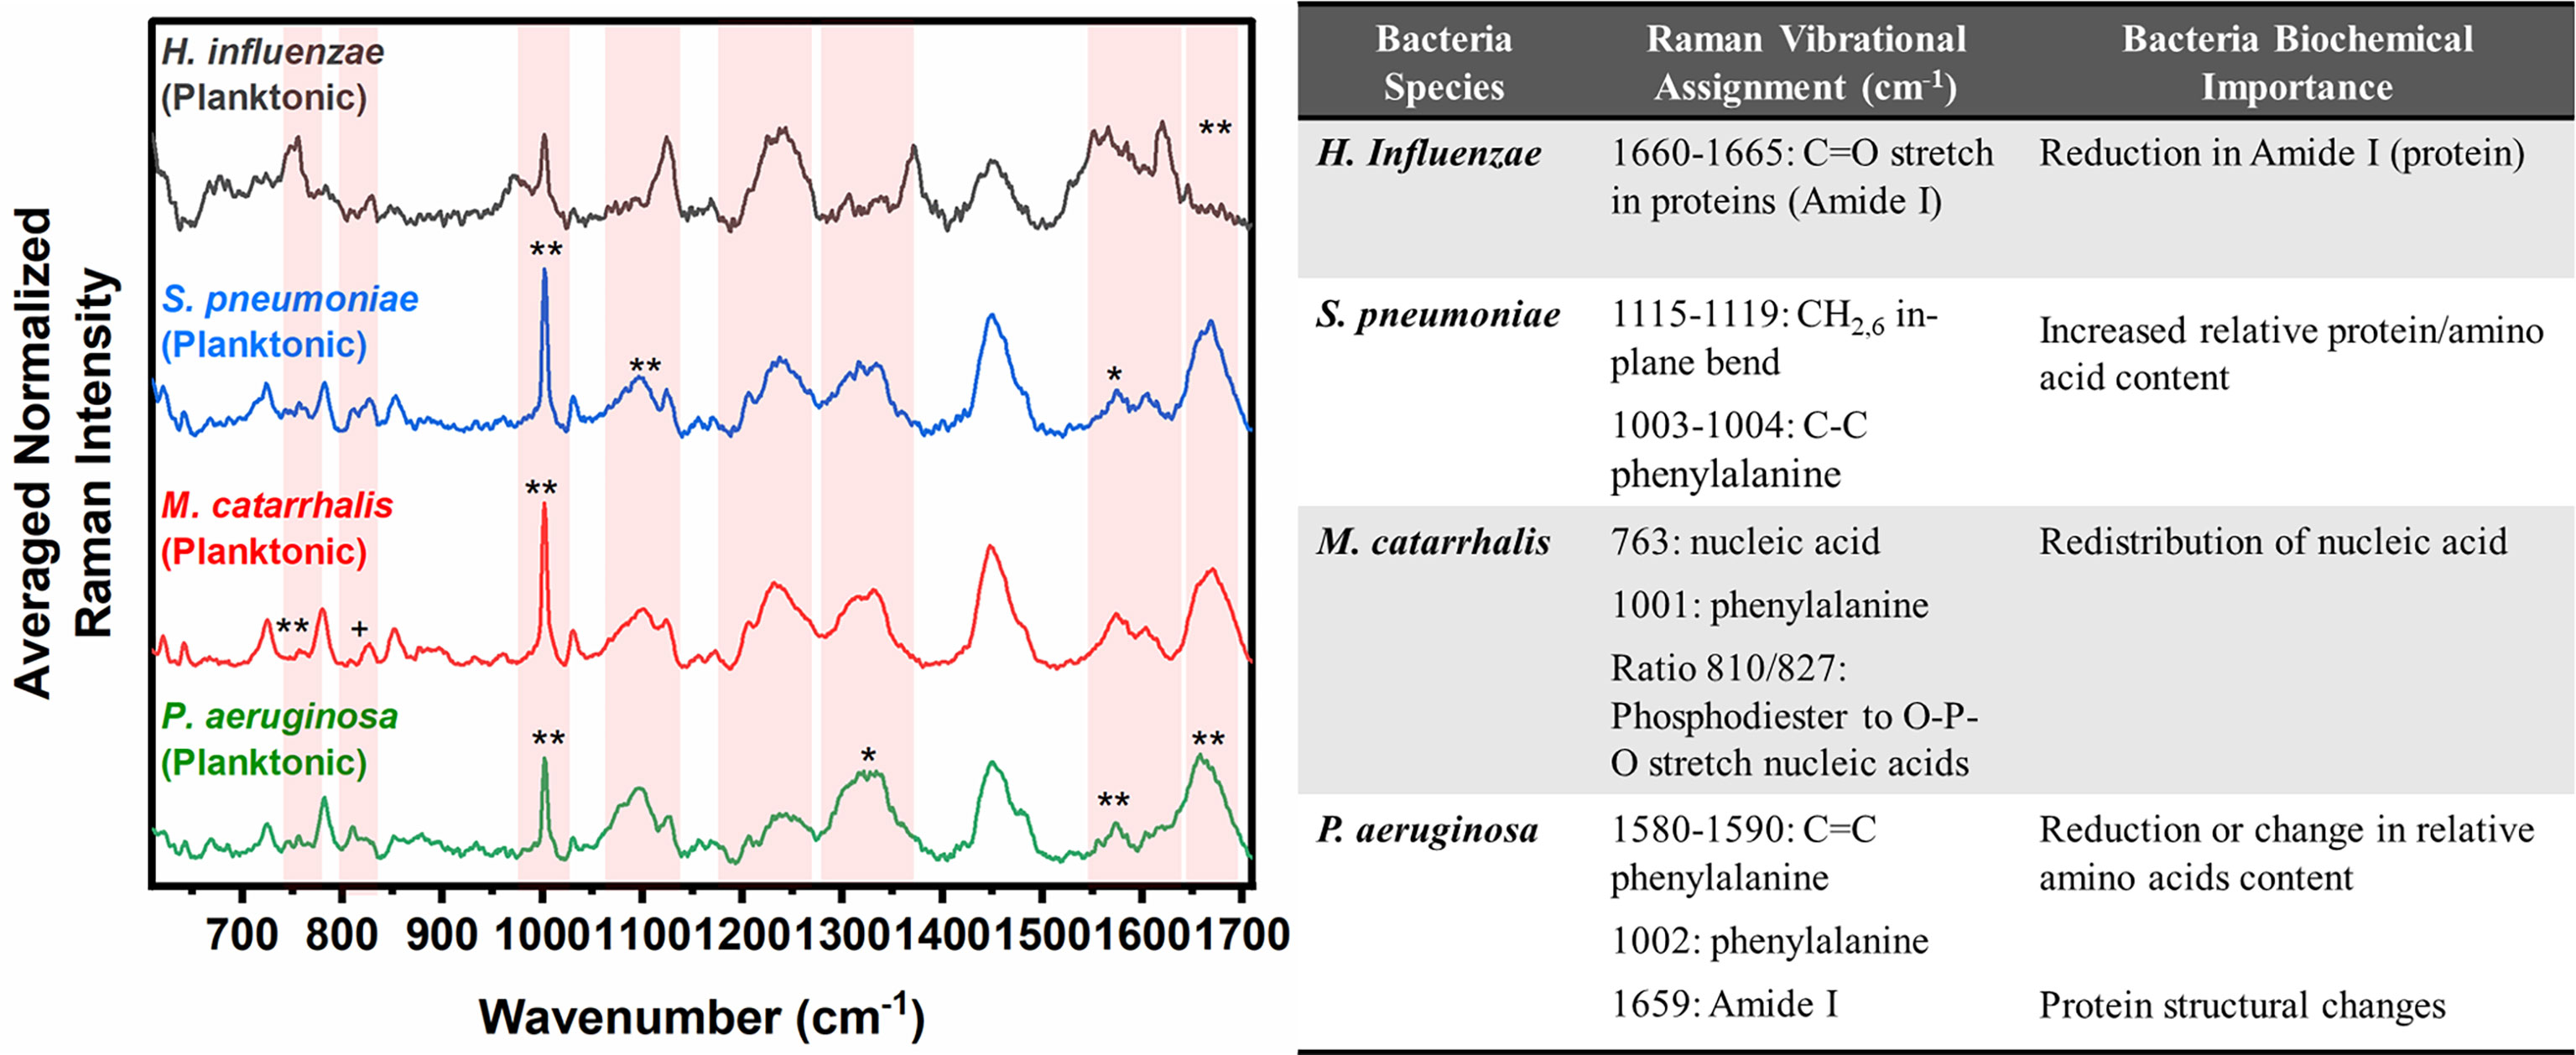
Figure 3 Averaged Raman spectra (left) highlighting key Raman features identified by SMLR to differentiate OM-causing bacteria planktonic form. The table (right) provides a summary of the tentative biochemical assignments of the Raman peaks. The red bands highlight the wavenumbers with SMLR weighted features contributing to *60-79% and **≥80% in differentiating amongst the species’ planktonic cells (+spectral changes observed visually but not identified by the SMLR model).
Differences are also seen amongst the species of bacteria grown on BHI agar (Figure 4), and the resultant SMLR model show sensitivities and specificities above 93.8% in differentiating all four species from each other (Table 2). To note, compared to the others, the colonies of H. influenzae exhibit a reduction in Raman intensity at ~780 cm-1, relating to RNA content. A peak shift at ~716 cm-1 (phospholipids, choline group) is observed for S. pneumoniae colonies compared to the other species whose peak Raman band resides at 725 cm-1 (DNA). Another peak shift difference is observed at 1296 cm-1 relating to CH2 deformation in lipids, while the other bacterial species peak is located at ~1304 cm-1. The peak intensity ratio at I1096/I1126 for all four species also indicates differences (p< 0.001) in the phospholipid content across all four species with S. pneumoniae displaying the lowest ratio of 1.06 ± 0.11 compared to M. catarrhalis (1.36 ± 0.07), H. influenzae (1.29 ± 0.08), and P. aeruginosa (1.61 ± 0.11). M. catarrhalis shows a reduction in the lipid bands between 1295-1304 cm-1 and a significant increase (p< 0.001) in Amide III (1245 cm-1) Raman intensity; while the Amide I band of P. aeruginosa differs from the other species by a noticeable decrease in intensity at the shoulder of the 1670-1680 cm-1 Raman band.
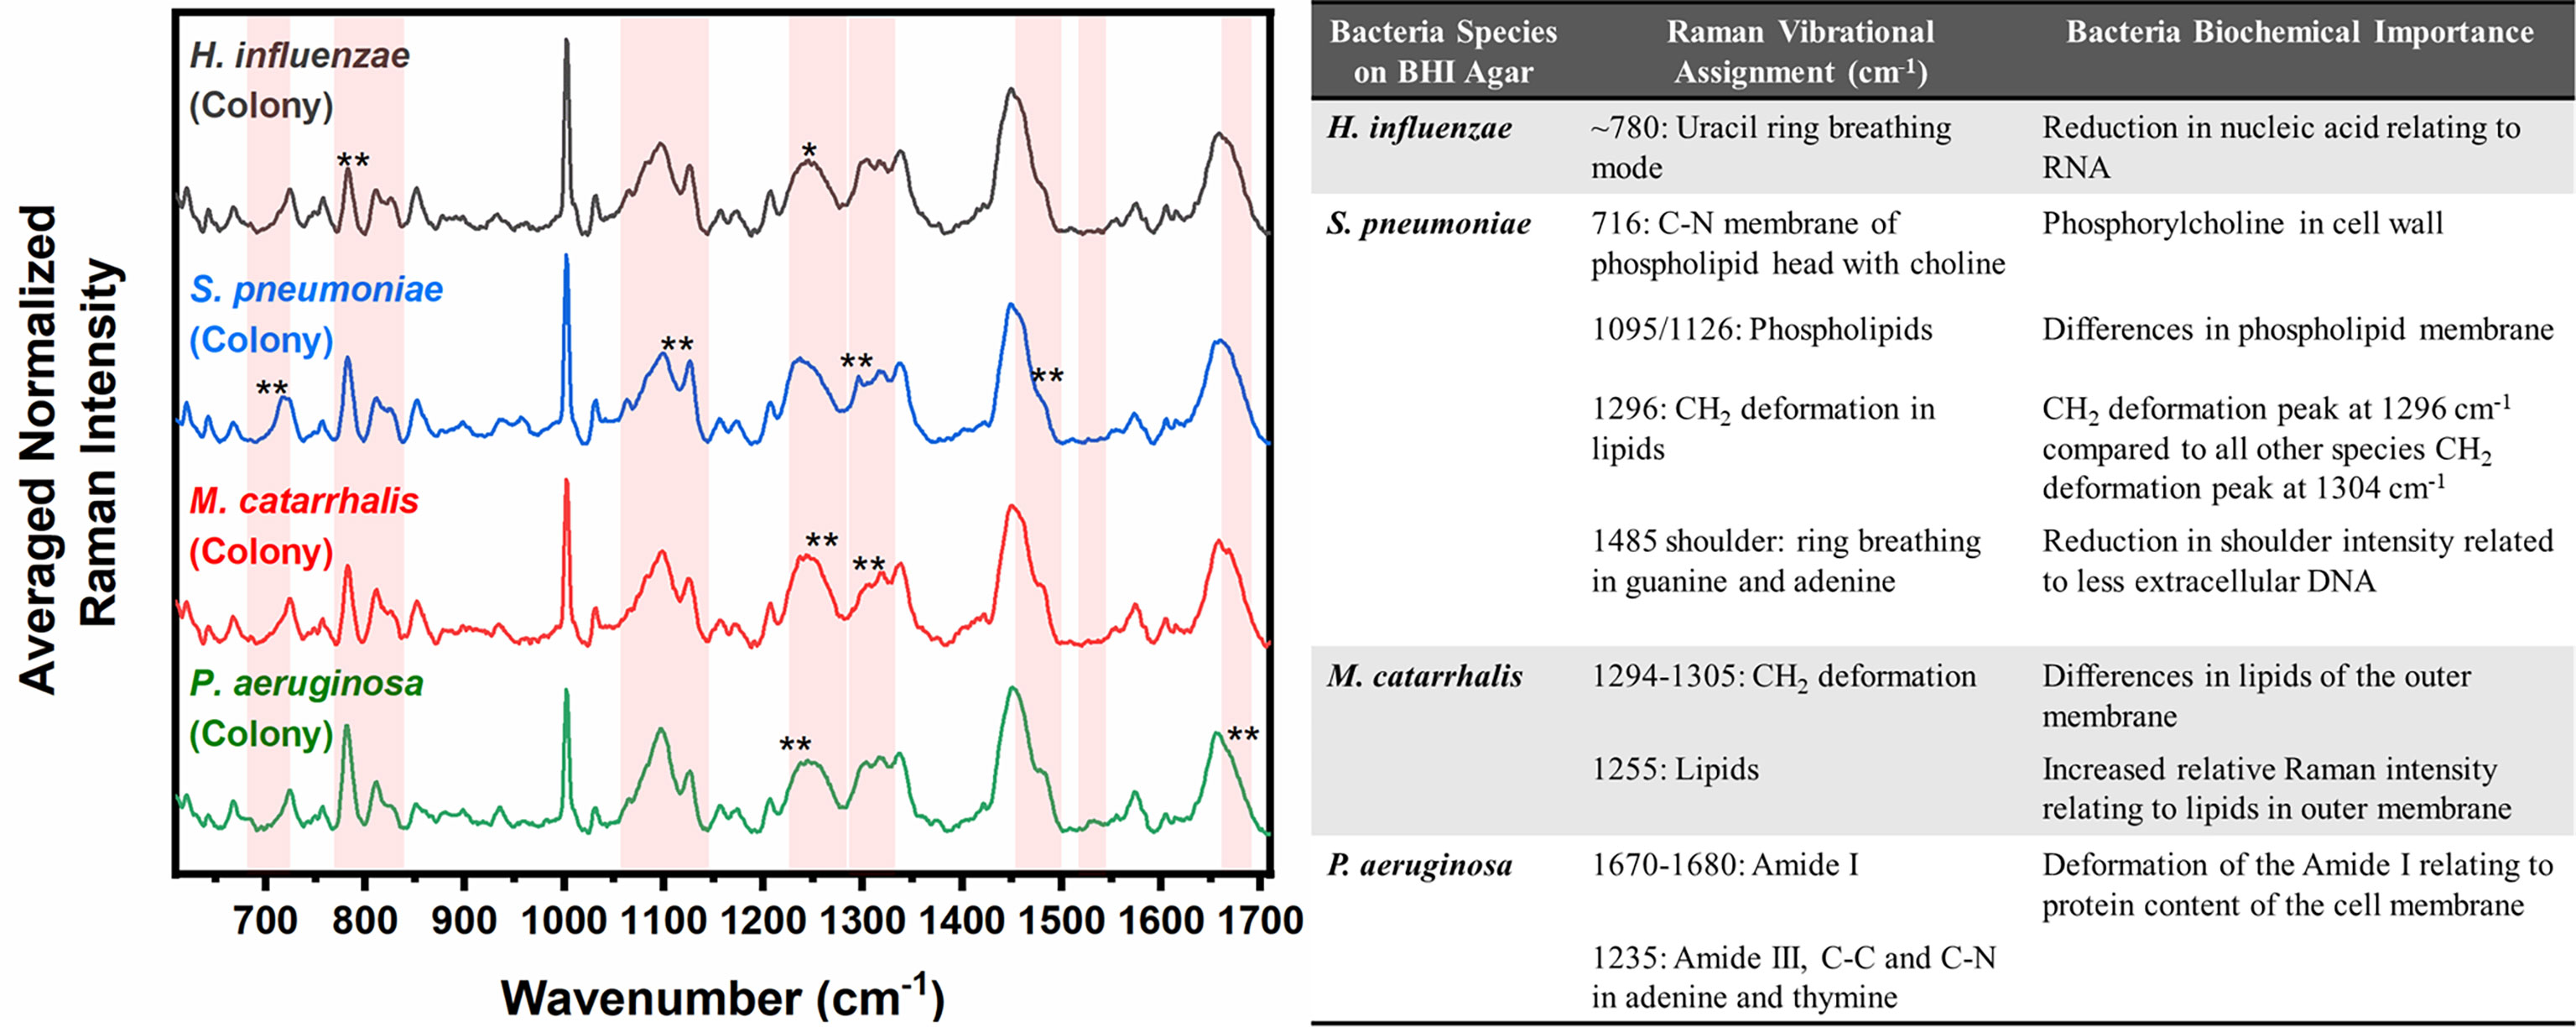
Figure 4 Averaged Raman spectra (left) highlighting key Raman features identified by SMLR to differentiate OM-causing bacterial colonies grown on BHI agar. The table (right) provides a summary of the tentative biochemical assignments of a few of the key Raman peaks. The red bands highlight the wavenumbers with SMLR weighted features contributing to *60-79% and **≥80% in differentiating amongst the species’ colonies.
OCT characterization of OM-causing bacteria and their microbial environment
2D and 3D OCT images of all forms
With a custom-built benchtop OCT system operating at a center wavelength of 1325 nm (Supplementary Figure 1), all four bacterial species were characterized and analyzed in colony, planktonic, and biofilm forms. Figure 5 represents 2D cross-sectional OCT images from a single bacterial colony, planktonic bacterial pellet, and biofilm. The cross-sectional OCT images of each bacterium shows that a single colony (Figures 5a1-d1) contains a dense cluster of this cell mass depicted by the high signal intensities throughout the colony. Figures 5a1-d2 display the 2D images from the planktonic bacteria in pellet form that shows more heterogeneous optical scattering signals from the sediments in the pellets. More dense bacterial deposits are also observed in the pellet, as shown in Supplementary Video 1. In Figures 5a3-d3, thin bacterial biofilm (~100-200 µm) structures with more heterogeneous scattering intensities and variable thicknesses are observed from the biofilm grown on the substrates. Also, the biofilms of P. aeruginosa appeared to form a “mushroom”-like shape, as seen in Figure 5d3, and likely contains substantial amounts of water, as indicated by the dark, low-scattering, regions in the OCT images. These water-filled pores have also been reported by other groups as a structural feature of biofilms (Flemming and Wingender, 2010). Better visualization of all three forms can be seen in the Supplementary 3D volumetric OCT images and videos.
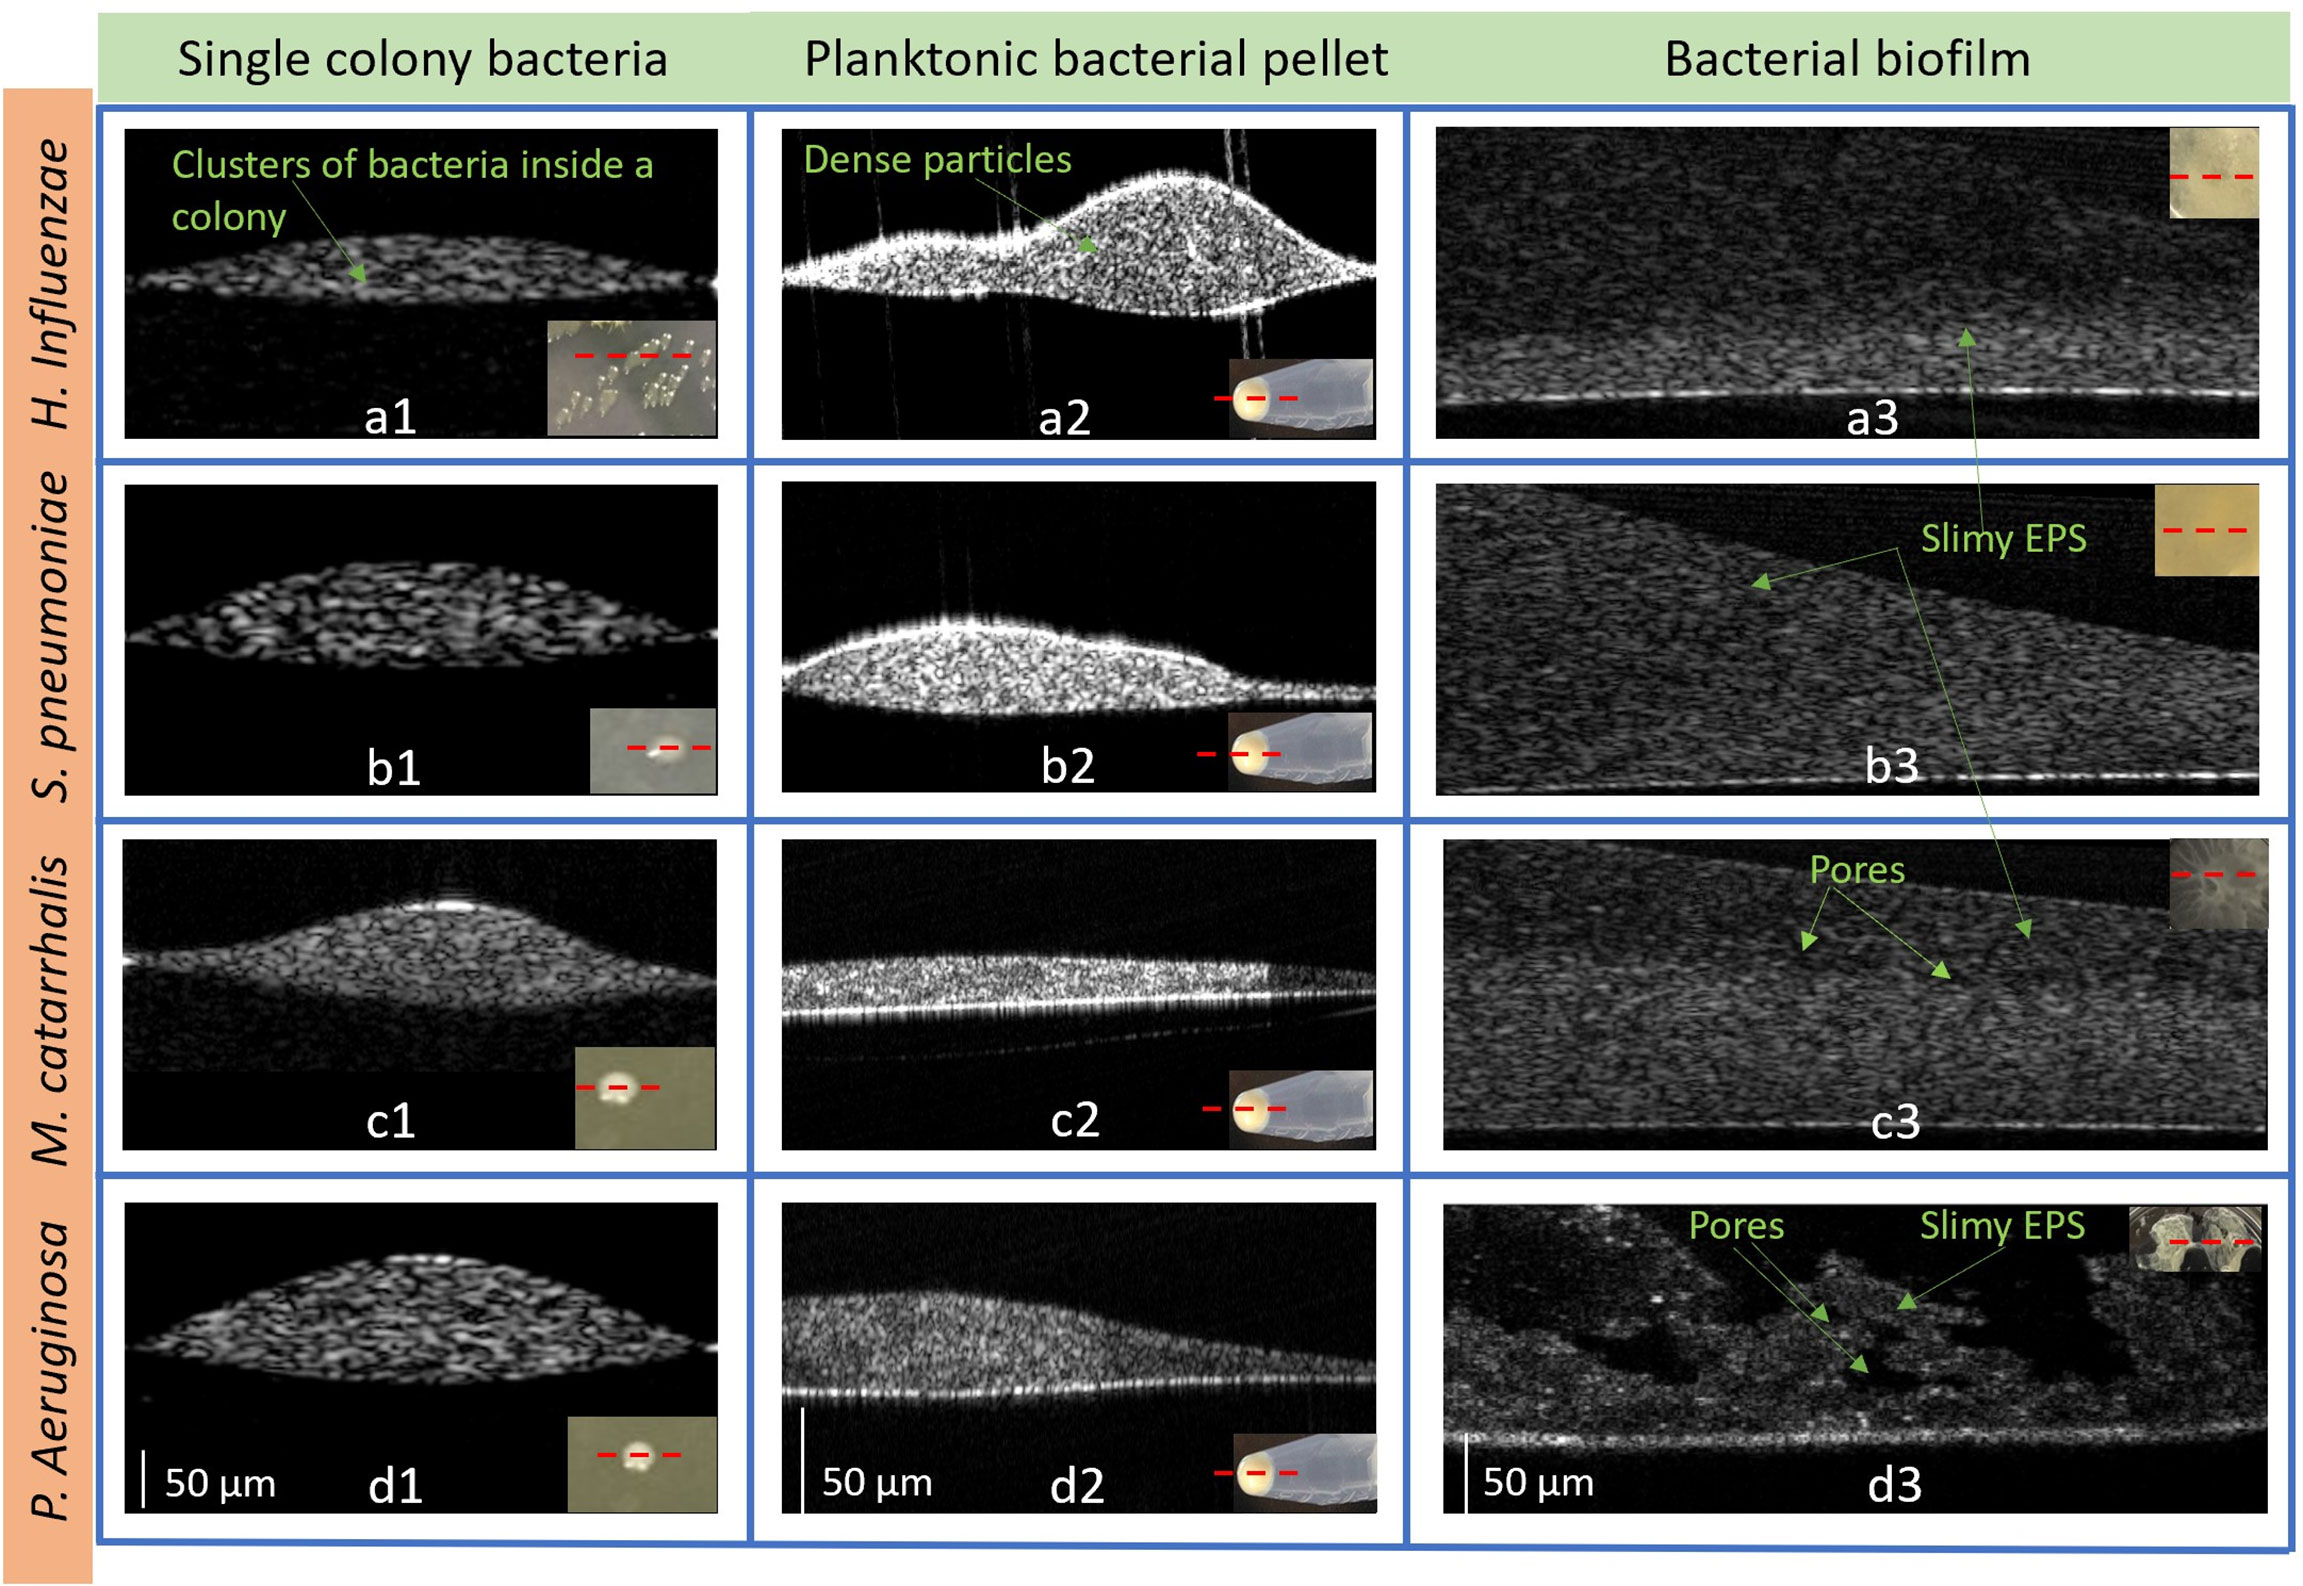
Figure 5 Representative 2D OCT images from H. Influenzae (a1) single-colony, (a2) planktonic (in pellet), and (a3) biofilm; S. pneumoniae (b1) single-colony, (b2) planktonic (in pellet), and (b3) biofilm; M. catarrhalis (c1) single-colony, (c2) planktonic (in pellet), and (c3) biofilm and P. aeruginosa in (d1) single-colony, (d2) planktonic (in pellet), and (d3) biofilm. The lower right insets show photos of the bacteria in each form. (Supplementary Figure S3: Representative 3D OCT images from P. aeruginosa are shown in (a) a single-colony, (b) planktonic (in pellet) and (c) biofilm and 3D videos of the three forms).
From these OCT images, quantitative analysis was performed to determine differences in refractive indices and optical attenuation.
Refractive index measurements from bacterial species
The refractive index (RI) was extracted by computing the ratio of the optical and geometrical thicknesses of the sample obtained from a cross-sectional OCT image (as described in the methods section) and compared across bacterial species. Figure 6A shows the mean RIs of the different bacterial species in the three growth environments. In addition, mean RIs of the planktonic form and biofilms were determined, resulting in values ranging from 1.31 to 1.34. Based on the one-way ANOVA test (p < 0.05), the RIs of the colonies had a significantly higher mean RI (~1.44 ± 0.02) than the mean RI of both planktonic form and biofilms (both ~1.33 ± 0.02) across all four of the bacterial species. RI is dependent on the density of cells. Higher RI was observed for the denser single bacterial colonies compared to the more heterogeneous biofilms that contain liquid-filled pores and channels. Bacteria within biofilms are assembled in microcolonies encased by an EPS matrix and separated by water channels, which results in a less dense packing of cells within that matrix and a lower RI. The mean RI from planktonic bacteria and biofilms are almost identical for all bacterial species due to the presence of water in both forms, as shown in Tables 3, 4.
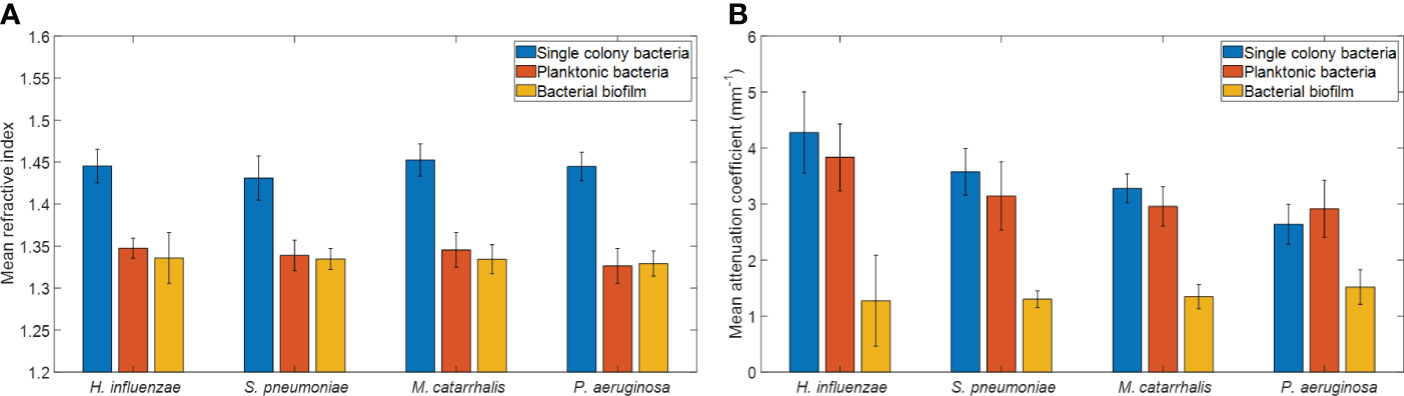
Figure 6 Comparison of (A) mean refractive indices and (B) mean attenuation coefficients from different bacterial colonies grown on brain heart (BH) agar plates, planktonic form, and biofilm forms. Here, each bar graph represents the mean and the standard deviation from 32 independent measurements.
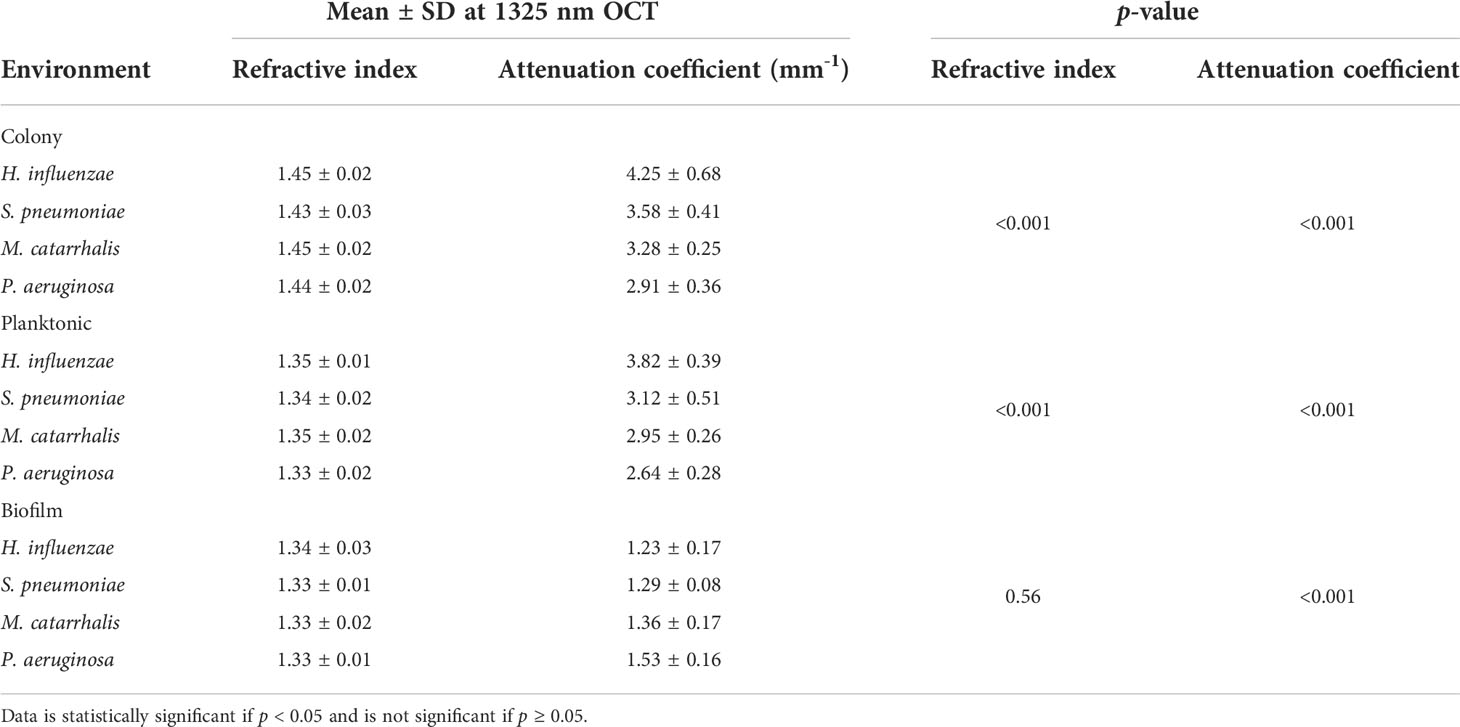
Table 3 Overall mean (n = 32 for each independent measurement) and statistical comparison of RI and AC for the different bacterial species in all three growth forms using the one-way ANOVA test.
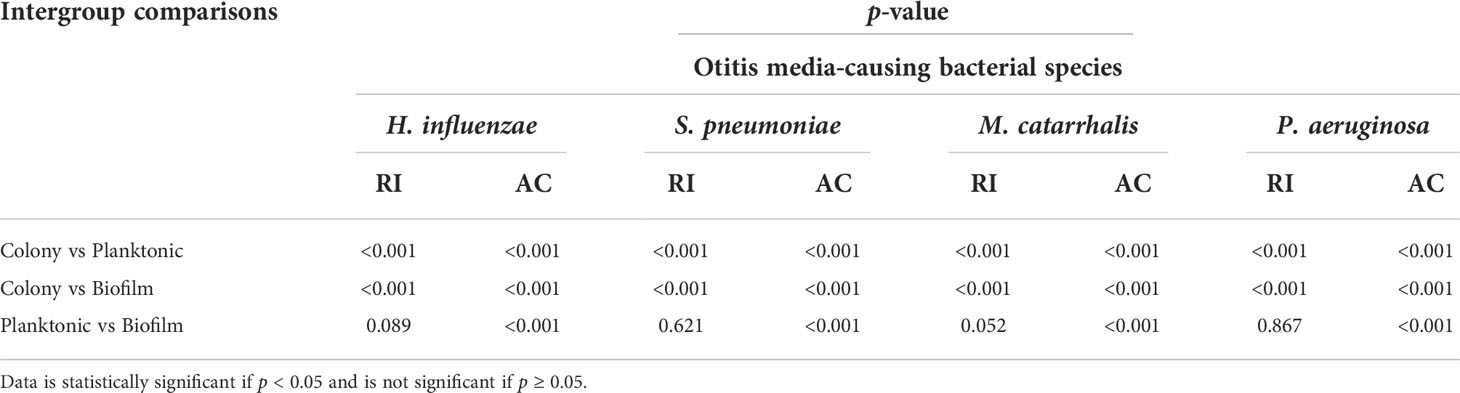
Table 4 Inter-group comparison of p-values among bacterial species in colony, planktonic, and biofilm forms by one-way ANOVA with post-hoc Tukey’s HSD test.
Attenuation coefficient measurements from bacterial species
In addition, a depth-resolved pixel-wise single scattering attenuation coefficient algorithm (Vermeer et al., 2014) was applied to the 2D OCT images for each bacterial species in colonies, planktonic form, and biofilm. To determine if OM-causing bacteria scatter light differently based on species and growth conditions, the mean AC of all samples was computed using a custom-developed MATLAB script. Figure 6B shows the overall mean ACs and standard deviation of the different bacterial species in the three growth environments.
Table 3 summarizes the statistical comparison (one-way ANOVA) of the mean RI and mean AC for the different bacterial species in all three growth forms. Comparing the mean values of ACs, the growth of bacteria from colonies to planktonic cells, in liquid cultures, and then to biofilms show substantial differences. In all cases, bacterial colonies grown on agar plates demonstrate a higher AC, while each biofilm result in the lowest AC (Table 3). Tables 4 and 5 show the intra-group comparison and statistical significance (p-value) among bacterial species in colony, planktonic, and biofilm forms and between species in all three forms using the one-way ANOVA with post-hoc Tukey’s HSD test, respectively, to distinguish the significant differences between pairs of means. The RI measurements were almost identical between planktonic cells (~1.33-1.35) and biofilms (~1.33-1.34) showing no significant differentiation, and likely due to the presence of water (RI ~1.33) in both forms. However, the AC measurements show significant differences across all growth states for each species (Table 4), with each species’ colonies displaying the highest AC values compared to its planktonic cells and biofilms. Moreover, across species (Tables 3, 5), P. aeruginosa displays the smallest AC in both colony and planktonic forms. While H. influenzae biofilms have significantly smallest AC values (1.23 ± 0.17) across all species, and P. aeruginosa biofilms generate the highest AC value (1.53 ± 0.16). Overall, the AC measurements can differentiate all bacterial species in colony form, but can only differentiate H. influenzae from the other species within planktonic form, and P. aeruginosa biofilms from the other bacterial biofilms. A significant difference is also observed between H. influenzae and M. catarrhalis biofilms (p < 0.003, Table 5). Additionally, all species’ biofilms appear to be heterogeneous. This can be visualized in the AC maps (Supplementary Figure 3) and Supplementary Video 3 as different regions, within the same biofilm, displaying various degree of AC values.
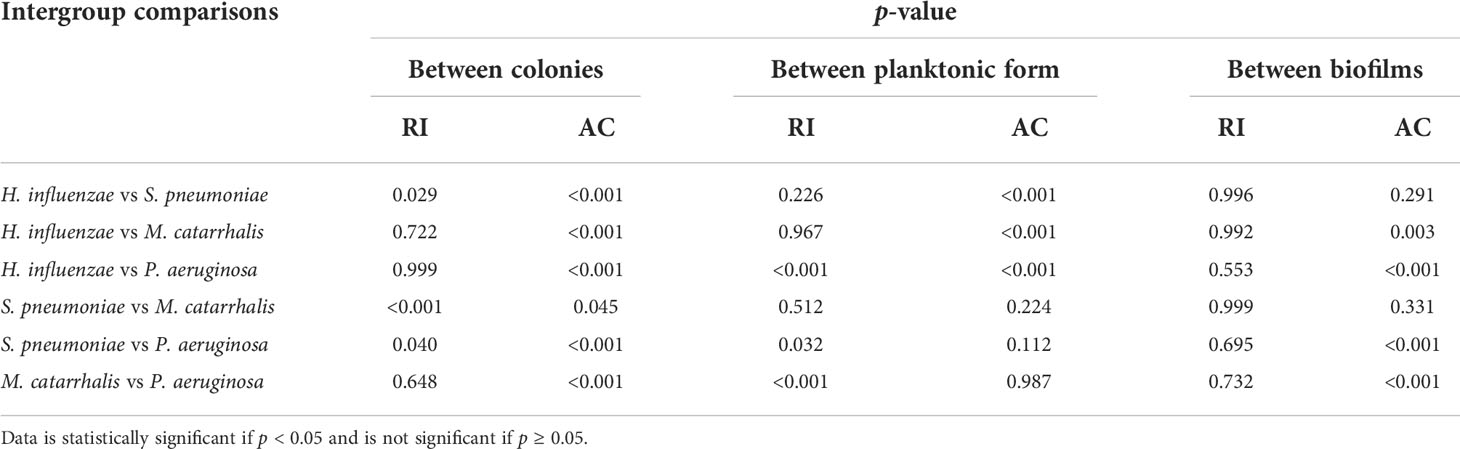
Table 5 Intra-group comparison of p-values among colonies, planktonic form, and biofilms by one-way ANOVA with post-hoc Tukey’s HSD test.
Discussion
An OM diagnostic tool that can provide additional information about the bacterial otopathogen, including detecting and characterizing the bacterial state (i.e., effusions (planktonic) versus biofilms), would help better inform treatment; including the administration of antibiotics. Herein, the detection capabilities of both RS and OCT were explored independently but under similar experimental conditions to highlight the potential for these two modalities to serve as a future dual-modality tool capable of achieving this diagnostic goal. Both light-based technologies offer different but complementary mechanisms to characterize differences in growth states of OM-causing bacteria and, in most cases, offer a means for differentiation across bacterial species.
First, the differences in the biochemical composition of four OM-causative bacterial species studied herein can be seen using RS. Furthermore, with above 93% sensitivity and specificity, RS can detect feature-specific chemical and structural changes that occur during the growth of the OM-causing bacteria from colonies to planktonic form and finally, biofilms. In particular, P. aeruginosa is known to secrete toxins such as pyocyanin as a defense mechanism to safeguard itself within biofilms and promote extracellular DNA (eDNA) release (Das and Manefield, 2012). The Raman signatures of pyocyanin have been well studied by other researchers who noted strong bands at ~1354 and 1610 cm-1 (Bodelón et al., 2016; Turasan, 2020). Biofilms of P. aeruginosa also display this prominent peak at 1355 cm-1, as seen in Figure 1D, indicating the secretion of this toxin within three days of the biofilm growth. Also seen, across the three growth forms, is a shift in the Amide I (C=O stretch) Raman band between 1640 – 1680 cm-1 (Maquelin et al., 2000; AlMasoud et al., 2021). In particular, the colonies and planktonic form of P. aeruginosa Amide I band peak reside at ~1670 cm-1. However, for the biofilms, this peak is shifted to ~1659 cm-1. The ~1610 cm-1 Raman peak of pyocyanin could be contributing to this peak shift associated with the P. aeruginosa biofilm formation. Moreover, the chemical secretion, and its corresponding Raman peak at 1355 cm-1, provides a means to distinguish P. aeruginosa biofilms from its colony and planktonic form. This key Raman peak also allows for differentiation from the other OM-causing bacterial species studied herein, as seen in Figure 2, with 100% specificity and sensitivity.
For S. pneumoniae, the key differences between the biofilm and planktonic forms are seen in Figure 1B as changes in the protein/lipid peak ratio at 1095 cm-1 (C-N vibrational bonds) and the skeletal acyl backbone of lipid Raman peak at ~1124 cm-1 (C-C: transconformation) (He et al., 2014). The planktonic form exhibits a stronger Raman intensity at 1095 cm-1 compared to the biofilms. Also, a conformational change of the protein/lipid is observed, where the colonies exist in a -’cis’ configuration (1660 cm-1) while the planktonic and biofilms exist in the ‘trans’ (1670 cm-1) configuration (Talari et al., 2015). These changes suggest that one potential mechanism in the formation of S. pneumoniae biofilms is associated with membrane lipid structural changes as the bacteria adapts to biofilm growth. Furthermore, the relative redistribution in the intensity of the nucleic acid content (~740–832 cm-1) of the S. pneumoniae biofilms provides a discriminatory factor for this bacterium from the other three OM-causing bacteria. This redistribution is seen in Figure 2 as a higher relative Raman intensity between 800-830 cm-1, and potentially relates to higher levels of extracellular DNA (eDNA) release compared to the other bacteria. The release of eDNA is important for the initial adhesion and aggregation of bacterial cells toward biofilm formation. This biomolecule is reported to be released spontaneously during the formation of S. pneumoniae biofilms (Moscoso et al., 2006). Also, S. pneumoniae is a gram-positive bacterium and the only one of the four studied herein. Therefore, differences are seen in the Raman bands of its agar colonies between 710- 730 cm-1 could relate to its cell wall components (Figure 4). Unlike the other species whose nearest Raman peak resides at ~725 cm-1 and relates to DNA content (Guicheteau et al., 2006), the Raman spectra of this bacterium contain a distinct Raman peak at 716 cm-1 suggesting the presence of phospholipid-containing choline biochemical signatures (Krafft et al., 2005). Researchers have reported that this bacterium cell wall includes lipoteichoic acid-choline moieties (Meiers et al., 2014). Therefore, the distinct peak at 716 cm-1, suggests the Raman spectral feature of the choline contained within its cell walls, which is not present in the cell walls of the other bacteria. In addition to the 716 cm-1 spectral feature, other differences in the phospholipid signatures can be seen in the RS regions of 1094-1126 cm-1 and 1294-1304 cm-1 in Figure 4. These differences are potentially related to the bio-composition of the outer membrane of gram-positive versus gram-negative bacteria. Altogether, these three spectral differences allow for the differentiation of S. pneumoniae colonies, grown on BHI agar, from the other three bacterial species.
Similar to S. pneumoniae, M. catarrhalis biofilms also demonstrates lipid structural changes as shown in the reduction in relative Raman intensity at 1098 cm-1, but maintains relatively similar Raman intensities at 1124 cm-1 compared to its planktonic form (Figure 1C). Also, in differentiating the agar colonies from the other environments, the Amide I Raman peak resides at 1660 cm-1 for the colonies compared to 1670 cm-1 for the planktonic form and biofilms. However, the main distinguishing feature of this bacterium to differentiate the planktonic form and agar colonies from its biofilms relates to the Raman peak at ~1554 cm-1. This peak potentially relates to elevated levels of tryptophan release during DNase production (Hussein, 2016) and can be used to differentiate M. catarrhalis biofilms from the other OM-causing bacterial species (Figure 2).
Raman spectroscopy is also able to differentiate all three growth forms of H. influenzae. The differences can be seen in Figure 1A in the Raman regions between 1643-1650 cm-1, 1342-1373 cm-1, and ~666 cm-1. The biofilms of H. influenzae differ from its planktonic form in the Raman spectral regions of 666 cm-1 and 1342-1373 cm-1 relating to the redistribution of amino acid and proteins in the 1500-1700 cm-1 region (Guicheteau et al., 2006). One potential cause of these redistributions may be the regulation of proteins in the formation of biofilms. A proteomic study conducted by Post et al. reported that there is a downregulation of proteins associated with energy metabolism and protein synthesis, but those involved in fatty acids, DNA metabolism, and transcription are upregulated when H. influenzae exists in biofilm form (Post et al., 2014). These protein biochemical changes can be detected via RS and allow for the differentiation of H. influenzae from the other bacterial species (Figure 2).
Altogether, RS can characterize the biochemical differences that occur between growth forms of the same species as well as the differences in bio-compositions across species. Across species, RS can differentiate the four causative species from each with other with specificities greater than 96% in all three growth forms. This is important in the case of OM detection where the different causative species and growth states (i.e., planktonic form within effusion versus biofilms) may cause varying response to antibiotics. Thus, knowing more information about the disease can better inform treatment. However, the biochemical “fingerprint” is only one aspect of bacterial characterization. Its morphological structure, as it inhabits an environment, can also be used for characterization and differentiation. In particular, biofilms are known to be inherently heterogeneous (Hall-Stoodley et al., 2008; Hall-Stoodley and Stoodley, 2009). Therefore, OCT, an imaging modality, has the added benefit of visualizing and spatially assessing the morphological changes of the bacteria in its colony, planktonic form, and biofilm forms, with fast acquisition times, to better inform species and growth identification.
OCT is a non-invasive and non-destructive label-free technique that requires no sample preparation. Herein, it was utilized to assess whether morphological differences can be detected via the RIs and/or ACs for each of the four OM-causing bacterial species. As the OM-causing bacterial species are grown from colonies to biofilms, there are observed differences in the light scattering optical properties based on varying morphological differences. It is expected, that samples with thicker layers or membranes, denser or clustered cells, or ones which contains higher amounts of biochemical secretions will result in larger light scattering events. In general, single colony bacteria are highly dense clusters of cells, and factors such as how tightly packed these colonies are as well as what biochemical they secrete can impact its optical properties. Planktonic cells are free-floating cells in a liquid matrix, and are responsible for initiating biofilm formation in response to a nutrient-rich environment by undergoing various metabolic response pathways, also known as quorum sensing (O’Toole et al., 2000) which can impact its optical properties based on the secretory biochemicals and the density of cells. Whereas, biofilms are dynamic but represent a stable point in the bacterial lifecycle and contain distributed structures with water pores and channels; and thus, contributing to a much lower density (Wang et al., 2011) across the extracellular polymeric substance (EPS) matrix. Therefore, biofilms are expected to produce less scattering than the denser planktonic form or colonies (Hou et al., 2019); due to the presence of a mixed environment of bacterial aggregates and an EPS matrix with high water content (also known as a highly hydrated gel) (Flemming and Wingender, 2010) in the biofilm. Within this study, these structural differences were measured via RI and AC, where RI and AC provide information about how light is transmitted and scattered, respectively, through a sample. Herein, a decrease in RI of the bacterial colonies compared to its biofilms’ counterparts is observed. Moreover, the measured RI for each species’ biofilms ranged from ~1.33-1.34 which is similar to the RI of water (~1.33), which further confirms that the biofilm matrix contains high water content. Also, the measured RIs of the biofilms in this study, particularly for P. aeruginosa, is comparable to previous work shown by Bakke et al. who reported a mean RI of ~1.35 for P. aeruginosa biofilms (Bakke et al., 2001). The measured RIs for the colonies also correspond well with the reference RI values of bacterial colonies in a prior study (Balaev et al., 2003). However, the presence of water in the planktonic and biofilm stages minimized the capabilities of RI to differentiate across all growth environments and species. Thus, this study show that the optical scattering differences quantified by the AC measurements can more easily distinguish across growth environments and species in comparison to the RI measurements as shown in Figure 6B.
In general, the biofilms exhibit lower AC values compared to the planktonic or colony forms, due to the lower cell density as can be seen in Figure 5. P. aeruginosa displays the lowest AC in both colony and planktonic forms and H. influenzae has highest AC values across all species in both forms. As seen in the Figure 5, compared to all other species’ colonies, H. influenzae produce smaller and more compact colonies which result in more light scattering events than P. aeruginosa bacterial colonies. On the other hand, the 3-days old H. influenzae biofilms show the smallest AC across all species, with the 3-days old P. aeruginosa biofilms generating the highest AC. All biofilms were grown in the nutrient-rich BHI medium that contained proteose peptone and infusions from the calf brain and beef heart which provided carbon, nitrogen, essential growth factors, amino acids, and vitamins for biofilm formation. P. aeruginosa is reported to be one of the greatest biofilm producers (Pericolini et al., 2018) and produces more secretions of a highly diffusible nitrogen-containing compound, known as pyocyanin toxin metabolites (Das et al., 2016), at an early stage (~ within 14 h) of biofilm formation. It has also been reported that pyocyanin promotes eDNA release (Das and Manefield, 2012) in P. aeruginosa biofilms by inducing cell-lysis to bacteria cells mediated by the production of hydrogen peroxide (Allesen-Holm et al., 2006), which enhances the P. aeruginosa biofilm formation. Therefore, the increase in the mean AC for the P. aeruginosa biofilm suggests the presence of these secreted molecules, also confirmed by the RS data, as well as the formation of dense gels of the EPS biofilm matrix, which resulted in more scattering events. Another possible explanation for the dense EPS matrix of P. aeruginosa biofilm can be the increase of cellular cyclic-di-GMP (Guttenplan and Kearns, 2013) levels. This increase causes the reduction of the flagella-assisted swarming motility (Shrout et al., 2006; Guttenplan and Kearns, 2013) during the early stages of biofilm formation by transitioning motile P. aeruginosa to non-motile bacteria in the biofilm state.
The 2D and 3D images of biofilms from each species also provide more information about the change in signal intensities in relation to the spatial distribution of the matrix. The 3D OCT images are constructed by combining multiple cross-sectional 2D OCT images; thus, these images provide better visualization of the complex internal heterogeneous structures such as bacterial cell aggregates, pores, and water channels inside the biofilm, as shown in Supplementary Figure 2. In particular, the obtained images show that the biofilms contain mostly water-filled pores. The pores are noted as relatively dark (low-scattering) regions in the OCT images. It has been theorized, by other research groups, that these channels and pores supply localized nutrients to the growing biofilm (Flemming and Wingender, 2010). Another advantage of OCT imaging is that the AC coefficient maps can characterize the rate of change of OCT signals as a function of depth, which is important given that biofilms have a heterogeneous structure and often grow to thicknesses of hundreds of microns or more. These thicknesses are well beyond the imaging depth of fluorescence and confocal microscopes. The 2D images also show differences in the heterogeneity of the biofilms across species. In particular, S. pneumoniae biofilms show less heterogeneity than the other species, while both M. catarrhalis and H. influenzae show layered biofilms in the bottom layer. On the other hand, the top surface of P. aeruginosa is very distinct from the other species and show pores with water channels and morphological differences. Currently, we are performing texture analysis to identify these variations of OCT images among three growth forms and across species.
In summary, OCT provides visualization of the bacterial species in each environment via 2D and 3D reconstruction. This visualization and complementary optical properties values provide a quantitative metrics for differentiating across growth environment and species. In particular, the mean attenuation coefficients of bacterial colonies, planktonic form, and biofilms allowed for significant differentiation of each species in the three different growth environments and in most cases across species. Overall, a major advantage of OCT is the depth imaging of each species which allow for better understanding of the bacteria grows within its growth environment.
This study has additional considerations that are worth mentioning. First, in terms of sample preparation and growth methodology, it should be noted that bacterial growth largely depends on the growth media and environments such as CO2, temperature, pH, humidity, and substrates. In literature, various culture media, agars, and environmental conditions have been used to grow these bacteria. The experiments in this study followed the standard protocols as mentioned in the Methods section for the optimal growth of bacteria in colonies, planktonic, and biofilm forms. Briefly, nutrient-rich BHI broth and agar were used as culture media for all bacterial species except for H. influenzae. For H. influenzae, BHI media/agar supplemented with hemin and NAD was used. All the samples were incubated at 37 °C, 5% CO2. Also, the initial attachment of planktonic bacteria on the substrate surface is the primary step for growing a bacterial biofilm. Herein, biofilms were grown on calcium fluoride slides (for RS measurements) and poly-d-lysine coated culture dishes (for OCT measurements) for initial adhesion of bacteria and growth of the biofilms. Calcium fluoride was necessary to minimize substrate background noise in the Raman spectra. We know that other growth media and conditions could potentially be used to culture the different species in the various growth forms, which could impact both the biochemical and scattering properties of the cells. Therefore, the media and growth conditions were standardized in this study to minimize the influence of these external factors. Also, planktonic bacteria in BHI media were cultured from the overnight growth of bacteria colonies on BHI agar. The RS and OCT measurements were acquired on dense spun-down pellets obtained from these planktonic bacteria to improve the signal-to-noise of the spectroscopic measurement.
Other factors to consider relate to the methodology used to quantify the RI and AC values, as several methods can be used to calculate these values. Herein, the RI measurement was based on the ratio of the optical thickness and the geometric thickness of the sample from a single OCT B-scan frame as shown in the flow diagram of Figure 7 (Step - 5). The bulk RI of the sample can be effectively measured with our current SDOCT setup, and the sensitivity of RI is ~0.01. For the AC measurements, a depth-resolved single-scattering algorithm was implemented to determine the intensity variations of adjacent voxels and to recover the amount of attenuation that occurs pixel-wise. The algorithm assumes the complete attenuation of light through the sample and the linear relationship between backscattering and attenuation, which overestimates the AC value at the greater imaging depths of the OCT B-scan images. The thicknesses of our samples were comparatively small (~200 µm), allowing for the overestimation error at greater depths to be negligible, but for thick samples, these errors were mitigated by fitting an exponential curve on averaging the last few pixels of the bottom of the sample (OCT B-scan), also known as the optimized depth-resolved estimation (ODRE) algorithm (Liu et al., 2019).
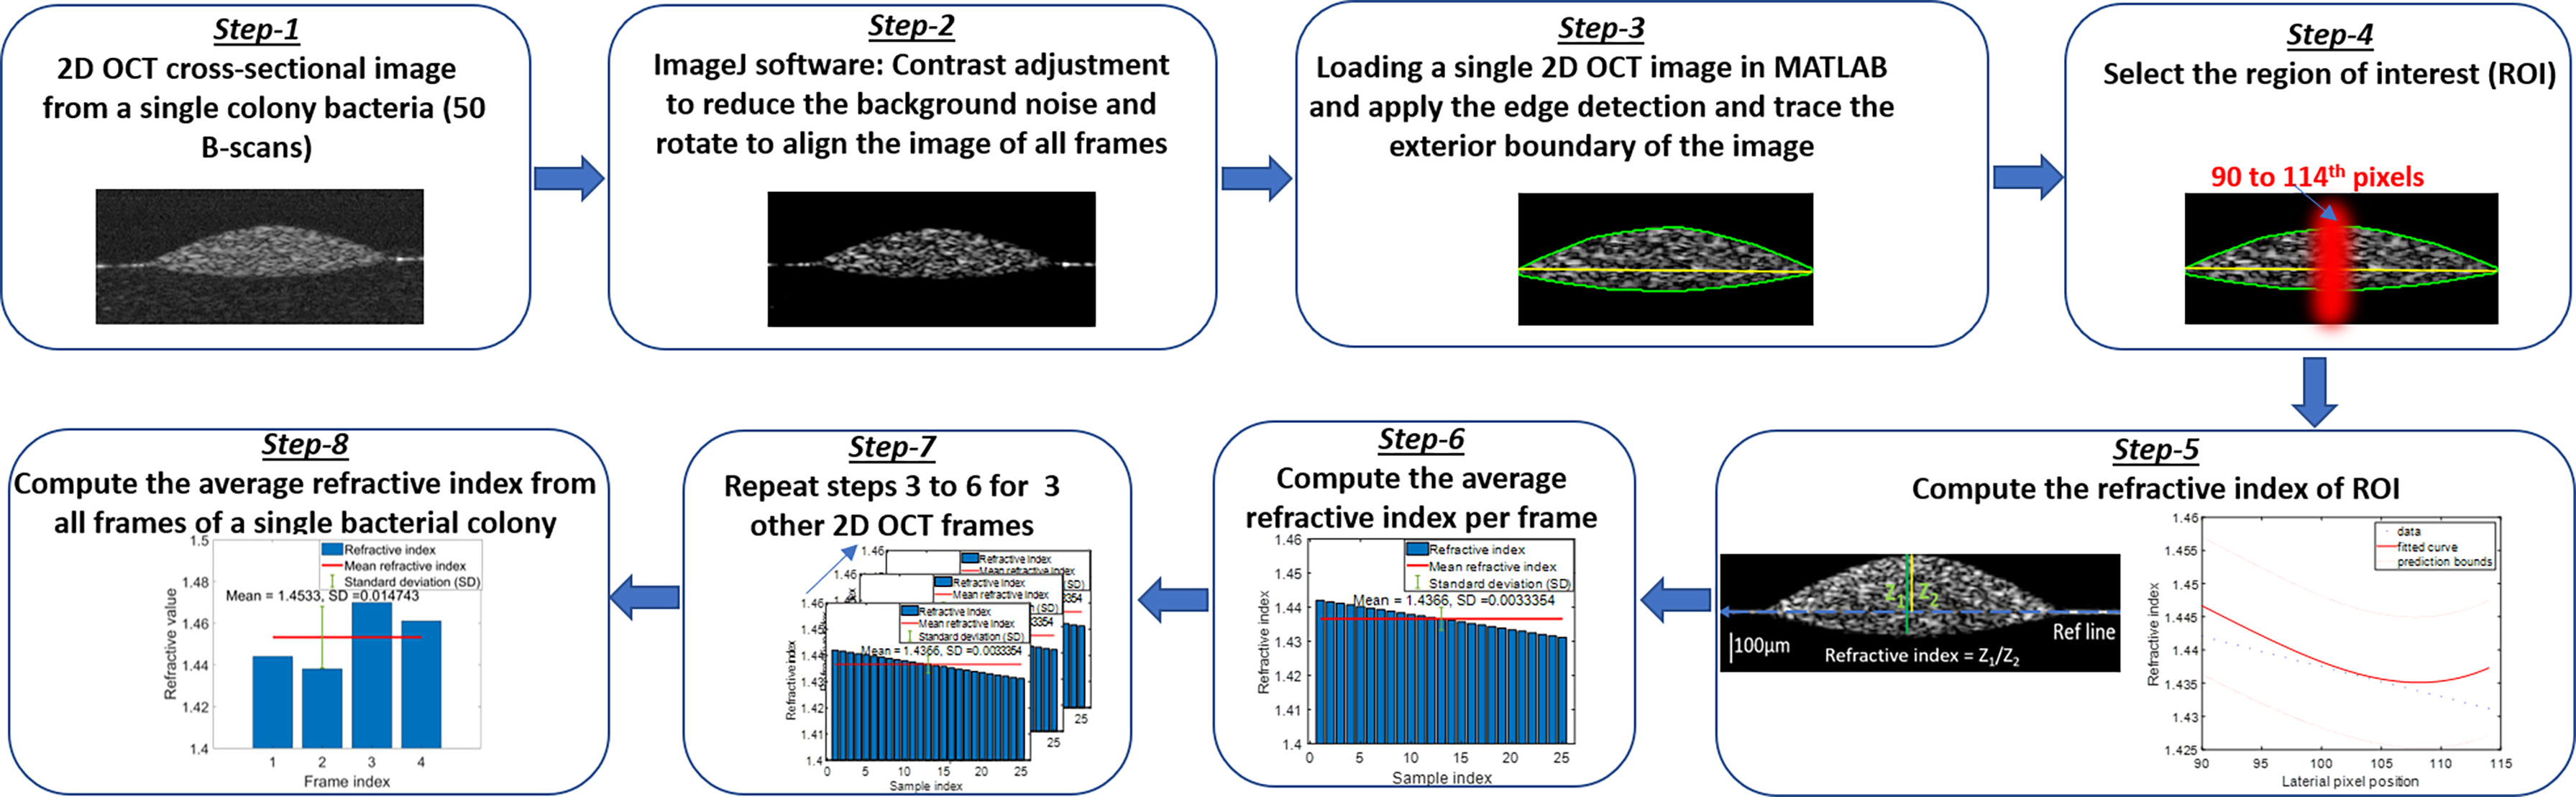
Figure 7 Flow diagram of the refractive index calculation algorithm.
Overall, these results demonstrate the advantages provided by both Raman spectroscopy and OCT to detect and characterize differences in the biochemical composition and scattering properties of the four primary OM-causing bacterial species. Moreover, the ability to differentiate these species in both their planktonic and biofilm forms provide a valuable dual contrast approach, based on the biochemical and morphological differences, in assessing the presence and growth environment of each bacterial species. With the current clinical standards requiring complex secondary tools such as PCR and nucleic acid sequencing for the identification of bacterial species, and the lack of currently-used tools capable of detecting effusions and biofilms, in real-time, a dual RS-OCT approach has the potential to be a useful multi-modal tool for future in vivo detection and assessment of OM. However, translating such technologies for OM diagnosis in vivo requires resolving some physiological constraints and design challenges. For instance, acquiring Raman spectra of effusions or biofilms from directly behind the delicate TM with a fiber optic RS probe is challenging. Therefore, we recently developed a prototype of a multimodal RS-OCT system and successfully tested it in ex vivo ear models (i.e., clinical effusion under chinchilla TM). This provided an understanding of the specific physiological limitations (improved positioning feedback via OCT for RS measurements) and design challenges (i.e. maximum permissible exposure and optical safety limits) for signal collection within the middle ear (Monroy et al., 2022). Currently, we are designing and implementing our 2nd generation RS-OCT for the clinical studies of in vivo effusions and biofilms. With additional study and refinement, the diagnostic capabilities of this combined RS-OCT platform may positively impact in vivo detection and assessment of OM in the future.
Methods
Materials
Nontypeable Haemophilus influenzae (Gram-negative, ATCC 49766), Moraxella catarrhalis (Gram-negative, ATCC 49143), Streptococcus pneumoniae (Gram-positive, ATCC 6301), and Pseudomonas aeruginosa (Gram-negative, ATCC 14203) were all purchased from American Type Culture Collection (ATCC) and stored in glycerol at –80°C. Brain heart infusion (BHI) media was purchased from Fisher Scientific and agar, hemin from bovine ≥ 90%, β-Nicotinamide adenine dinucleotide hydrate (NAD), and paraformaldehyde (PFA) were purchased from Sigma Aldrich. The Filmtracer™ LIVE/DEAD™ Biofilm Viability Kit was obtained from ThermoFisher Scientific. Phosphate buffer saline (1x) was prepared in distilled water and autoclaved.
Bacteria colonies cultured on BHI agar
Propagation methods as recommended by ATCC were used for each planktonic bacterial species in preparing the cultures, which involved streaking of each culture on separate agar plates and incubating those plates at 37°C under 5% CO2. BHI media was used as culturing media for M. catarrhalis, S. pneumoniae and P. aeruginosa. BHI is a nutrient-rich media, and hence, can be used to culture a variety of fastidious microbes. To prepare BHI agar and media solution, 9.25 g BHI media powder was added to separate bottles containing 250 mL distilled (DI) water. In one bottle, 3.75 g of agar was added. Both bottles were autoclaved (250°F) for 30 min. The agar plates were then prepared in a biosafety hood by pouring the BHI media/agar solution into separate Petri dishes. To culture H. influenzae, the agar solution was supplemented with hemin (1 mg/mL) and NAD (10 mg/mL). For H. influenzae biofilm culture, H. influenzae test media (HTM, ThermoScientific Remel) broth supplemented with hemin and NAD was used. The plates were allowed to set overnight and were checked for visual contamination prior to use. Each bacterium was removed from the –80°C freezer and immediately streaked on separate BHI agar plates, in triplicates, with a sterile stick. The streaked plates were incubated overnight at 37°C under 5% CO2 prior to characterization via both RS and OCT methodologies described below.
Liquid cultures in BHI media
Liquid cultures (n = 3 for RS and n = 6 for OCT) for each bacterium were prepared following the overnight growth of bacteria colonies on BHI agar. An inoculation loop was used to remove a single colony from the agar plate, which was then placed into a centrifuge tube with 10 mL BHI media (with NAD + hemin supplemented for H. influenzae). The liquid cultures were then incubated for 24 h at 37°C under 5% CO2. Following incubation, 1 mL of solution was extracted and centrifuged for 5 min at 3.3k rcf. The supernatant was removed and re-suspended in an equal volume of 1x PBS. This washing method was performed twice before the pellet was removed and characterized via RS and OCT.
Biofilm growth over 3 days
Biofilms (n = 3 per bacterium) were then prepared from 1 mL of the liquid cultures prepared above, diluted in fresh BHI media (5 mL) at a 1:6 volumetric ratio. This solution was then incubated (37°C, 5% CO2) for 3 h in order to reach the mid-log phase. This mid-log growth suspension was then further diluted at 1:2500 volumetric ratio with new BHI media. To characterize the biofilms via RS, 2 mL of this diluted solution was transferred to a glass-bottom Petri dish containing a calcium fluoride (CaF2) Raman substrate (Crystran Ltd, United Kingdom). For OCT characterization, 200 µl of the diluted solution was transferred into a poly-d-lysine coated microscope slide (Azer Scientific), and the slide was kept inside a Petri dish. The Petri dishes were then incubated (37°C, 5% CO2) for three days with new BHI media exchanged once per day using a pipette to aspirate the media from the corner of the dish without disrupting the biofilm, and to maintain the bacterial viability in the biofilm. After three days, the media was aspirated, and the calcium fluoride-containing Petri dishes were washed three times with 1x PBS and fixed with 4% PFA followed by a final wash with DI water prior to RS measurements. For the OCT measurements, the excessive media from the biofilms grown on the poly-d-lysine slide surfaces were aspirated, and the slides were washed with DI water. A LIVE/DEAD staining was conducted on separate biofilms to determine bacterial viability within the biofilm (Supplementary Figure 4).
Raman spectroscopy characterization
All RS measurements were conducted on a benchtop inVia™ confocal Raman microscope (Renishaw, United Kingdom). Agar culture colony measurements were taken under 100x objective (NA 0.85) with 24 mW power and an integration time of ~15 sec. For each agar plate, 10 measurements were taken per colony and three colonies per plate. Raman spectra were also taken of the agar plates alone, and it was determined that both agars did not influence the Raman spectra of the bacterial colonies (Supplementary Figure 5). The cell pellets separated from each liquid culture were placed in a stainless steel well to avoid interference from substrate-related Raman bands. Three pellets from three separate cultures were obtained. Raman measurements were then taken under a 50x objective (NA 0.75) with ~ 25-30 mW power for 15 sec. Three biofilms per bacterial species were grown from three separate cultures and measured on CaF2 slides. Raman measurements were acquired from 10 different locations across the biofilm under a 100x objective for 45 sec with ~25 mW power at the objective. All acquired Raman spectra were pre-processed for intensity calibration, fluorescence subtraction, noise-smoothing, and mean normalization in the MATLAB coding environment using protocols previously developed (Lieber and Mahadevan-Jansen, 2003). This included noise filtering using a Savitzky-Golay smoothing filter and fluorescence subtraction using a modified polynomial fitting approach before normalization using standard normal variate. SMLR was then used to identify key differences within the same species across growth environments (i.e., agar, liquid, biofilms) as well as across species comparisons of agar colonies, planktonic form (i.e., pelleted cells from liquid cultures), and biofilms. A sparsity of 1 and k-fold cross-validation of 5 was used to determine the wavenumber variables that contributed more to the sample classification based on their average weights. Also, where not specifically stated, the Raman peaks were interpreted using the well-cited Raman spectroscopy of biological tissue library provided by Talari et al. (Talari et al., 2015).
Optical coherence tomography characterization
A custom-built 1325 nm benchtop spectral-domain OCT system (Supplementary Figure 1) was utilized to capture cross-sectional and 3D images of single colony bacteria on agar, pelleted planktonic bacteria in liquid culture, and biofilm. In brief, the benchtop OCT system utilized a broadband superluminescent diode (Thorlabs, New Jersey) source with a center wavelength of 1325 nm and a bandwidth of 100 nm, which provided an axial resolution of ~8 µm (air). The lateral resolution was ~16 µm in air. A 1024-pixel InGaAs line-scan camera (Goodrich, North Carolina) was used in the spectrometer, delivering an optical imaging depth of ~2.2 mm. The optical power applied to the sample was less than 10 mW. A total of 50 B-scans per volume were acquired from five single colonies of bacteria on each culture plate. Similar OCT measurements were performed on the agar plates alone to validate differences in the optical properties between the colonies and the agar plate (Supplementary Information). Six bacterial pellets were removed from each liquid cultured bacteria and were placed on a microscope slide. From the six pellets, 10 B-scans per volume were acquired per bacterium. To characterize the biofilms, 1000 A-scans per B-mode image and 100 sequential B-mode frames were captured from each biofilm, at three locations, using a pair of galvanometer scanners (Thorlabs, New Jersey).
Refractive index computation algorithm
The RI of biological cells and microorganisms is important for characterizing the interactions between light and biological scatterers in samples. Differences in RI have been used to detect variations of chemical content inside cells and their distribution (Wang et al., 2011), differentiate growth rates of living cells (Zibaii et al., 2010), and distinguish between normal and malignant tissues (Grigorev et al., 2020) by measuring and comparing their RI values. In OCT, a single depth scan (A-scan) represents the depth-dependent intensity profile of the sample along the beam path. The optical thickness of this sample in an A-scan is the product of the group RI (ng) and the geometrical thickness of the sample. The ng depends on the wavelength dependence of the phase RI, np, as: , where λ0 indicates the central wavelength of the light source in the OCT system. Thus, in practice, ng ≈ np, as the derivative term is small and negligible (Tearney et al., 1995). Therefore, we can directly compute the RI by the optical path-length matching method (Tearney et al., 1995), where RI can be extracted by computing the ratio of the optical and geometrical thicknesses of the sample obtained from a cross-sectional OCT image.
To analyze the variations of refractive indices among all bacterial species in a colony, planktonic (in pellet form), and biofilm forms, ImageJ and a MATLAB-based program were used, developed, and applied to compute the average RI from all samples. Figure 7 shows the graphical representation of the flow diagram for the RI computation by optical path-length measurement using OCT on a single bacterial colony (Tearney et al., 1995). The 2D reconstruction of each OCT data set consisted of 1024 × 512 (rows and columns) pixels, processed by MATLAB and saved in tiff format. ImageJ software was used to reduce background noise from the processed 2D OCT images and to generate 3D OCT images. The MATLAB algorithm binarized each input image (2D OCT) employing Canny’s edge detection to look for the local maxima of the gradient of the input image and to trace the exterior boundary of the image. Then, a window size of 25 pixels in the lateral direction was selected around the peak intensity position of each 2D OCT image, followed by the computation of RI by taking the ratio of the optical thickness (z1) and the geometrical thickness (z2) for each individual bacterial colony from a single OCT B-scan frame as illustrated in Figure 7. Next, the average RI per frame was computed, and the same procedure was repeated for all four frames and averaged to obtain the mean refractive index from a single bacterial colony for the desired window size of the 2D OCT image. The same procedure was repeated for multiple single colonies of bacteria on each culture plate, all bacterial pellets, and biofilms to compute the mean refractive index of bacteria species in all three forms.
Attenuation coefficient computation algorithm
Additionally, a depth-resolved pixel-wise single scattering attenuation coefficient algorithm (Vermeer et al., 2014) was applied to each 2D OCT image of bacteria in colony, planktonic, and biofilm forms to compute the mean attenuation coefficient of each image. Attenuation coefficients (AC) indicate the rate of optical signal decay due to absorption and scattering of light by a sample. However, for biological applications, OCT systems typically uses near-infrared wavelengths, and hence, the optical attenuation response of the biological sample is governed largely by scattering rather than absorption.
The single scattering model assumes only a single occurrence of backscattering of photons in weakly scattering samples or superficial layers of a high scattering samples. Figure 8 shows the graphical representation of the flow diagram for the AC algorithm on a single bacterial colony. A MATLAB-based program was used to calculate the average AC from all samples. Attenuation coefficients indicate the rate of optical signal decay due to absorption and scattering of light from the sample. ACs facilitated differentiation among colony, planktonic, and biofilm forms and across most species due to their different optical scattering properties. The attenuation coefficient µ(x) is calculated based on two assumptions: (1) all the light is extinguished within the OCT image depth range, and (2) the backscattered light is a fixed portion of the attenuation coefficient. Assuming a constant intensity over a pixel, the attenuation coefficient µ(x) was estimated from the OCT intensity images (I(x)), divided by the total number of pixels along an A-scan of each 2D OCT image, n = 80-120, and the pixel size Δ in millimeters by:
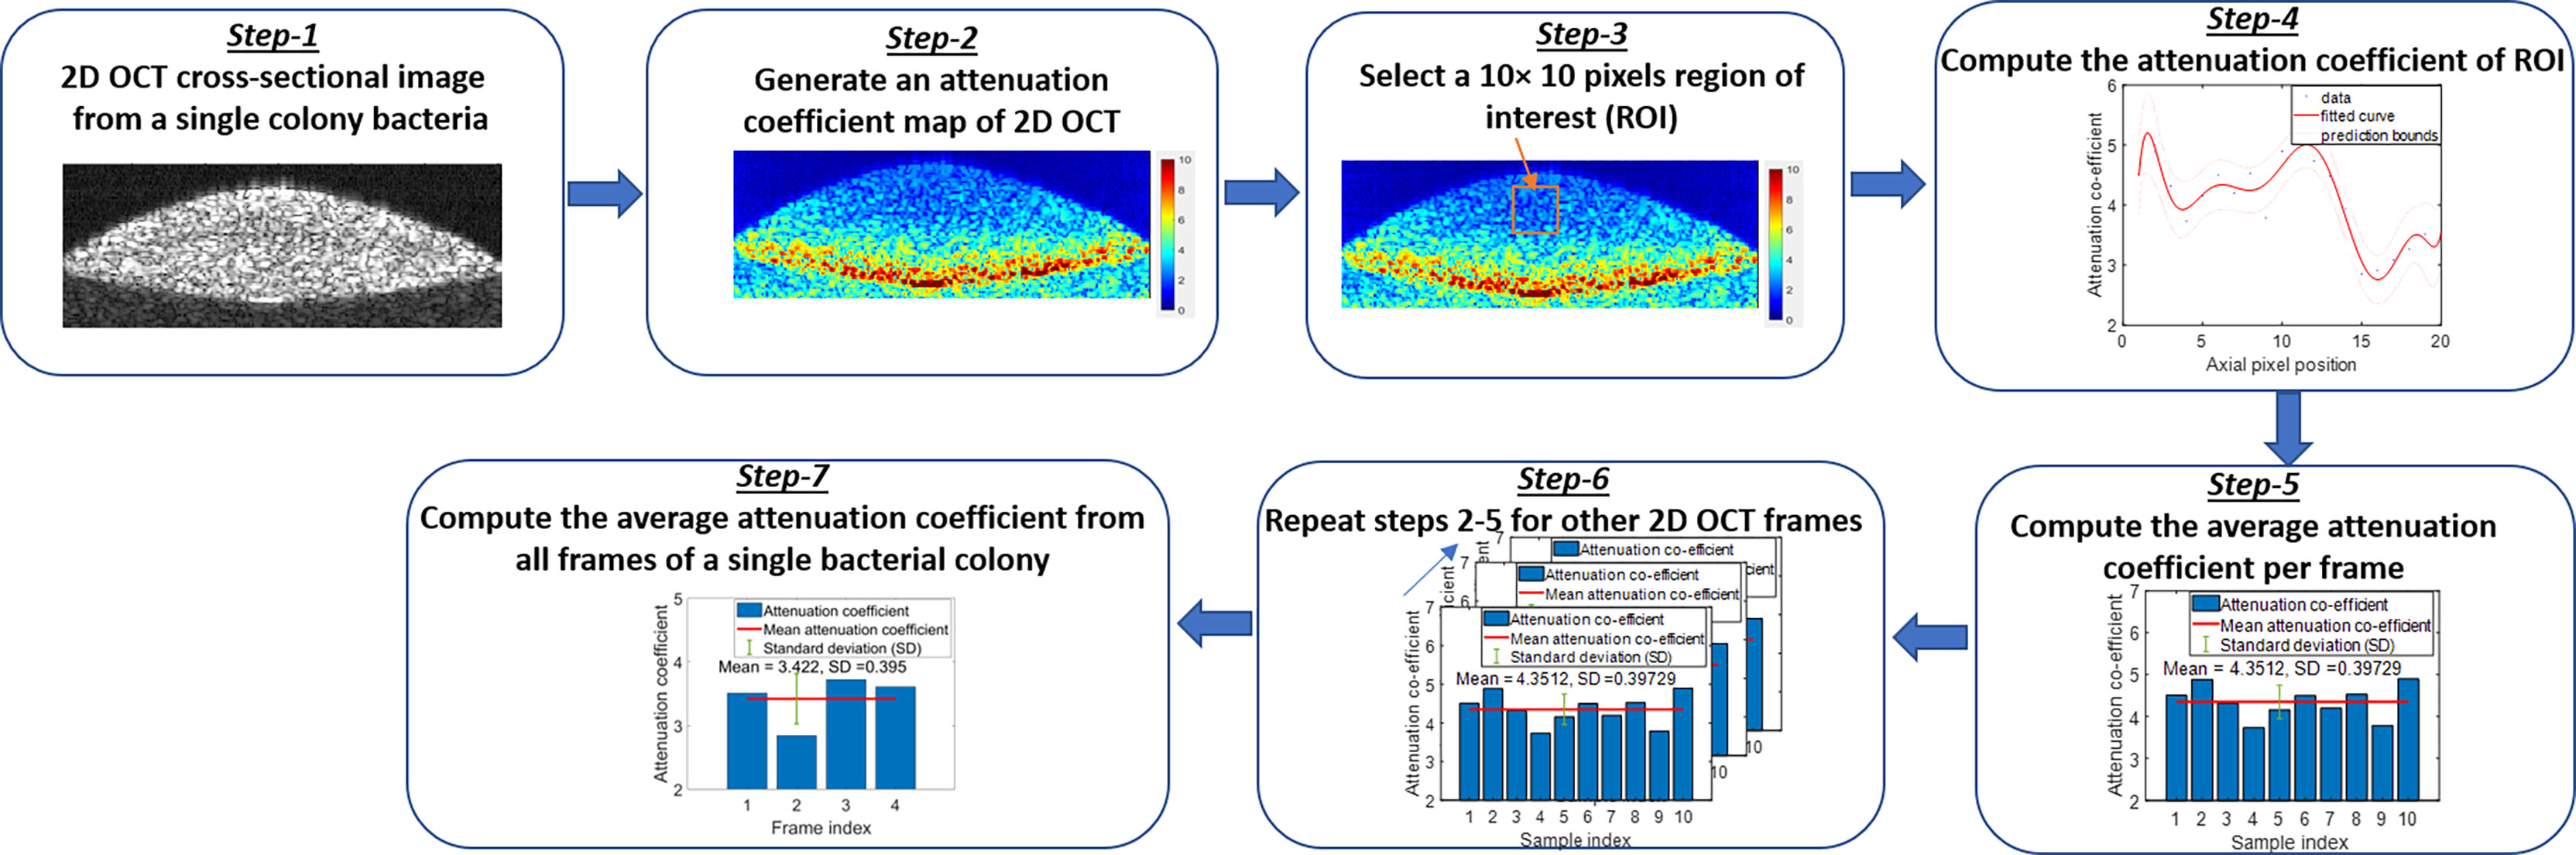
Figure 8 Flow diagram of the attenuation coefficient calculation algorithm.
The MATLAB algorithm generated an AC map for the entire OCT image using equation (1). Then a window size of 10 × 10 pixels was selected to compute the average AC per frame. Next, the same procedure was repeated to all frames and averaged to obtain the mean AC from a single bacterial colony for the desired window size of the 2D OCT image. The same procedure was repeated for multiple single colonies of bacteria on each culture plate, as well as all bacterial pellets and biofilms to compute the mean AC of bacteria species in all three forms.
Statistical analysis of OCT images
The obtained RI and AC results were statistically analyzed by one-way ANOVA and intergroup comparisons. All the statistical analysis was performed using Minitab statistical software (version 19) and MATLAB. Differences were considered as statistically significant at p-value < 0.05. The normality of the data was checked by the Anderson–Darlington test (Öner and Deveci Kocakoç, 2017; Stephens, 2017) (Table S1). Finally, a comparison of the mean values was performed using one-way ANOVA with a post-hoc Tukey’s Honestly Significance Difference (HSD) test.
Data availability statement
The original contributions presented in the study are included in the article/Supplementary Material. Further inquiries can be directed to the corresponding author.
Author contributions
AKL and FRZ were involved in designing, performing, and analyzing the experiments and results, and drafting the manuscript. KS was involved in performing the experiments and analyzing the results. SF was involved in drafting and editing the manuscript. GLM, HC, and JW were involved in editing the manuscript. AM-J. and SAB were involved in designing the experiments, editing the manuscript, and acquiring funding. AKL and FRZ are co-first authors. All authors contributed to the article and approved the submitted version.
Funding
The authors appreciate the support from the National Institutes of Health (NIBIB: R01EB028615).
Acknowledgments
The authors would like to acknowledge support from the Imaging Technology Group and Microscopy Suite of the Beckman Institute for Advanced Science and Technology for generating CLSM images from their confocal laser scanning microscope (CLSM) system (Leica TCS SP8 CLSM, Leica Microsystems Heidelberg GmbH, Manheim, Germany).
Conflict of interest
SAB, GLM and JW have disclosed and patented intellectual property with the University of Illinois Urbana-Champaign related to the optical detection and characterization of OM. AM-J has disclosed and patented intellectual property with Vanderbilt University related to the optical detection and characterization of bacteria. SAB is a co-founder and Chief Medical Officer of PhotoniCare, Inc., which is developing OCT for the detection and diagnosis of OM.
The remaining authors declare that the research was conducted in the absence of any commercial or financial relationships that could be construed as a potential conflict of interest.
Publisher’s note
All claims expressed in this article are solely those of the authors and do not necessarily represent those of their affiliated organizations, or those of the publisher, the editors and the reviewers. Any product that may be evaluated in this article, or claim that may be made by its manufacturer, is not guaranteed or endorsed by the publisher.
Supplementary material
The Supplementary Material for this article can be found online at: https://www.frontiersin.org/articles/10.3389/fcimb.2022.869761/full#supplementary-material
References
Allesen-Holm, M., Barken, K. B., Yang, L., Klausen, M., Webb, J. S., Kjelleberg, S., et al. (2006). A characterization of DNA release in Pseudomonas aeruginosa cultures and biofilms. Mol. Microbiol. 59 (4), 1114–1128. doi: 10.1111/j.1365-2958.2005.05008.x
AlMasoud, N., Muhamadali, H., Chisanga, M., AlRabiah, H., Lima, C. A., Goodacre, R. (2021). Discrimination of bacteria using whole organism fingerprinting: the utlity of modern physicochemical techniques for bacterial typing. Analyst 143 (3), 770–788. doi: 10.1039/D0AN01482F
Ayala, O. D., Wakeman, C. A., Pence, I. J., O’Brien, C. M., Werkhaven, J. A., Skaar, E. P., et al. (2017). Characterization of bacteria causing acute otitis media using raman microspectroscopy. Anal. Methods 9 (12), 1864–1871. doi: 10.1039/c7ay00128b
Bakke, R., Kommedal, R., Kalvenes, S. (2001). Quantification of biofilm accumulation by an optical approach. J. Microbiol. Methods 44 (1), 13–26. doi: 10.1016/S0167-7012(00)00236-0
Balaev, A. E., Dvoretski, K. N., Doubrovski, V. A. (2003). “Determination of refractive index of rod-shaped bacteria from spectral extinction measurements,” in Paper presented at Saratov Fall Meeting 2002: Optical Technologies in Biophysics and Medicine IV (Saratov, Russia: International Society for Optics and Photonics). doi: 10.1117/12.518853
Bodelón, G., Montes-García, V., López-Puente, V., Hill, E. H., Hamon, C., Sanz-Ortiz, M. N., et al. (2016). Detection and imaging of quorum sensing in Pseudomonas aeruginosa biofilm communities by surface-enhanced resonance raman scattering. Nat. Mat. 15 (11), 1203–1211. doi: 10.1038/nmat4720
Center for Disease Control and Prevention (2019) Antibiotic resistance threats in the united state. Available at: https://www.cdc.gov/drugresistance/pdf/threats-report/2019-ar-threats-report-508.pdf (Accessed on October 10, 2021).
Chang, S., Bowden, A. K. (2019). Review of methods and applications of attenuation coefficient measurements with optical coherence tomography. J. Biomed. Optics. 24 (9), 90901. doi: 10.1117/1.JBO.24.9.090901
Chen, Y., Zhou, J., Wang, L. (2021). Role and mechanism of gut microbiota in human disease. Front. Cell. Infect. Microbiol. 11. doi: 10.3389/fcimb.2021.625913
Danishyar, A., Ashurst, J. V. (2017). “Acute otitis media,” in StatPearls (Treasure Island (FL: StatPearls Publishing). Available at: https://www.ncbi.nlm.nih.gov/books/NBK470332/.
Das, T., Ibugo, A. I., Klare, W., Manefield, M. (2016). Role of pyocyanin and extracellular DNA in facilitating Pseudomonas aeruginosa biofilm formation. Microbial. Biofilms-Imp. Appl. 13, 23–42. doi: 10.5772/63497
Das, T., Manefield, M. (2012). Pyocyanin promotes extracellular DNA release in Pseudomonas aeruginosa. PloS One 7 (10), e46718. doi: 10.1371/journal.pone.0046718
Dsouza, R., Won, J., Monroy, G. L., Hill, M. C., Porter, R. G., Novak, M. A., et al. (2018). In vivo detection of nanometer-scale structural changes of the human tympanic membrane in otitis media. Sci. Rep. 8 (1), 8777. doi: 10.1038/s41598-018-26514-1
Fergie, N., Bayston, R., Pearson, J. P., Birchall, J. P. (2004). Is otitis media with effusion a biofilm infection? Clin. Otolaryngol. Allied Sci. 29 (1), 38–46. doi: 10.1111/j.1365-2273.2004.00767.x
Flemming, H.-C., Wingender, J. (2010). The biofilm matrix. Nat. Rev. Microbiol. 8 (9), 623–633. doi: 10.1038/nrmicro2415
Francino, M. (2016). Antibiotics and the human gut microbiome: dysbioses and accumulation of resistances. Front. Microbiol. 6. doi: 10.3389/fmicb.2015.01543
Gerber, J. S., Ross, R. K., Bryan, M., Localio, A. R., Szymczak, J. E., Wasserman, R., et al. (2017). Association of broad- vs narrow-spectrum antibiotics with treatment failure, adverse events, and quality of life in children with acute respiratory tract infections. J. Am. Med. Assoc. 318 (23), 2325–2336. doi: 10.1001/jama.2017.18715
Grigorev, R., Kuzikova, A., Demchenko, P., Senyuk, A., Svechkova, A., Khamid, A., et al. (2020). Investigation of fresh gastric normal and cancer tissues using terahertz time-domain spectroscopy. Materials 13 (1), 85. doi: 10.3390/ma13010085
Guicheteau, J., Argue, L., Hyre, A., Jacobson, M., Christesen, S. D. (2006). “Raman and surface-enhanced raman spectroscopy of amino acids and nucleotide bases for target bacterial vibrational mode identification,” in Defense and Security Symposium 2006: Chemical and Biological Sensing VII (Orlando, Florida: International Society for Optics and Photonics). doi: 10.1117/12.670294
Gu, X., Keyoumu, Y., Long, L., Zhang, H. (2014). Detection of bacterial biofilms in different types of chronic otitis media. Eur. Arch. Oto-Rhino-Laryngol. 271 (11), 2877–2883. doi: 10.1007/s00405-013-2766-8
Guttenplan, S. B., Kearns, D. B. (2013). Regulation of flagellar motility during biofilm formation. FEMS Microbiol. Rev. 37 (6), 849–871. doi: 10.1111/1574-6976.12018
Hall-Stoodley, L., Nistico, L., Sambanthamoorthy, K., Dice, B., Nguyen, D., Mershon, W. J., et al. (2008). Characterization of biofilm matrix, degradation by dnase treatment and evidence of capsule downregulation in Streptococcus pneumoniae clinical isolates. BMC Microbiol. 8 (1), 1–16. doi: 10.1186/1471-2180-8-173
Hall-Stoodley, L., Stoodley, P. (2009). Evolving concepts in biofilm infections. Cell Microbiol. 11 (7), 1034–1043. doi: 10.1111/j.1462-5822.2009.01323.x
He, M., Wu, T., Pan, S., Xu, X. (2014). Antimicrobial mechanism of flavonoids against Escherichia coli ATCC 25922 by model membrane study. Appl. Surf. Sci. 305, 515–521. doi: 10.1016/j.apsusc.2014.03.125
Hoberman, A., Paradise, J. L., Rockette, H. E., Shaikh, N., Wald, E. R., Kearney, D. H., et al. (2011). Treatment of acute otitis media in children under 2 years of age. New Engl. J. Med. 364 (2), 105–115. doi: 10.1056/nejmoa0912254
Holmes, E., Li, J. V., Athanasiou, T., Ashrafian, H., Nicholson, J. K. (2011). Understanding the role of gut microbiome–host metabolic signal disruption in health and disease. Trends Microbiol. 19 (7), 349–359. doi: 10.1016/j.tim.2011.05.006
Hou, J., Wang, C., Rozenbaum, R. T., Gusnaniar, N., de Jong, E. D., Woudstra, W., et al. (2019). Bacterial density and biofilm structure determined by optical coherence tomography. Sci. Rep. 9 (1), 1–12. doi: 10.1038/s41598-019-46196-7
Hussein, H. K. (2016). Isolation and detection of Moraxella catarrhalis from children infected with acute otitis media in Al-kadhemiya pediatric hospital. Al-Kufa. J. Biol. 7 (1), 302–312.
Kaya, E., Dag, I., Incesulu, A., Grubuz, M. K., Acar, M., Birdane, L. (2013). Investigation of the presence of biofilms in chronic suppurative otitis media, nonsuppurative otitis media, and chronic otitis media with cholesteatoma by scanning electron microscopy. Sci. World J. 2013, 638715. doi: 10.1155/2013/638715
Krafft, C., Neudert, L., Simat, T., Salzer, R. (2005). Near infrared raman spectra of human brain lipids. Spectrochim. Acta Part A.: Mol. Biomol. Spectrosc. 61 (7), 1529–1535. doi: 10.1016/j.saa.2004.11.017
Lambert, M. (2016). AAO-HNS releases updated guideline on management of otitis media with effusion. Am. Family Phys. 94 (9), 747–749.
Lieber, C. A., Mahadevan-Jansen, A. (2003). Automated method for subtraction of fluorescence from biological Raman spectra. Appl. Spectrosc. 57 (11), 1363–1367. doi: 10.1366/000370203322554518
Liu, J., Ding, N., Yu, Y., Yuan, X., Luo, S., Luan, J., et al. (2019). Optimized depth-resolved estimation to measure optical attenuation coefficients from optical coherence tomography and its application in cerebral damage determination. J. Biomed. Optics. 24 (3), 35002. doi: 10.1117/1.JBO.24.3.035002
Maquelin, K., Choo-Smith, L. P., van Vreeswijk, T., Endth, H. P., Smith, B., Bennett, R., et al. (2000). Raman spectroscopic method for identification of clinically relevant microorganisms growing on solid culture medium. Anal. Chem. 72 (1), 12–19. doi: 10.1021/ac991011h
Matković, S., Vojvodić, D., Baljosevic, I. (2007). Cytokine levels in groups of patients with different duration of chronic secretory otitis. Eur. Arch. Otorhinolaryngol. 264 (11), 1283–1287. doi: 10.1007/s00405-007-0373-2
Meiers, M., Volz, C., Eisel, J., Maurer, P., Henrich, B., Hakenbeck, R. (2014). Altered lipid composition in Streptococcus pneumoniae cpoA mutants. BMC Microbiol. 14 (1), 1–12. doi: 10.1186/1471-2180-14-12
Monroy, G. L., Fitzgerald, S. T., Locke, A., Won, J., Spillman, D. R., Jr., Ho, A., et al. (2022). Multimodal handheld probe for characterizing otitis media — integrating Raman spectroscopy and optical coherence tomography. Front. Photon. 3. doi: 10.3389/fphot.2022.929574
Monroy, G. L., Shelton, R. L., Nolan, R. M., Nguyen, C. T., Novak, M. A., Hill, M. C., et al. (2015). Noninvasive depth-resolved optical measurements of the tympanic membrane and middle ear for differentiating otitis media. Laryngoscope. 125 (8), E276–E282. doi: 10.1002/lary.25141
Moscoso, M., García, E., López, R. (2006). Biofilm formation by Streptococcus pneumoniae: role of choline, extracellular DNA, and capsular polysaccharide in microbial accretion. J. Bacteriol. 188 (22), 7785–7795. doi: 10.1073/pnas.1201592109
Nguyen, C. T., Jung, W., Kim, J, Chaney, E. J., Novak, M., Stewart, C. N., et al (2012). Noninvasive in vivo optical detection of biofilm in the human middle ear. Proceedings of the National Academy of Sciences 109 (24), 9529–9534. doi: 10.1073/pnas.1201592109
O’Toole, G., Kaplan, H. B., Kolter, R. (2000). Biofilm formation as microbial development. Annu. Rev. Microbiol. 54 (1), 49–79. doi: 10.1146/annurev.micro.54.1.49
Öner, M., Deveci Kocakoç, İ. (2017). JMASM 49: A compilation of some popular goodness of fit tests for normal distribution: Their algorithms and MATLAB codes (MATLAB). J. Mod. Appl. Stat. Methods 16 (2), 547–575. doi: 10.22237/jmasm/1509496200
Palms, D. L., Hicks, L. A., Bartoces, M., Hersh, A. L., Zetts, R., Hyun, D. Y., et al. (2019). First-line antibiotic selection in outpatient settings. Antimicrobial. Agents Chemother. 63 (11), e01060–e01019. doi: 10.1128/AAC.01060-19
Pandey, R., Zhang, C., Kang, J. W., Desai, P. M., Dasari, R. R., Barman, I., et al. (2018). Differential diagnosis of otitis media with effusion using label-free Raman spectroscopy: A pilot study. J. Biophoton. 11 (6), e201700259. doi: 10.1002/jbio.201700259
Pericolini, E., Colombari, B., Ferretti, G., Iseppi, R., Ardizzoni, A., Girardis, M., et al. (2018). Real-time monitoring of Pseudomonas aeruginosa biofilm formation on endotracheal tubes in vitro. BMC Microbiol. 18, 84. doi: 10.1186/s12866-018-1224-6
Post, D. M., Held, J. M., Ketterer, M. R., Phillips, N. J., Sahu, A., Apicella, M. A., et al. (2014). Comparative analyses of proteins from Haemophilus influenzae biofilm and planktonic populations using metabolic labeling and mass spectrometry. BMC Microbiol. 14, 329. doi: 10.1186/s12866-014-0329-9
Sharma, D., Misba, L., Khan, A. U. (2019). Antibiotics versus biofilm: an emerging battleground in microbial communities. Antimicrobial. Res. Infect. Control. 8, 76. doi: 10.1186/s13756-019-0533-3
Shoichi, S., Fumino, O., Taisuke, K. (2019). Comprehensive detection of respiratory bacterial and viral pathogens in the middle ear fluid and nasopharynx of pediatric patients with acute otitis media. Pediatr. Infect. Dis. J. 38 (12), 1199–1203. doi: 10.1097/INF.0000000000002486
Shrout, J. D., Chopp, D. L., Just, C. L., Hentzer, M., Givskov, M., Parsek, M. R. (2006). The impact of quorum sensing and swarming motility on Pseudomonas aeruginosa biofilm formation is nutritionally conditional. Mol. Microbiol. 62 (5), 1264–1277. doi: 10.1111/j.1365-2958.2006.05421.x
Stephens, M. A. (2017). “Tests based on EDF statistics,” in Goodness-of-fit Techniques. Eds. D’Agostino, R. B., Stephens, M. A. (Boca Raton, FL: Routledge), 97–194.
Talari, A. C. S., Movasaghi, Z., Rehman, S., Rehman, I. U. (2015). Raman spectroscopy of biological tissues. Appl. Spectrosc. Rev. 50 (1), 46–111. doi: 10.1080/05704928.2014.923902
Tearney, G. J., Brezinski, M. E., Southern, J. F., Bouma, B. E., Hee, M. R., Fujimoto, J. G. (1995). Determination of the refractive index of highly scattering human tissue by optical coherence tomography. Optics. Lett. 20 (21), 2258–2260. doi: 10.1364/OL.20.002258
Thornton, R. B., Rigby, P. J., Wiertsema, S. P., Filion, P., Langlands, J., Coates, H. L., et al. (2011). Multi-species bacterial biofilm and intracellular infection in otitis media. BMC Pediatr. 11, 94. doi: 10.1186/1471-2431-11-94
Tong, S., Amand, C., Kieffer, A., Kyaw, M. H. (2018). Trends in healthcare utilization and costs associated with acute otitis media in the united states during 2008-2014. BMC Health Serv. Res. 18, 318. doi: 10.1186/s12913-018-3139-1
Turasan, H. (2020). Fabrication of zein-based biodegradable surface enhanced raman spectroscopy biosesnor platforms for the detection of food toxins (West Lafayette (IN: Purdue University).
Vanneste, P., Page, C. (2019). Otitis media with effusion in children: Pathophysiology, diagnosis and treatment. a review. J. Otol. 14 (2), 33–39. doi: 10.1016/j.joto.2019.01.005
Vermeer, K. A., Mo, J., Weda, J. J., Lemij, H. G., de Boer, J. F. (2014). Depth-resolved model-based reconstruction of attenuation coefficients in optical coherence tomography. Biomed. Optics. Exp. 5 (1), 322–337. doi: 10.1364/BOE.5.000322
Wang, Z., Popescu, G., Tangella, K. V., Balla, A., Popescu, G. (2011). Tissue refractive index as marker of disease. J. Biomed. Optics. 16 (11), 116017. doi: 10.1117/1.3656732
Won, J., Hong, W., Khampang, P., Spillman, D. R., Marshall, S., Yan, K., et al. (2021a). Longitudinal optical coherence tomography to visualize the in vivo response of middle ear biofilms to antibiotic therapy. Sci. Rep. 11, 5176. doi: 10.1038/s41598-021-84543-9
Won, J., Porter, R. G., Novak, M. A., Youakim, J., Sum, A., Barkalifa, R., et al. (2021b). In vivo dynamic characterization of the human tympanic membrane using pneumatic optical coherence tomography. J. Biophoton. 14 (4), e202000215. doi: 10.1002/jbio.202000215
Xu, Q., Kaur, R., Casey, J. R., Adlowitz, D. G., Pichichero, M. E., Zeng, M. (2011). Identification of Streptococcus pneumoniae and Haemophilus influenzae in culture-negative middle ear fluids from children with acute otitis media by combination of multiplex PCR and multi-locus sequencing typing. Int. J. Pediatr. Otorhinolaryngol. 75 (2), 239–244. doi: 10.1016/j.ijporl.2010.11.008
Zhao, Y., Monroy, G. L., You, S., Shelton, R. L., Nolan, R. M., Tu, H., et al. (2016). Rapid diagnosis and differentiation of microbial pathogens in otitis media with a combined Raman spectroscopy and low-coherence interferometry probe: toward in vivo implementation. J. Biomed. Optics. 21 (10), 107005. doi: 10.1117/1.JBO.21.10.107005
Zibaii, M. I., Kazemi, A., Latifi, H., Azar, M. K., Hosseini, S. M., Ghezelaiagh, M. H. (2010). Measuring bacterial growth by refractive index tapered fiber optic biosensor. J. Photochem. Photobiol. B.: Biol. 101 (3), 313–320. doi: 10.1016/j.jphotobiol.2010.07.017
Keywords: bacteria, optical coherence tomography, Raman spectroscopy, biofilms, otitis media, biophotonics, optical spectroscopy, bacterial infection
Citation: Locke AK, Zaki FR, Fitzgerald ST, Sudhir K, Monroy GL, Choi H, Won J, Mahadevan-Jansen A and Boppart SA (2022) Differentiation of otitis media-causing bacteria and biofilms via Raman spectroscopy and optical coherence tomography. Front. Cell. Infect. Microbiol. 12:869761. doi: 10.3389/fcimb.2022.869761
Received: 05 February 2022; Accepted: 30 June 2022;
Published: 10 August 2022.
Edited by:
Frédéric Mallard, BioMérieux, FranceReviewed by:
Erin Samantha Gloag, The Ohio State University, United StatesRavinder Kaur, Rochester General Hospital Research Institute (RGHRI), United States
Copyright © 2022 Locke, Zaki, Fitzgerald, Sudhir, Monroy, Choi, Won, Mahadevan-Jansen and Boppart. This is an open-access article distributed under the terms of the Creative Commons Attribution License (CC BY). The use, distribution or reproduction in other forums is permitted, provided the original author(s) and the copyright owner(s) are credited and that the original publication in this journal is cited, in accordance with accepted academic practice. No use, distribution or reproduction is permitted which does not comply with these terms.
*Correspondence: Stephen A. Boppart, boppart@illinois.edu; Anita Mahadevan-Jansen, anita.mahadevan-jansen@vanderbilt.edu
†These authors have contributed equally to this work and share first authorship