Assessing the Reliability of Mobility Interpretation From a Multi-Isotope Hair Profile on a Traveling Individual
 Lihai Hu
 Michelle M. G. Chartrand
  Gilles St-Jean
 Clément P. Bataille
- Department of Earth and Environmental Sciences, University of Ottawa, Ottawa, ON, Canada
Forensic practitioners, archeologists, and ecologists increasingly use hair isotope profiles and isotope databases and maps to reconstruct the life history of unidentified individuals. Relationships between hair isotope profiles with travel history have been primarily investigated through controlled laboratory experiments. However, those controlled studies do not reflect the complex life history of modern individuals who often travel between multiple locations over different periods. Here, we collect one bundle of hairs from a volunteer whose primary residence is in Ottawa (Canada) but who traveled to multiple destinations over a period of 18 months. Those travels include multi-week trips to distant locations and multi-day trips to more local areas. We use multi-isotope profiles on the individual’s hairs coupled with isotope databases across the world to reconstruct travel history at sub-monthly temporal resolution. We compare the isotopic interpretation of mobility with the recorded travel history. A prominent shift in δ2H values is interpreted as a westward movement toward central Canada, which corresponds to a month-long road-trip to the Prairie. We observed a marked negative excursion in δ13C values along the hairs profile, which was related to a multi-week-long trip to several countries in Europe. Except for an exceptionally variable interval likely driven by health issues, δ15N values show very little fluctuation across the entire profile, indicating consumption of consistent amounts of animal or marine-based protein at different locations. The isotopic shifts in the proximal part of the hair reveal a clearer picture of traveling destinations than the shifts in the distal part, which have larger uncertainty in terms of timing and amplitude. Except for the last couple of months before collection, 87Sr/86Sr ratios show little variation throughout the profile likely due to recent exchange with Ottawa tap water during bathing or showering. The different 87Sr/86Sr ratios in the month preceding collection appear to partially preserve the 87Sr/86Sr ratio of the volunteer’s diet. This study demonstrates the interest of using multi-isotope systems and large isotopic databases to reconstruct individual mobility. This study also underlines the challenges in linking isotope data to mobility, particularly in rapidly growing keratinous tissues.
Introduction
The isotopic values of different elements (e.g., hydrogen, oxygen, and strontium) in foods and water vary geographically (Ehleringer et al., 2008; Bowen, 2010; Bataille and Bowen, 2012; Chesson et al., 2012). Such variation can be integrated into human and animal tissues, from which the isotopic values may be used to identify their regions of origin (West et al., 2010; Valenzuela et al., 2011; Hobson et al., 2012; Chesson et al., 2020). Some keratinous tissues, like hair and nail, preserve the regional isotopic values in time sequence, and may thus be used to reconstruct the travel history of individuals (Fraser et al., 2006; O’Brien and Wooller, 2007; Hobson et al., 2010; Remien et al., 2014). With increasingly available isoscapes—“isotope land-scapes” or the maps of the spatial isotopic variation of the material(s) of interest (e.g., West et al., 2010)—for more elements and more regions, studies on the isotopic profiles of multiple elements are getting more attention in forensic sciences, archeology, and ecology (Lehn et al., 2011, 2015a,b, 2019; Thompson et al., 2014; Meier-Augenstein, 2019).
Although there are isotopic fractionations between hair and local water, the hydrogen and oxygen isotope compositions (reported as δ2H and δ18O values, respectively) in hair have largely a linear relationship with local water (Fraser and Meier-Augenstein, 2007). For example, one study found that the δ2H profile in elephant hair had similar patterns with the change of δ2H values of local water (Cerling et al., 2009). Large-scale prediction maps have also been established for the average δ2H and δ18O values in the human hair in the United States based mainly on the geographical distributions of the δ2H and δ18O values of the tap water, respectively (Ehleringer et al., 2008). Therefore, it has been proposed to use hydrogen and oxygen isotope analysis of hair to help forensic human identification (Fraser and Meier-Augenstein, 2007). There have been successful forensic applications where sequential isotopic analysis of hydrogen and oxygen along hair strands provided key information to help solve cold cases (e.g., Ehleringer et al., 2010). The oxygen and hydrogen isotope analyses in animal keratinous tissues have also been very useful to reconstruct the mobility of modern fauna (Rubenstein and Hobson, 2004; Bowen et al., 2005; Wunder, 2012). Similarly, δ2H and δ18O values in hair, skeleton, and tooth enamel were used to identify diet or geographic origins of ancient humans in archeological applications (Sharp et al., 2003; Buzon et al., 2011; Lightfoot and O’Connell, 2016).
The carbon and nitrogen isotope compositions (reported as δ13C and δ15N values, respectively) in hair are primarily related to diet, nutritional status, and metabolic status (Mekota et al., 2006; Petzke et al., 2010). Feeding experiments have shown that dietary change could cause fluctuation of δ13C and δ15N profiles in hair (Cerling et al., 2007; Huelsemann et al., 2009). Despite globalization trends, there are still considerable population-wide isotope differences even between the industrialized regions like Western Europe and the United States due to heterogeneity in the food resources (Valenzuela et al., 2012). Because of the link between diet history and the δ13C and δ15N values in hair, archeological studies have applied the carbon and nitrogen isotope analyses of keratin samples to reveal paleodietary information (e.g., trophic level and C3/C4 food proportion) of ancient fauna and humans (White, 1993; Macko et al., 1999b; Thompson et al., 2005; Hedges and Reynard, 2007; White et al., 2009; Webb et al., 2013; Knudson et al., 2015). However, other studies also showed that, along with dietary habits, δ13C and δ15N profiles in elephant tail hair could be used to show the migration patterns of individual elephants (Cerling et al., 2006). Therefore, δ13C and δ15N values may be useful for the identification of the geographical movements associated with major changes in diet or health that can cause significant isotopic fluctuations.
Strontium isotope analysis is an emerging tool to identify the regions of origin of biological samples in archeology, paleoecology, and forensics (Font et al., 2012; Frei et al., 2015; Vautour et al., 2015; Chau et al., 2017; Chesson et al., 2020). It has the advantage of no detectable isotopic fractionation (of 87Sr/86Sr ratios) during biological processes, comparing to the light elements like carbon and oxygen (Bentley, 2006). Therefore, the 87Sr/86Sr ratios in tissues can be directly compared to the sources to identify the geographic origins as shown in the studies on archeological bone and enamel samples (Bentley, 2006). Studies have demonstrated the potential of using 87Sr/86Sr ratios in keratinous tissues to identify local versus non-local signal for humans (Font et al., 2012; Vautour et al., 2015), to identify migration paths and breeding sites for birds (Font et al., 2007), and to reconstruct travel history of horses (Chau et al., 2017). The 87Sr/86Sr ratios in hair samples may also be used in archeological studies to identify the travel history of buried human remains (Frei et al., 2015, 2017; Lugli et al., 2018). Similarly, the provenance of ancient textiles could be identified using strontium isotope analysis in wool (Frei et al., 2009). Cerling et al. (2018) also demonstrated that 87Sr/86Sr ratios in rhino hair are related to local geological bedrock while the δ13C and δ15N values are good indicators of food sources for black rhinos (Diceros bicornis) in Kenya. However, unlike major elements that can mostly ignore contamination influence in their isotopic profiles in hair, strontium in hair can be easily contaminated, which will alter its 87Sr/86Sr ratios (Hu et al., 2020). The co-existent endogenous and exogenous Sr in hair thus make the 87Sr/86Sr profile in hair complicated to interpret (Chesson et al., 2020).
Despite those promising studies and applications, there is still no universal criterion of using isotopes in hair to determine local versus non-local origin (Reynard et al., 2016). The isotopic variability in hair should also be considered for geolocation and dietary studies. Such limitation calls for more real-world studies on the use of the isotopic values of multiple elements in hair for a better understanding of travel history reconstruction. Here, we measured the isotopic values of multiple elements (H, C, N, and Sr) along hair strands which were collected from an individual with complex travel history. Based on the travel history, we compiled the ranges of expected isotopic variations in hair of the traveled locations from an existing isotopic database and the literature. We then used those data and a single exponential best-fit turnover model to reconstruct the expected isotopic profile for each element. We compared the predicted isotopic profiles with the measured isotopic values of the traveling individual. We conclude on the ability of different isotopic systems to provide information about the travel history of a mobile individual at different temporal scales.
Materials and Methods
Ethics Statement
The research procedure was approved by the Office of Research Ethics and Integrity of the University of Ottawa (Ethics File number: H10-17-10). Specifically, all sampling and analytical methods used were in accordance with relevant guidelines from the Office of Research Ethics and Integrity of the University of Ottawa. Written consents were obtained from all participants in accordance with and maintained under regulations from the Office of Research Ethics and Integrity of the University of Ottawa.
Travel History of the Volunteer
The hair sample was collected from a volunteer in on November 20, 2010. The travel history of the volunteer is shown in Table 1. The volunteer primarily resided in Ottawa, Canada and traveled to several distant locations during the timeframe of this study (May 2009 to November 2010). The four major trips longer than a week were (1) a trip to the Prairie provinces of Canada between June 30 and July 27, 2010; (2) a trip to Europe between May 2 and May 17, 2010; (3) a trip to Cuba between January 29 and February 5, 2010; and (4) a trip to the Eastern provinces of Canada between June 15 and July 24, 2009. Figure 1 shows the regions of four major trips of the individual outside Ontario on a world map.
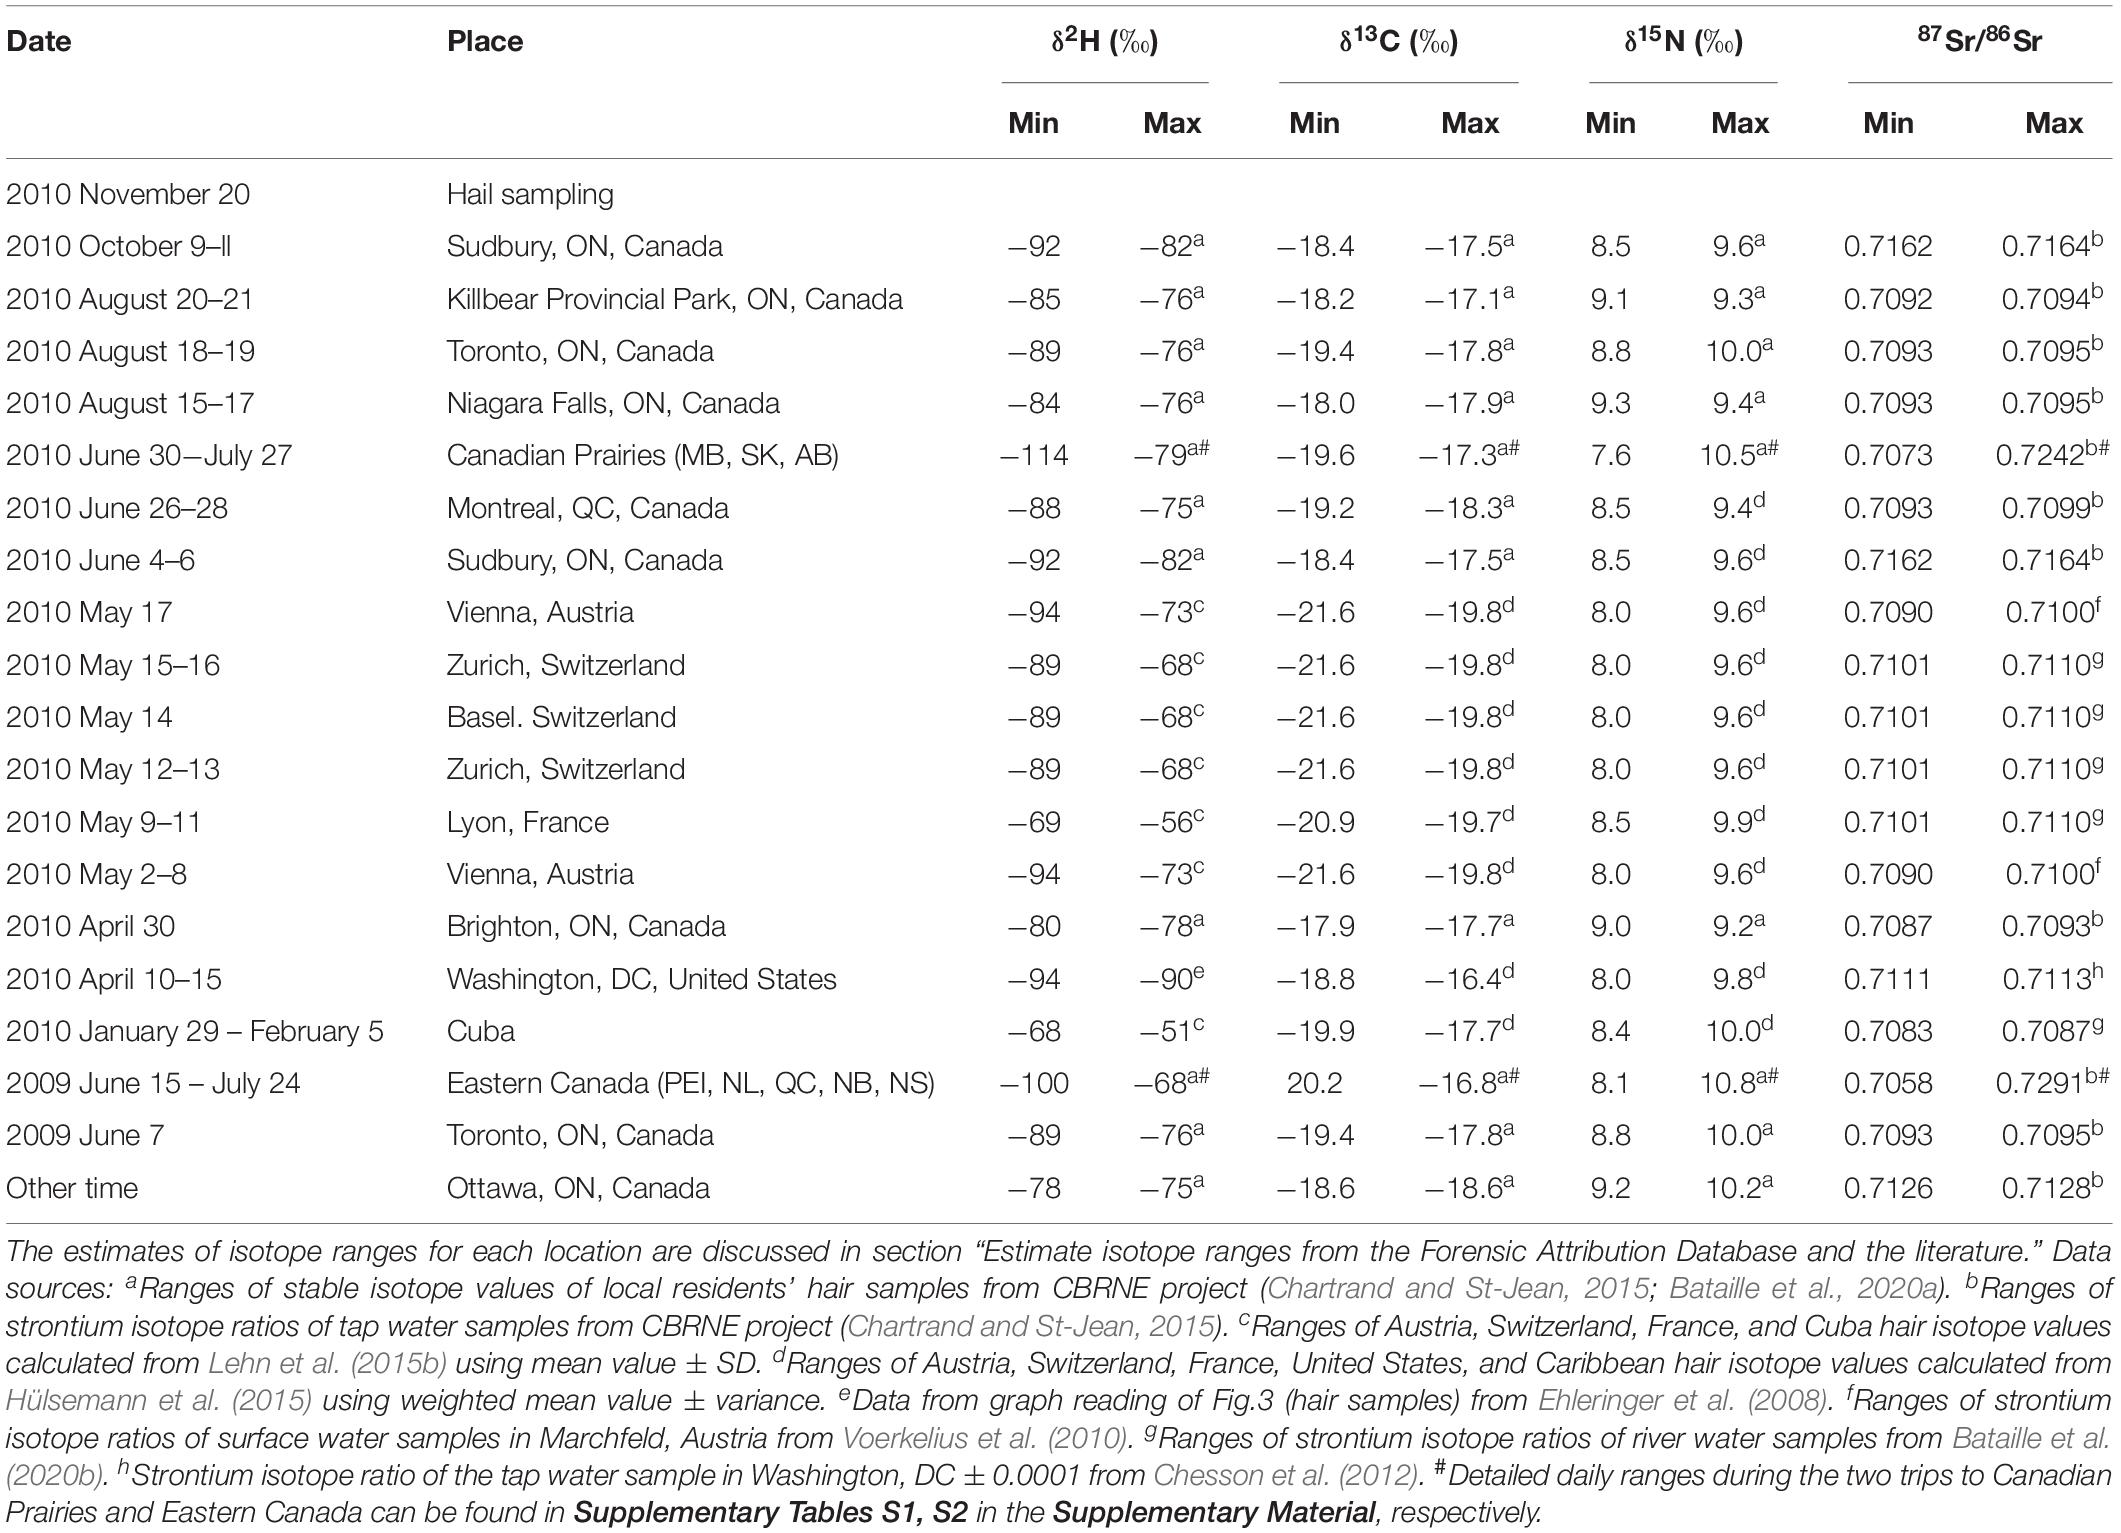
Table 1. Travel history of the volunteer and the isotope ranges for each location and region.
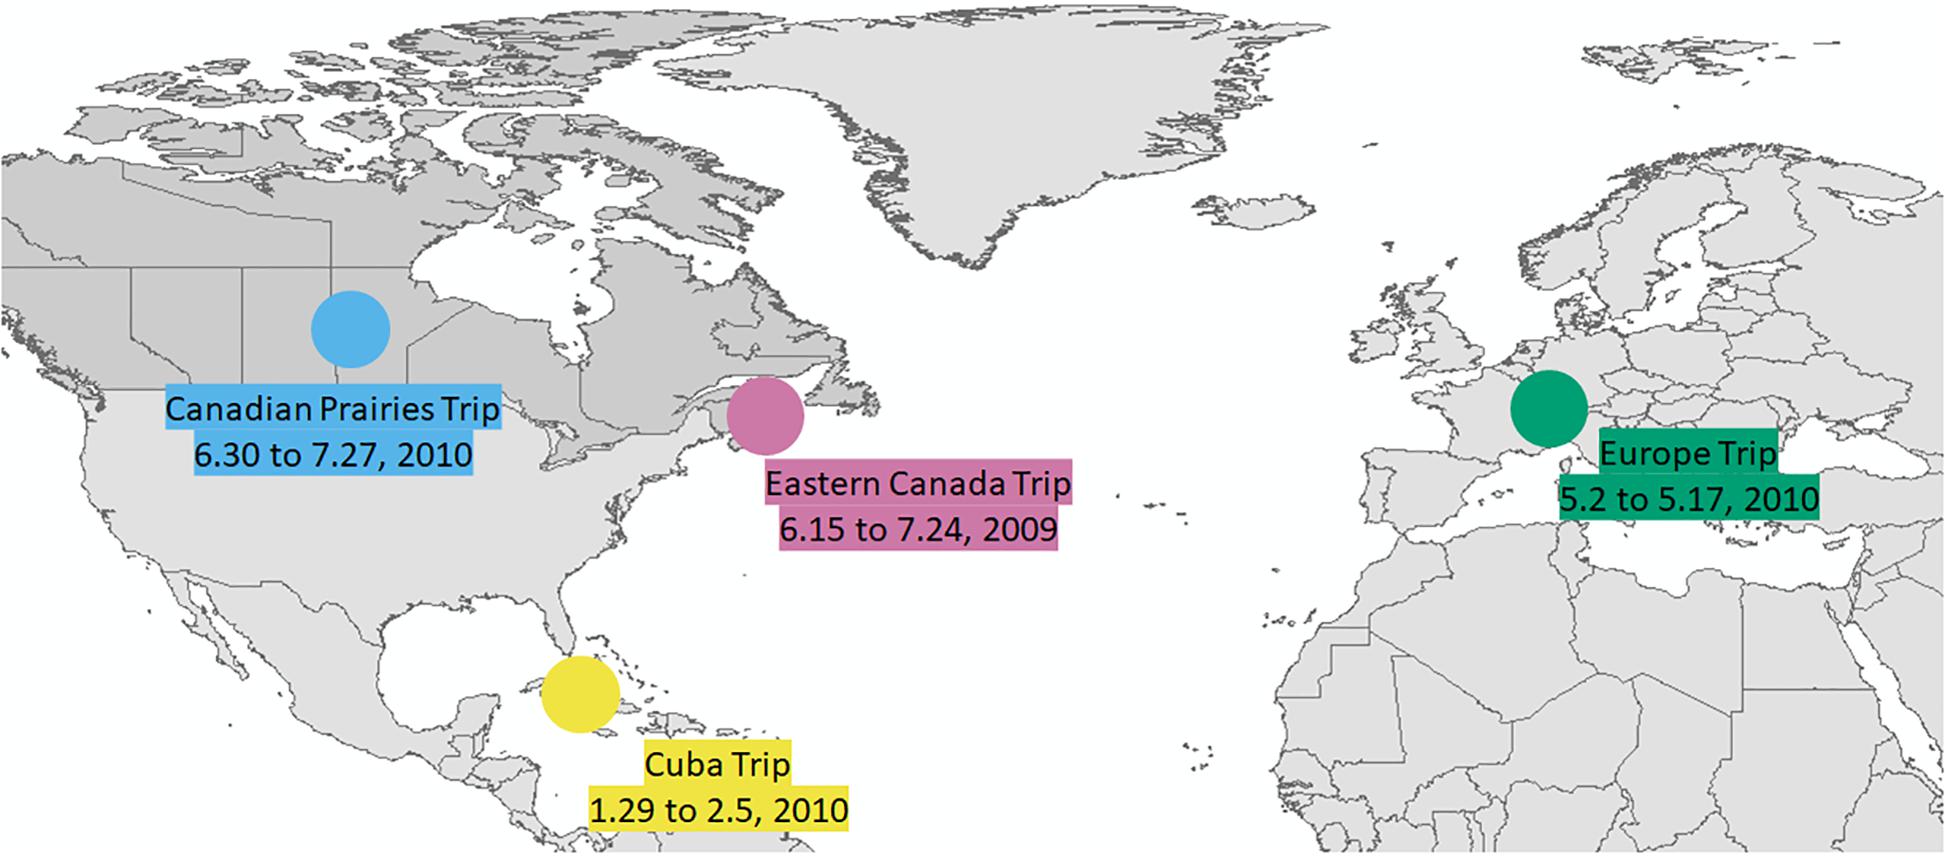
Figure 1. Map showing four major trips.
Hair Preparation
One bundle of approximately 80 hairs was provided by the volunteer to the lab. It was cut with metal scissor near the root of hair on November 20, 2010.
∼50 individual hairs were aligned by the root and were taped on weighing paper. The aligned hairs were cut every half centimeter using an in-house built cutting apparatus. The 0–0.5 cm segment was kept with the adhesive tape that was used to hold the orientation of the hair bundle. But the adhesive tape residue and the trapped dust may contaminate isotope analysis. Thus the 0–0.5 cm segment was not analyzed. 38 samples were obtained from the hair of ∼19.5 cm long. Each hair sample was washed for 15 min with gentle agitation in a 2:1 chloroform/methanol (v/v) solution to remove surface contamination (Font et al., 2012; Tipple et al., 2018). After drying, each sample was analyzed for δ13C, δ15N, and δ2H. An aliquot of each sample was saved for 87Sr/86Sr analysis. Sr abundance was too low for 87Sr/86Sr analysis at half-centimeter resolution. Consequently, we combined at least two 0.5 cm segments into one sample.
Isotopic Analyses of Carbon, Nitrogen, and Hydrogen
For δ13C and δ15N analysis, the hair segment samples and isotope standards (approximately 400 μg each) were weighed into tin capsules and loaded onto an Elemental Analyser (Vario EL III, Elementar, Germany) interfaced with a ConFlo III (Thermo, Germany) to an isotope ratio mass spectrometer (IRMS, DeltaPlus Advantage, Thermo, Germany). One tin capsule was analyzed for each sample. Internal standards used for calibration were a mix of ammonium sulfate and sucrose (δ13CVPDB, −11.94‰; δ15NAIR, 16.58‰), nicotinamide (δ13CVPDB, −22.95‰; δ15NAIR, 0.07‰), and caffeine (δ13CVPDB, −28.53‰; δ15NAIR, −3.98‰). All δ15N and δ13C values are reported versus AIR and V-PDB, respectively. Analytical precision is based on an internal QC sample (glutamic acid, which is not used for normalization) and is usually better than ±0.2‰ for both δ13C and δ15N.
For δ2H analysis, the hair segment samples and isotope standards (approximately 300 μg each) were weighed into silver capsules and loaded onto a Pyrolysis Elemental Analyser with a zero-blank autosampler (TC/EA, Thermo, Germany) interfaced with a ConFlo IV (Thermo, Germany) to an IRMS (DeltaPlus XP, Thermo, Germany). Due to exchangeable hydrogen in the cut hair samples, an exchange experiment was performed on the cut hair segments to determine the “true” δ2H value, following the procedure in Meier-Augenstein et al. (2011). This procedure requires two aliquots of the same hair sample, one equilibrated in isotopically “light” water (δ2HVSMOW, -398‰), and the other in isotopically “heavy” water (δ2HVSMOW, + 15.6 ‰). The segmented hair samples were normalized to two materials with non-exchangeable H: IAEA-CH-7 (δ2HVSMOW, −100.3‰), and an in-house kaolinite (δ2HVSMOW, −58.0‰). Four ground human hair samples were used as QC (Meier-Augenstein et al., 2011): AND (δ2HVSMOW, −71.6‰), COL (δ2HVSMOW, −87.9‰), CAL/CAN (δ2HVSMOW, −106.4‰) and CAL/SAL (δ2HVSMOW, −101.2‰). All reported δ2H values are reported to the international scale VSMOW. Analytical precision for δ2H was ±2.0‰. For all δ2H hair analyses, the production of HCN was not accounted for Gehre et al. (2015).
Isotopic Analysis of Strontium
All samples (approximately 2 mg each) for 87Sr/86Sr analysis were digested in 7 mL cleaned Xpress Teflon vials using a mixture of 200 μL hydrogen peroxide ≥ 30% (for trace analysis Grade; Sigma-Aldrich, Italy) and 3 mL concentrated nitric acid (HNO3) (TraceMetalTM Grade; Fisher Chemical, Canada) for 15 min at 150°C using the CEM MARS 5 Microwave Accelerated Reaction System. After digestion, the solutions were dried on a hot plate at 100°C in a laminar flow fume hood. When there is only a drop left, each vial was removed from the hotplate and the bottom of the vial was observed to check if the liquid was limpid. If there were still white particles, suggesting uncompleted digestion, further digestion was done by adding hydrogen peroxide to digest all the organic residue. If there was no more particle in the final drop of solution, 1 mL concentrated HNO3 was added to each vial and then transferred to a 7 mL Savillex PTFE vial. An aliquot of 50 μL of the solution from each Savillex vial was pipetted to a Labcon MetalFreeTM centrifuge tubes and diluted with 2 mL of 2% v/v HNO3. The diluted solution was then centrifuged for 10 min before Sr concentration analysis. Sr concentration analysis was performed by Inductively Coupled Plasma Mass Spectrometry (ICP-MS) (Agilent 8800 triple quadrupole mass spectrometer) at the Department of Earth and Environmental Sciences, University of Ottawa. Calibration standards were prepared using single element certified standards purchased from SCP Science (Montreal, Canada).
The remaining ∼1 mL aliquot of the sample in the 7 mL Savillex PTFE vial was dried down and re-dissolved in 1 mL 6 M HNO3. The separation of Sr was processed in 100 μL microcolumn loaded with Sr-spec ResinTM (100–150 μm; Eichrom Technologies, LLC). The matrix was rinsed out using 6 M HNO3. The Sr was collected with 0.05 M HNO3. After separation, the eluates were dried and re-dissolved in 200 μL 2% v/v HNO3 for 87Sr/86Sr analysis. The 87Sr/86Sr analysis was performed at the Isotope Geochemistry and Geochronology Research Centre, Carleton University using a Thermo ScientificTM NeptuneTM high-resolution multi-collector inductively coupled plasma mass spectrometer (MC-ICP-MS; Thermo Fisher Scientific, Bremen, Germany). Sample solutions in 2% v/v HNO3 were introduced using a microFAST MC single-loop system (Elemental Scientific). The loading volume was 200 μL and the injecting rate was 30 μL/min. The solution was aspirated using a PFA nebulizer, a double-pass quartz spray chamber, quartz torch, and nickel sample and skimmer cones. Isotopes 82Kr, 83Kr, 84Sr, 85Rb, 86Sr, 87Sr, and 88Sr were simultaneously measured in L4, L3, L2, L1, C, H1, and H2 Faraday cups, respectively. Measurements of samples were made using a static multi-collector routine that consisted of one block of 75 cycles with an integration time of 4.194 s/cycle. 84Sr and 86Sr have isobaric interferences from 84Kr and 86Kr, respectively. 87Sr has an isobaric interference from 87Rb. The interferences of 84Sr and 86Sr were corrected by subtracting the amount of 84Kr and 86Kr corresponding to the 83Kr signal. The interference of 87Sr was corrected by subtracting the amount of 87Rb corresponding to the 85Rb signal. Instrumental mass fractionation was corrected by normalizing 86Sr/88Sr to 0.1194 using the exponential law. Strontium isotope compositions are reported as 87Sr/86Sr ratios. The long-term reproducibility of the 87Sr/86Sr measurement for NIST SRM987 is 0.71025 ± 0.00004 (1 SD, n = 16). A 100 ng/g pure Sr standard was measured along with the sample as the in-house standard (0.70823 ± 0.00005, 1 SD, n = 4). The long-term reproducibility of the in-house standard is (0.70822 ± 0.00004, 1 SD, n = 106).
Estimate Isotope Ranges From the Forensic Attribution Database and the Literature
We compiled the ranges of δ2H values, δ13C values, δ15N values, and 87Sr/86Sr ratios of each location from our database, the Forensic Attribution Database (FAD; Chartrand and St-Jean, 2015; Bataille et al., 2020a), completed by literature data (Table 1). The FAD gathers isotope data in hair from 600 Canadian hair donors and tap water samples collected across Canada (Chartrand and St-Jean, 2015; Bataille et al., 2020a). In this study, we compiled those isotopic ranges from hair samples of the locations (or the nearest locations) visited by our volunteer from May 1, 2009 to Nov 20, 2010.
We estimated the isotopic ranges of H, C, and N in Canadian locations from the hair samples in the FAD. To estimate the isotopic ranges of H, C, and N in the locations visited in Europe, Cuba, and the United States, we used existing compilations of isotope data for hair (Ehleringer et al., 2008; Hülsemann et al., 2015; Lehn et al., 2015b) (Table 1).
For Sr, we have not yet measured the 87Sr/86Sr of the hair samples in the FAD. Data from the literature are also too sparse to characterize the 87Sr/86Sr of the traveled locations either. Therefore, we cannot directly estimate the range of hair 87Sr/86Sr for the studied individual. Theoretically, we could use the 87Sr/86Sr range of local food to estimate the possible 87Sr/86Sr profile, considering more than 90% of Sr in mammal’s body is from food (Lewis et al., 2017). However, because of the complexity of the modern supermarket diet, it is almost impossible to compile the 87Sr/86Sr ranges of local foods from all traveled locations. As previous studies have shown that the hair samples usually have the same 87Sr/86Sr as the local tap water (Tipple et al., 2019; Ammer et al., 2020), we chose the 87Sr/86Sr ratios of the tap water samples in the FAD (Chartrand and St-Jean, 2015) and the river or tap water samples in the literature (Voerkelius et al., 2010; Chesson et al., 2012; Bataille et al., 2020b) to estimate the range of hair 87Sr/86Sr for the studied individual. The assumption behind such estimation, that the 87Sr/86Sr profile in hair followed the 87Sr/86Sr of the local water, is not ideal, but it is the best we can do in this study.
The isotopic ranges compiled in Table 1 are unlikely to cover the entire range of isotopic variability at each of the visited locations but they provided a strong empirical basis to approximate these values.
Isotopic Profile Prediction Based on Travel History
In this study, we know both the travel history of the studied individual and the ranges of the isotopic values of hair samples from local residents at each traveling location (Table 1). We aim to use those data to reconstruct the expected isotopic variations in the hair of the traveling individual. One issue, however, is that the stable isotope signal of the newly grown hair segment does not reflect 100% of the local foods and drinks, because there are different metabolic pools with different turnover rates. For example, Ayliffe et al. (2004) found that, following a dietary change from C3 to C4 food, ∼41% of carbon isotope signal of the horse tail hair was from a pool (probably from the new diet) with a very fast turnover rate (half-life of ∼0.5 days), ∼15% from a pool with an intermediate turnover rate (half-life of ∼4 days), and ∼44% from a pool with very slow turnover rate (half-life of ∼140 days). In our case study, as an individual moves on the landscape, the isotopic composition of the diet is constantly changing, which complicates the reconstruction of the expected isotopic variations in the hair profile.
Several methods can be used to account for isotope turnover in hair. Traditionally, researchers used a single exponential best-fit model to describe isotope turnover in biological tissues (Podlesak et al., 2005). Since fitting data to an exponential function cannot ascertain the possibility of multiple turnover pools, Cerling et al. (2007) introduced the reaction progress model to determine the turnover rate. It has been shown that some elements have multiple turnover pools in the body, and their isotopic profiles in hair can be better reconstructed with a reaction progress model (Cerling et al., 2007; Podlesak et al., 2008). However, constructing a multiple-pool model requires a highly controlled feeding experiment and high-resolution isotopic analysis of hair to calibrate the parameters. As far as we know, there has not been such a feeding experiment on human beings. In this study, we do not have sufficiently accurate dietary and metabolic information to calibrate this type of multiple pool model. In addition, the temporal resolution in this study (∼2 weeks for hydrogen, carbon, nitrogen and ∼4 weeks for strontium) was much less precise than the dietary studies with short sampling interval (∼1 day or less) (e.g., Cerling et al., 2007). Lastly, because we were looking at a bundle of hairs growing at different rates and different phases (LeBeau et al., 2011), it can lead to further noise in the turnover rate modeling, which we cannot address in our model. Therefore, we assume that a single exponential best-fit model is a good-enough first-order approximation to predict isotopic variations in the hair profile. We represented isotope turnover time using the following equation of an exponential decay function (Cerling et al., 2007):
where , , and are the δ-values of element A at the initial time (t = 0), at equilibrium (t = infinity), and at time t, respectively. We calculated the λ value for this equation using existing data from the literature for hydrogen isotopes (Ehleringer et al., 2008) and we obtain a λ value of 0.04 day –1 (half-life of 17.3 days), which was comparable to the first-stage 19 days half-life measured on woodrats (Neotoma cinerea) hair (Podlesak et al., 2008). We use this calibrated λ value for all the isotopic systems used in this study. While it is likely that different elements have different λ values, changing the λ value within a reasonable range has little influence on the general pattern and the interpretation of the isotopic profiles. Please see the sensitivity analysis in the Supplementary Material for more information.
Once calibrated, we used this λ value and the isotope forensic attribution database to reconstruct the isotopic variations in the hair through time. We use the following equation to calculate the expected isotope variations in the hair of the traveling individual at daily resolution:
where δ is the isotopic value of hydrogen (δ2H), carbon (δ13C), or nitrogen (δ15N).
For 87Sr/86Sr ratios, this equation becomes:
where R is the isotopic ratio of strontium, 87Sr/86Sr. As discussed in the last section, we did not have the ranges of hair 87Sr/86Sr in the traveled locations. We predicted the hair 87Sr/86Sr profile using the ranges of 87Sr/86Sr of tap water or river water samples in the traveled locations. The impact of such approach is evaluated in the discussion.
The minimum and maximum of isotopic values for every day is calculated from May 1, 2009 to Nov 20, 2010.
Results
Stable Isotope Compositions Along the Hair Profile
The δ2H, δ13C, and δ15N values of the hair segments are shown in Table 2. The δ2H values in the hair ranged from −85 to −75‰. Except for four hair segments between A8 (Sample ID) and A11, the majority of the segments fall between −80 to −75‰. The δ13C values in the hair ranged from −18.4 to −17.0‰. While most of the δ13C values of the segments from A10 to A38 were relatively stable, the δ13C value of the segment A16 was much lower (−18.4‰) than the rest of the hair. The δ13C values of the segments from A1 to A9 were higher than the rest of the hair. The δ15N values in the hair ranged from 8.8 to 11.9 ‰. The first 13 cm of the hair (from A1 to A26) had a relatively narrow range of δ15N values (9.6–10.1‰) except for the segment A1 (10.5‰), A22 (10.5‰), and A25 (10.4‰), which contained slightly higher δ15N values. The remaining hair (A27–A38) had a much larger variation of δ15N value (Table 2).
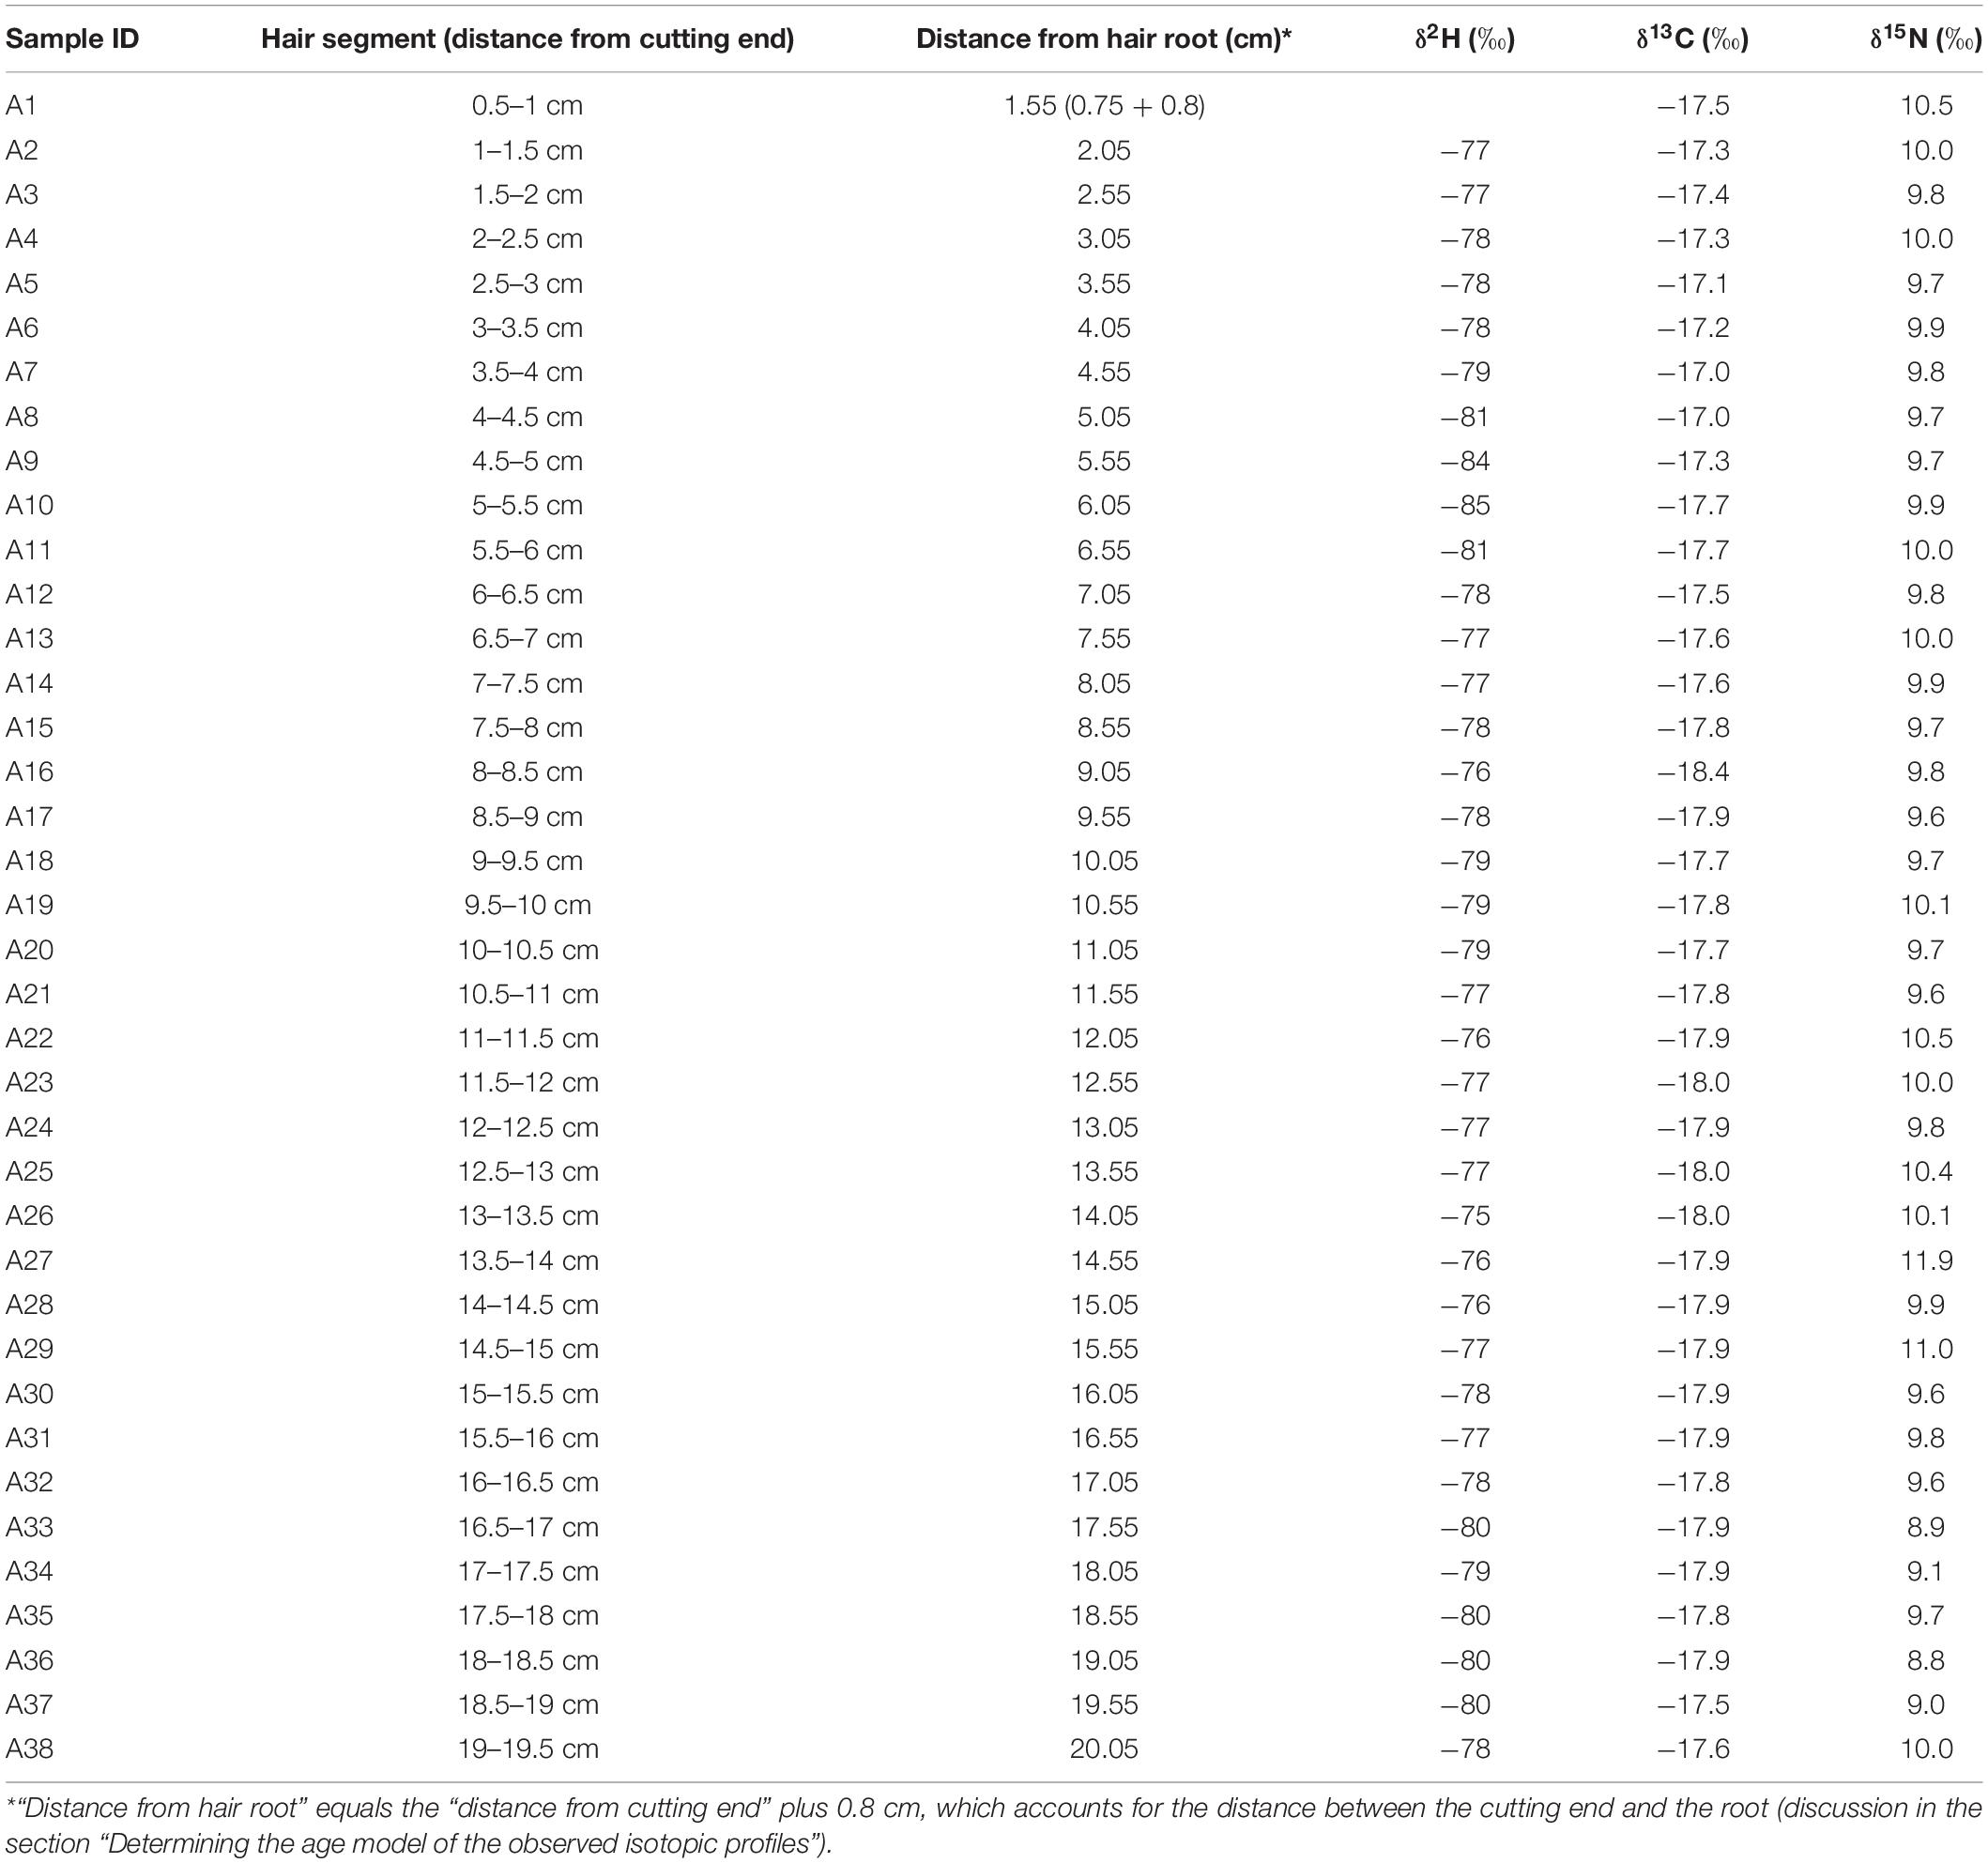
Table 2. Stable isotope values of hair segments.
Strontium Isotope Composition Along the Hair Profile
The Sr concentrations ([Sr]) and isotopic ratios (87Sr/86Sr) of the hair segments are shown in Table 3. The [Sr] increases from the root to the tip of the hair from 1.6 mg/kg to 12.4 mg/kg. The 87Sr/86Sr ratios in the segments range from 0.7110 to 0.7119. The segment B10 was lost during the isotope analysis and is thus not reported. The first two segments (B1 and B2) had lower 87Sr/86Sr ratios than all other segments.
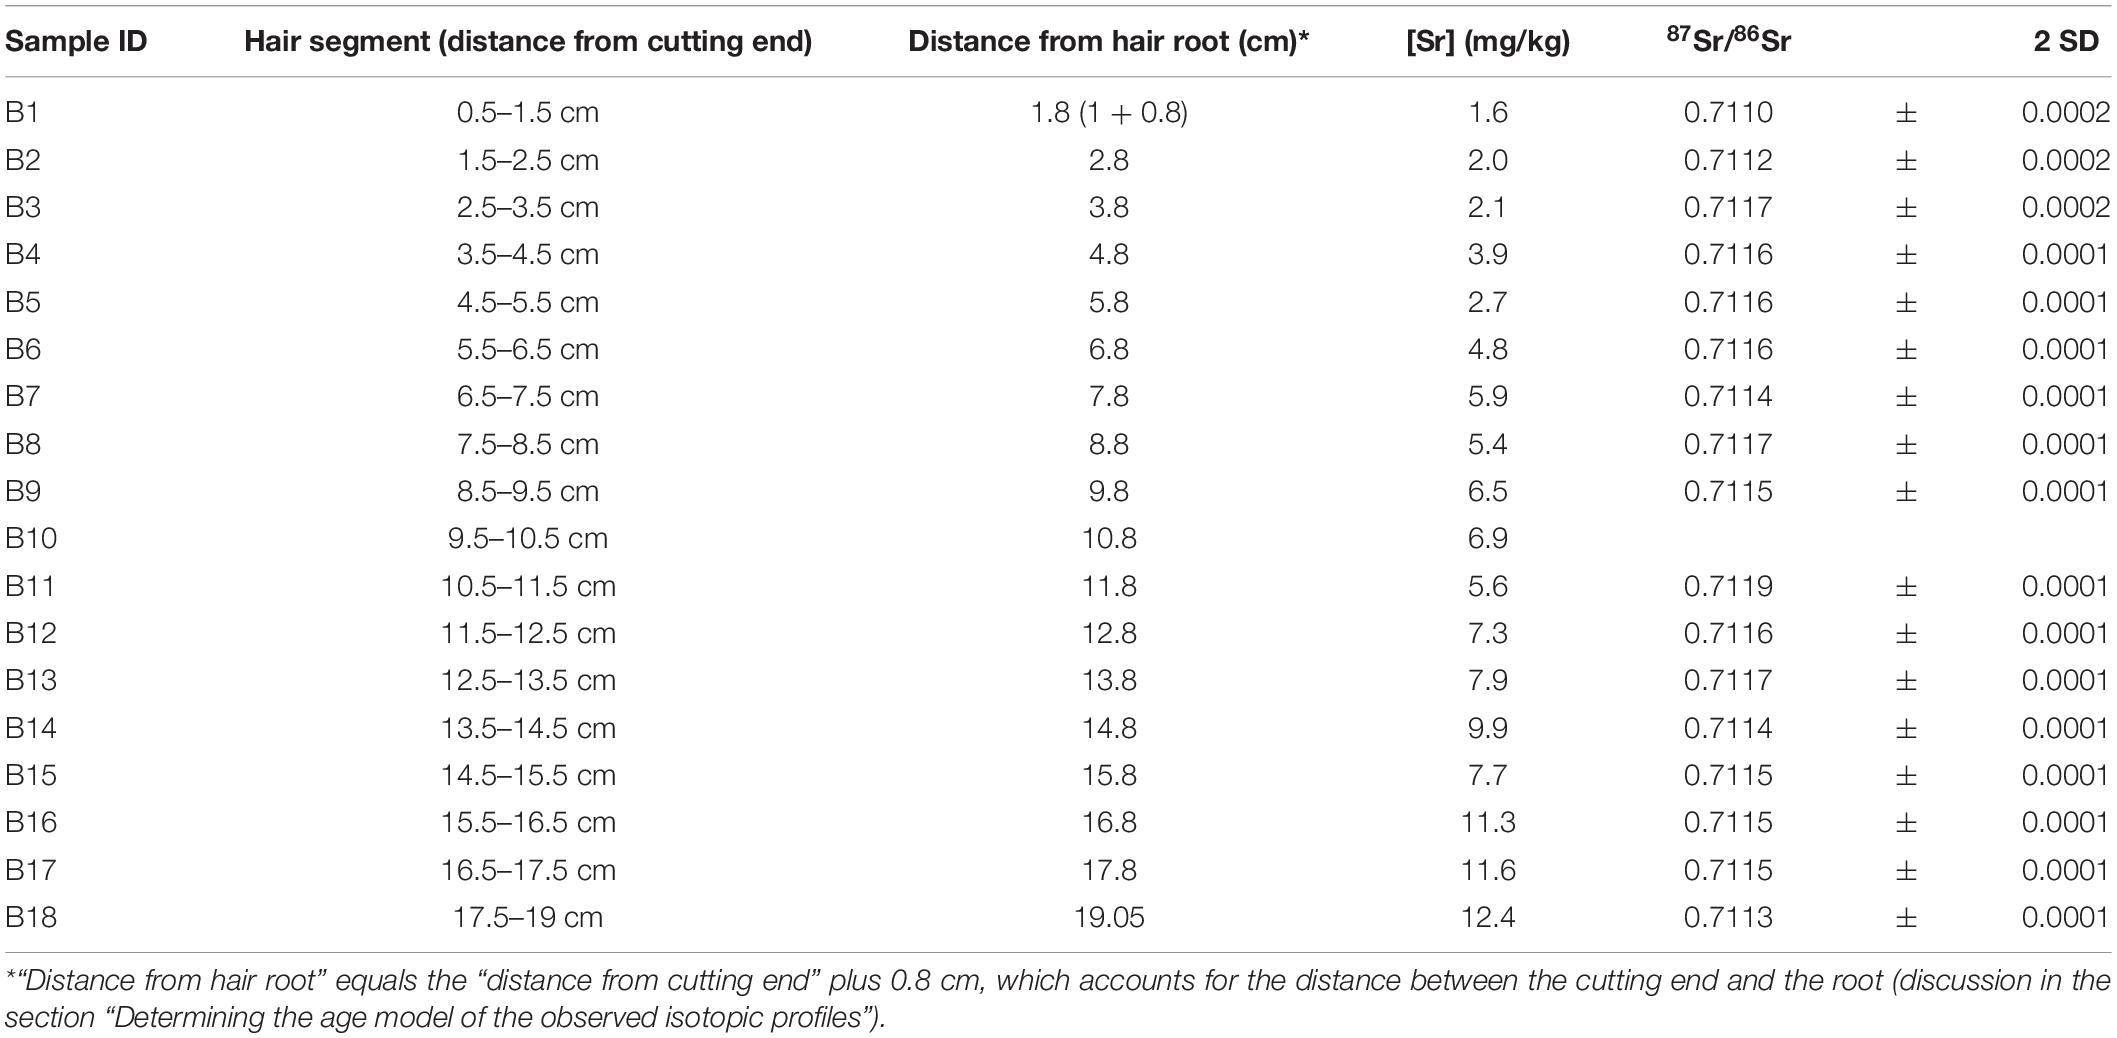
Table 3. [Sr] and 87Sr/86Sr ratios in hair segments.
Determining the Age Model of the Observed Isotopic Profiles
A prerequisite prior to comparing the observed and modeled hair isotopic profiles is to convert hair length into time. Hair growth rate can vary a lot among individuals. The average growth rate of human scalp hair is about 1 cm/month but can range from 0.6 to 2.2 cm/month (Pötsch, 1996). As it is difficult to determine the growth rate of an individual after hair collection, we matched the most prominent δ2H peaks between the observed and predicted hair profiles. We found a growth rate of 1.5 cm per 30 days provided the best fit between observed and predicted peaks for δ2H values but also for δ13C values. However, the growth rate chosen in this study may not be suitable for other studies. We also added 0.8 cm to the distance of the hair segment to the hair root (Tables 2, 3) to make up the ∼0.5 cm of hair remaining at the scalp during cutting (LeBeau et al., 2011; Lehn et al., 2019) and ∼0.3 cm of hair residue left in the hair follicle (Jimenez et al., 2011). The “distance from hair root” is then used for the comparison between the measured and the predicted isotope profiles.
Discussion
Uncertainty of Intra-Individual Hair Growth Rate
In this study, we used a bundle of hair to measure isotopic variations in the hair profile of the volunteer. As mentioned above, we assumed that all hair in the bundle had a constant growth rate of 1.5 cm per 30 days. In reality, scalp hairs of the same individual have different growth rates as well as different growth phases (Hayashi et al., 1991; LeBeau et al., 2011). The isotopic variability measured on multiple hairs will become progressively attenuated due to the mixing of hair segments from slightly different life periods. This issue was underlined by Remien et al. (2014) who compared the isotopic signal measured in a single hair with that of multiple hairs and found that the signal was progressively blurred and difficult to use for provenance applications. Consequently, in our study, the isotopic variations identified close to the base of the hair are likely more representative of the true isotopic variability of the water or diet. Isotopic variations identified in the distal portion of the hair have larger uncertainty in terms of timing and amplitude.
Interestingly, Lehn et al. (2019) have found that the change of isotope signal on bundled hair profile is usually provoked by the fastest-growing hairs in the hair bundle because those fast-growing single hairs tend to be thicker and heavier thus their isotopic signals outweigh the others. Considering a commonly used mean hair growth rate of 1.1 cm/month and a proposed ± 30% intra-individual variability in single hair growth rate, they found that the growth rate of 1.4 cm per 30 days may be the best approach to calculate the exact dates of the isotopic shifts along the hair profile. Therefore, although our chosen value of 1.5 cm per 30 days is the best estimate for the hair growth rate that was used to interpret the isotope profiles, it is likely to represent the fastest growth rate, instead of the average hair growth rate, of the studied individual. Lehn et al. (2019) included the uncertainty of intra-individual hair growth rate in their calculation for the expected δ13C values along the hair strands. In this study, we calculate the predicted isotope values using a fixed growth rate and discuss the impact of the uncertainty of growth rate on our results in the following section.
Comparing the Predicted Isotopic Profile and the Measured Isotopic Values of Hydrogen
The majority of the measured δ2H values in the hair profile of the individual falls within a tight range between −75 and −78‰ (Figure 2). Those values are within the range of observed δ2H values for human hair in the Ottawa region (Table 1). This relatively constant isotopic composition is found during periods when the volunteer was residing in the Ottawa region. This limited variability demonstrates that in the absence of large movements the δ2H values remain relatively stable and are within the expected range from the city.
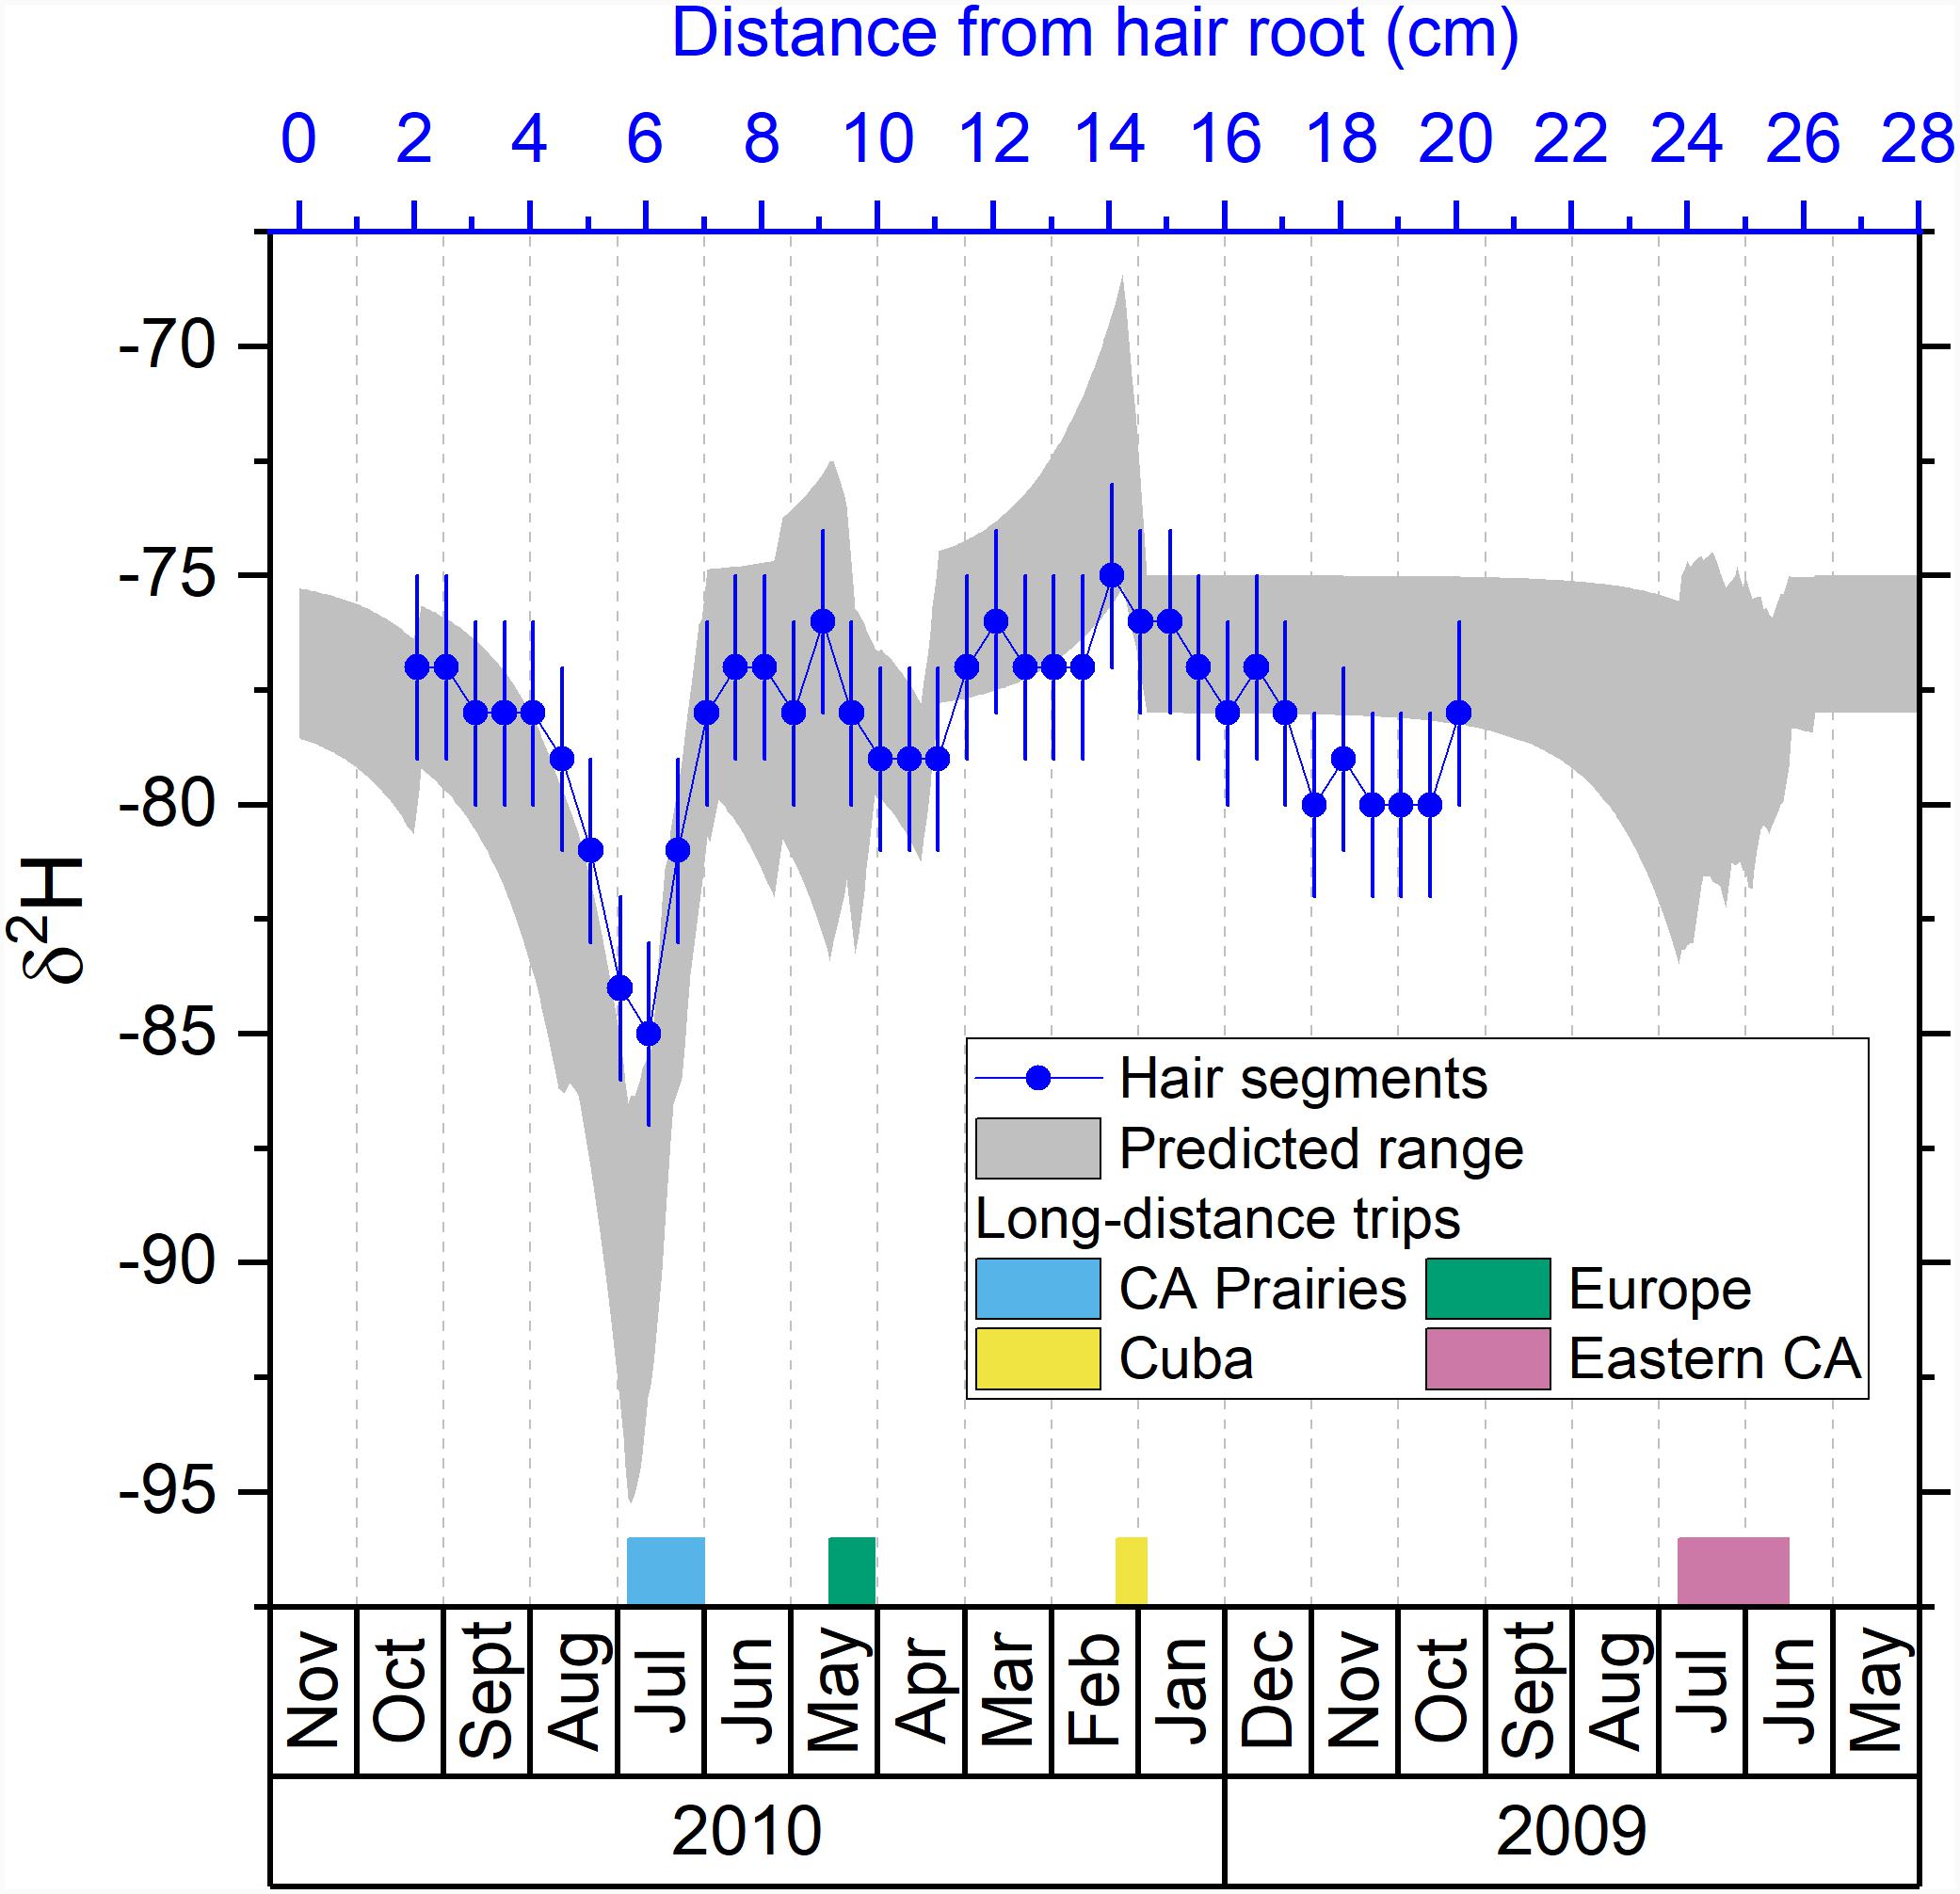
Figure 2. Comparison between the predicted isotopic profile and the measured isotopic values in hair segments for hydrogen. Blue dots are the measured δ2H values in hair segments versus their distances from the hair root (top axis). The shaded area is the predicted range of δ2H values in hair versus the date (bottom axis). The periods of the four major trips are marked with colored bars next to the bottom axis.
We observed a major shift in δ2H values between July and September 2010 (Figure 2). This shift matches well with the predicted isotopic variations and corresponds to the 4 weeks long road trip to the Prairie provinces (Manitoba, Saskatchewan, and Alberta). The Prairie provinces are located inland in comparison with Ottawa, and tap waters in those regions have much lower δ2H values (Bowen, 2010). As the δ2H value in hair mostly (∼80%) reflects the food (Topalov et al., 2019), the remarkably low δ2H value (as low as −114‰) in the hair of Prairie residents (Table 1) indicates a distinctly low δ2H signal in the local diet. As the volunteer ate local food and drank local water this isotopic difference is transmitted to the hair. We notice that the amplitude of the observed δ2H shift is slightly attenuated in comparison with the predicted values (Figure 2) which likely reflects signal attenuation associated with combining multiple strands of hair.
The volunteer also traveled to central Europe in May 2010 for 17 days and this trip is reflected in the measured isotopic profile. The volunteer traveled to Washington, DC for 6 days during mid-April 2010. Because of the distinct low δ2H values in Washington, DC (−94 to −90‰) compared to Ottawa (Table 1), a sharp negative shift of δ2H value is shown in the predicted profile. A similar negative shift of δ2H is shown in the measured profile near 11–12 cm from the hair root (Figure 2), which is about 2 weeks earlier than the April shift in the predicted profile. As mentioned above, signals of the hair bundle distant from the hair root will be attenuated, and their timing will be more uncertain due to the differential growth rate of hair (Hayashi et al., 1991; LeBeau et al., 2011; Remien et al., 2014).
The volunteer traveled to Cuba for 7 days in January and February 2010. This trip is associated with a prominent positive shift in δ2H values in the predicted profile but only a small increase in the observed profile (Figure 2). The amplitude of the measured isotopic signal is attenuated in comparison with the predicted values. However, the increase of the lower limit of the predicted δ2H profile during the Cuba trip was not as prominent as its upper limit, allowing the possibility of a small increase of the observed δ2H values in hair. We note that signals found in bundle hair > 10 cm can still provide some indication of travel.
During summer 2009, the volunteer traveled to the Eastern provinces (New Brunswick, Newfoundland and Labrador, Nova Scotia, Prince Edward Island, and Quebec) for about 40 days. The Eastern provinces have lower δ2H values than Ottawa as reflected by the predicted δ2H values. The measured δ2H values progressively decrease toward the Eastern isotopic values. However, such decrease is longer and does not match well with the timing of travel as shown in the predicted profile (Figure 2). This signal in distal part of hair has a high uncertainty in terms of timing (Lehn et al., 2019) and thus is probably highly attenuated by the isotopic signal from Ottawa.
As the turnover rate was calculated based on the measured δ2H values in hair from Ehleringer et al. (2008), the pattern matching of δ2H profiles seems to be the best among all four isotopic systems in this study. The trip to the Prairie provinces significantly decreased the δ2H values by about 10 ‰, which is shown in both measured and predicted profiles (Figure 2). The increase around January and February 2010 during Cuba trip and the decrease around March and April in 2010 during the Washington DC trip are also shown in both profiles. This suggests that hydrogen isotope analysis of hair may be helpful to reconstruct the travel history of highly mobile individuals for forensic applications of modern fauna and human, when the traveled locations have distinct δ2H values (Ehleringer et al., 2008; Mant et al., 2016).
When using a hair bundle, quantitative geolocation is possible for an isotopic signal located close to the base of the hair (<10 cm). For isotopic signal located in a more distal portion of the hair, we suggest that only qualitative interpretation of travel can be provided as the timing and attenuation become significant issues. As the forward hair bundle model in Remien et al. (2014) shows and the isotope data along human hair strands in Lehn et al. (2019) show, the uncertainty of timing in the distal portion of hair can be ±2 months or more. Keratinous tissues can be preserved for thousands of years, however, using δ2H values in archeological samples requires additional caution as δ2H values may be altered by exchanging hydrogen with the depositional environment (e.g., Saul, 2017; Kootker et al., 2020).
Comparing the Predicted Isotopic Profile and the Measured Isotopic Values of Carbon
The majority of the measured δ13C values in the hair profile of the individual falls within a tight range between −18 to −17.5‰, except for the segment A16 and the segments A2–A9 (Table 2). Interestingly, none of the measured δ13C values falls inside the predicted profile, although the measured and predicted profiles share very similar patterns (Figure 3). There is a relatively constant 1.5‰ offset between the measured and predicted δ13C profiles. For example, during the time of October to December 2009 when the volunteer stayed at Ottawa, the measured δ13C was around −17.9‰ compared with the Ottawa local range of −18.9 to −18.6‰ (Table 1). Such offset demonstrates the existence of individual variability of hair δ13C values from the local ranges, which may be caused by personal dietary preference (Hobson and Clark, 1992; Mekota et al., 2006; Petzke et al., 2010). The high δ13C values in the hair of this study may indicate a higher intake of animal or marine-based protein in the diet. Such discrepancy between measured and predicted individual value suggests that the absolute δ13C values in hair are unreliable to identify local versus non-local samples because δ13C values in hair can be largely influenced by individual preferences of certain foods or special diets. However, the strong correspondence between the measured and predicted profiles also suggest that δ13C values are useful to assess mobility. For example, the large, negative excursion in δ13C values in the predicted profile associated with the trip to Europe in May 2010 matches well with the negative shift of the measured profile in the hair segment A16 (Table 2 and Figure 3). The difference in δ13C values in food consumed in Europe and North America is well-established (Valenzuela et al., 2012; Hülsemann et al., 2015). Foods in North America, including livestock, tend to have much higher δ13C values than those of Europe because of the higher proportion of C4 plant such as corn or cane sugar (with higher δ13C value) within food systems. In Europe, livestock are primarily fed with C3 plants (with lower δ13C value) and the lower δ13C baseline of food system propagate within the population (Valenzuela et al., 2012; Hülsemann et al., 2015). Movement from the US to Europe usually leads to a significant decrease of δ13C value in hair (McCullagh et al., 2005). Therefore, the negative shifts of δ13C value in both the measured and the predicted profile of the volunteer correspond to a change in the isotopic baseline values in food consumed during the trip to Europe in May 2010.
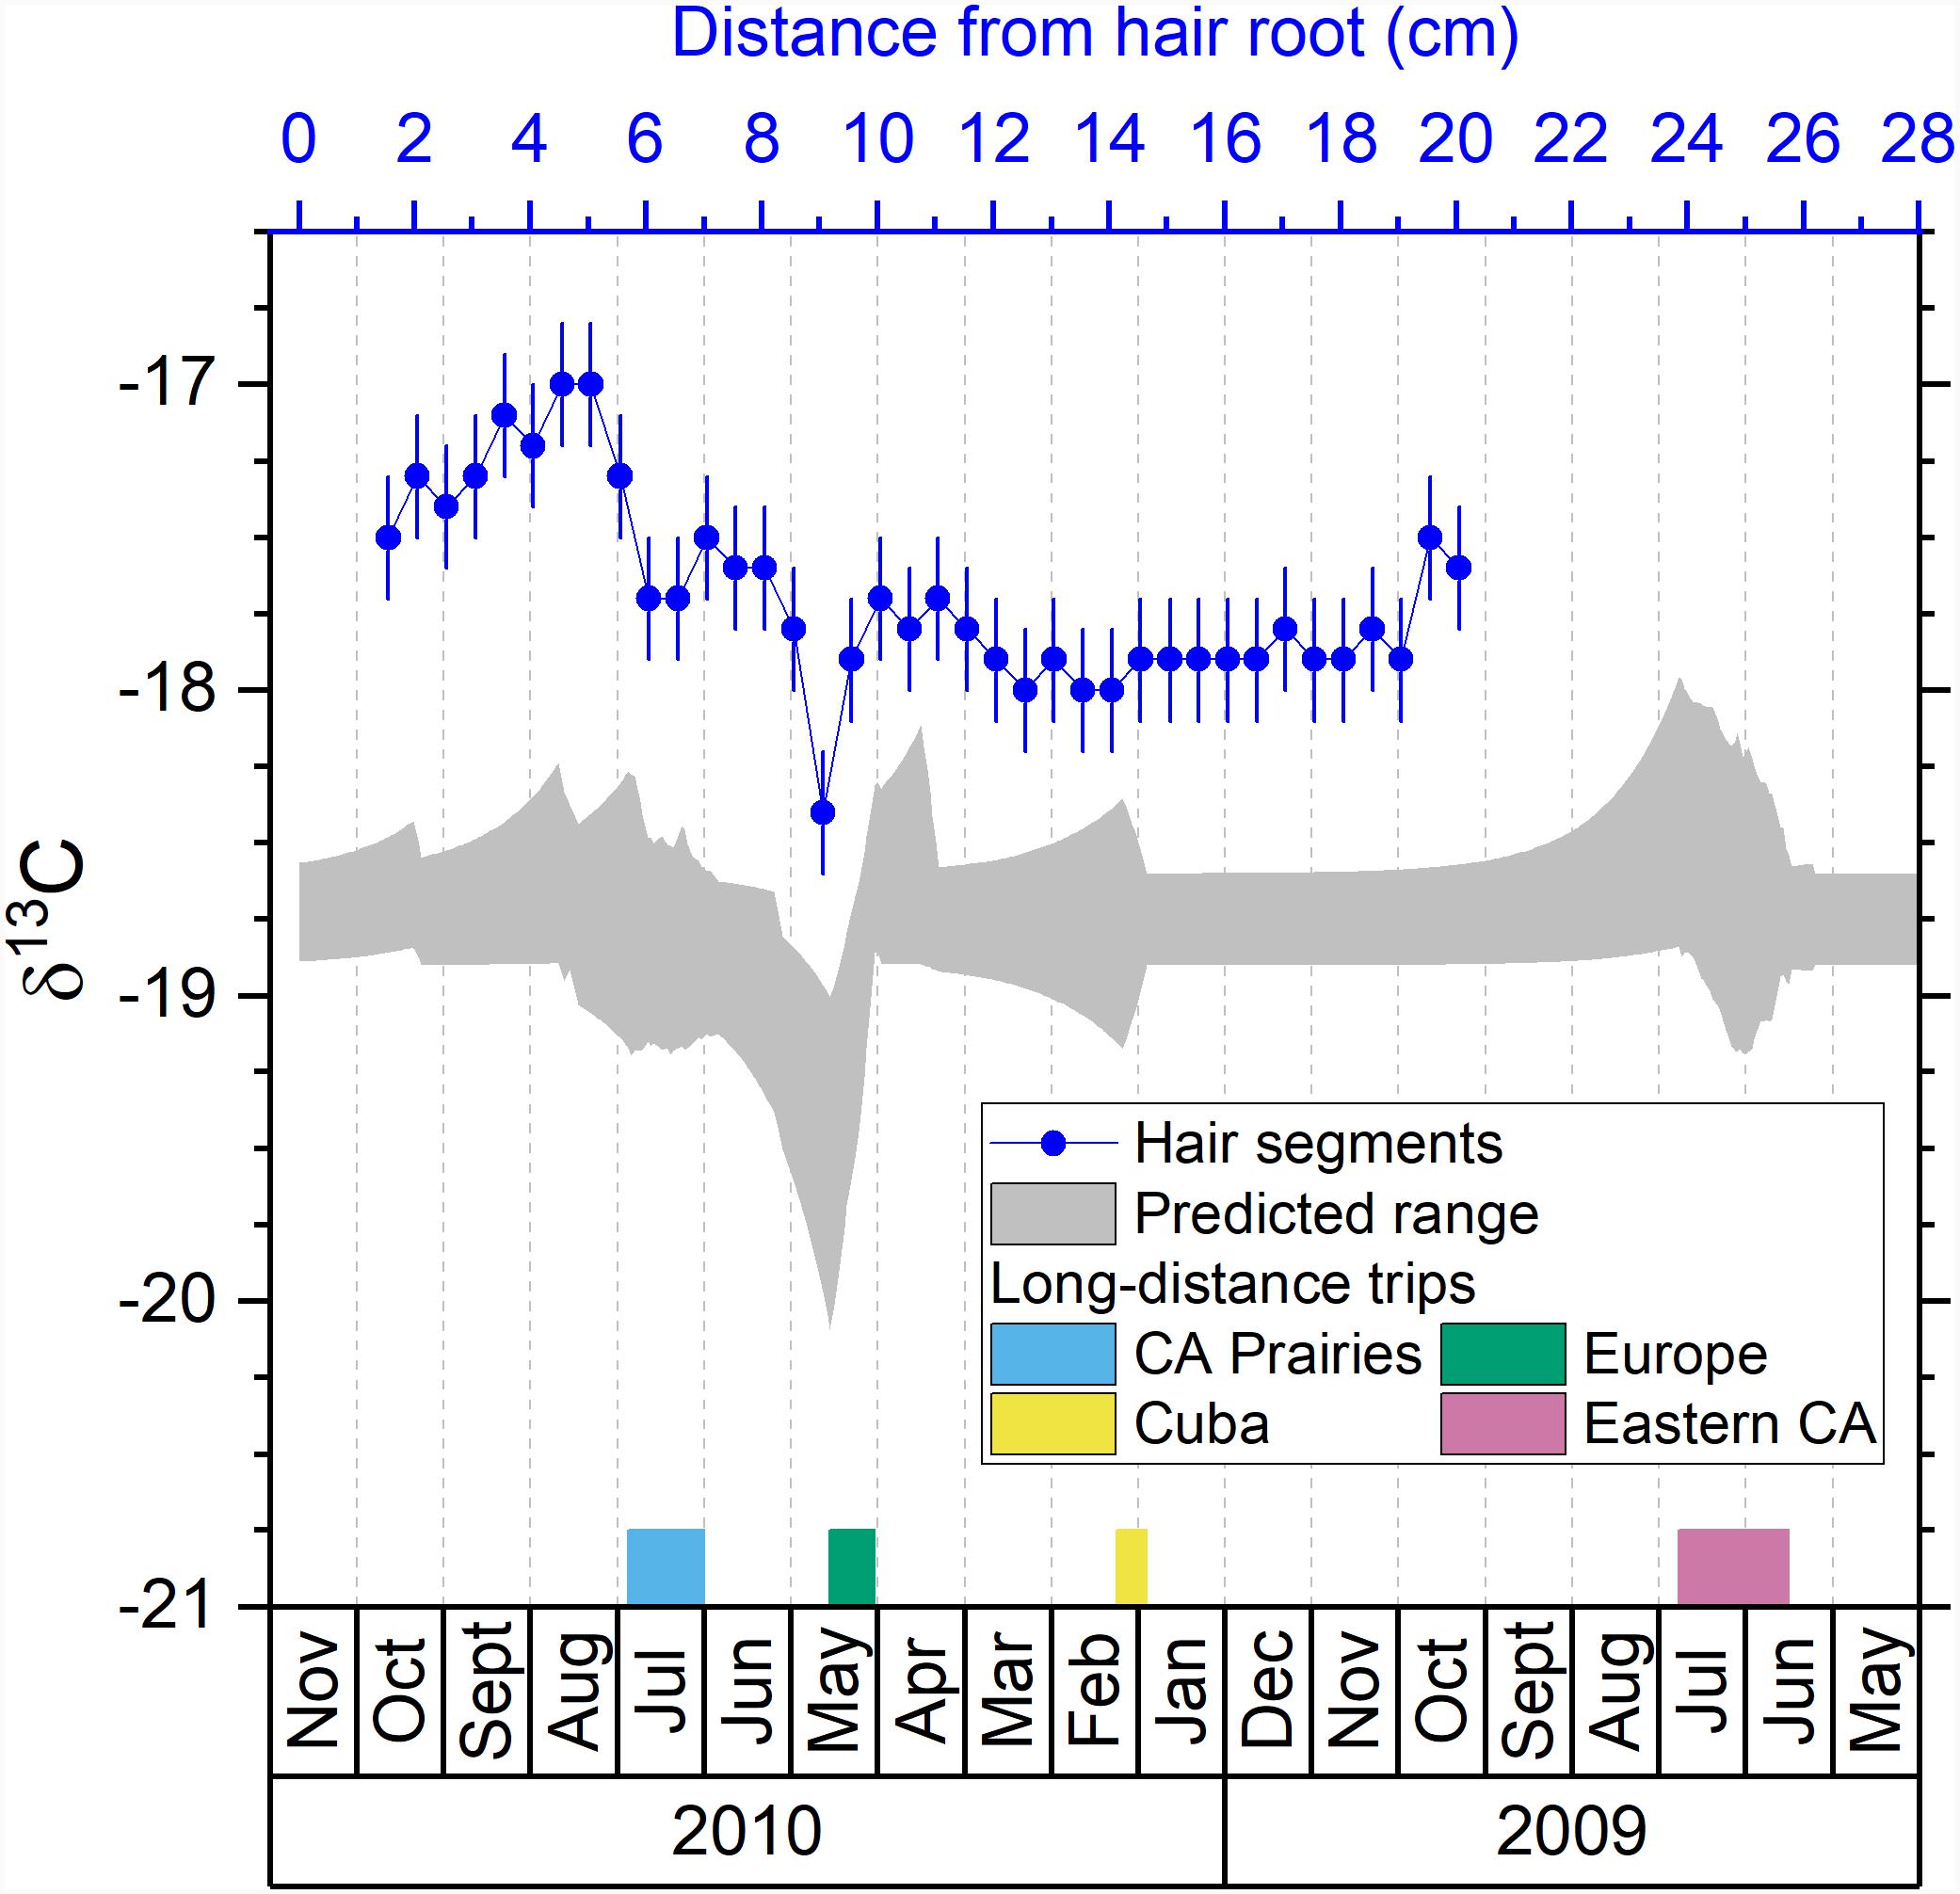
Figure 3. Comparison between the predicted isotopic profile and the measured isotopic values in hair segments for carbon. Blue dots are the measured δ13C values in hair segments versus their distances from the hair root (top axis). The shaded area is the predicted range of δ13C values in hair versus the date (bottom axis). The periods of the four major trips are marked with colored bars next to the bottom axis.
While the European trip is easily identifiable in the measured and predicted δ13C profiles, other multi-week trips show some significant variations. The trip to the Prairie provinces between June and July 2010 is associated with a negative shift of measured δ13C values around 6–7 cm in the hair (A10–A11) (Figure 3) as some locations in the Prairie provinces have as low as −19.6‰ of the δ13C value (Supplementary Table S1), lower than the Ottawa range (−18.9 to −18.6‰) (Table 1). Again, this difference is associated with different isotopic baseline in food systems with western provinces growing and incorporating more C3 crops. For this trip to western provinces, the amplitude of the shift in δ13C values is less marked than the shift of δ2H values (Figure 2). However, the combined use of δ13C and δ2H values can strongly help constrain the location of travel within Canada. The trip to Cuba in early 2010 did not cause significant fluctuation of δ13C values in the measured or predicted profile because the δ13C values in Cuba, although wider range, have similar average value as Ottawa (Table 1). There is an increase in δ13C values observed in the last two segments toward the tip of the volunteer’s hair which likely correspond to the trip to the Eastern provinces as shown in the predicted profile (Figure 3). As observed for δ2H value, there is a mismatch between the timing of the observed and predicted shifts for the trip to Eastern provinces because those isotopic signals are located in the distal portion of the hair.
There is also an increase of measured δ13C value in the hair segments A2–A9 (Table 2), which is not predicted by the model (Figure 3). This increase of measured δ13C values might be related to a change in dietary habit of the volunteer which was not recorded in our study. Another possible reason for the increase of measured δ13C value is that the volunteer took a series of short trips to southern Ontario during that period (Niagara Falls, Toronto, and Killbear Provincial Park in August, and Sudbury in October 2010) where the δ13C values can be much higher (−17.1‰) than Ottawa (−18.9 to −18.6‰) (Table 1). The predicted profile did not show an increasing δ13C value associated with those trips because they were too short to cause a significant shift in the predicted profile. Adoption of a more accurate hair growth model like the reaction progress model (Cerling et al., 2007) might improve the prediction and reduce such discrepancy between the measured and the predicted profiles.
We suggest that while δ13C values in hair likely respond to dietary preferences, they can provide further geolocation constraints for modern individuals. For example, the δ13C and δ15N values of human hair were used to identify the recent migrants in a rural community in SW England (Bol et al., 2007), and could also be used, along with collagen samples, to identify the migrants from Ireland to 19th century London during the Great Irish Famine (1845–1852) (Beaumont et al., 2013). As the isotopic δ13C baseline from different countries and regions become well established (Hülsemann et al., 2015), we suggest that δ13C value could be added to provide a qualitative assessment of mobility and constrain δ2H values. Similar applications could be envisioned for archeological applications as far as the δ13C variations in food systems of different regions at the studied time are established. Early studies have shown that the ancient mummies from different locations (Egypt, Chile, and Oetztaler Alps) have different δ13C and δ15N values in hair likely due to dietary differences of C3 and C4 food as a carbon source, and marine food as a nitrogen source (Macko et al., 1999a,b). A later study demonstrated the use of δ13C and δ15N values in archeological human hairs from Northern Chile to reconstruct the travel history of the individual moving between the coast and highlands (Knudson et al., 2012). Paleomobility studies would thus be further benefited from the δ13C hair analysis if the paleo-isoscape of food sources (e.g., δ13C variation due to C3/C4 proportion) could be established like the modern isoscapes (West et al., 2010).
Comparing the Predicted Isotopic Profile and the Measured Isotopic Values of Nitrogen
The predicted δ15N profile has little fluctuation (Figure 4) despite the long-distance travel of the volunteer. The majority of the measured δ15N values in the hair profile of the individual falls within a tight range of 9.5–10.25‰ (Figure 4). These values are in the upper range of other Canadians in the FAD (Chartrand and St-Jean, 2015; Bataille et al., 2020a), suggesting, as δ13C values do, that our volunteer had a specific diet, possibly high intake of animal or marine-based protein (O’Connell and Hedges, 1999; Petzke et al., 2005b, 2010). Most of the values are within the predicted range except for a few outliers. The segment A1 has a δ15N value of 10.5‰ (Table 2), slightly higher than the upper limit of the predicted range (Figure 4), which might reflect a change of nutritional or metabolic status of the individual (Mekota et al., 2006; Petzke et al., 2010). We can also see several outliers in the hair segments A22–A29, with the highest δ15N value of 11.9‰ in the segment A27 (Table 2 and Figure 4).
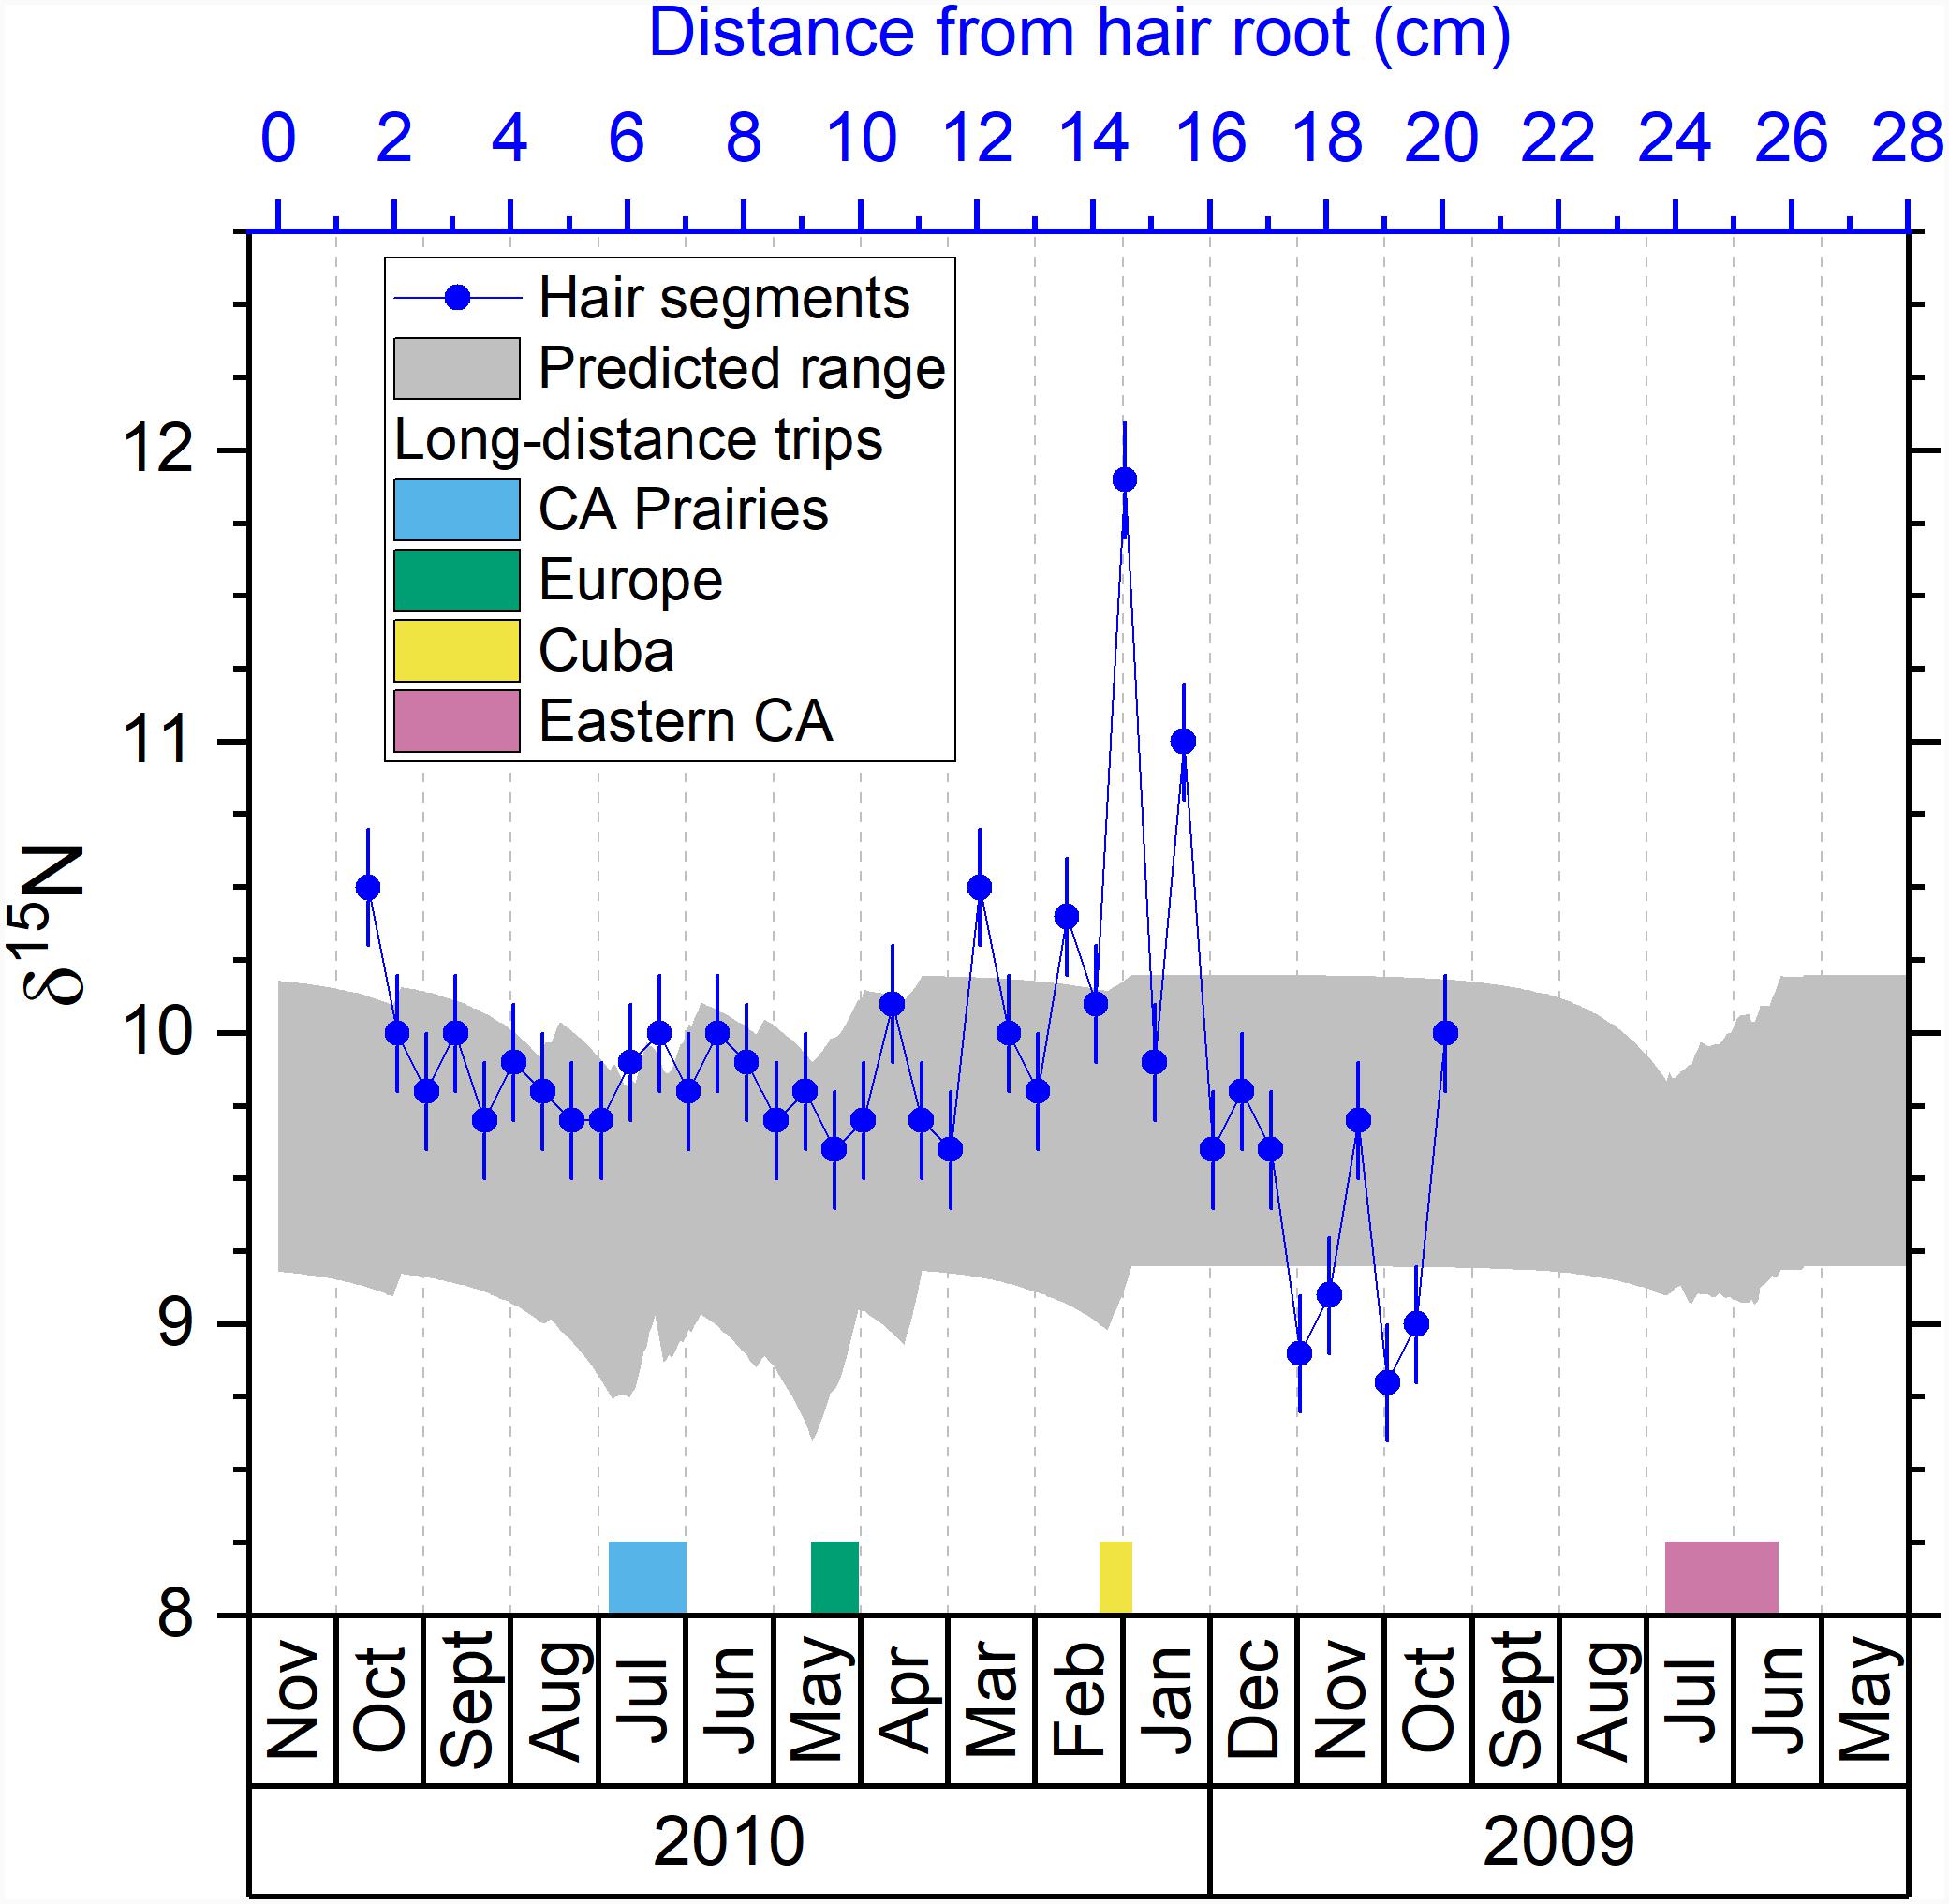
Figure 4. Comparison between the predicted isotopic profile and the measured isotopic values in hair segments for nitrogen. Blue dots are the measured δ15N values in hair segments versus their distances from the hair root (top axis). The shaded area is the predicted range of δ15N values in hair versus the date (bottom axis). The periods of the four major trips are marked with colored bars next to the bottom axis.
Studies have shown that δ15N value in hair can be affected by both diet and nutritional stress (O’Connell and Hedges, 1999; Fuller et al., 2005; Mekota et al., 2006; Petzke et al., 2005a, 2010). Therefore, the drastic change of δ15N value measured in the segment A27 and A29 of the volunteer’s hair might be related to a severe illness reported by the volunteer during and post Cuba trip. This disease could have led to metabolic stress causing a change of nutritional stress or diet, as reported by the volunteer. However, the timing of the δ15N excursions in the measured profile does not match exactly the timing of the Cuba trip: one of the δ15N excursion (A29) occurs a month before the Cuba trip (Figure 4). As discussed before, it is possible that because these isotopic signals are located in the distal portion of the hair, their timing are more uncertain. We also notice some rapid δ15N fluctuations (8.8–9.7‰) in the hair segments A33–A37 (Table 2 and Figure 4). These variations do not match any travel and are likely influence by physiological or dietary factors.
In general, δ15N value in hair may not be a good tool to identify geographical movements because of its geographical invariability. δ15N values mainly depend on the protein source in the individual’s diet. As evidenced by previous studies, δ15N value in hair can be potentially a powerful tool to identify the change of diet, nutritional stress, or metabolic status of the subject (Fuller et al., 2004, 2005; Mekota et al., 2006; Huelsemann et al., 2009; Petzke et al., 2010).
Comparing the Predicted Isotopic Profile and the Measured Isotopic Values of Strontium
Previous studies demonstrated that the 87Sr/86Sr ratios in hair are strongly related to the 87Sr/86Sr ratio of local tap water (Tipple et al., 2018, 2019; Ammer et al., 2020). If the hair of the volunteer recorded the 87Sr/86Sr ratios of tap water at traveled locations by drinking the tap water and incorporating its 87Sr/86Sr ratio into hair through the bloodstream like the light stable isotope systems, we would expect large 87Sr/86Sr variations throughout the predicted profile shown in Figure 5. However, the measured 87Sr/86Sr ratios display a low range of 87Sr/86Sr variations remaining around 0.7115 (0.7110–0.7119) which is much smaller than the expected range from the predicted profile (0.7100–0.7143) (Figure 5). A possible explanation for this discrepancy is that Sr in hair has a much long turnover time than hydrogen isotopes used to calibrate the hair age model (Cohn et al., 1962; Kitchings et al., 1976). A more likely reason is that hair incorporates Sr from tap water through surface contamination during bathing or showering instead of drinking (Tipple et al., 2018; Hu et al., 2020). As shown in previous studies, exogenous Sr can be rapidly incorporated into hair keratin after the eruption from the scalp (Chittleborough, 1980; Kempson and Lombi, 2011), and the 87Sr/86Sr ratios in human keratinous tissues can rapidly inherit the 87Sr/86Sr of bathing or showering water (Mancuso and Ehleringer, 2018; Tipple et al., 2018; Hu et al., 2020). Therefore, we would expect the 87Sr/86Sr ratios in the hair of the volunteer to incorporate exogenous Sr from the last location where the volunteer resided and/or from the location where the volunteer resided the longest (Hu et al., 2018, 2020; Tipple et al., 2018, 2019). Indeed, the 87Sr/86Sr ratios in the hair of the volunteer (0.7110–0.7119) fall close to the 87Sr/86Sr ratios of tap water in Ottawa, the last city where the volunteer resided (0.7126–0.7128) (Table 1). The slight difference between measured 87Sr/86Sr ratios in hair and that of Ottawa tap water may reflect seasonal variations of the 87Sr/86Sr ratio in tap water originated from the Ottawa river, with 87Sr/86Sr ratios of ∼0.711 in Spring and ∼0.712 in Fall from Telmer (1998). This hypothesis of exogenous incorporation is consistent with the longitudinal increase of Sr concentration ([Sr]) in the hair profile of the volunteer (Figure 6A) and the convergence of the hair 87Sr/86Sr ratios toward an end-member of ∼0.7112 (Figure 6B), equal to Ottawa river 87Sr/86Sr ratio in Spring (Telmer, 1998).
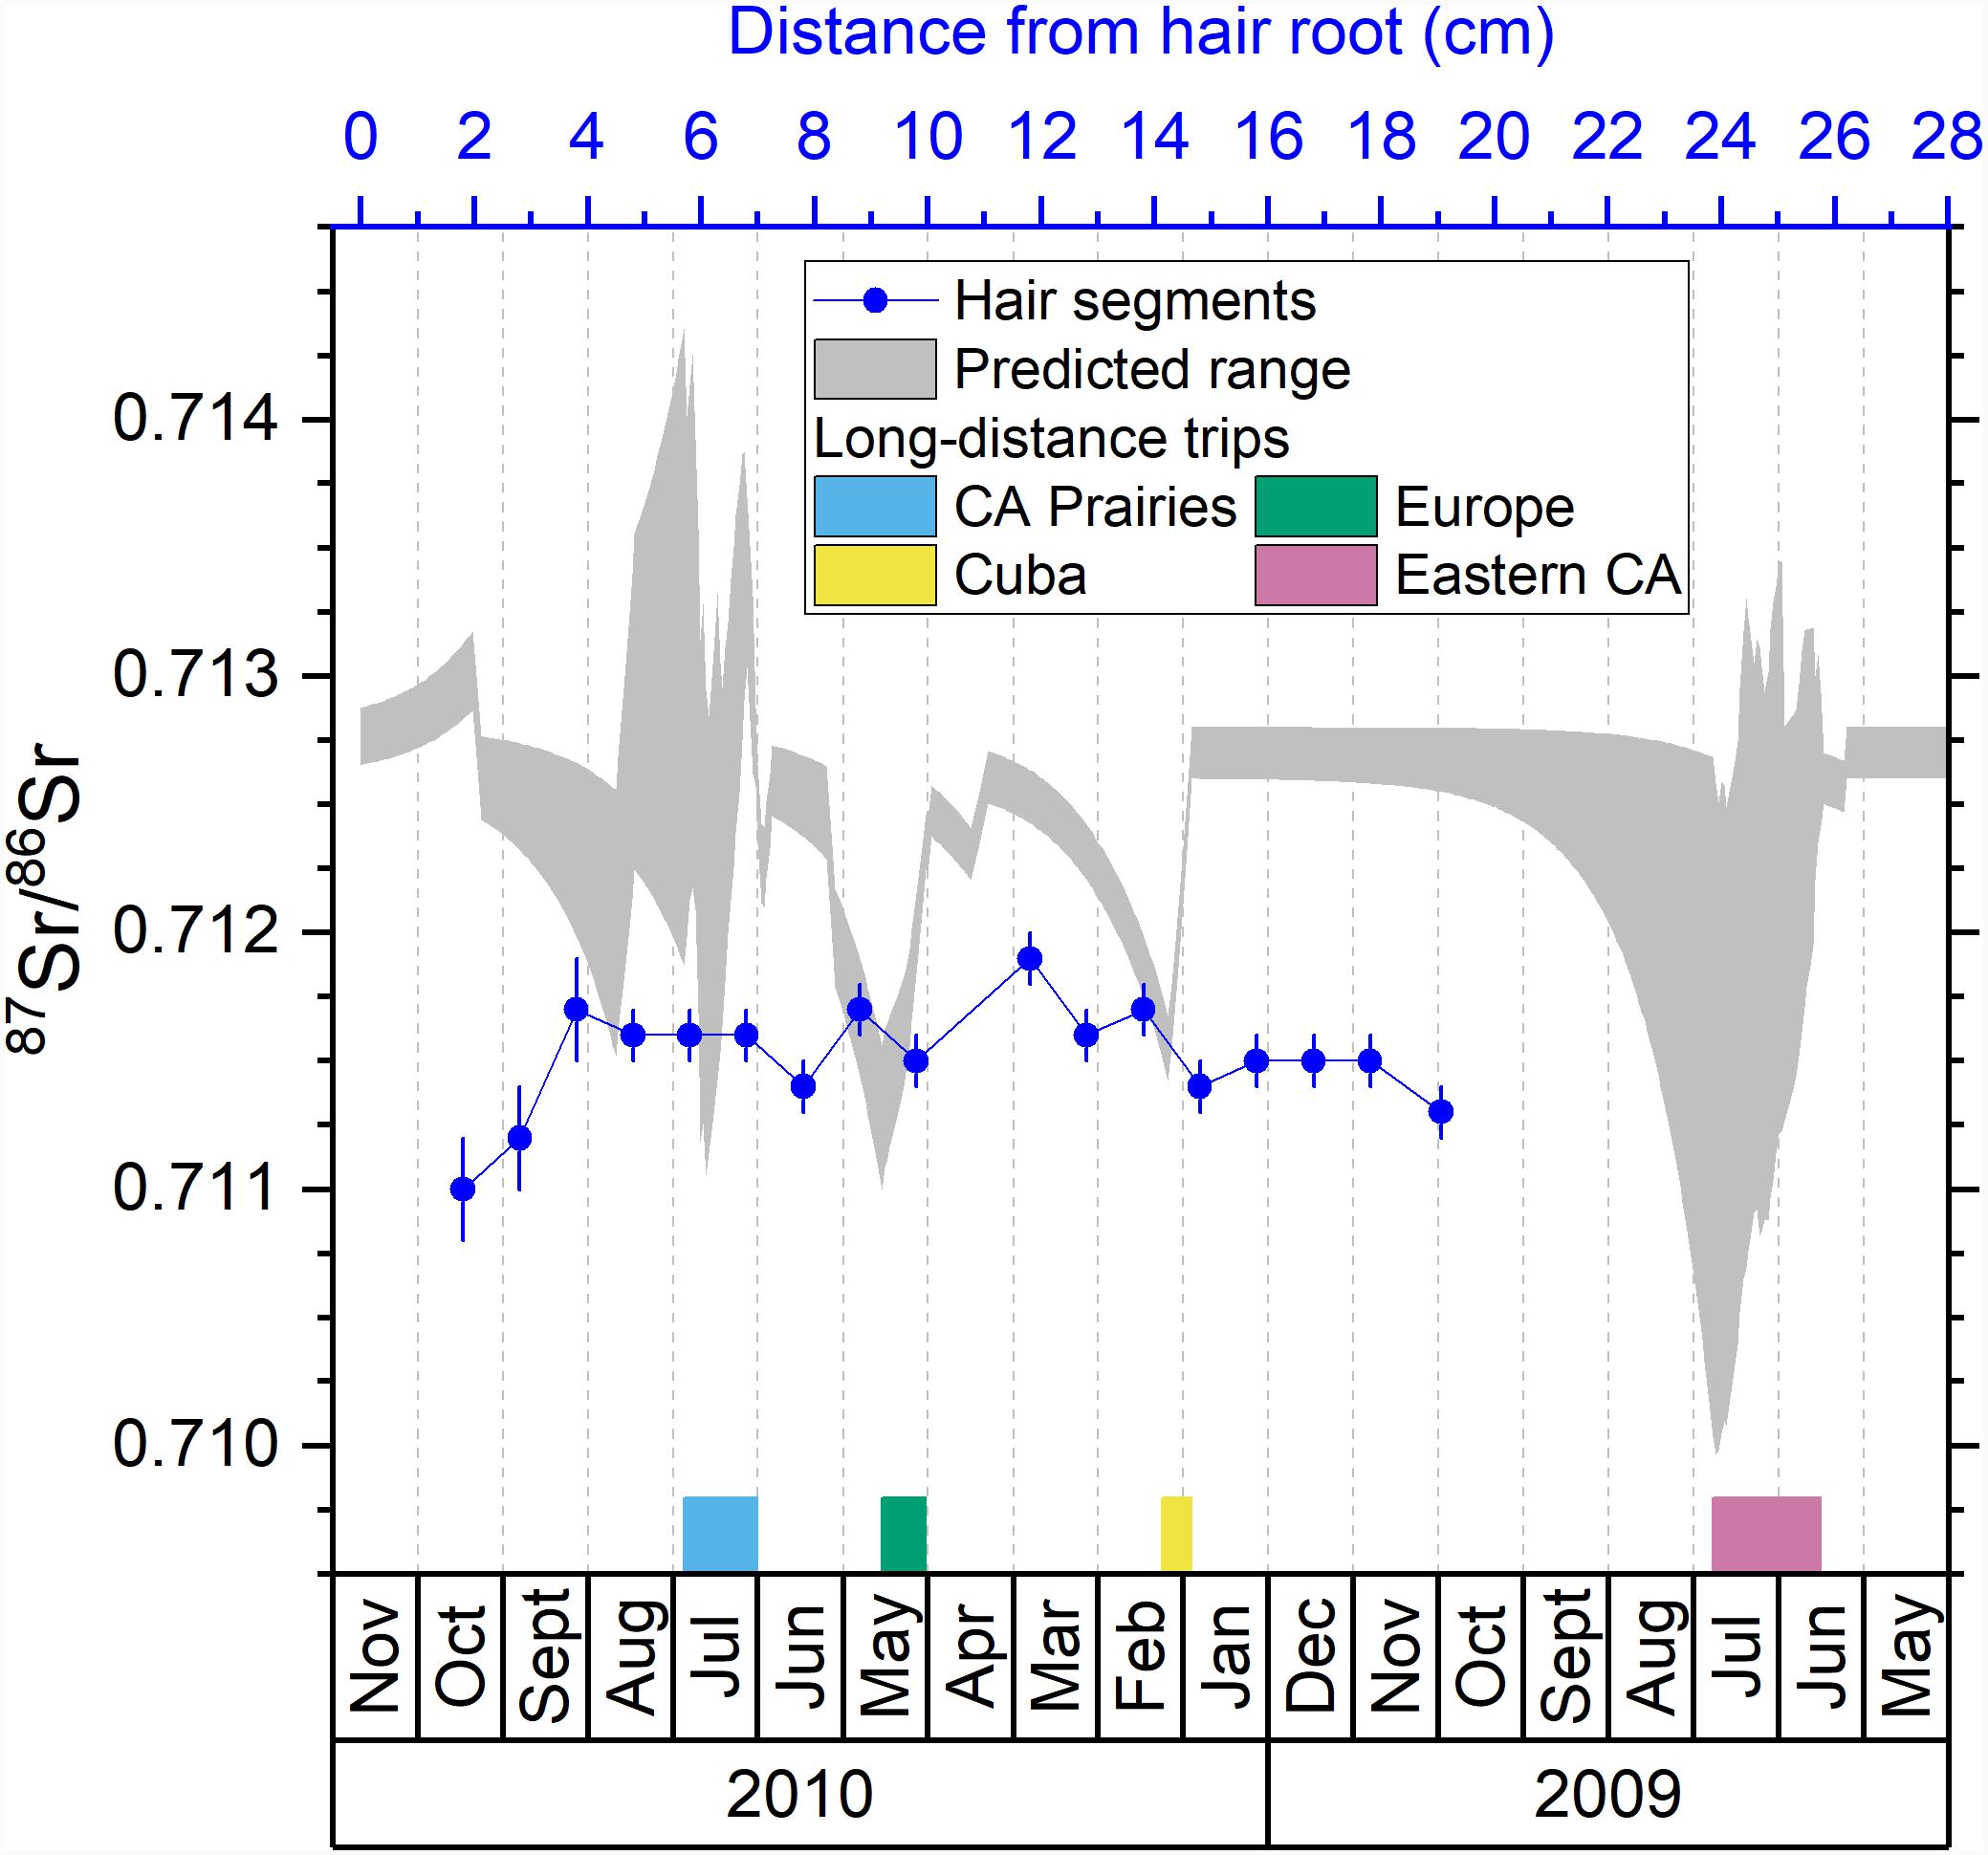
Figure 5. Comparison between the predicted isotopic profile and the measured isotopic ratios in hair segments for strontium. Blue dots are the measured 87Sr/86Sr ratios in hair segments versus their distances from the hair root (top axis). The shaded area is the predicted range of 87Sr/86Sr ratios in hair versus the date (bottom axis). The periods of the four major trips are marked with colored bars next to the bottom axis.
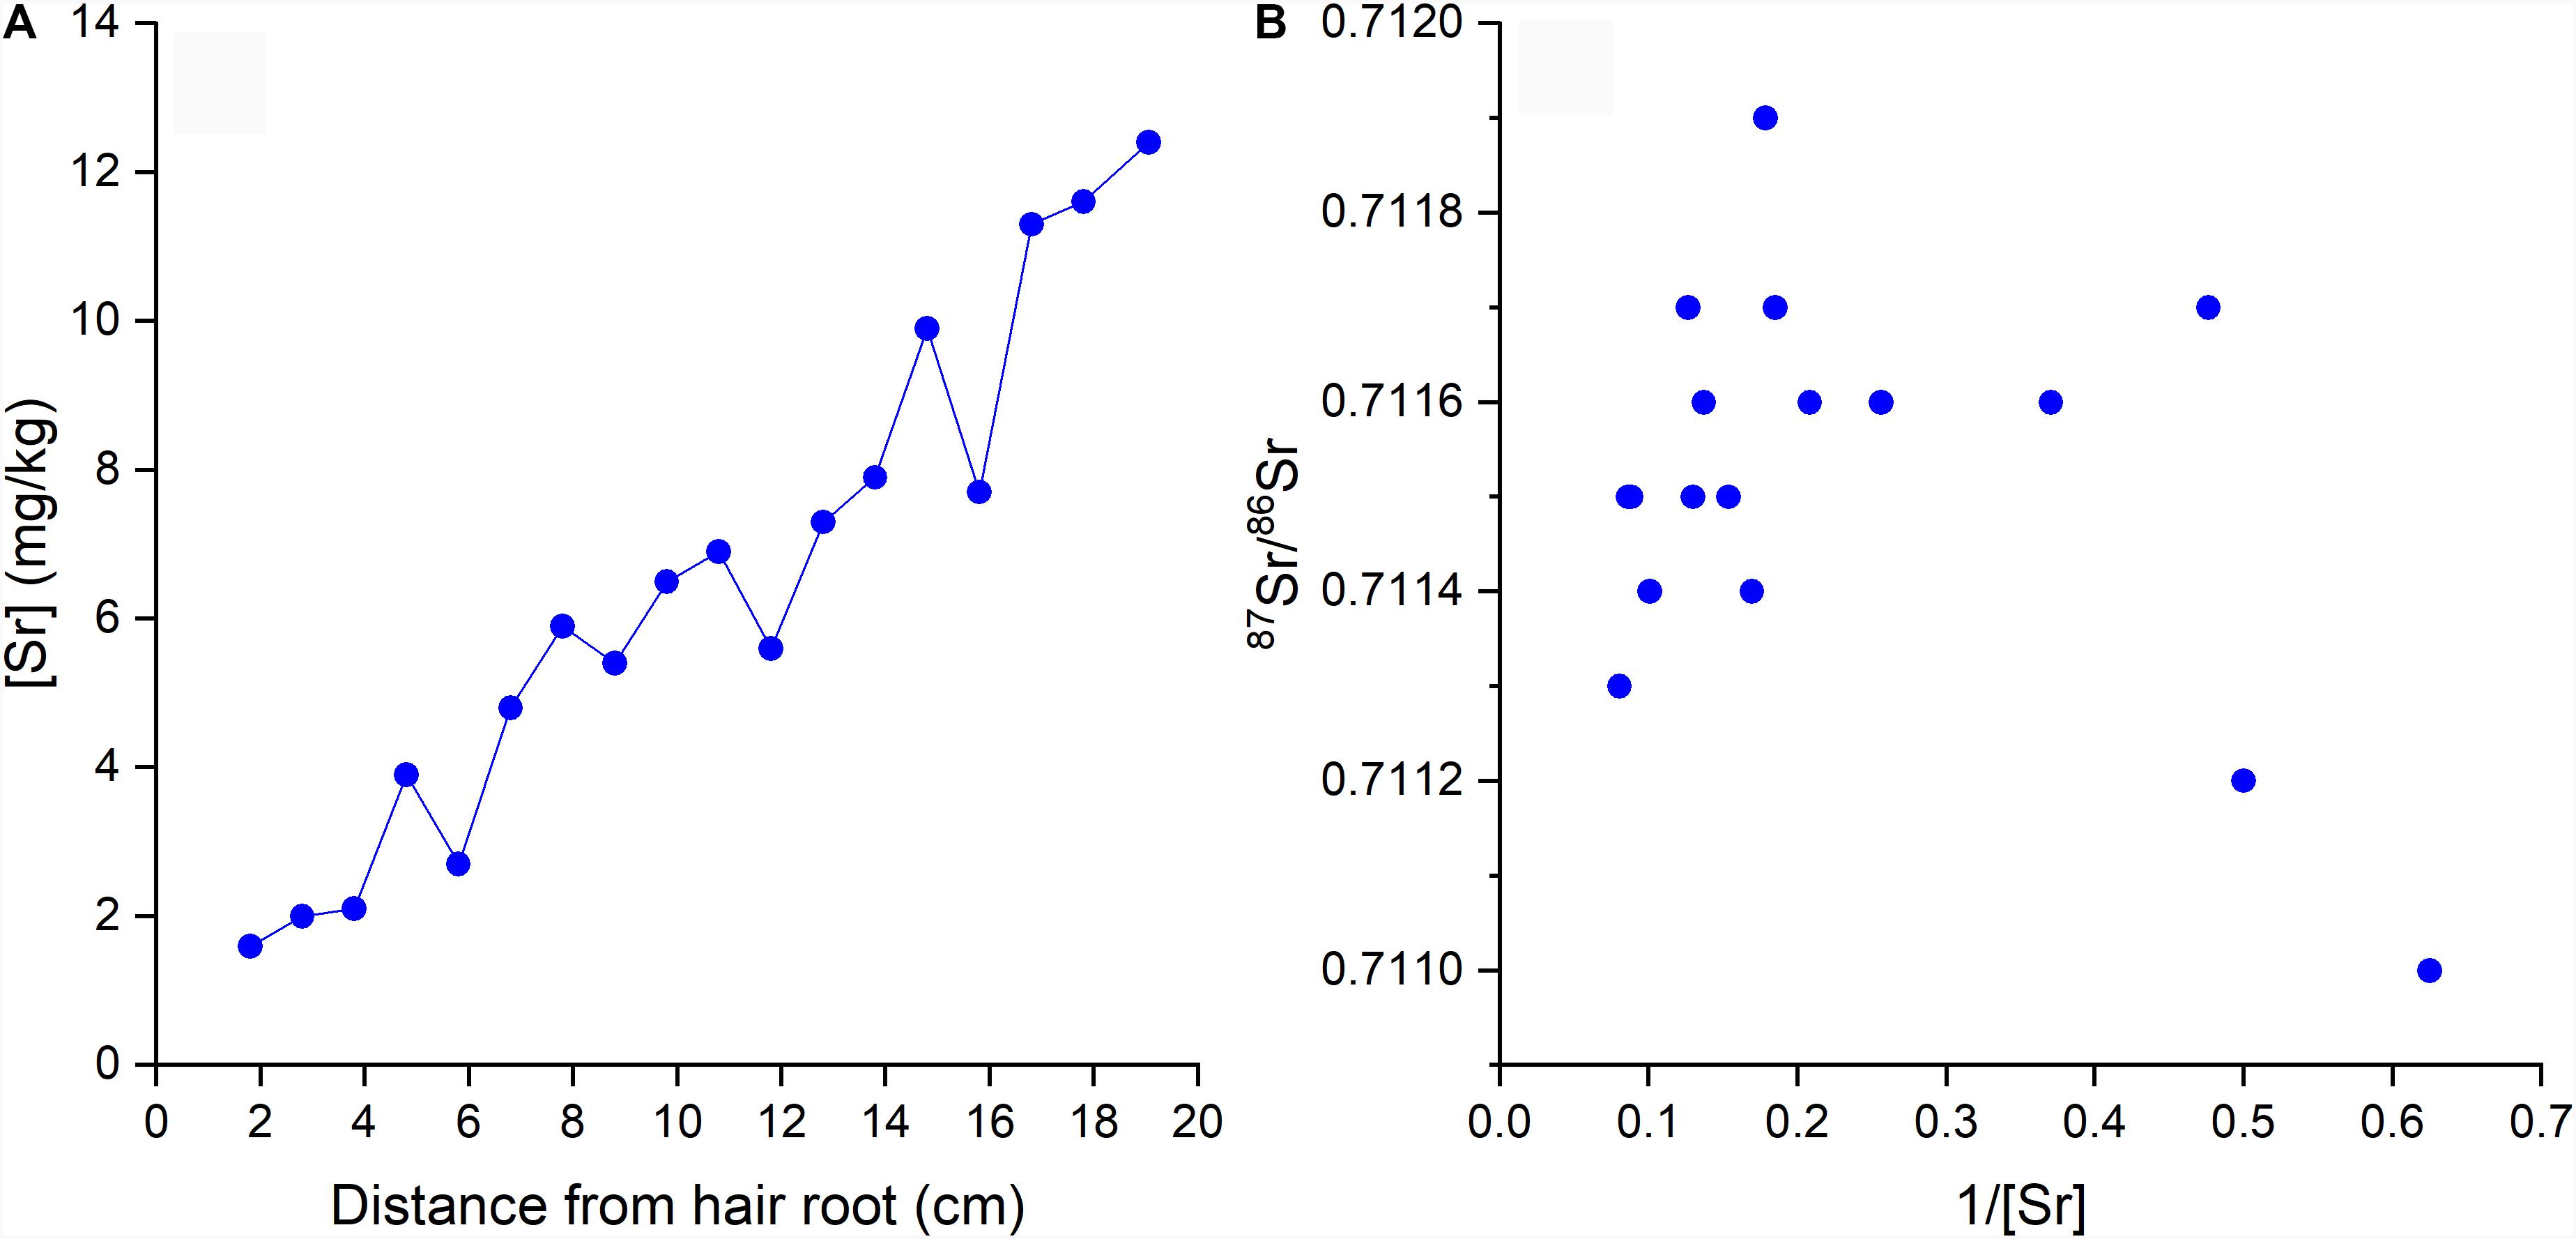
Figure 6. (A) [Sr] in hair segments versus the distance from hair root; (B) 87Sr/86Sr versus 1/[Sr] in hair segments.
However, we also notice that the measured 87Sr/86Sr ratios in the two first hair segments (B1 and B2, Table 3) were quite lower (0.7110 and 0.7112) than the rest of the hair profile and sit on the bottom-right corner of Figure 6B, suggesting another source of Sr for segment B1 and B2. Both hair segments are the most recently grown, and as evidenced by their lower Sr concentrations (Figure 6A) they have incorporated less exogeneous Sr through bathing or showering. Young hair tends to be less damaged, thus limiting water diffusion during bathing. Consequently, the most proximal portion of the hair may preserve, in part, endogenous 87Sr/86Sr ratio. This is supported by the distinct isotopic ratios of these segments relative to the rest of the hair where Sr is overprinted or exchanged with exogenous Sr from Ottawa tap water. This endogenous Sr must come primarily from dietary sources and not from tap water and is incorporated into hair through blood (Lewis et al., 2017). The volunteer had a typical supermarket diet and most of the food items consumed while residing in Ottawa came from a variety of regional, national, and international sources with variable 87Sr/86Sr ratios. This complex food sourcing makes it challenging to characterize the integrated dietary 87Sr/86Sr ratio. However, it is likely that the 87Sr/86Sr ratios of the food consumed by the volunteer in Ottawa differ from that of the local tap water explaining the isotopic difference between the young and older hair segments.
Although studies have been trying to use 87Sr/86Sr ratios in hair for forensic and archeologic applications (Font et al., 2012; Frei et al., 2015; Vautour et al., 2015), it has been shown that hair can exchange Sr with the ambient water, either in modern environment during bathing or showering (Tipple et al., 2018; Hu et al., 2020), or in post-mortem environment (Gordon et al., 2019). Our result generally agrees that the Sr in modern human hair above 3 cm from scalp is mostly replaced by the exogenous signal. However, the initial 3 cm of hair (segments B1 and B2) in this study contained different 87Sr/86Sr ratios from the rest of the hair, indicating the preservation of the most recent endogenous 87Sr/86Sr ratios. Therefore, the proximal end (root) of hair could preserve endogenous Sr signal which can be useful for provenance applications and archeological applications allowing in particular to verify if an individual recently moved or if human remains were displaced.
Conclusion
In this study, we analyzed the isotopic compositions of four elements (hydrogen, carbon, nitrogen, and strontium) along the ∼20 cm hair profile of a volunteer. This volunteer was a resident of Ottawa, who had traveled to several distant locations over a period of 2 years. We used the existing isotope database, detailed travel history, and a single exponential best-fit model to predict the isotopic profile for each of these isotopic systems. We compared the measured isotopic values in hair with the predicted profiles to evaluate the ability to reconstruct the life history of a mobile individual with different isotopic systems. Our results demonstrate that no single isotopic system can show all major travel events. The measured δ2H profile faithfully recorded a 2 months trip to the Prairie Provinces, thus a good tool to identify travel events of which the original location and the destination have substantial δ2H difference, in this case ∼10‰. The absolute values of the measured δ13C and δ15N profiles do not match the predicted profiles, suggesting that dietary and/or physiological factors could control the overall isotopic compositions. For example, there is a relatively constant ∼1.5‰ offset between the measured and predicted δ13C profiles. However, the patterns of δ13C variations in the measured and predicted profiles are very similar which both properly recorded a 2 weeks trip in Europe, indicating that δ13C in hair can be a good indicator of mobility when traveling between countries with distinct δ13C signatures in the food systems. Nitrogen isotope compositions in the hair of the volunteer are generally on the upper limit of predicted ranges, indicating the consumption of consistent amounts of animal or marine-based protein at the different locations. The spikes of δ15N values in the measured profile are likely caused by the severe illness of the individual associated with a trip to Cuba, indicating its potential to identify the change of physiological status. From the stable isotope results, we found that the isotopic shifts in the proximal part of the hair bundle (<10 cm) are likely more representative of the true isotopic variability, while the isotopic shifts in the distal part (>10 cm) have larger uncertainty in terms of timing and amplitude. Lastly, strontium isotope composition in the volunteer’s hair was mostly affected by the exogenous Sr signal incorporated during environmental contamination, which mainly reflects the most recent residential signal. However, we also notice that the root of the hair may have preserved at least partial endogenous signal from the diet. Therefore, while the 87Sr/86Sr profile in the distal part of hair may not be used to reconstruct travel history, the 87Sr/86Sr ratio in the proximal part of hair may be used for dietary studies.
Data Availability Statement
All datasets generated for this study are included in the article/Supplementary Material.
Ethics Statement
The studies involving human participants were reviewed and approved by the University of Ottawa Research Ethics Board. The patients/participants provided their written informed consent to participate in this study.
Author Contributions
LH, CB, GS-J, and MC designed the project. MC, LH, and ML analyzed the datasets. CB and LH performed the interpretation and model development steps. LH and CB led the writing of the manuscript. All the authors contributed to the article and approved the submitted version.
Funding
CB and LH acknowledge funding from Canadian Security and Safety Program Targeted Investment (CSSP-2018-TI-2385). GS-J and MC acknowledge funding from the Chemical, Biological, Radiological and Nuclear Research & Technology Initiative (CRTI 08-0116RD).
Conflict of Interest
The authors declare that the research was conducted in the absence of any commercial or financial relationships that could be construed as a potential conflict of interest.
Supplementary Material
The Supplementary Material for this article can be found online at: https://www.frontiersin.org/articles/10.3389/fevo.2020.568943/full#supplementary-material
References
Ammer, S. T. M., Kootker, L. M., Bartelink, E. J., Anderson, B. E., Cunha, E., and Davies, G. R. (2020). Comparison of strontium isotope ratios in Mexican human hair and tap water as provenance indicators. Forensic Sci. Int. 314:110422. doi: 10.1016/j.forsciint.2020.110422
Ayliffe, L. K., Cerling, T. E., Robinson, T., West, A. G., Sponheimer, M., Passey, B. H., et al. (2004). Turnover of carbon isotopes in tail hair and breath CO2 of horses fed an isotopically varied diet. Oecologia 139, 11–22. doi: 10.1007/s00442-003-1479-x
Bataille, C. P., and Bowen, G. J. (2012). Mapping 87Sr/86Sr variations in bedrock and water for large scale provenance studies. Chem. Geol. 304–305, 39–52. doi: 10.1016/j.chemgeo.2012.01.028
Bataille, C. P., Chartrand, M. M. G., Raposo, F., and St-Jean, G. (2020a). Assessing geographic controls of hair isotopic variability in human populations: a case-study in Canada. PLoS One 15:e0237105. doi: 10.1371/journal.pone.0237105
Bataille, C. P., Crowley, B. E., Wooller, M. J., and Bowen, G. J. (2020b). Advances in global bioavailable strontium isoscapes. Palaeogeogr. Palaeoclimatol. Palaeoecol. 555:109849. doi: 10.1016/j.palaeo.2020.109849
Beaumont, J., Geber, J., Powers, N., Wilson, A., Lee-Thorp, J., and Montgomery, J. (2013). Victims and survivors: stable isotopes used to identify migrants from the Great Irish Famine to 19th century London. Am. J. Phys. Anthropol. 150, 87–98. doi: 10.1002/ajpa.22179
Bentley, R. A. (2006). Strontium Isotopes from the Earth to the archaeological skeleton: a review. J. Archaeol. Method Theory 13, 135–187. doi: 10.1007/s10816-006-9009-x
Bol, R., Marsh, J., and Heaton, T. H. E. (2007). Multiple stable isotope (18O, 13C, 15N and 34S) analysis of human hair to identify the recent migrants in a rural community in SW England. Rapid. Commun. Mass Spectrom. 21, 2951–2954. doi: 10.1002/rcm.3168
Bowen, G. J. (2010). Isoscapes: spatial pattern in isotopic biogeochemistry. Annu. Rev. Earth Planet. Sci. 38, 161–187. doi: 10.1146/annurev-earth-040809-152429
Bowen, G. J., Wassenaar, L. I., and Hobson, K. A. (2005). Global application of stable hydrogen and oxygen isotopes to wildlife forensics. Oecologia 143, 337–348. doi: 10.1007/s00442-004-1813-y
Buzon, M. R., Conlee, C. A., and Bowen, G. J. (2011). Refining oxygen isotope analysis in the Nasca region of Peru: an investigation of water sources and archaeological samples. Int. J. Osteoarchaeol. 21, 446–455. doi: 10.1002/oa.1151
Cerling, T. E., Andanje, S. A., Gakuya, F., Kariuki, J. M., Kariuki, L., Kingoo, J. W., et al. (2018). Stable isotope ecology of black rhinos (Diceros bicornis) in Kenya. Oecologia 187, 1095–1105. doi: 10.1007/s00442-018-4185-4
Cerling, T. E., Ayliffe, L. K., Dearing, M. D., Ehleringer, J. R., Passey, B. H., Podlesak, D. W., et al. (2007). Determining biological tissue turnover using stable isotopes: the reaction progress variable. Oecologia 151, 175–189. doi: 10.1007/s00442-006-0571-4
Cerling, T. E., Wittemyer, G., Ehleringer, J. R., Remien, C. H., and Douglas-Hamilton, I. (2009). History of animals using isotope records (HAIR): a 6-year dietary history of one family of African elephants. Proc. Natl. Acad. Sci. U.S.A. 106:8093. doi: 10.1073/pnas.0902192106
Cerling, T. E., Wittemyer, G., Rasmussen, H. B., Vollrath, F., Cerling, C. E., Robinson, T. J., et al. (2006). Stable isotopes in elephant hair document migration patterns and diet changes. Proc. Natl. Acad. Sci. U.S.A. 103, 371–373. doi: 10.1073/pnas.0509606102
Chartrand, M., and St-Jean, M. G. (2015). Forensic Attribution of CBRNE Materials: A Chemical Fingerprint Database. Ottawa: Defence Research and Development Canada.
Chau, T. H., Tipple, B. J., Hu, L., Fernandez, D. P., Cerling, T. E., Ehleringer, J. R., et al. (2017). Reconstruction of travel history using coupled δ18O and 87Sr/86Sr measurements of hair. Rapid Commun. Mass Spectrom. 31, 583–589. doi: 10.1002/rcm.7822
Chesson, L. A., Meier-Augenstein, W., Berg, G. E., Bataille, C. P., Bartelink, E. J., and Richards, M. P. (2020). “Basic principles of stable isotope analysis in humanitarian forensic science,” in Forensic Science and Humanitarian Action: Interacting with the Dead and the Living, eds R. C. Parra, S. C. Zapico, and D. H. Ubelaker (Hoboken, NJ: John Wiley & Sons, Ltd), 285–310. doi: 10.1002/9781119482062.ch20
Chesson, L. A., Tipple, B. J., Mackey, G. N., Hynek, S. A., Fernandez, D. P., and Ehleringer, J. R. (2012). Strontium isotopes in tap water from the coterminous USA. Ecosphere 3, 1–17. doi: 10.1890/ES12-00122.1
Chittleborough, G. (1980). A chemist’s view of the analysis of human hair for trace elements. Sci. Total Environ. 14, 53–75. doi: 10.1016/0048-9697(80)90126-6
Cohn, S. H., Spencer, H., Samachson, J., and Robertson, J. S. (1962). The turnover of strontium-85 in man as determined by whole-body counting. Radiat. Res. 17, 173–185. doi: 10.2307/3571307
Ehleringer, J. R., Bowen, G. J., Chesson, L. A., West, A. G., Podlesak, D. W., and Cerling, T. E. (2008). Hydrogen and oxygen isotope ratios in human hair are related to geography. Proc. Natl. Acad. Sci. U.S.A. 105, 2788–2793. doi: 10.1073/pnas.0712228105
Ehleringer, J. R., Thompson, A. H., Podlesak, D. W., Bowen, G. J., Chesson, L. A., Cerling, T. E., et al. (2010). “A framework for the incorporation of isotopes and isoscapes in geospatial forensic investigations,” in Isoscapes: Understanding Movement, Pattern, and Process on Earth through Isotope Mapping, eds J. B. West, G. J. Bowen, T. E. Dawson, and K. P. Tu (Netherlands: Springer), 357–387. doi: 10.1007/978-90-481-3354-3_17
Font, L., Nowell, G. M., Graham Pearson, D., Ottley, C. J., and Willis, S. G. (2007). Sr isotope analysis of bird feathers by TIMS: a tool to trace bird migration paths and breeding sites. J. Anal. At. Spectrom. 22, 513–522. doi: 10.1039/B616328A
Font, L., van der Peijl, G., van Wetten, I., Vroon, P., van der Wagt, B., and Davies, G. (2012). Strontium and lead isotope ratios in human hair: investigating a potential tool for determining recent human geographical movements. J. Anal. At. Spectrom. 27, 719–732. doi: 10.1039/c2ja10361c
Fraser, I., and Meier-Augenstein, W. (2007). Stable 2H isotope analysis of modern-day human hair and nails can aid forensic human identification. Rapid Commun. Mass Spectrom. 21, 3279–3285. doi: 10.1002/rcm.3209
Fraser, I., Meier-Augenstein, W., and Kalin, R. M. (2006). The role of stable isotopes in human identification: a longitudinal study into the variability of isotopic signals in human hair and nails. Rapid Commun. Mass Spectrom. 20, 1109–1116. doi: 10.1002/rcm.2424
Frei, K. M., Frei, R., Mannering, U., Gleba, M., Nosch, M. L., and Lyngstrøm, H. (2009). Provenance of ancient textiles—a pilot study evaluating the strontium isotope system in wool. Archaeometry 51, 252–276. doi: 10.1111/j.1475-4754.2008.00396.x
Frei, K. M., Mannering, U., Kristiansen, K., Allentoft, M. E., Wilson, A. S., Skals, I., et al. (2015). Tracing the dynamic life story of a bronze age female. Sci. Rep. 5:10431. doi: 10.1038/srep10431
Frei, K. M., Villa, C., Jørkov, M. L., Allentoft, M. E., Kaul, F., Ethelberg, P., et al. (2017). A matter of months: high precision migration chronology of a bronze age female. PLoS One 12:e0178834. doi: 10.1371/journal.pone.0178834
Fuller, B. T., Fuller, J. L., Sage, N. E., Harris, D. A., O’Connell, T. C., and Hedges, R. E. M. (2004). Nitrogen balance and δ15N: why you’re not what you eat during pregnancy. Rapid Commun. Mass Spectrom. 18, 2889–2896. doi: 10.1002/rcm.1708
Fuller, B. T., Fuller, J. L., Sage, N. E., Harris, D. A., O’Connell, T. C., and Hedges, R. E. M. (2005). Nitrogen balance and δ15N: why you’re not what you eat during nutritional stress. Rapid Commun. Mass Spectrom. 19, 2497–2506. doi: 10.1002/rcm.2090
Gehre, M., Renpenning, J., Gilevska, T., Qi, H., Coplen, T. B., Meijer, H. A. J., et al. (2015). On-line hydrogen-isotope measurements of organic samples using elemental chromium: an extension for high temperature elemental-analyzer techniques. Anal. Chem. 87, 5198–5205. doi: 10.1021/acs.analchem.5b00085
Gordon, G., Saul, T., Steadman, D., Knudson, K., Anbar, A. D., and Wescott, D. (2019). Isotopic Taphonomy of Human Remains (NIJ document No. 252506). Washington, DC: U.S. Department of Justice.
Hayashi, S., Miyamoto, I., and Takeda, K. (1991). Measurement of human hair growth by optical microscopy and image analysis. Br. J. Dermatol. 125, 123–129. doi: 10.1111/j.1365-2133.1991.tb06058.x
Hedges, R. E. M., and Reynard, L. M. (2007). Nitrogen isotopes and the trophic level of humans in archaeology. J. Archaeol. Sci. 34, 1240–1251. doi: 10.1016/j.jas.2006.10.015
Hobson, K. A., Barnett-Johnson, R., and Cerling, T. (2010). “Using isoscapes to track animal migration,” in Isoscapes: Understanding Movement, Pattern, and Process on Earth through Isotope Mapping, eds J. B. West, G. J. Bowen, T. E. Dawson, and K. P. Tu (Springer: Netherlands), 273–298. doi: 10.1007/978-90-481-3354-3_13
Hobson, K. A., and Clark, R. G. (1992). Assessing avian diets using stable isotopes ii: factors influencing diet-tissue fractionation. Condor 94, 189–197. doi: 10.2307/1368808
Hobson, K. A., Van Wilgenburg, S. L., Wassenaar, L. I., Powell, R. L., Still, C. J., and Craine, J. M. (2012). A multi-isotope (δ13C, δ15N, δ2H) feather isoscape to assign Afrotropical migrant birds to origins. Ecosphere 3:art44. doi: 10.1890/ES12-00018.1
Hu, L., Fernandez, D. P., and Cerling, T. E. (2018). Longitudinal and transverse variation of trace element concentrations in elephant and giraffe hair: implication for endogenous and exogenous contributions. Environ. Monit. Assess. 190:644. doi: 10.1007/s10661-018-7038-z
Hu, L., Fernandez, D. P., Cerling, T. E., and Tipple, B. J. (2020). Fast exchange of strontium between hair and ambient water: implication for isotopic analysis in provenance and forensic studies. PLoS One 15:e0233712. doi: 10.1371/journal.pone.0233712
Huelsemann, F., Flenker, U., Koehler, K., and Schaenzer, W. (2009). Effect of a controlled dietary change on carbon and nitrogen stable isotope ratios of human hair. Rapid Commun. Mass Spectrom. 23, 2448–2454. doi: 10.1002/rcm.4039
Hülsemann, F., Lehn, C., Schneiders, S., Jackson, G., Hill, S., Rossmann, A., et al. (2015). Global spatial distributions of nitrogen and carbon stable isotope ratios of modern human hair. Rapid Commun. Mass Spectrom. 29, 2111–2121. doi: 10.1002/rcm.7370
Jimenez, F., Izeta, A., and Poblet, E. (2011). Morphometric analysis of the human scalp hair follicle: practical implications for the hair transplant surgeon and hair regeneration studies. Dermatol. Surg. 37, 58–64. doi: 10.1111/j.1524-4725.2010.01809.x
Kempson, I. M., and Lombi, E. (2011). Hair analysis as a biomonitor for toxicology, disease and health status. Chem. Soc. Rev. 40, 3915–3940. doi: 10.1039/c1cs15021a
Kitchings, T., DiGregorio, D., and Van Voris, P. (1976). Review of the Ecological Parameters of Radionuclide Turnover in Vertebrate Food Chains. Ultimo, NSW: Halsted Press.
Knudson, K. J., Pestle, W. J., Torres-Rouff, C., and Pimentel, G. (2012). Assessing the life history of an andean traveller through biogeochemistry: stable and radiogenic isotope analyses of archaeological human remains from Northern Chile. Int. J. Osteoarchaeol. 22, 435–451. doi: 10.1002/oa.1217
Knudson, K. J., Peters, A. H., and Cagigao, E. T. (2015). Paleodiet in the paracas necropolis of Wari Kayan: carbon and nitrogen isotope analysis of keratin samples from the south coast of Peru. J. Archaeol. Sci. 55, 231–243. doi: 10.1016/j.jas.2015.01.011
Kootker, L. M., von Holstein, I. C. C., Broeders, J., Wescott, D. J., Davies, G. R., and Mickleburgh, H. L. (2020). The effects of decomposition and environment on antemortem H-Pb-Sr isotope compositions and degradation of human scalp hair: actualistic taphonomic observations. Forensic Sci. Int. 312:110336. doi: 10.1016/j.forsciint.2020.110336
LeBeau, M. A., Montgomery, M. A., and Brewer, J. D. (2011). The role of variations in growth rate and sample collection on interpreting results of segmental analyses of hair. Forensic Sci. Int. 210, 110–116. doi: 10.1016/j.forsciint.2011.02.015
Lehn, C., Kalbhenn, E. M., Rossmann, A., and Graw, M. (2019). Revealing details of stays abroad by sequential stable isotope analyses along human hair strands. Int. J. Legal Med. 133, 935–947. doi: 10.1007/s00414-018-1866-9
Lehn, C., Lihl, C., and Roßmann, A. (2015a). Change of geographical location from Germany (Bavaria) to USA (Arizona) and its effect on H–C–N–S stable isotopes in human hair. Isotopes Environ. Health Stud. 51, 68–79. doi: 10.1080/10256016.2014.995645
Lehn, C., Rossmann, A., and Graw, M. (2015b). Provenancing of unidentified corpses by stable isotope techniques – presentation of case studies. Sci. Justice 55, 72–88. doi: 10.1016/j.scijus.2014.10.006
Lehn, C., Mützel, E., and Rossmann, A. (2011). Multi-element stable isotope analysis of H, C, N and S in hair and nails of contemporary human remains. Int. J. Legal Med. 125, 695–706. doi: 10.1007/s00414-011-0595-0
Lewis, J., Pike, A. W. G., Coath, C. D., and Evershed, R. P. (2017). Strontium concentration, radiogenic (87Sr/86Sr) and stable (δ88Sr) strontium isotope systematics in a controlled feeding study. STAR Sci. Technol. Archaeol. Res. 3, 45–57. doi: 10.1080/20548923.2017.1303124
Lightfoot, E., and O’Connell, T. C. (2016). On the use of biomineral oxygen isotope data to identify human migrants in the archaeological record: intra-sample variation, statistical methods and geographical considerations. PLoS One 11:e0153850. doi: 10.1371/journal.pone.0153850
Lugli, F., Cipriani, A., Tavaglione, V., Traversari, M., and Benazzi, S. (2018). Transhumance pastoralism of roccapelago (Modena, Italy) early-modern individuals: inferences from Sr isotopes of hair strands. Am. J. Phys. Anthropol. 167, 470–483. doi: 10.1002/ajpa.23643
Macko, S. A., Engel, M. H., Andrusevich, V., Lubec, G., O’Connell, T. C., and Hedges, R. E. (1999a). Documenting the diet in ancient human populations through stable isotope analysis of hair. Philos. Trans. R. Soc. Lond. B. Biol. Sci. 354, 65–76. doi: 10.1098/rstb.1999.0360
Macko, S. A., Lubec, G., Teschler-Nicola, M., Andrusevich, V., and Engel, M. H. (1999b). The Ice Man’s diet as reflected by the stable nitrogen and carbon isotopic composition of his hair. FASEB J. 13, 559–562. doi: 10.1096/fasebj.13.3.559
Mancuso, C. J., and Ehleringer, J. R. (2018). Strontium isotope ratios (87Sr/86Sr) of human fingernail clippings reveal multiple location signals. Rapid Commun. Mass Spectrom. 32, 1922–1930. doi: 10.1002/rcm.8270
Mant, M., Nagel, A., and Prowse, T. (2016). Investigating residential history using stable hydrogen and oxygen isotopes of human hair and drinking water. J. Forensic Sci. 61, 884–891. doi: 10.1111/1556-4029.13066
McCullagh, J. S. O., Tripp, J. A., and Hedges, R. E. M. (2005). Carbon isotope analysis of bulk keratin and single amino acids from British and North American hair. Rapid Commun. Mass Spectrom. 19, 3227–3231. doi: 10.1002/rcm.2150
Meier-Augenstein, W. (2019). Forensic stable isotope signatures: comparing, geo-locating, detecting linkage. WIREs Forensic Sci. 1:e1339. doi: 10.1002/wfs2.1339
Meier-Augenstein, W., Chartrand, M. M. G., Kemp, H. F., and St-Jean, G. (2011). An inter-laboratory comparative study into sample preparation for both reproducible and repeatable forensic 2H isotope analysis of human hair by continuous flow isotope ratio mass spectrometry. Rapid Commun. Mass Spectrom. 25, 3331–3338. doi: 10.1002/rcm.5235
Mekota, A.-M., Grupe, G., Ufer, S., and Cuntz, U. (2006). Serial analysis of stable nitrogen and carbon isotopes in hair: monitoring starvation and recovery phases of patients suffering from anorexia nervosa. Rapid Commun. Mass Spectrom. 20, 1604–1610. doi: 10.1002/rcm.2477
O’Brien, D. M., and Wooller, M. J. (2007). Tracking human travel using stable oxygen and hydrogen isotope analyses of hair and urine. Rapid Commun. Mass Spectrom. 21, 2422–2430. doi: 10.1002/rcm.3108
O’Connell, T. C., and Hedges, R. E. M. (1999). Investigations into the effect of diet on modern human hair isotopic values. Am. J. Phys. Anthropol 108, 409–425. doi: 10.1002/(SICI)1096-8644(199904)108:4<409::AID-AJPA3<3.0.CO;2-E
Petzke, K. J., Boeing, H., Klaus, S., and Metges, C. C. (2005a). Carbon and nitrogen stable isotopic composition of hair protein and amino acids can be used as biomarkers for animal-derived dietary protein intake in humans. J. Nutr. 135, 1515–1520. doi: 10.1093/jn/135.6.1515
Petzke, K. J., Boeing, H., and Metges, C. C. (2005b). Choice of dietary protein of vegetarians and omnivores is reflected in their hair protein 13C and 15N abundance. Rapid Commun. Mass Spectrom. 19, 1392–1400. doi: 10.1002/rcm.1925
Petzke, K. J., Fuller, B. T., and Metges, C. C. (2010). Advances in natural stable isotope ratio analysis of human hair to determine nutritional and metabolic status. Curr. Opin. Clin. Nutr. Metab. Care 13, 532–540. doi: 10.1097/MCO.0b013e32833c3c84
Podlesak, D. W., McWilliams, S. R., and Hatch, K. A. (2005). Stable isotopes in breath, blood, feces and feathers can indicate intra-individual changes in the diet of migratory songbirds. Oecologia 142, 501–510. doi: 10.1007/s00442-004-1737-6
Podlesak, D. W., Torregrossa, A.-M., Ehleringer, J. R., Dearing, M. D., Passey, B. H., and Cerling, T. E. (2008). Turnover of oxygen and hydrogen isotopes in the body water. CO2, hair, and enamel of a small mammal. Geochim. Cosmochim. Acta 72, 19–35. doi: 10.1016/j.gca.2007.10.003
Pötsch, L. (1996). A discourse on human hair fibers and reflections on the conservation of drug molecules. Int. J. Legal Med. 108, 285–293. doi: 10.1007/BF02432122
Remien, C. H., Adler, F. R., Chesson, L. A., Valenzuela, L. O., Ehleringer, J. R., and Cerling, T. E. (2014). Deconvolution of isotope signals from bundles of multiple hairs. Oecologia 175, 781–789. doi: 10.1007/s00442-014-2945-3
Reynard, L. M., Burt, N., Koon, H. E. C., and Tuross, N. (2016). Limits and possibilities in the geolocation of humans using multiple isotope ratios (H, O, N, C) of hair from east coast cities of the USA. Isotopes Environ. Health Stud. 52, 498–512. doi: 10.1080/10256016.2016.1143821
Rubenstein, D. R., and Hobson, K. A. (2004). From birds to butterflies: animal movement patterns and stable isotopes. Trends Ecol. Evol. 19, 256–263. doi: 10.1016/j.tree.2004.03.017
Saul, T. B. (2017). An Exploration of the Effects of Taphonomy on Isotope Ratios of Human Hair. PhD dissertation, University of Tennessee, Knoxville, TN.
Sharp, Z. D., Atudorei, V., Panarello, H. O., Fernández, J., and Douthitt, C. (2003). Hydrogen isotope systematics of hair: archeological and forensic applications. J. Archaeol. Sci. 30, 1709–1716. doi: 10.1016/S0305-4403(03)00071-2
Telmer, K. H. (1998). Biogeochemistry and Water Balance of the Ottawa River Basin. Ottawa: University of Ottawa, doi: 10.20381/ruor-10233
Thompson, A. H., Richards, M. P., Shortland, A., and Zakrzewski, S. R. (2005). Isotopic palaeodiet studies of ancient egyptian fauna and humans. J. Archaeol. Sci. 32, 451–463. doi: 10.1016/j.jas.2004.11.004
Thompson, A. H., Wilson, A. S., and Ehleringer, J. R. (2014). “Hair as a geochemical recorder: ancient to modern,” in Treatise on Geochemistry, 2nd Edn, eds H. D. Holland and K. K. Turekian (Oxford: Elsevier), 371–393. doi: 10.1016/B978-0-08-095975-7.01227-4
Tipple, B. J., Valenzuela, L. O., Chau, T. H., Hu, L., Bataille, C. P., Chesson, L. A., et al. (2019). Strontium isotope ratios of human hair from the United States: patterns and aberrations. Rapid Commun. Mass Spectrom. 33, 461–472. doi: 10.1002/rcm.8378
Tipple, B. J., Valenzuela, L. O., and Ehleringer, J. R. (2018). Strontium isotope ratios of human hair record intra-city variations in tap water source. Sci. Rep. 8:3334. doi: 10.1038/s41598-018-21359-0
Topalov, K., Schimmelmann, A., Polly, P. D., Sauer, P. E., and Viswanathan, S. (2019). Stable isotopes of H, C and N in mice bone collagen as a reflection of isotopically controlled food and water intake. Isotopes Environ. Health Stud. 55, 129–149. doi: 10.1080/10256016.2019.1580279
Valenzuela, L. O., Chesson, L. A., Bowen, G. J., Cerling, T. E., and Ehleringer, J. R. (2012). Dietary heterogeneity among western industrialized countries reflected in the stable isotope ratios of human hair. PLoS One 7:e34234. doi: 10.1371/journal.pone.0034234
Valenzuela, L. O., Chesson, L. A., O’Grady, S. P., Cerling, T. E., and Ehleringer, J. R. (2011). Spatial distributions of carbon, nitrogen and sulfur isotope ratios in human hair across the central United States. Rapid Commun. Mass Spectrom. 25, 861–868. doi: 10.1002/rcm.4934
Vautour, G., Poirier, A., and Widory, D. (2015). Tracking mobility using human hair: what can we learn from lead and strontium isotopes? Sci. Justice 55, 63–71. doi: 10.1016/j.scijus.2014.10.001
Voerkelius, S., Lorenz, G. D., Rummel, S., Quétel, C. R., Heiss, G., Baxter, M., et al. (2010). Strontium isotopic signatures of natural mineral waters, the reference to a simple geological map and its potential for authentication of food. Food Authent. Traceability 118, 933–940. doi: 10.1016/j.foodchem.2009.04.125
Webb, E., White, C., and Longstaffe, F. (2013). Dietary shifting in the Nasca Region as inferred from the carbon- and nitrogen-isotope compositions of archaeological hair and bone. J. Archaeol. Sci. 40, 129–139. doi: 10.1016/j.jas.2012.08.020
West, J. B., Bowen, G. J., Dawson, T. E., and Tu, K. P. (2010). Isoscapes: Understanding Movement, Pattern, and Process on Earth Through Isotope Mapping. Dordrecht: Springer.
White, C. D. (1993). Isotopic determination of seasonality in diet and death from nubian mummy hair. J. Archaeol. Sci. 20, 657–666. doi: 10.1006/jasc.1993.1040
White, C. D., Nelson, A. J., Longstaffe, F. J., Grupe, G., and Jung, A. (2009). Landscape bioarchaeology at pacatnamu, peru: inferring mobility from δ13C and δ15N values of hair. J. Archaeol. Sci. 36, 1527–1537. doi: 10.1016/j.jas.2009.03.008
Keywords: stable isotopes, strontium, hair, mobility, 87Sr/86Sr, isoscape, travel history, multi-isotope
Citation: Hu L, Chartrand MMG, St-Jean G, Lopes M and Bataille CP (2020) Assessing the Reliability of Mobility Interpretation From a Multi-Isotope Hair Profile on a Traveling Individual. Front. Ecol. Evol. 8:568943. doi: 10.3389/fevo.2020.568943
Received: 02 June 2020; Accepted: 24 August 2020;
Published: 15 September 2020.
Edited by:
Gael Le Roux, UMR 5245 Laboratoire Ecologie Fonctionnelle et Environnement (ECOLAB), FranceReviewed by:
Christine Lehn, Ludwig Maximilian University of Munich, GermanyGeorge Kamenov, University of Florida, United States
Copyright © 2020 Hu, Chartrand, St-Jean, Lopes and Bataille. This is an open-access article distributed under the terms of the Creative Commons Attribution License (CC BY). The use, distribution or reproduction in other forums is permitted, provided the original author(s) and the copyright owner(s) are credited and that the original publication in this journal is cited, in accordance with accepted academic practice. No use, distribution or reproduction is permitted which does not comply with these terms.
*Correspondence: Lihai Hu, lihai.hu@uottawa.ca; Clément P. Bataille, cbataill@uottawa.ca
†ORCID: Lihai Hu, orcid.org/0000-0003-2044-0524