 Cheng Zhang
 Xiujuan Lei
 Lian Liu
- School of Computer Science, Shaanxi Normal University, Xi’an, China
Metabolites have been shown to be closely related to the occurrence and development of many complex human diseases by a large number of biological experiments; investigating their correlation mechanisms is thus an important topic, which attracts many researchers. In this work, we propose a computational method named LGBMMDA, which is based on the Light Gradient Boosting Machine (LightGBM) to predict potential metabolite–disease associations. This method extracts the features from statistical measures, graph theoretical measures, and matrix factorization results, utilizing the principal component analysis (PCA) process to remove noise or redundancy. We evaluated our method compared with other used methods and demonstrated the better areas under the curve (AUCs) of LGBMMDA. Additionally, three case studies deeply confirmed that LGBMMDA has obvious superiority in predicting metabolite–disease pairs and represents a powerful bioinformatics tool.
Introduction
Metabolism is a series of ordered chemical reactions, which has a significant influence on biological life maintenance, such as the organism’s growth, reproduction, and reaction to the external environment (Dunn and Ellis, 2005). Metabolic processes are usually divided into two types. The first type is decomposing large molecules to acquire energy, such as cell respiration, while the other type is utilizing energy for the synthesis of each part inside the cells, such as nucleic acids and proteins (Cheng et al., 2017). In unhealthy conditions, relevant products in metabolism (metabolites) will be abnormal, which indicates that finding more disease-related metabolites is beneficial to disease prevention and treatment (Boja et al., 2014). Consequently, it is of high importance to identify the relationship among metabolites and diseases.
Although some traditional techniques of metabolomics has prompted their analysis and development, such as nuclear magnetic resonance (NMR) spectroscopy or liquid/gas chromatography-mass spectrometry (LC/GC-MS) (Xianlin et al., 2011; Tang et al., 2014), the proportion of undiscovered associations between metabolites and diseases is still high. Moreover, some limitations exist, such as the time and funds required to mine disease-related metabolites in biological experiments. Therefore, effective computational methods for predicting disease-related metabolites are attracting more and more attention, which is beneficial to promoting the development to discover potential metabolite–disease associations. The idea of Random Walk with Restart for MiRNA-Disease Association (RWRMDA) (Hu et al., 2018) is to construct a metabolite–metabolite functional similarity network and implement RWR from known disease-related metabolite seed nodes to prioritize potential disease-related ones. However, this method uses less information for diseases or metabolites when calculating similarities, and its predictive performance needs to be improved.
In this article, we present a computational method, LGBMMDA, based on Light Gradient Boosting Machine (LightGBM) (Ke et al., 2017), to identify metabolite–disease associations (Figure 1). Firstly, we extract the data of metabolite-related pathways as part of the integrated similarity network. Secondly, features are selected from the relevant similarity network and known metabolite–disease associations using the statistical measures, graph theoretical measures, and matrix factorization measures. Furthermore, the principal component analysis (PCA) (Deutsch, 2004) algorithm, which is a technique for analyzing and simplifying datasets, is utilized to extract deep features. Thirdly, the LightGBM classifier is utilized to obtain the potential association scores. In addition, the LOOCV and fivefold cross-validation are adopted to evaluate the performance of LGBMMDA, which achieves 0.9738 and 0.9715, respectively. Besides, three types of case studies for common diseases are carried out to evaluate the ability of the method to predict metabolites. These aforementioned experiments show that LGBMMDA is a reliable and excellent model to infer unknown metabolites–diseases associations.
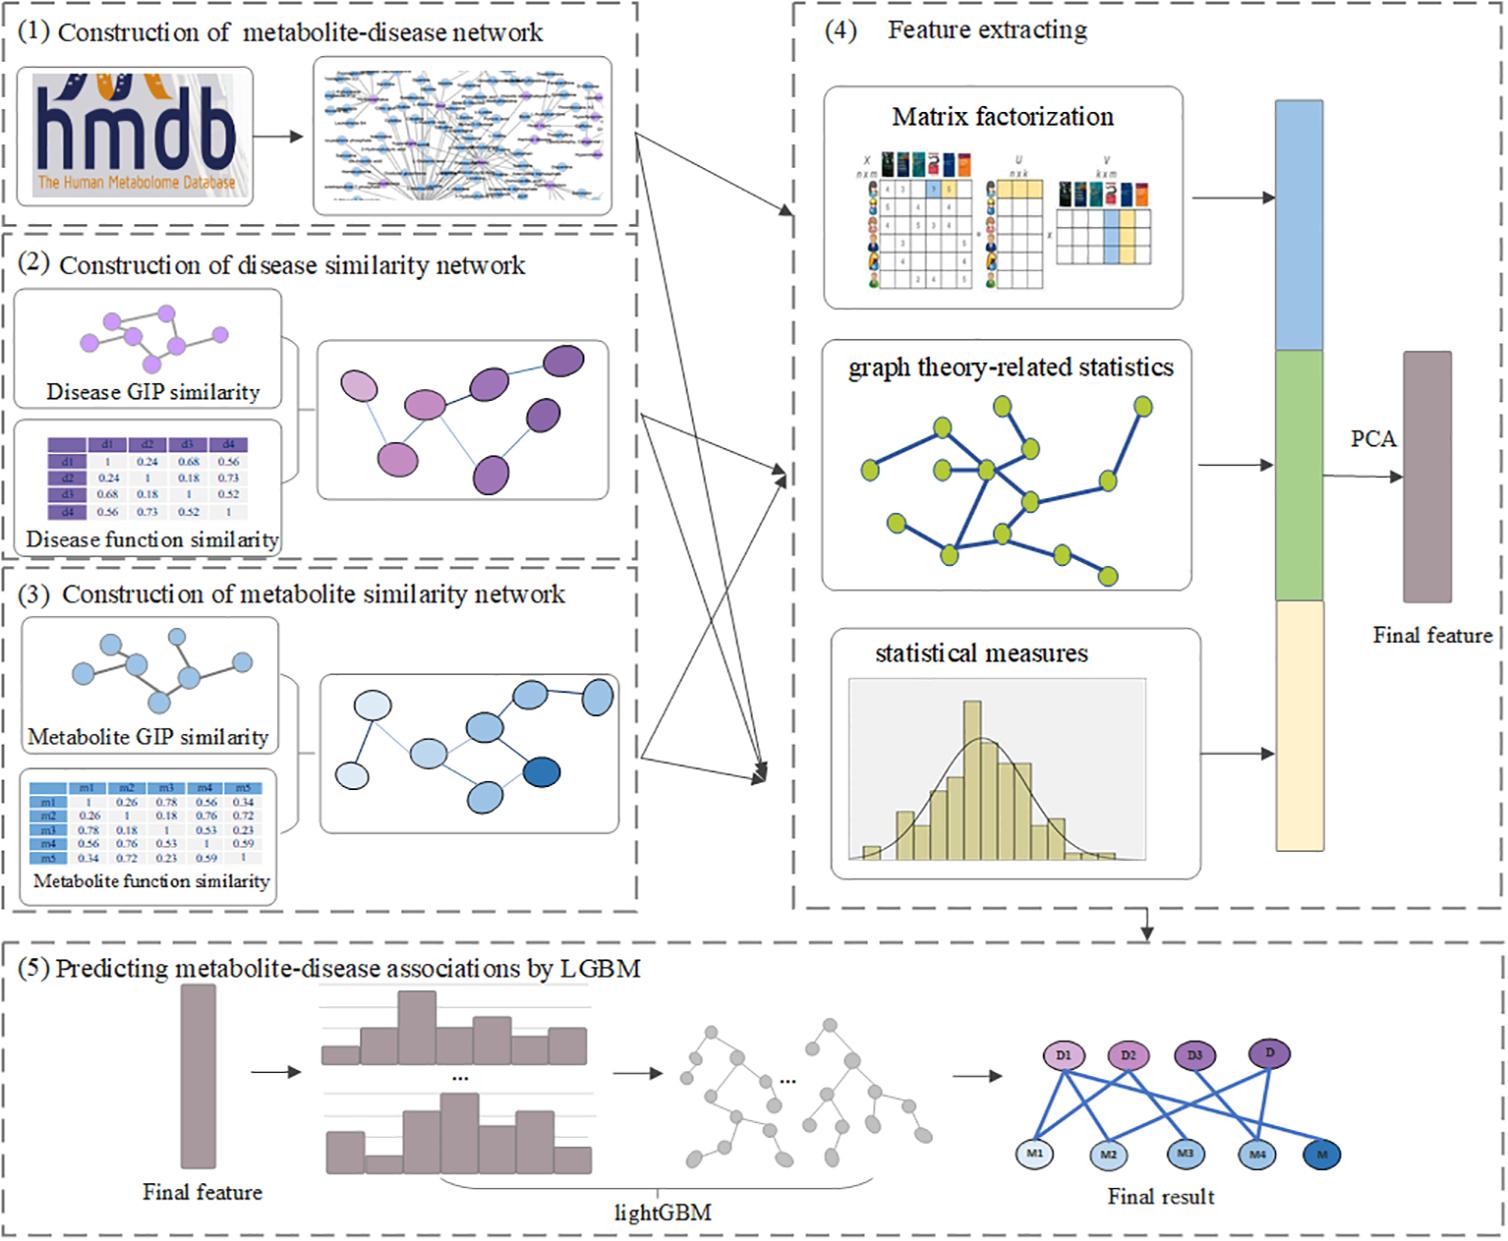
Figure 1. The flowchart of LGBMMDA.
Materials and Methods
Human Metabolite–Disease Associations
We extracted the experimentally confirmed human metabolite–disease associations from the last updated database (HMDB) (Wishart et al., 2017). Then, we performed the following steps on these associations: Firstly, the disease-related symptoms from the human symptom–disease network (HSDN) (Zhou et al., 2014; Ma et al., 2016) are used to calculate disease similarity after repeated associations; thus, the diseases that do not exist in the HSDN are removed. Secondly, the metabolite-related pathways from HMDB become part of the metabolite similarities, such that we keep the metabolites that are relevant to the diseases we selected. Finally, we obtain 127 diseases and 794 metabolites, which have 1,908 experimentally human metabolite–disease associations (see Figure 2). The parameters nm and nd represent the number of metabolites and diseases, respectively. Matrix M represents the adjacency matrix of metabolite–disease associations, such that the entity M(i,j) in row i and column j is 1 if disease i is associated with metabolite j and 0 otherwise.
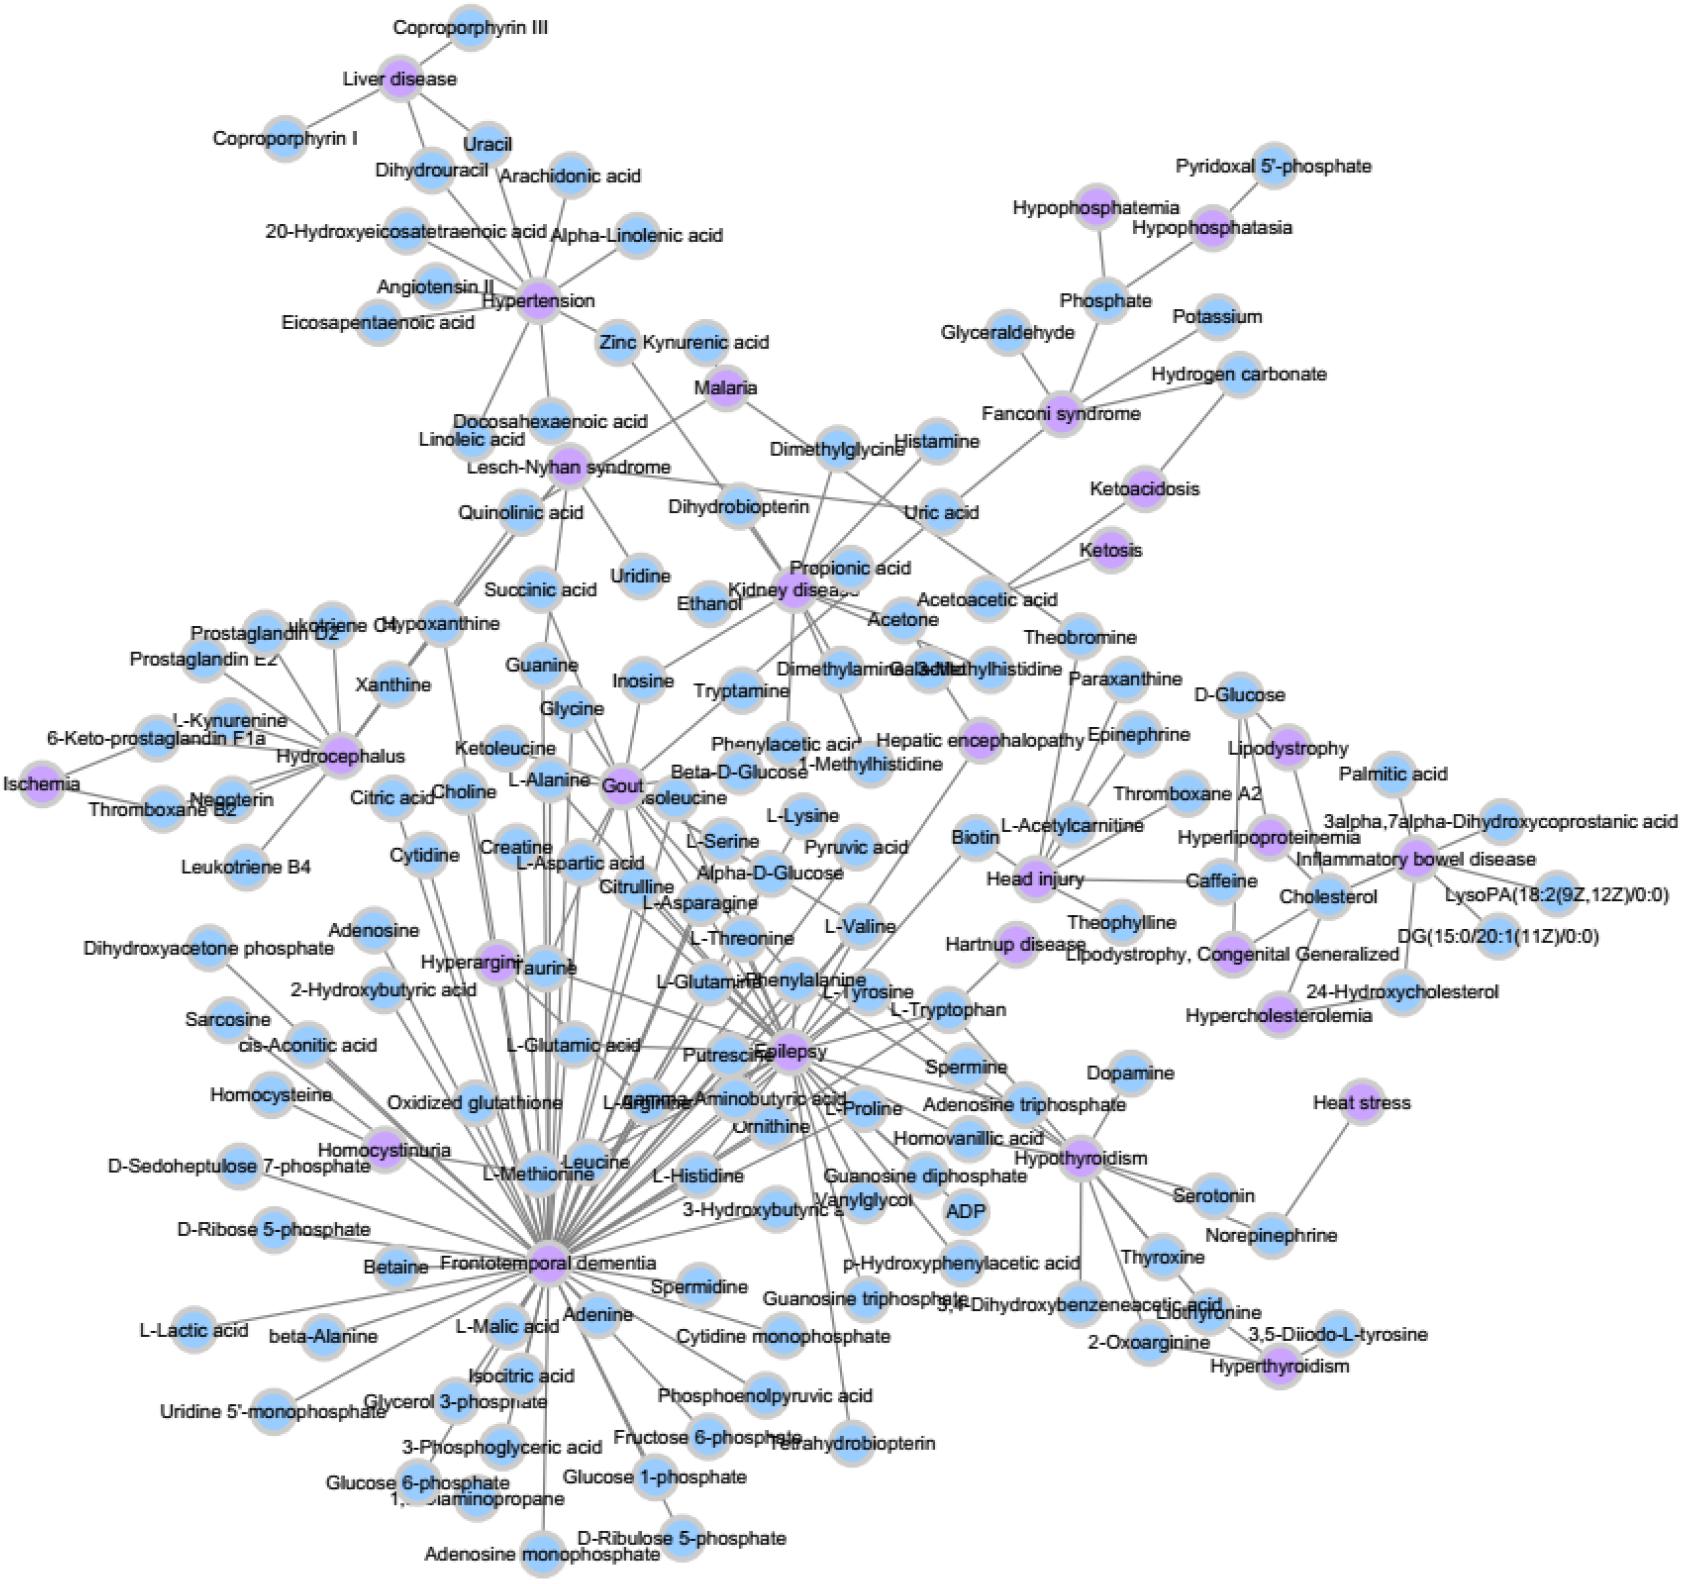
Figure 2. A part of known metabolite–disease association network.
Metabolite Functional Similarity
According to the hypothesis that metabolites with similar functions have a higher probability of possessing similar pathways, we utilize the Hamming similarity (Charikar, 2002) to measure the functional similarity of two metabolites by considering their related pathways. The metabolite functional similarity matrix is defined as MHS(nm × nm), such that the element value is calculated as follows (Zhang et al., 2020)
where MHS(mi,mj) represents the Hamming similarity between metabolite node m_i and m_j; np denotes the number of pathways. If there are existing associations between the metabolite i and pathway k, MP(k,i) is set to 1 in metabolite-pathway association network (MP).
Disease Functional Similarity
Considering the assumption that two diseases with similar functions usually have similar symptoms, the values of two disease-related symptom sets are used to obtain their functional similarities. Let the sets and sets describe the symptom sets of diseases a and b, where as and bs denote the number of symptoms associated with diseases a and b, respectively. Firstly, we calculate the information entropy of as follows (Gu et al., 2017)
where Tn denotes the number of disease-symptom associations, is the number of the ith symptom related with disease a in the disease-symptom set,represents the frequency about the ith symptom associated with disease a, and is the information entropy of . The normalized mutual information (NMI) of and is used to measure the functional similarity between disease a and b as follows:
where matrix DNF represents the functional similarity matrix; , , and denote the information entropy of , and the intersection set of and , respectively.
Gaussian Interaction Profile Kernel Similarity
Following literature (Gu et al., 2017) the GIP kernel for the similarities about diseases and metabolites captures the key features of the metabolite–disease association data. Calculating such kind of similarities is based on the assumption that similar diseases are more likely to contain functionally similar metabolites, and vice versa. Let the binary vector V(di), which is the row vector of the matrix M where the disease d_i is located, represent the interaction profiles of disease d_i. Then, the relevant similarities for diseases DGS(d_i,dj) between the diseases d_i and d_j can be shown as follows:
where ωd is a parameter that controls the kernel bandwidth, acquired by normalizing the new bandwidth parameter . Similarly, the GIP kernel of the similaritiesMGS(mi,mj) between metabolites m_i and m_j is defined as follows:
where ωm is a parameter that controls the kernel bandwidth, acquired by normalizing the new bandwidth parameter .
Integrated Similarity for Metabolites and Diseases
In order to ensure that similarity information exists for every pair in metabolites or diseases, we integrated the disease functional similarities with GIP kernel similarities, which is shown as follows:
where IDS(di,dj) represents the integrated disease similarities. Similarly, the integrated metabolite similarity matrix (IMS) is given as follows:
Feature Extraction
Firstly, type 1 features (F1), which consist of the values of the sum, mean, and histogram distributions of metabolite/disease similarities, are calculated using the statistical measures for each disease/metabolite. We start by calculating the number of known associations in the relevant ith row/jth column of M. Then, the average of all similarity scores is computed according to the ith/jth row of IDS/IMS. Simultaneously, the similarity scores that ranges at [0, 1] are split into n parts (n = 5 in this work), and the proportion of similarity scores for d(j)/m(i) that fell into each part are counted as the histogram feature.
Secondly, type 2 features (F2) are calculated, which include the information about graph theory-related statistics. Before obtaining this type of features, we construct the unweighted graph, in which two nodes have an edge if their similarity score is beyond the mean value of all entities in IDS/IMS. Then, we extract the relevant neighbors’ information, betweenness, closeness, eigenvector centrality, and PageRank (Franceschet, 2010) scores of the disease/metabolite similarity network in an unweighted graph.
Thirdly, type 3 features (F3) are calculated. These features consist of the information about metabolite–disease pairs based on matrix factorization of M. The nonnegative matrix factorization (NMF) (Lee and Seung, 1999; Akbar et al., 2020), which was proposed by Lee and Seung, 1999, can help to solve the matrix sparsity problem. Thus, the metabolite–disease association matrix M can be factorized into two low-rank feature matrices A ∈ Rnm*k and B ∈ Rk*nd, where k denotes the dimension of the metabolite and disease features in the low-rank spaces (k = 20).
Finally, the feature sets F(i,j) = [F1,F2,F3] for disease i and metabolite j is obtained. Meanwhile, PCA is applied to extract the more useful features.
Light Gradient Boosting Machine
Some boosting algorithms, such as the Gradient Boosting Decision Tree (GBDT) and eXtreme Gradient Boosting (XGBoost), have a common weakness that all the sample points for every feature are scanned when obtaining the best segmentation point; this is very time-consuming and computationally expensive to meet current needs. In order to reduce the cost of the experiment, we use LightGBM as the classifier (Friedman, 2001; Ke et al., 2017). LightGBM includes two main algorithms: Gradient-Based One-Side Sampling (GOSS) and Exclusive Feature Bundling (EFB).
In the GOSS algorithm, the training instances are firstly ranked according to the absolute values of their gradients in descending order. Then, the top-a ×100% instances with the larger gradients are kept and combined into an instance subset A. Besides, the (1−a)×100% instances with the smaller gradients are integrated in the remaining set Ac, and a further subset B with the size b×|AC| is randomly sampled. Finally, the instances are split according to the estimated variance gain over the subset A⋃B. The variance gain of splitting feature j at point d is shown as follows (Ke et al., 2017)
whereAl={xi ∈ A:xij≤d},Ar={xi ∈ A:xij > d},Bl={xi ∈ B:xij≤d},Br={xi ∈ B:xij > d}, and is used to normalize the sum of the gradients over B back to the size of Ac. Each x_i is a vector with the dimension s in space XS. In every gradient boosting iteration, the negative gradients of the loss function with respect to the output of the model are defined as {g1, ..., gn}, where n is the number of vectors in space XS.
In the EFB algorithm, unnecessary computation for zero feature values is avoided by binding mutually exclusive features together in a histogram to form a feature. There are two main ideas for EFB. In algorithm 1, the function is to consider which features should be bundled together, while algorithm 2 determines how to construct the bundle as follows (Ke et al., 2017):
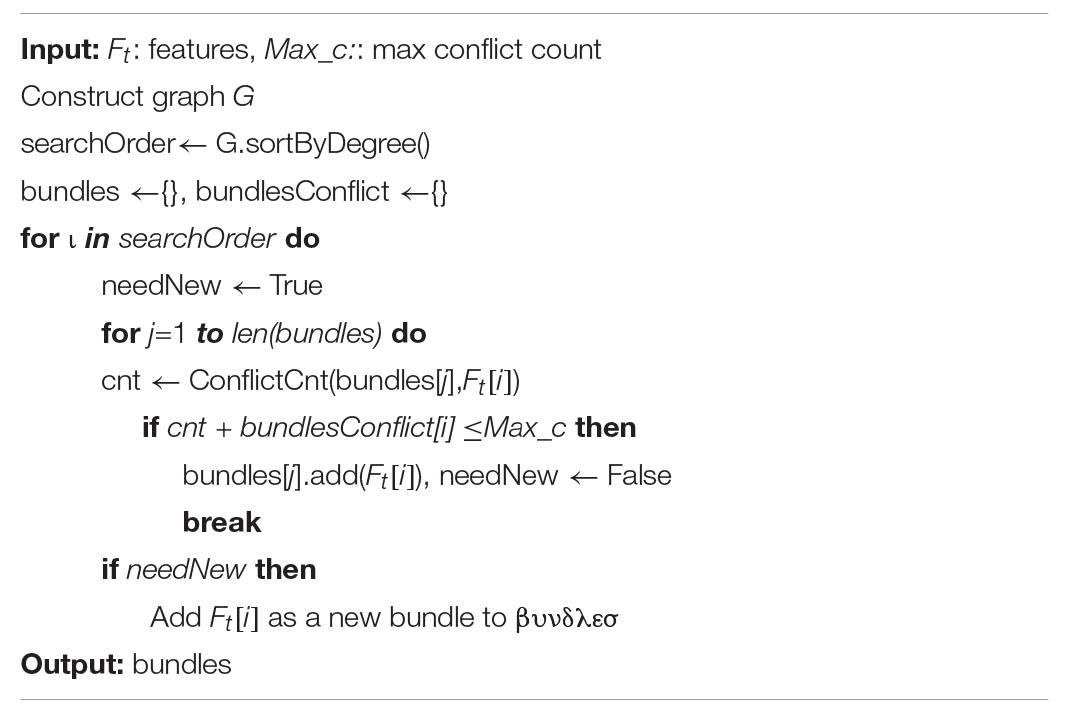
Algorithm 1. Greedy bundling.
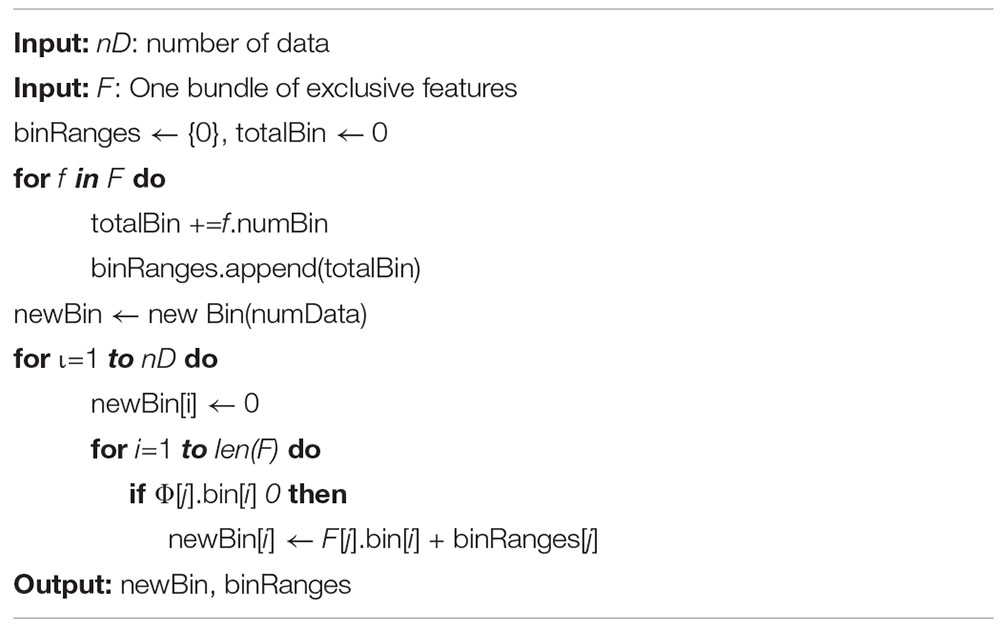
Algorithm 2. Merge exclusive features.
Results
In this section, we utilize LOOCV and fivefold cross-validation to evaluate the performance of LGBMMDA. In LOOCV, each confirmed metabolite–disease pair is treated as the test set in turn, while the other confirmed pairs are regarded as training sets. Besides, the unconfirmed associations are regarded as potential candidates for true associations. We plot the ROCs curves and use the area under the ROC curve (AUC) as the evaluating indicator. Furthermore, we also use fivefold cross-validation as an evaluation tool to verify the performance of our method. In this method, the known information about metabolites and diseases is randomly divided into five equal parts. Then, each part is used as the test set in turn, while the other four parts represent the training set. This helps to avoid having the test and training data overlapping with each other and ensures unbiased comparisons. In this study, we compare our method with some state-of-the-art methods, including the label propagation algorithm (LP), which is a semi-supervised learning method based on graph (and its basic idea is to predict the label information of unlabeled nodes by using the label information of labeled nodes); random walk (RWR), which is close to Brownian motion and is the ideal mathematical state of Brownian motion; logistic regression (LR), which is a machine learning method solving binary (0 or 1) problems and estimating the possibility of something; and decision tree (DT), which is the process of classifying data through a series of rules. The results show that LGBMMDA achieved AUC values of 0.9738 and 0.9715 in LOOCV and fivefold cross-validation, respectively (see Figures 3, 4). In addition, we analyze the scores of known associations about LOOCV and count the number of known associations correctly identified by each algorithm (see Figure 5). It can be seen from Figure 6 that our proposed method is superior to other methods in terms of precision, recall, and F1-measure (0.898596, 0.90566, and 0.9021, respectively). Although the precision of LR is higher than our method, the recall of LR is significantly lower. Our method is steadier than LR.
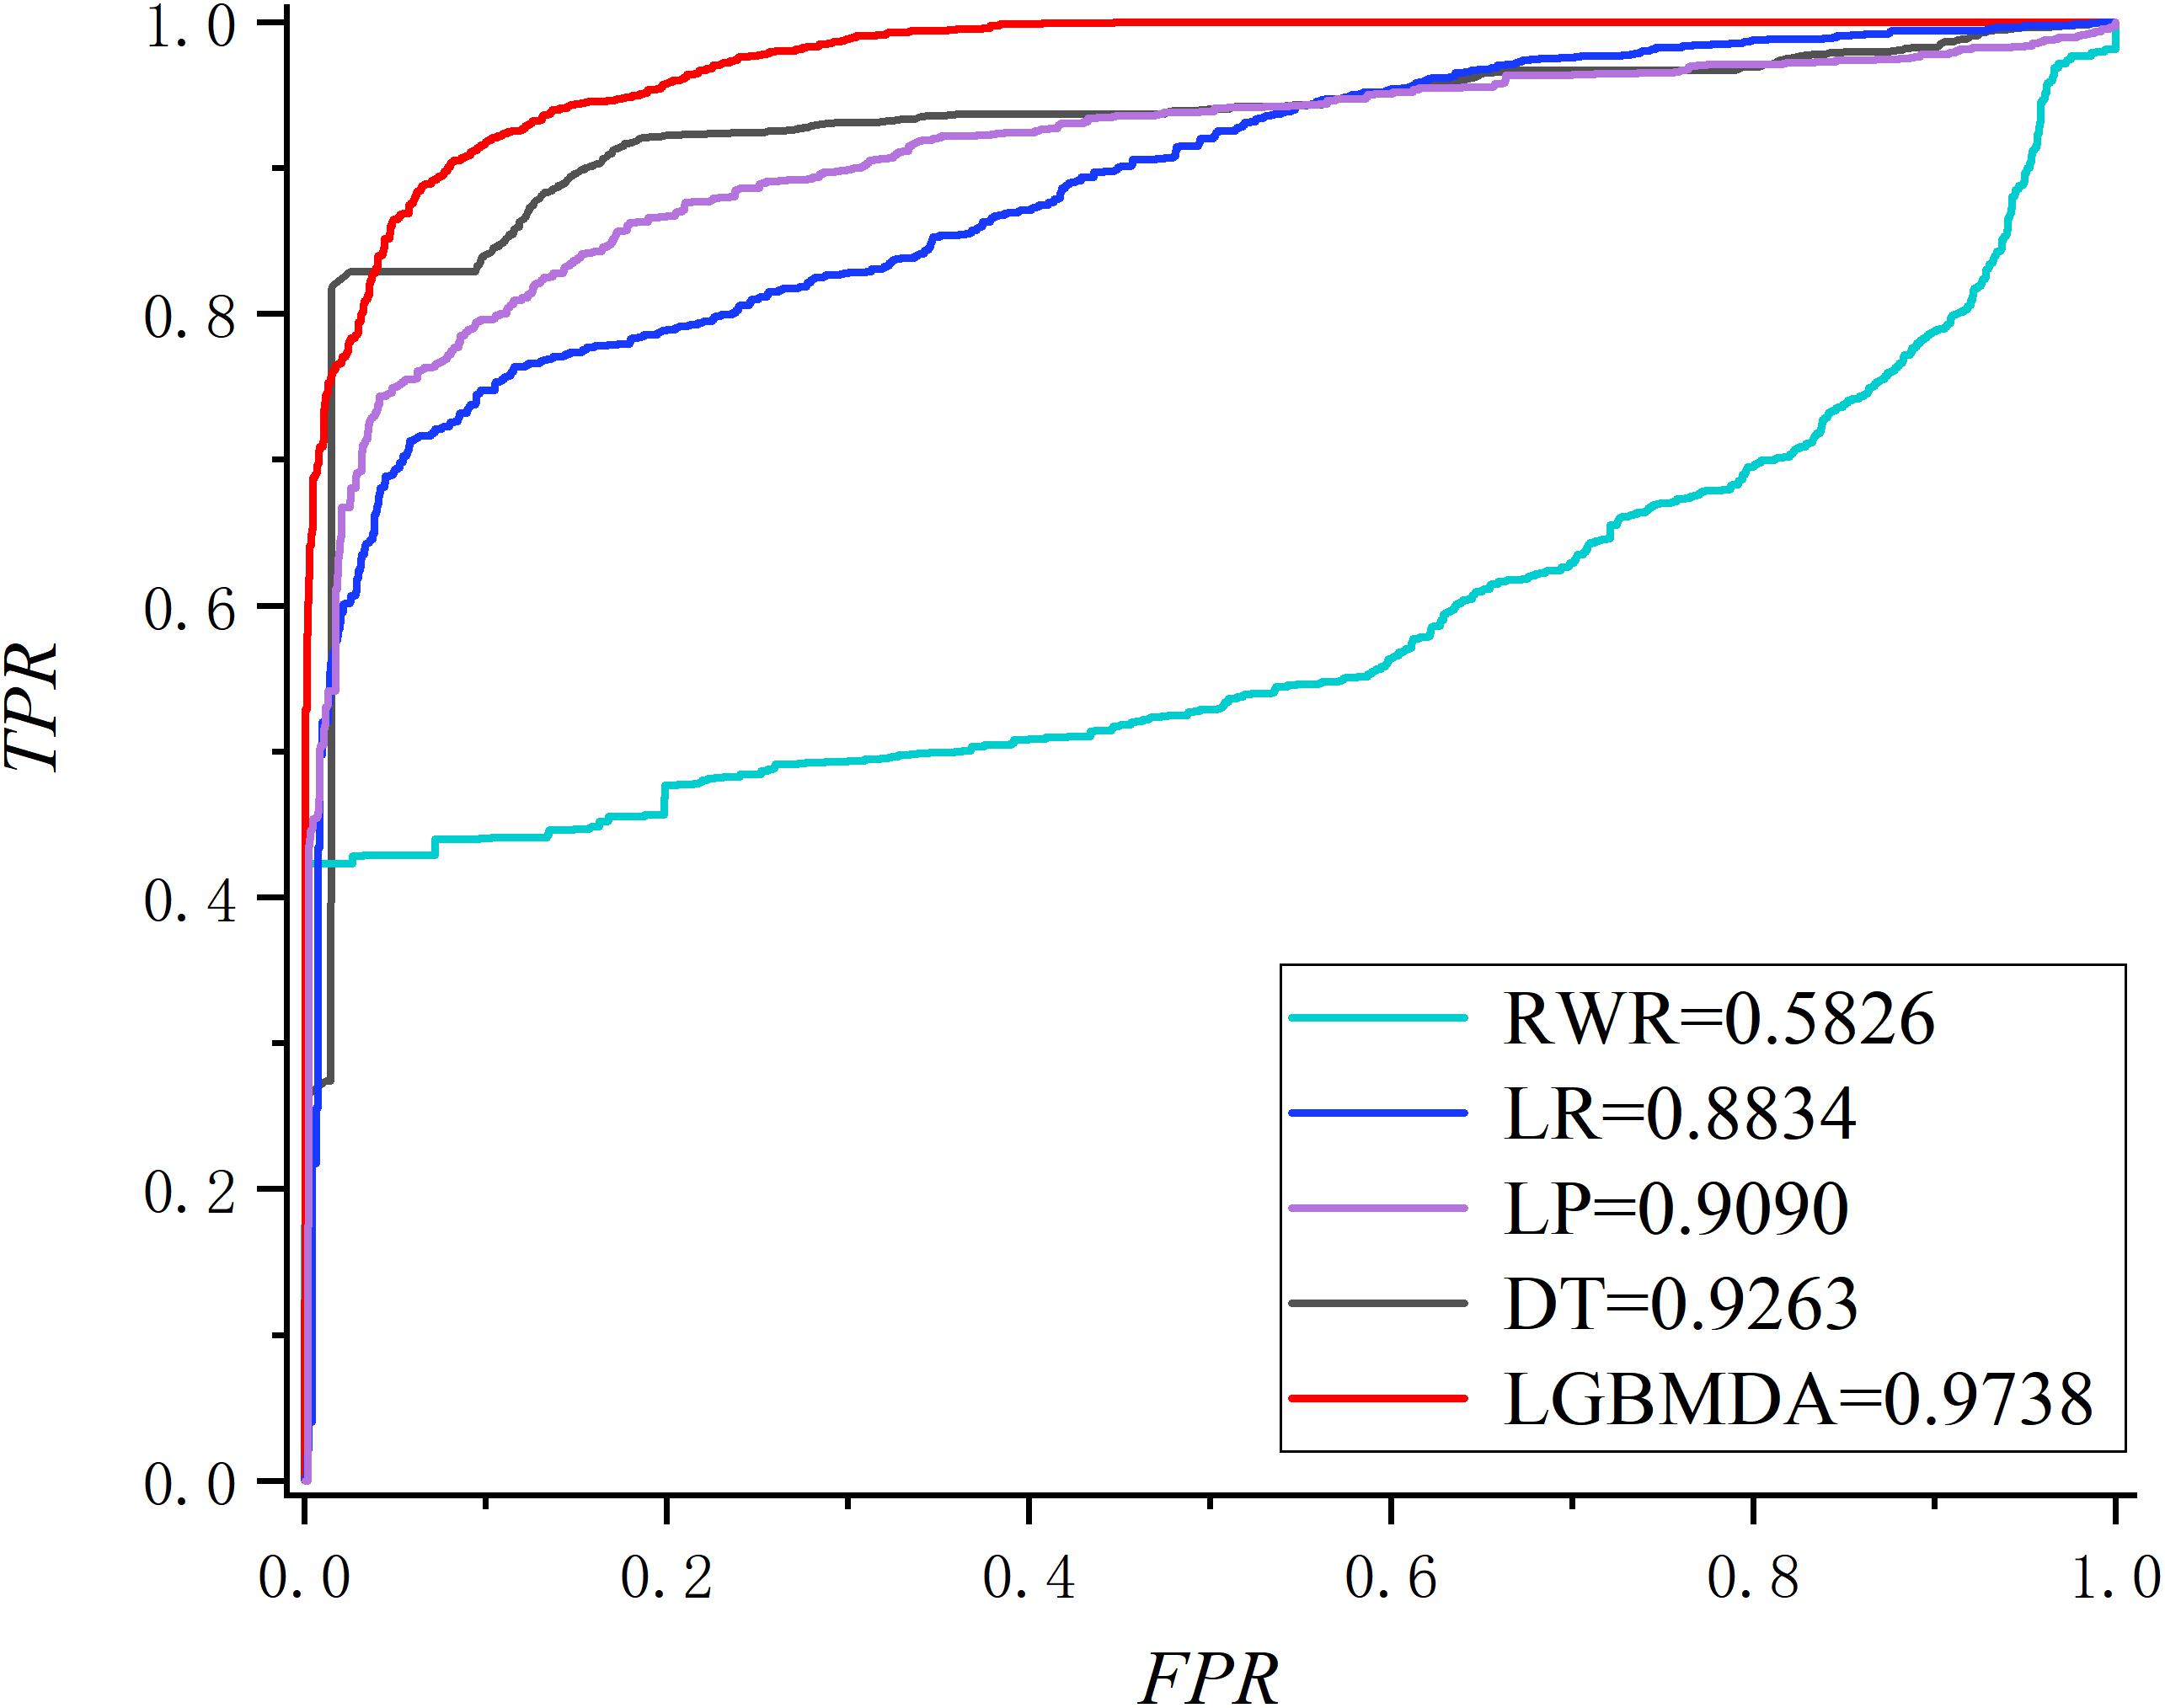
Figure 3. The ROC about LOOCV.
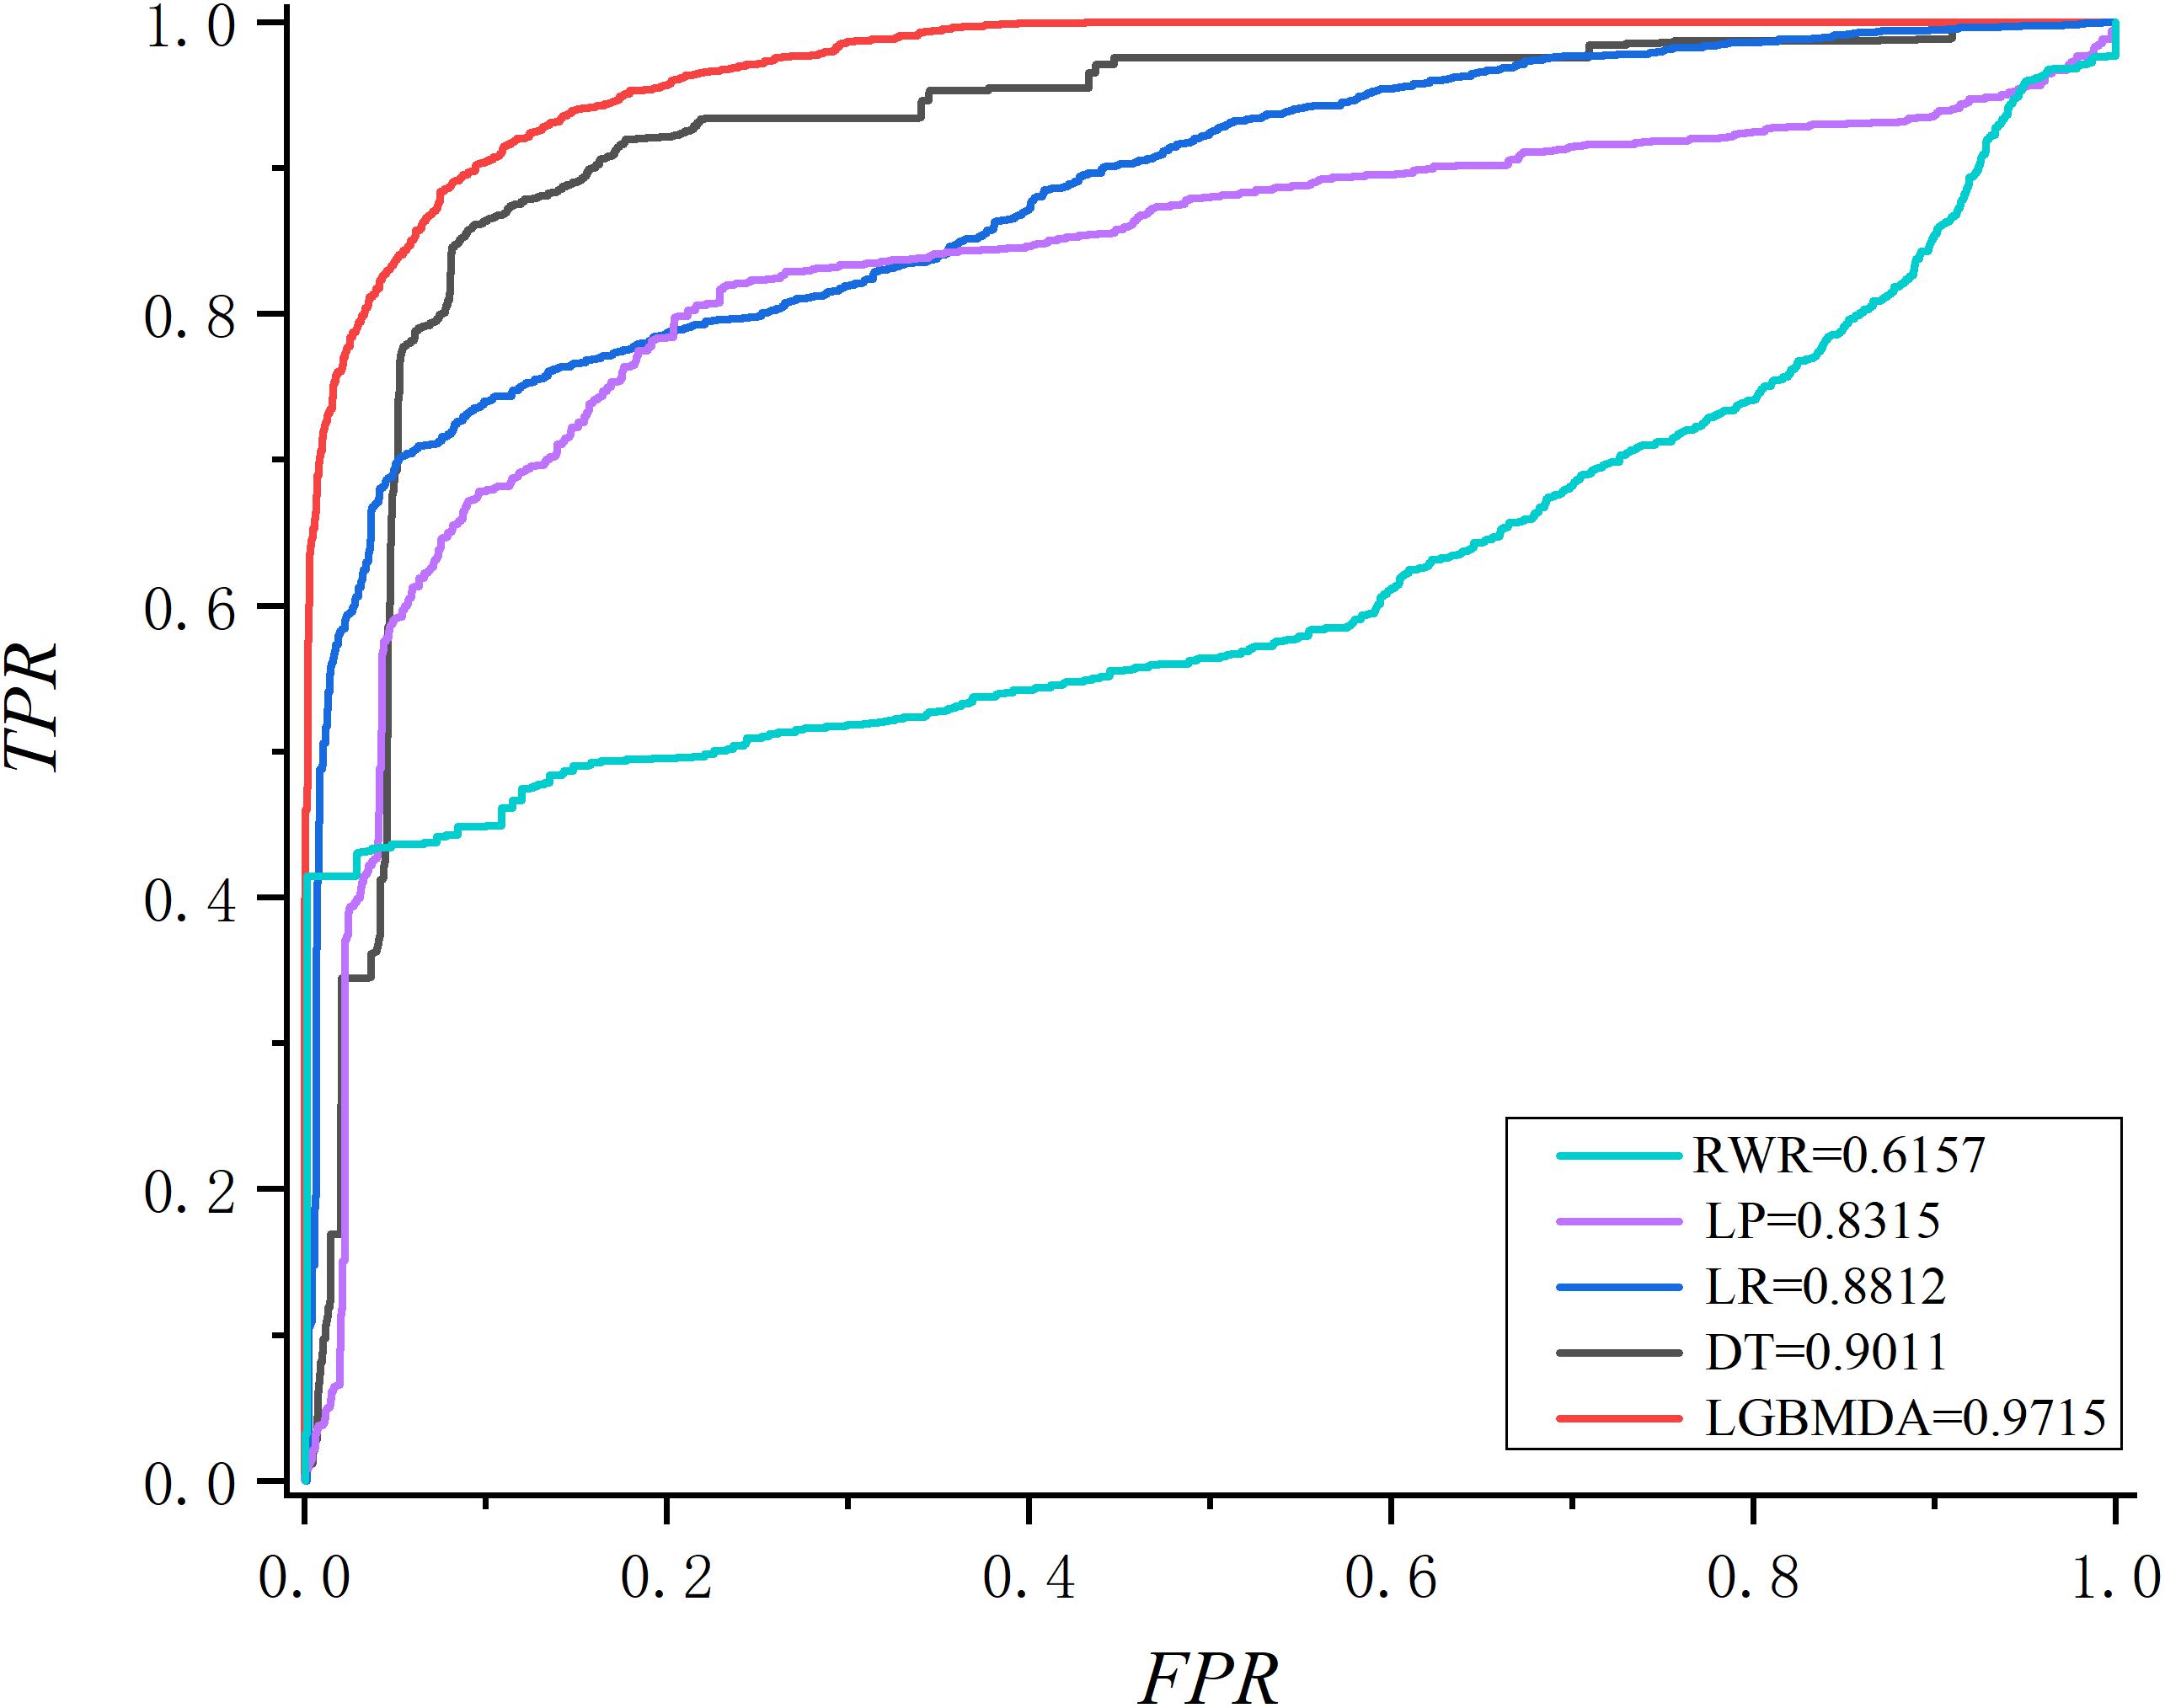
Figure 4. The ROC about fivefold cross validation.
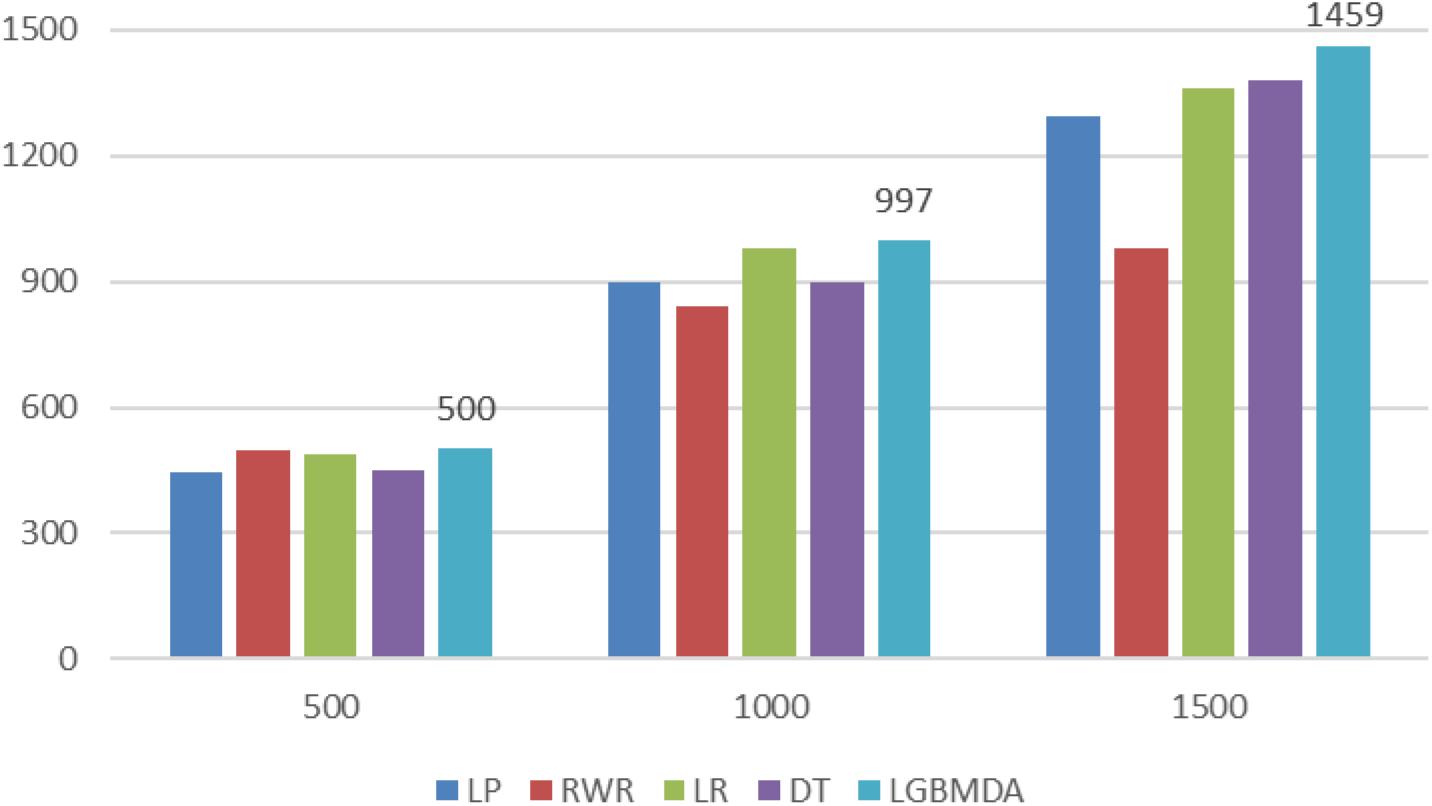
Figure 5. Comparison of the top k ranks with different methods.
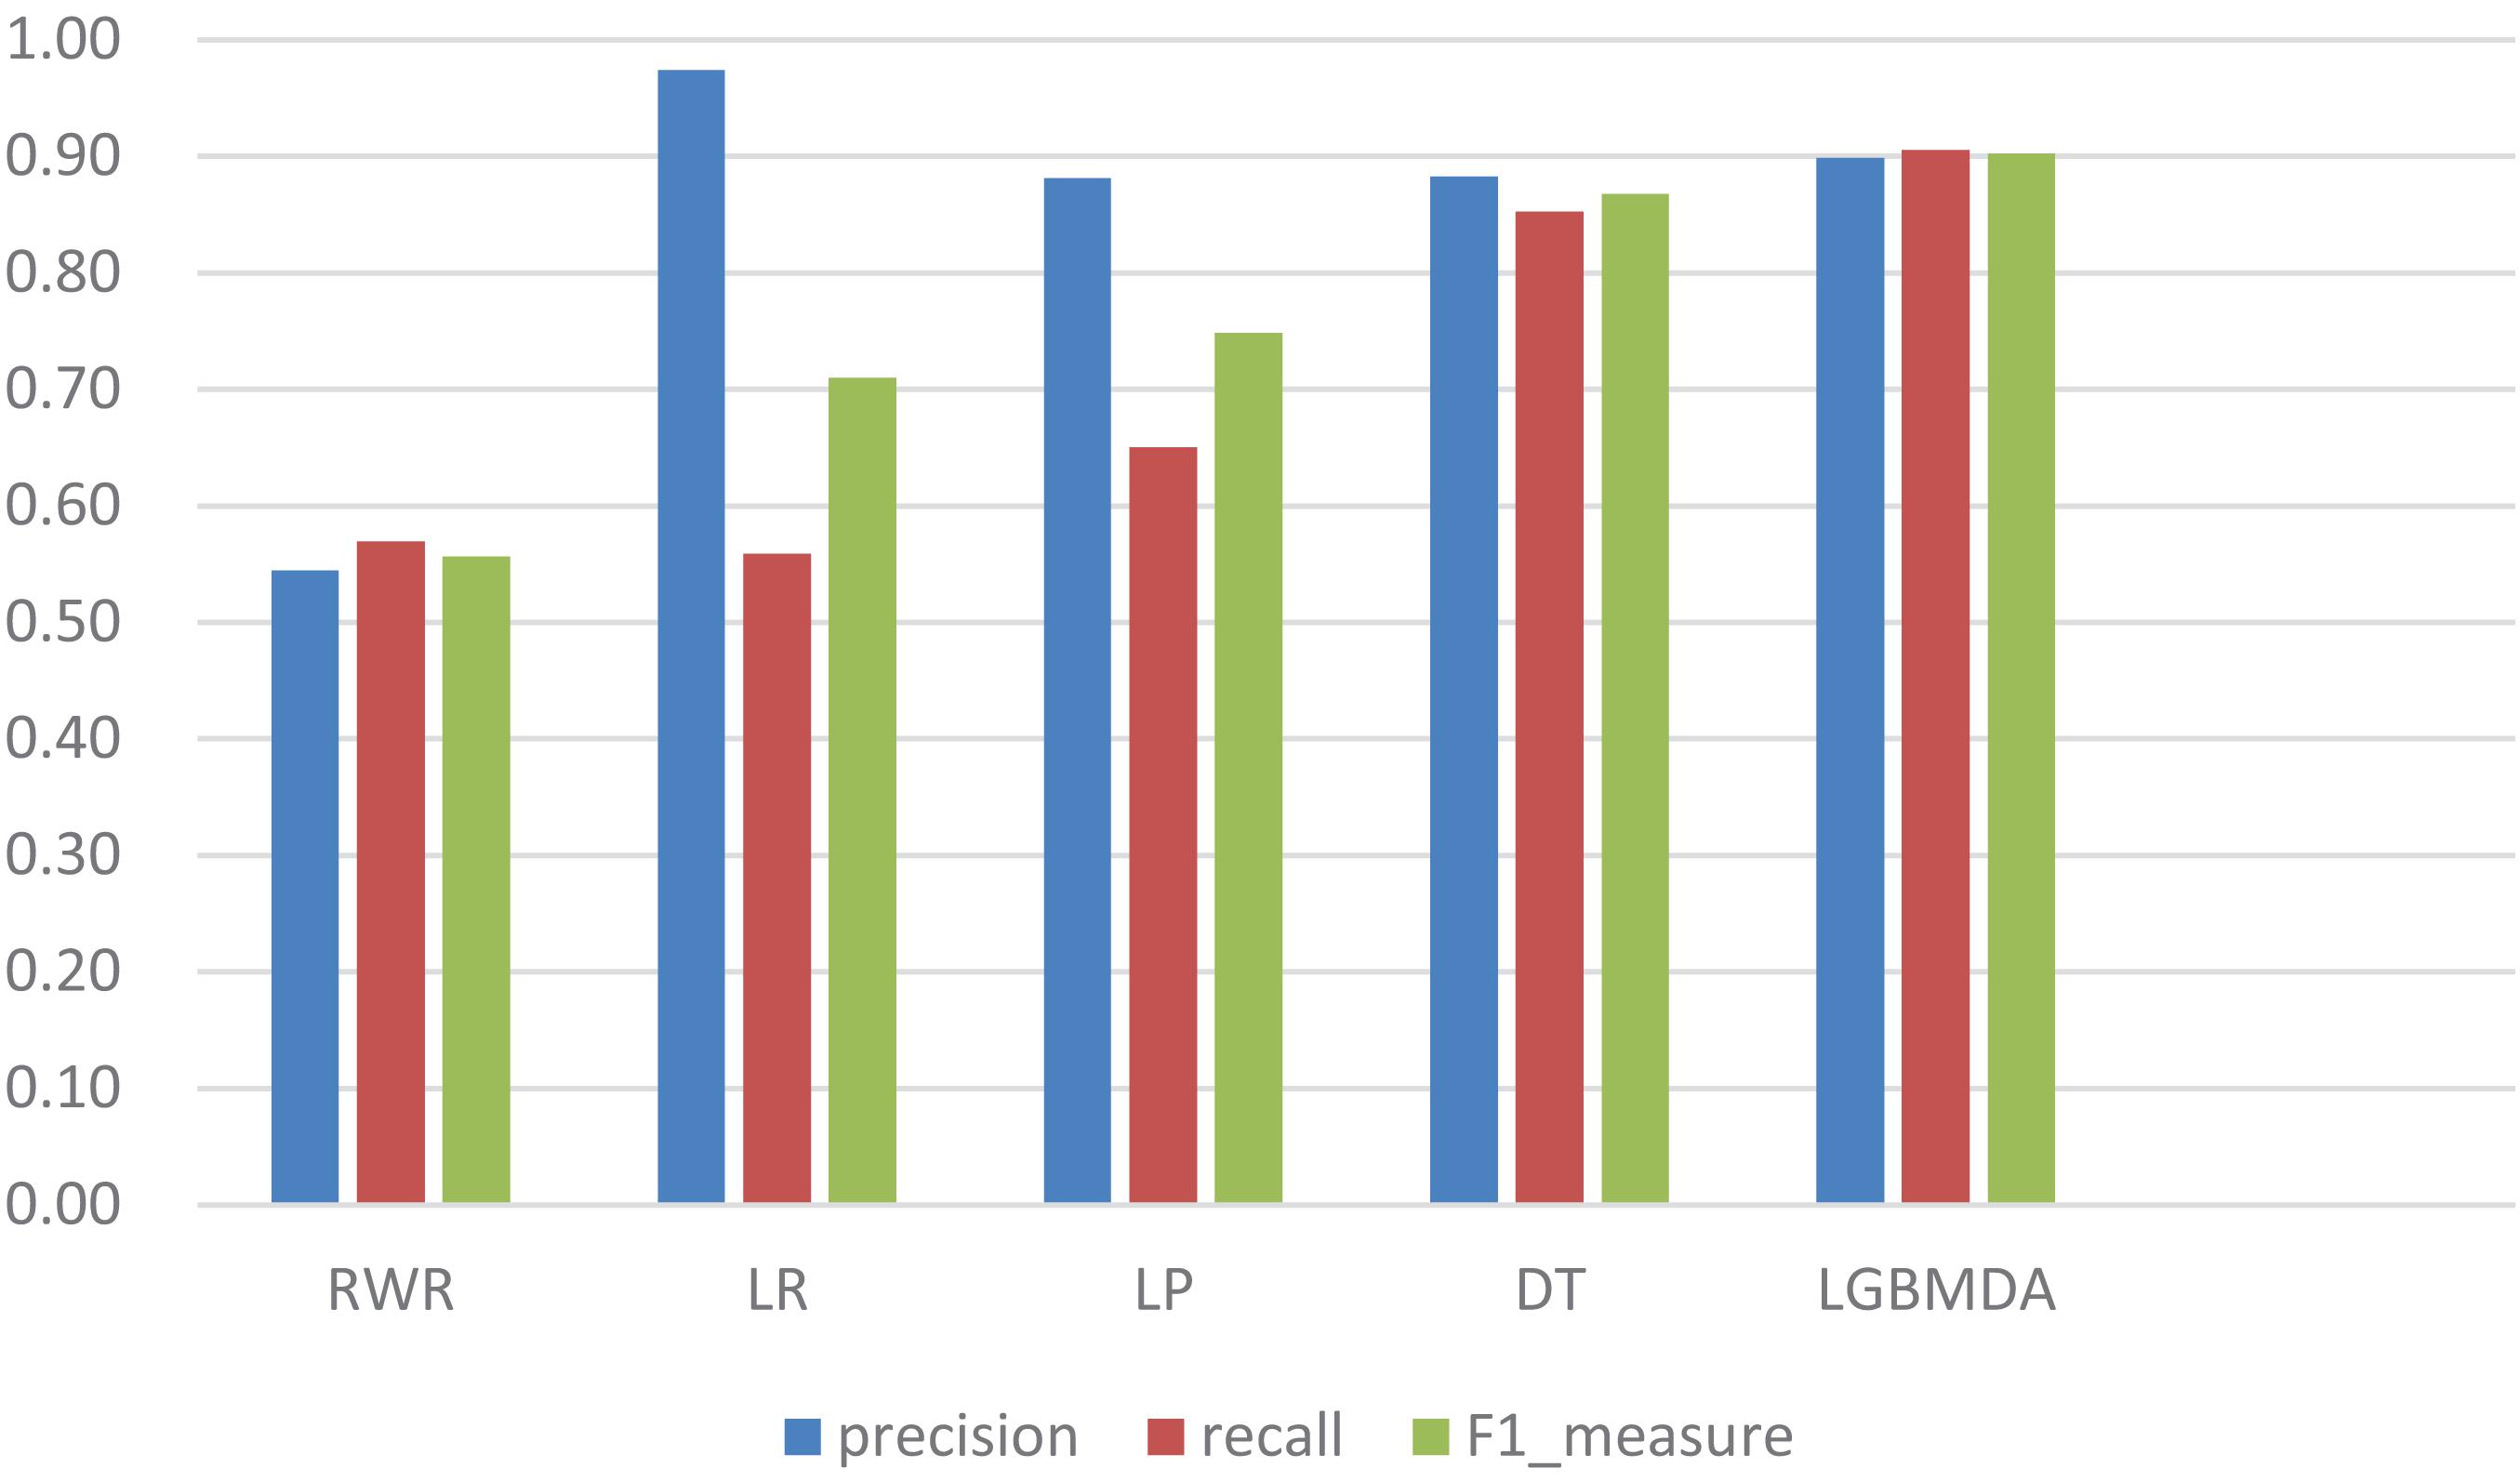
Figure 6. Comparison of the precision, recall, and F1_measure with different methods.
Parameter Analysis
In this section, we select some significant parameters to be adjusted in LightGBM. Firstly, we set the parameter n_estimators, which is related to the number of residual trees, from 100 to 500, while other important parameters are set to default. Figure 1 shows that we get better results when n_estimators is set to 300 (see Figure 7). In order to improve the accuracy, the values of the parameter max_depth, which limits the maximum depth of the tree model, is set from 3 to 8, and num_leaves, which controls the number of leaf nodes, is set from 5 to 100. As a result, max_depth = 7 and num_leaves = 15 achieve better performance (see Figure 8). Finally, the range of max_bin, which has an effect on overfitting, is set from 5 to 256, and min_data_in_leaf, which is the minimum number of samples contained on a leaf node, is set from 1 to 100. The results show that max_bin = 45 and min_data_in_leaf = 51 are better than other values (see Figure 9).
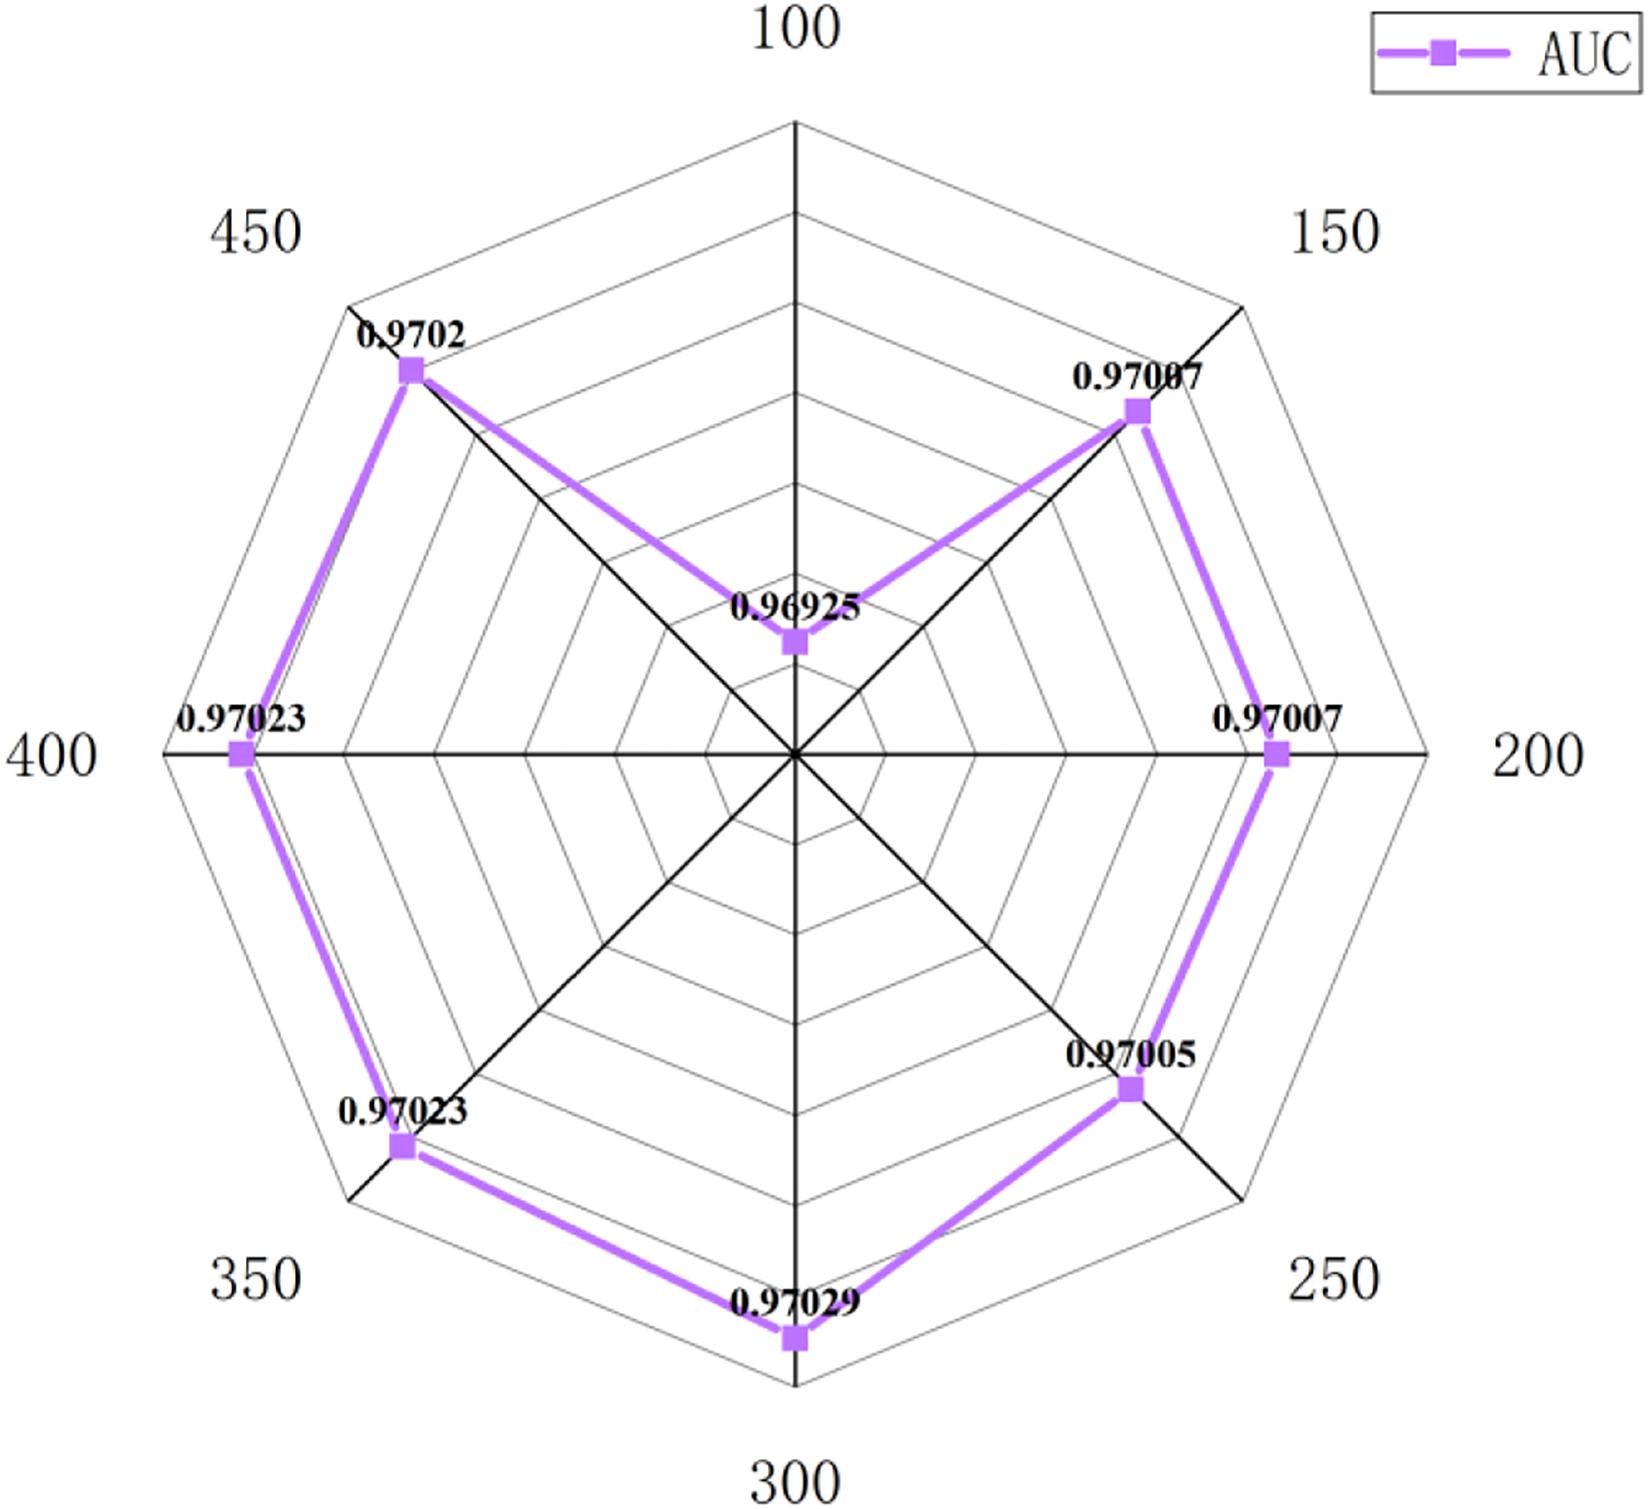
Figure 7. The AUC value of different n_estimators.
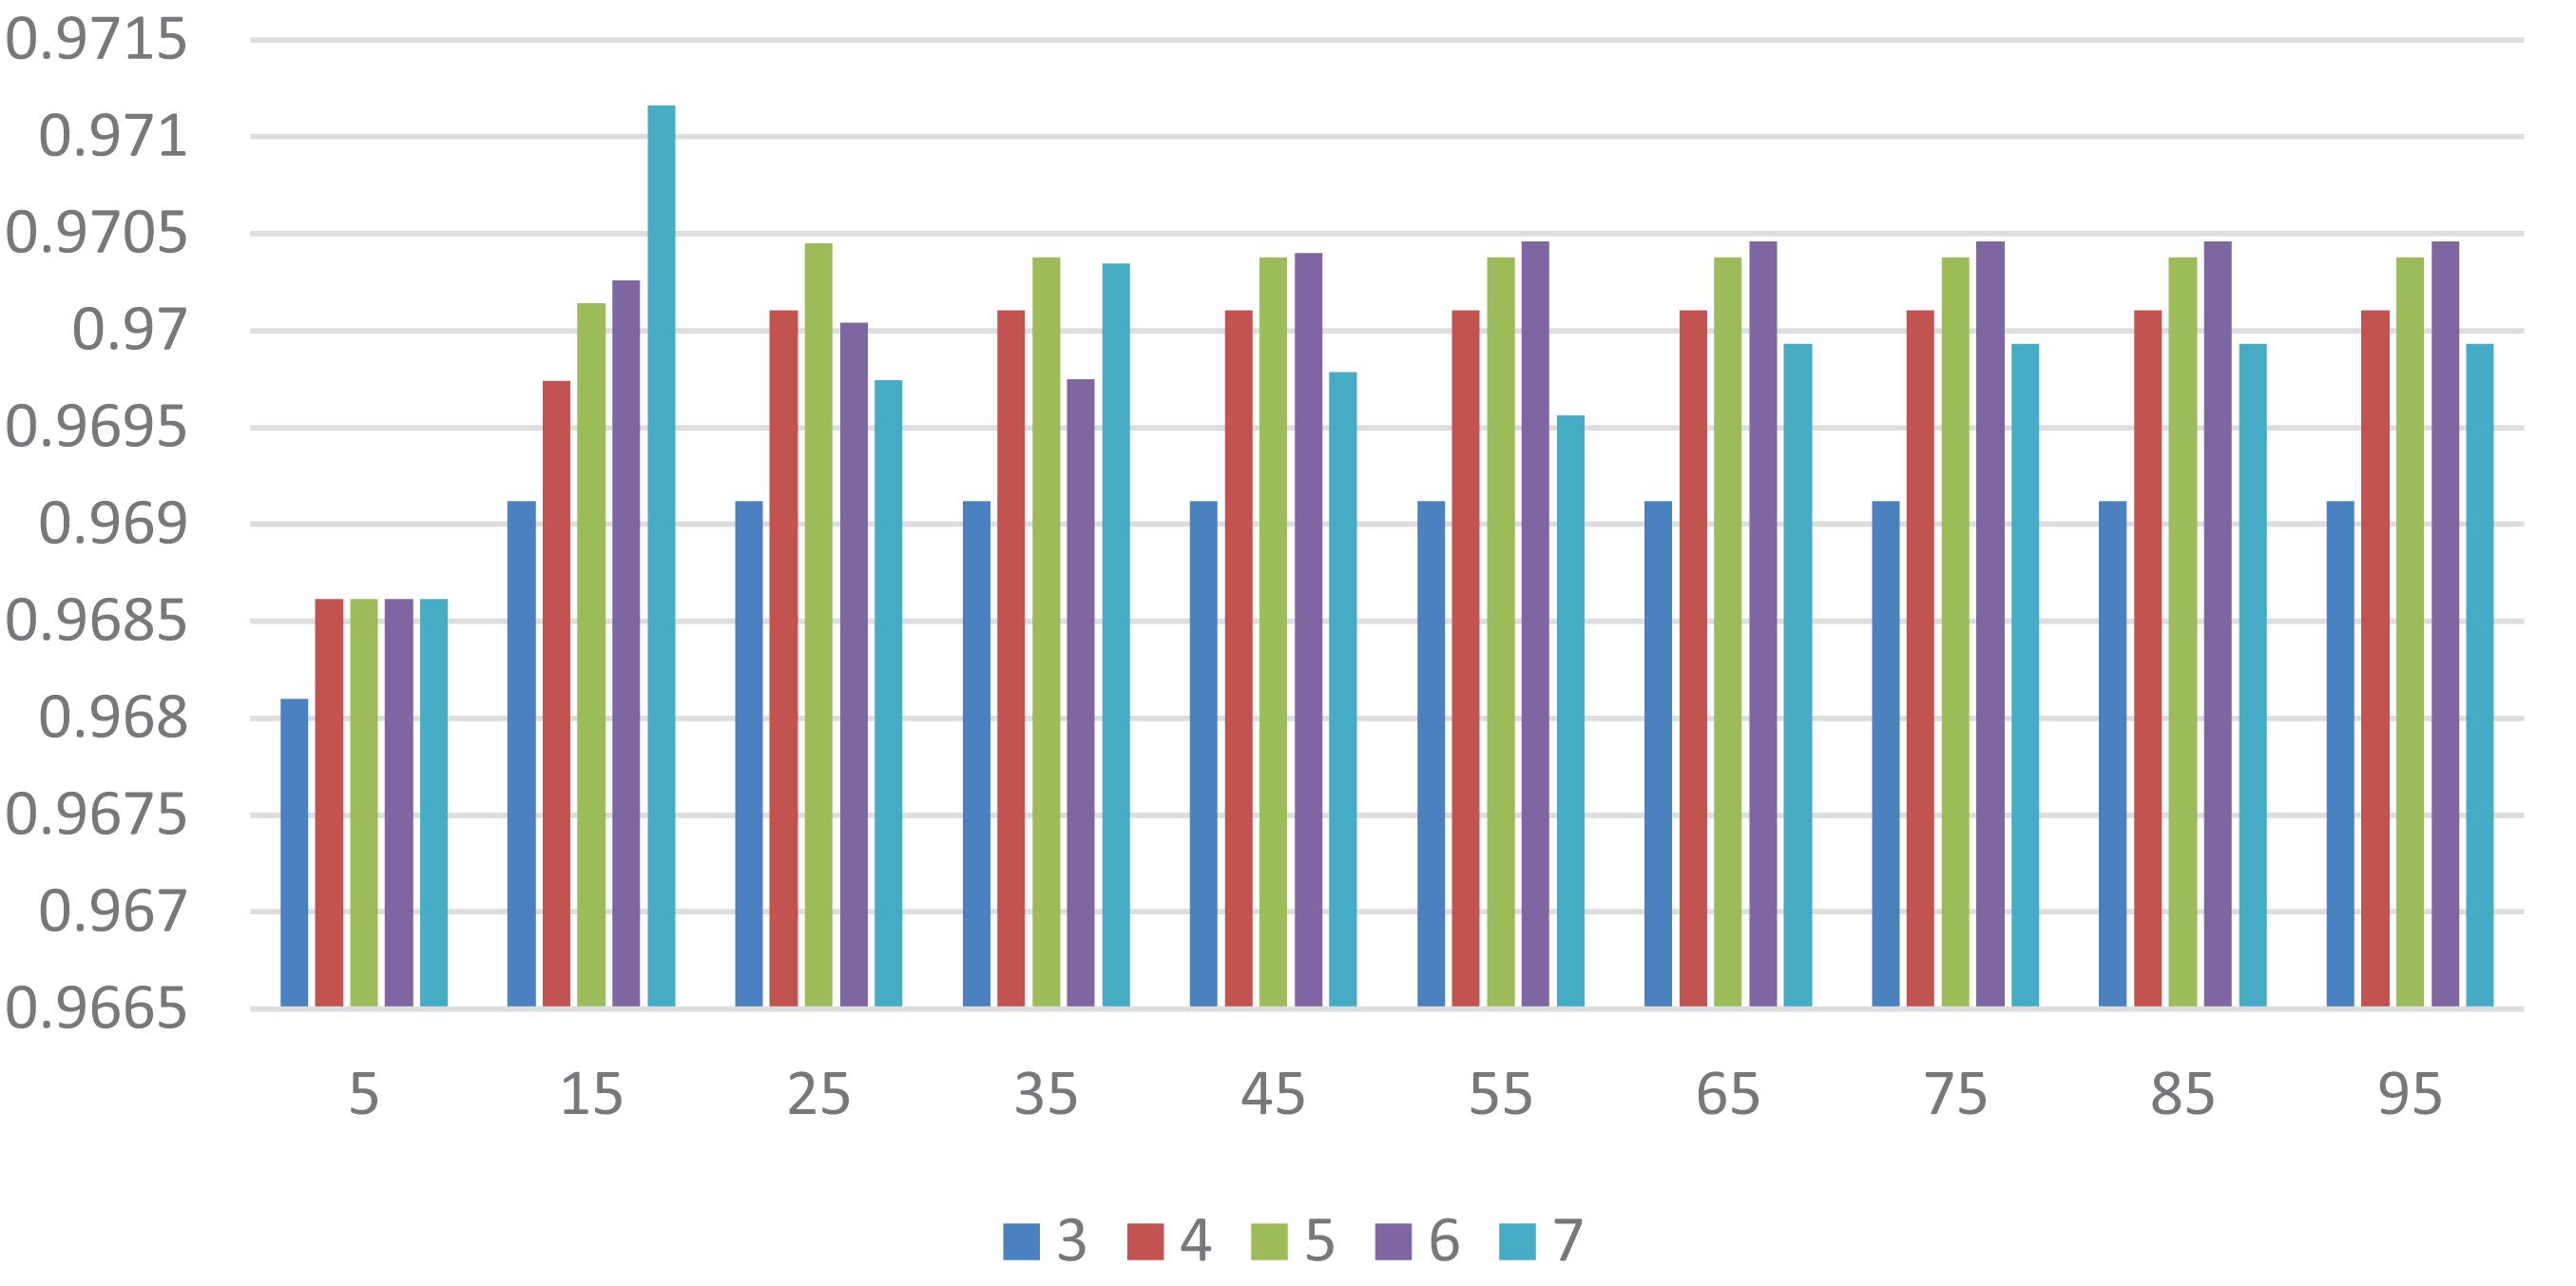
Figure 8. The AUC value of different max_depth and num_leaves. Different color represents different values of max_depth. The X axis represents the different values of num_leaves, and the Y axis represents relevant AUCs.
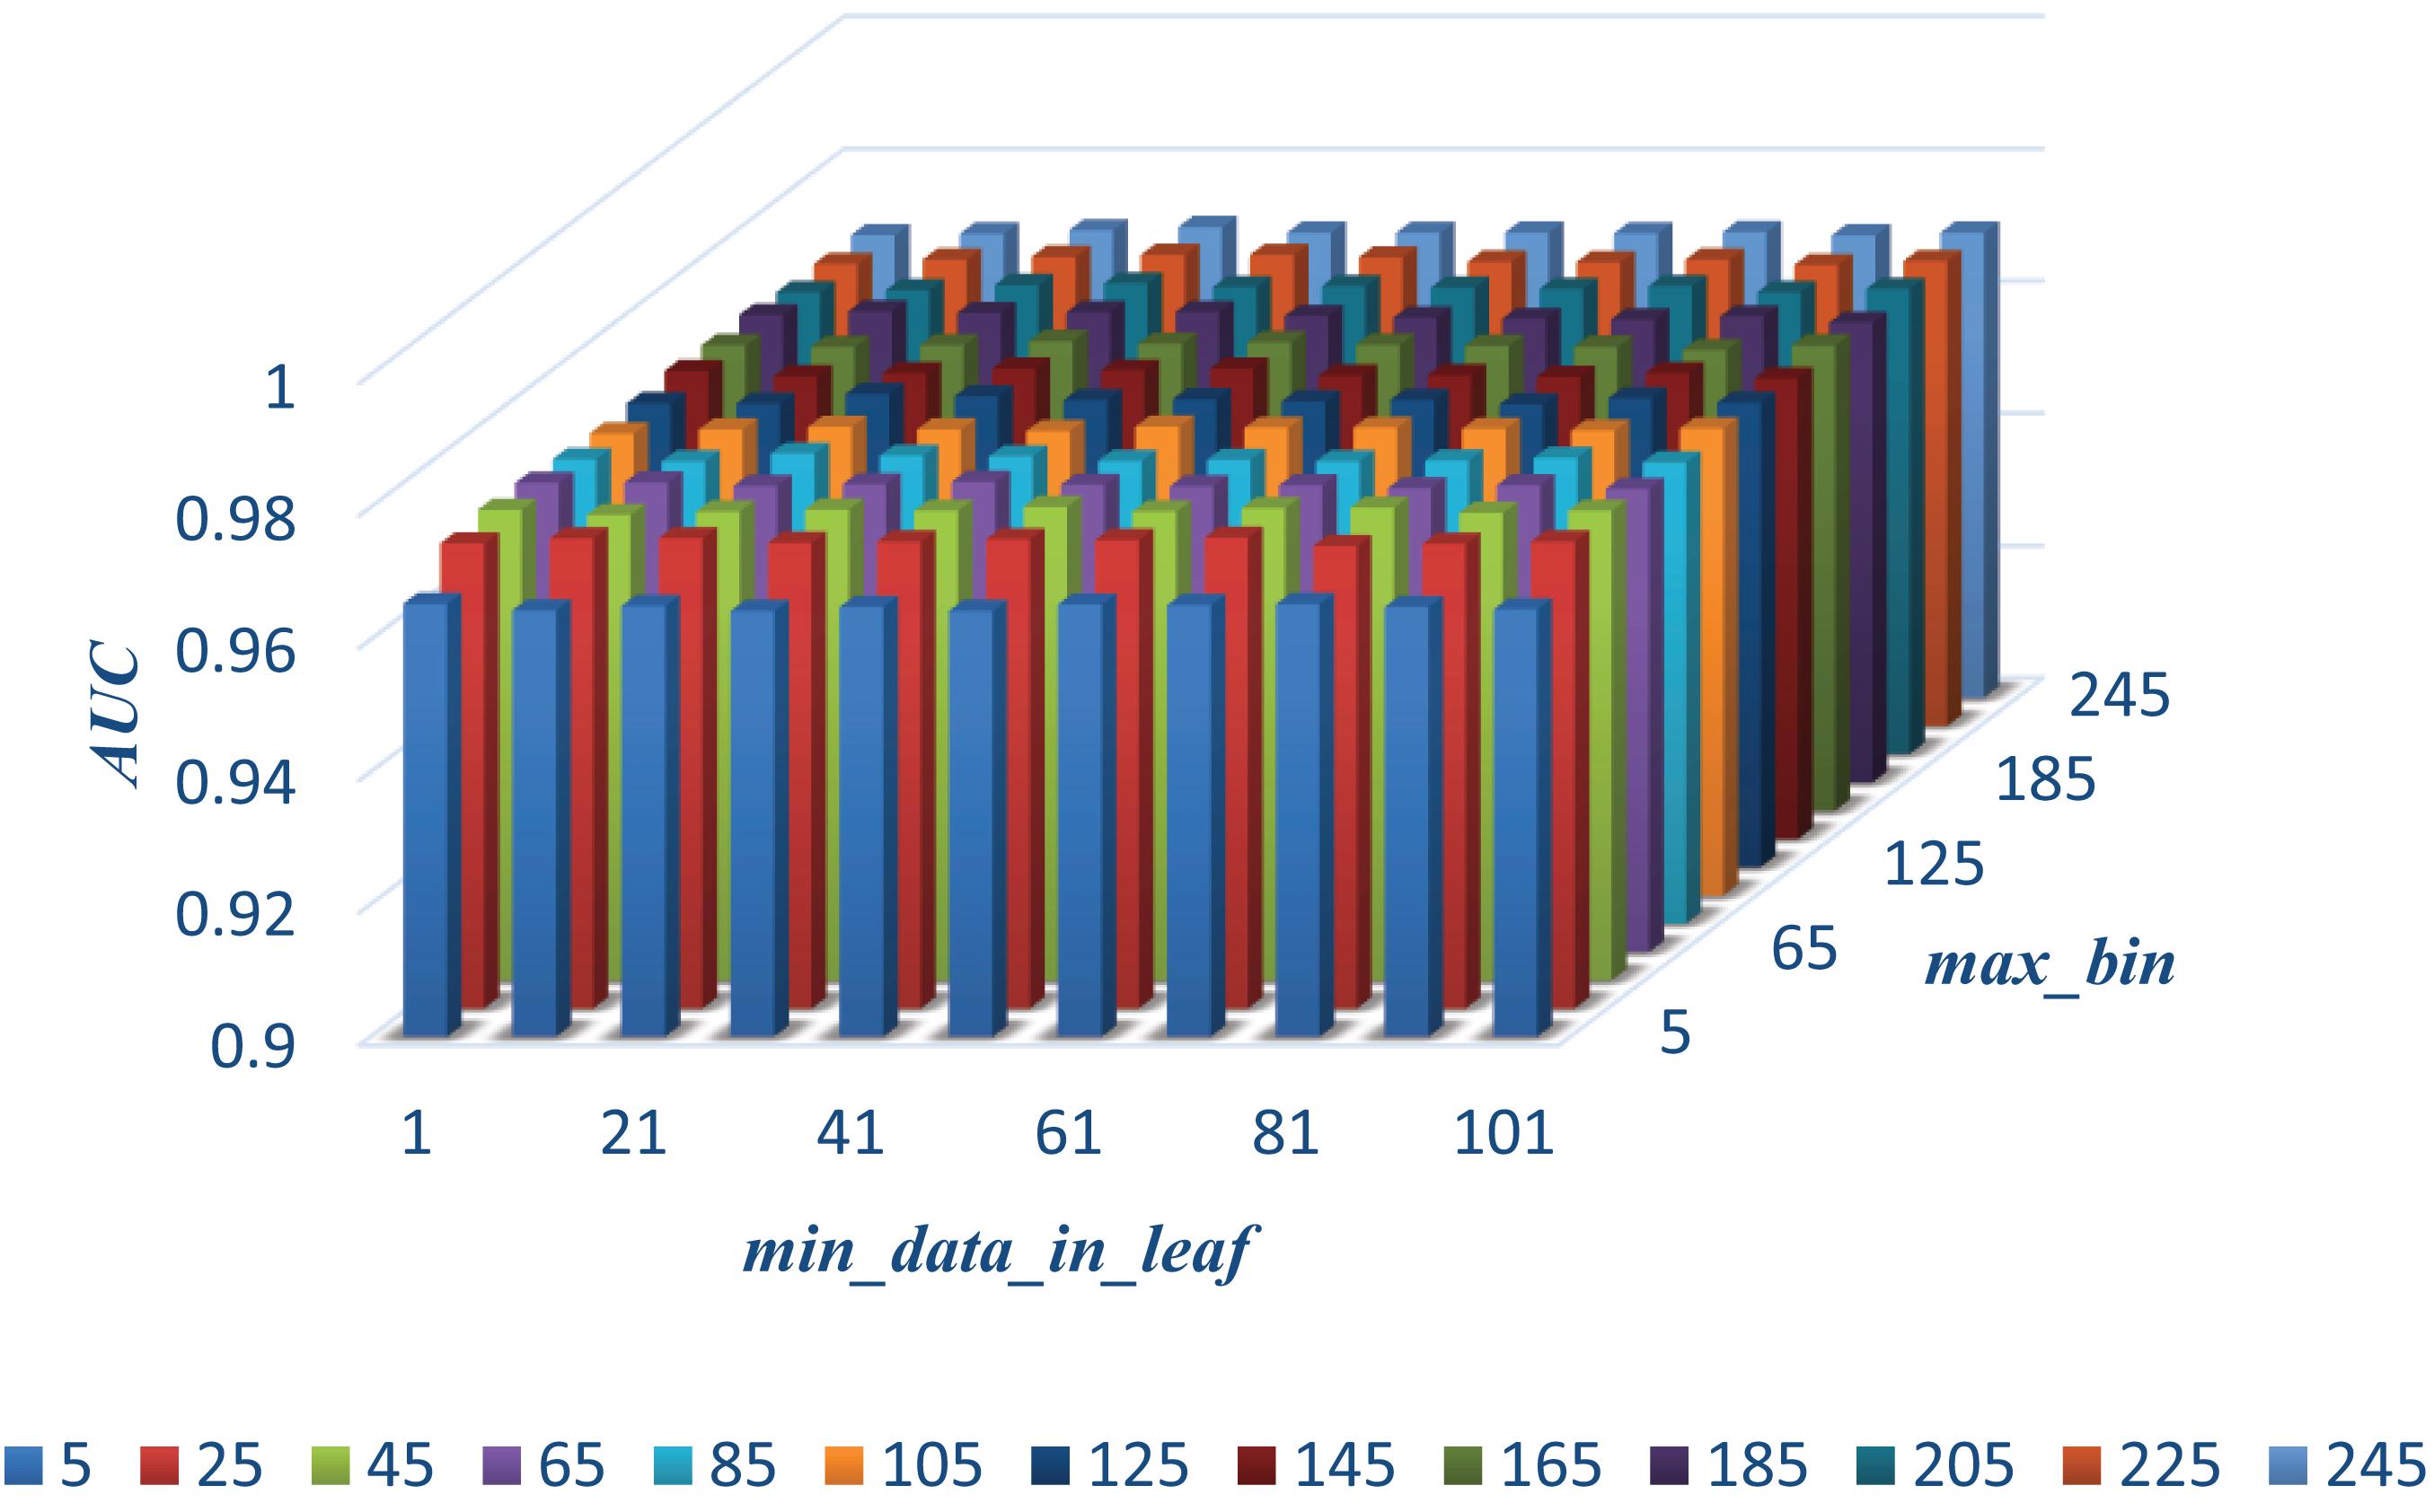
Figure 9. The AUC values of different max_bin and min_data_in_leaf.
Case Study
In this section, we analyze three kinds of diseases, anemia, uremia, and asthma, in case studies to discover their pathogenic mechanisms from the perspective of metabolites. There are 10, 9, and 7 metabolites of these diseases that could be verified out of the top 10 predicted metabolites, respectively. Figure 10 shows anemia and its relevant metabolites.
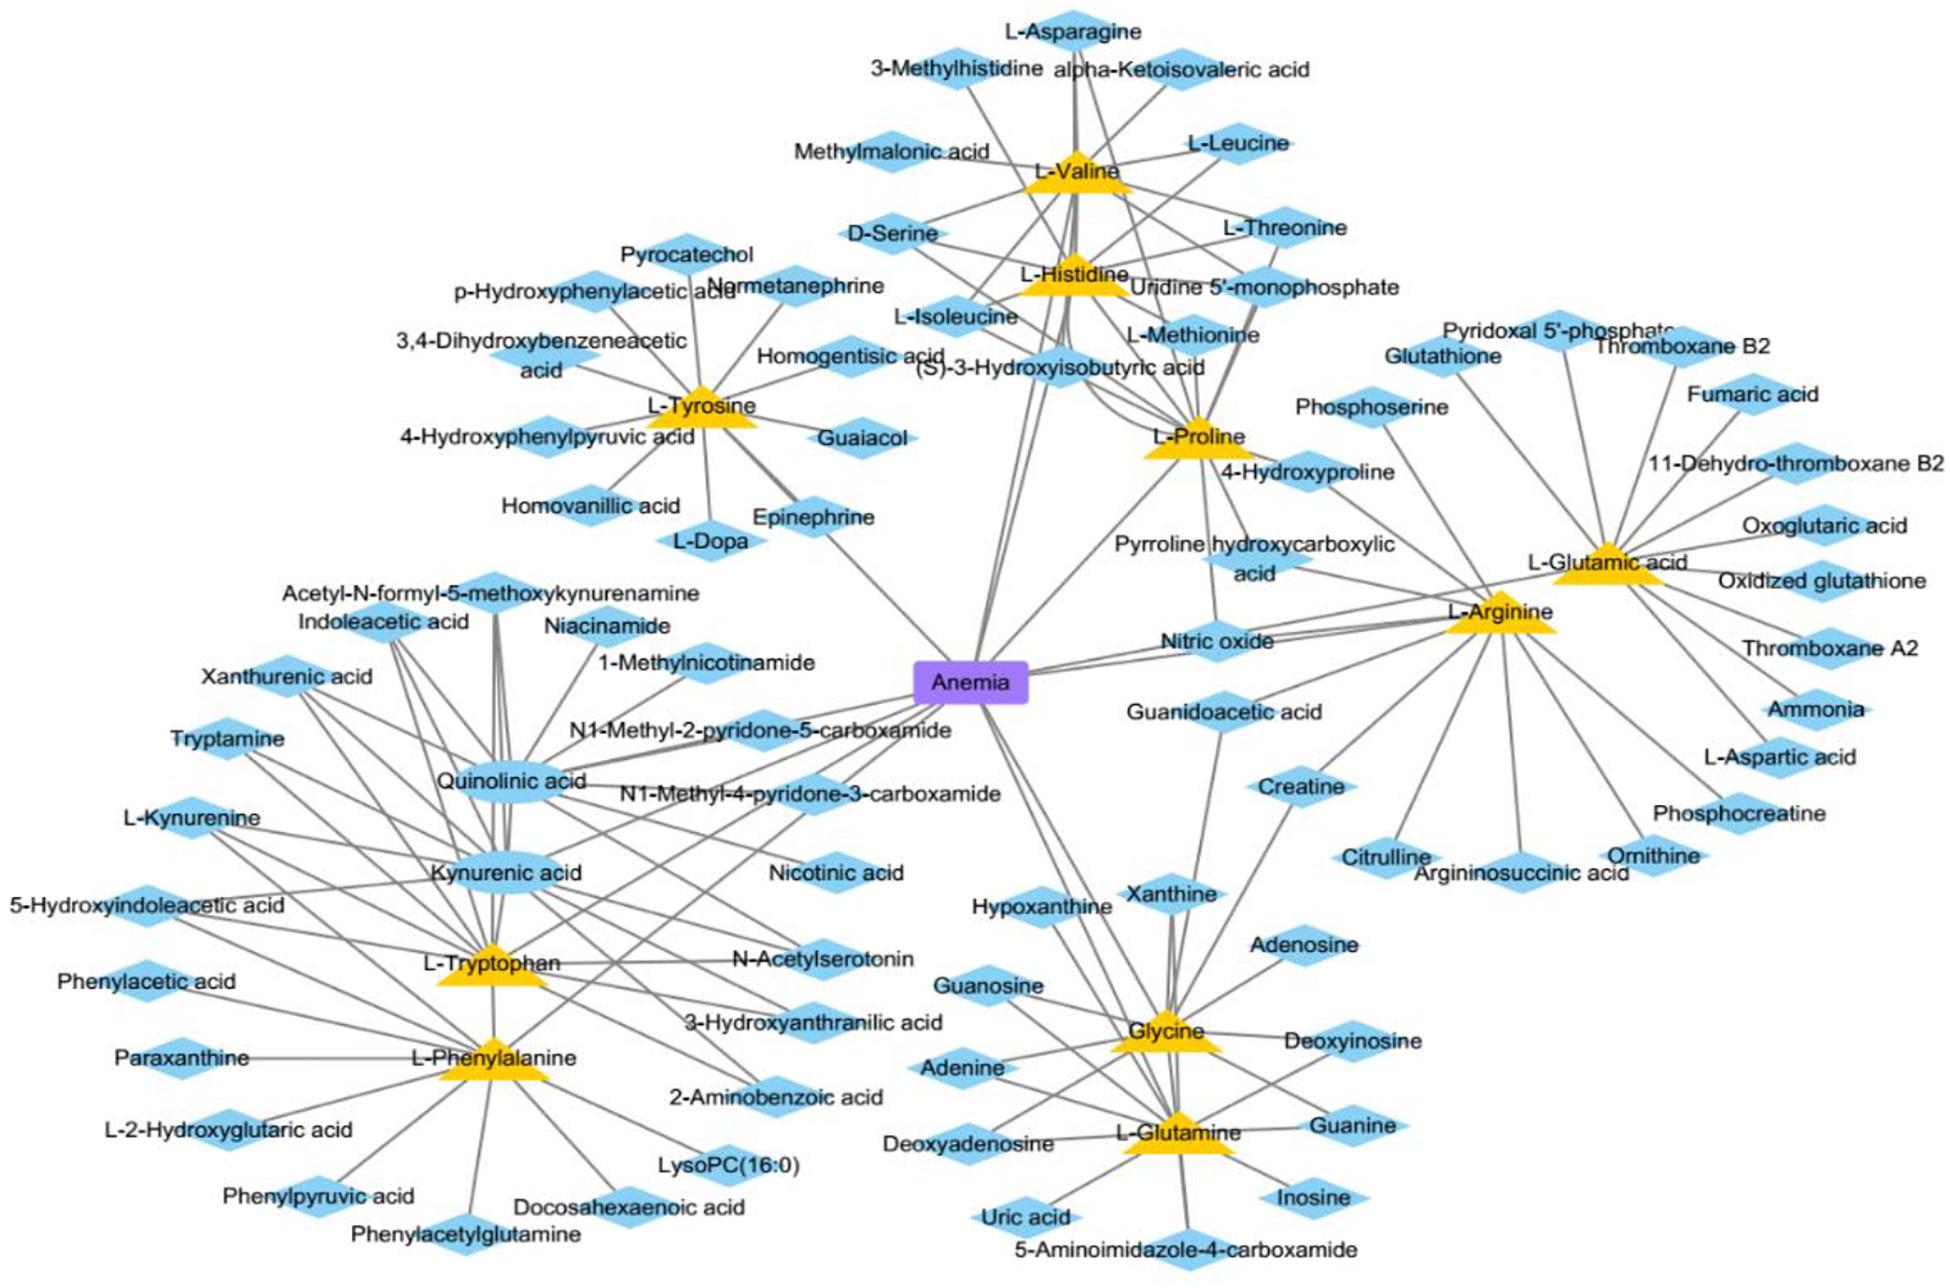
Figure 10. The associations between anemia and some metabolites. The blue ellipses represent the known metabolites about anemia in this study. The yellow triangles represent the top 10 predicted metabolites relevant to anemia. The blue diamonds represent the top 10 neighbors about predicted or known metabolites.
Anemia is caused by the inability of the body to produce enough hemoglobin, which is a protein that carries oxygen to blood cells and tissues. This disease has common symptoms, such as fatigue and dizziness. We conduct our method on a case study of anemia (see Table 1) to select the top 10 most likely associated metabolites, and all of them are associated with anemia according to literature in NCBI. For instance, L-histidine (Peterson et al., 1998) acts as a semi-essential amino acid, which is medically used in the treatment of anemia (Wang et al., 2020).
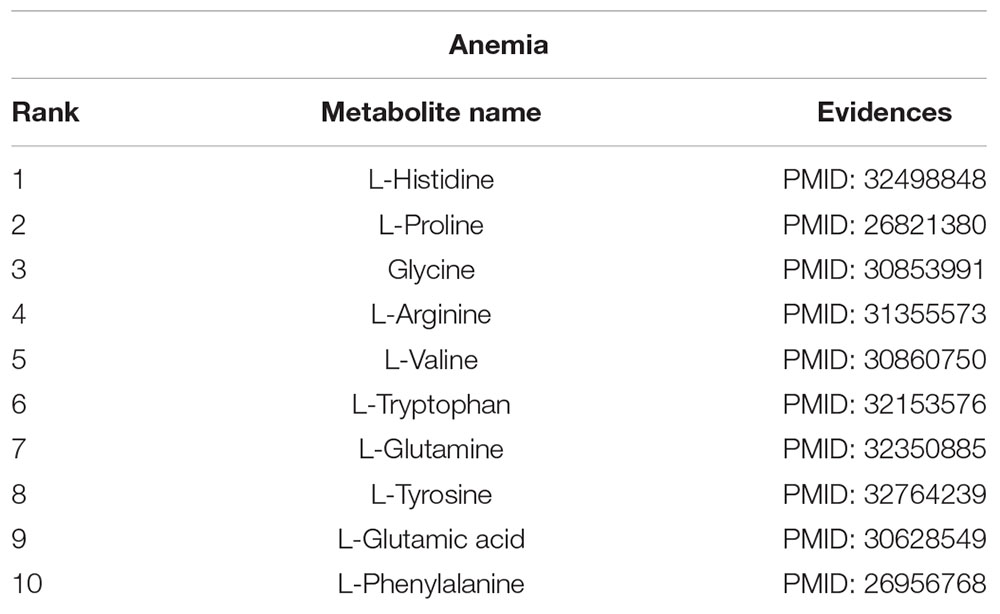
Table 1. Candidate metabolites of anemia.
Asthma is a common and frequent disease, which has the main symptoms of paroxysmal wheezing, chest tightness, and cough. The field of metabolomics has been used to explore the metabolic signatures of asthma, both for biomarker identification and pathophysiologic mechanisms research. We perform our method on a case study of asthma, and 7 of the top 10 predicted metabolites that are interrelated with asthma are verified to be correlative (see Table 2). For example, L-proline (Nadler et al., 1988) is one of metabolic characteristics of asthma, which is supported by experimental asthma models and clinical studies in children and adults (Pite et al., 2018). Another example is L-tryptophan (Hartzema et al., 1991), which has long been suggested to be relevant to the pathophysiology of asthma (Hu et al., 2020).

Table 2. Candidate metabolites of asthma.
Uremia is a serious kidney disease that is caused by a disorder in the internal biochemical process after renal function loss. We conduct our calculation method on a case study of uremia. As illustrated in Table 3, 9 of the top 10 predicted metabolites that are interrelated with uremia are verified to be correlative. For example, L-histidine is found to be significantly enhanced in the brain in uremia patients (Schmid et al., 1996). The L-proline in body fluids is a biological parameter for patients with renal insufficiency and chronic uremia (Hanwen, Sun et al., 2009).
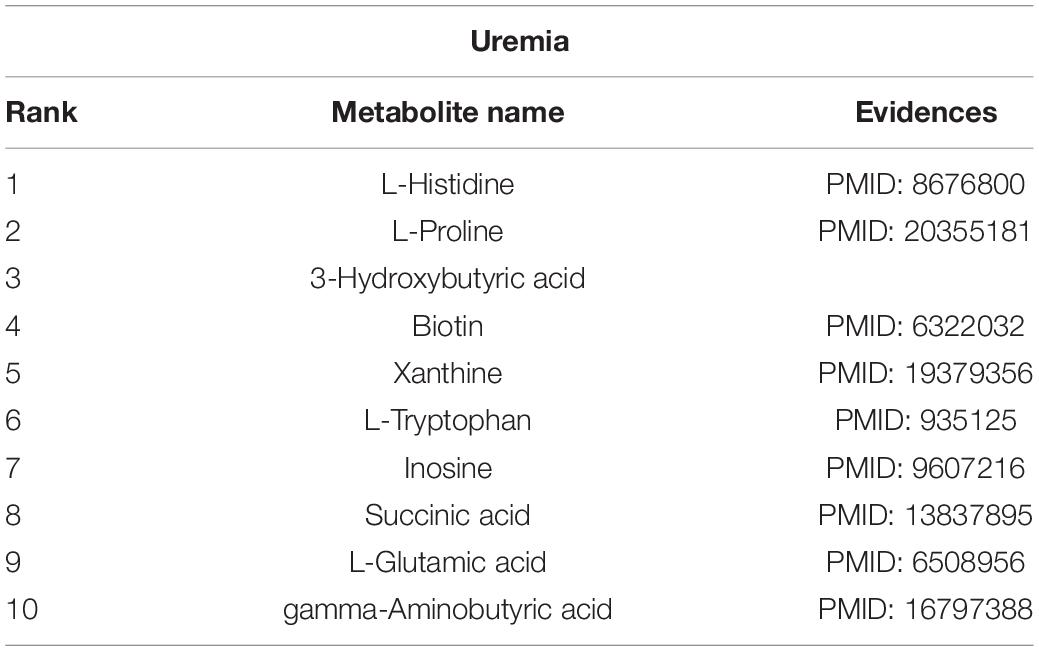
Table 3. Candidate metabolites of uremia.
Discussion
Uncovering complex disease-related metabolites is a vital research topic in metabolomics. To this end, we proposed a computational model called LGBMMDA under the framework of LightGBM. The experimental results by cross-validation have proven that our method outperforms previously used methods. Furthermore, three case studies indicate that the metabolite–disease correlations predicted in our method can be effectively demonstrated by relevant experiments. The LGBMMDA method is expected to be a useful biomedical research tool for predicting potential metabolite–disease associations.
There are three factors that contribute to the ideal predictive performance of LGBMMDA. Our method makes the following contributions for uncovering metabolite–disease associations: Firstly, the data of the metabolite–pathway associations are selected as metabolite functional similarities, which is a novel way to calculate similarities between metabolites. Secondly, three features are extracted by different angles, which keeps the diversity of features and contributes to a reliable performance. Thirdly, our method utilizes the reliable classifier of LightGBM, which ensures an effectively predictive accuracy.
However, there are several limitations in our prediction model. On the one hand, many parameters of GBM need to be adjusted. In this work, parameter adjustment is only carried out by some experiments. In future work, some algorithms might be used to adjust those parameters. On the other hand, more useful methods for calculating relevant similarities could be beneficial to enhancing the performance of our model. In the future, more biologically relevant information is expected to be available, which can be used to refine the similarities.
Data Availability Statement
Publicly available datasets were analyzed in this study. This data about metabolites can be found here: https://hmdb.ca/.
Author Contributions
CZ carried out the method IBNPLNSMDA to predict the potential associations of metabolites and diseases, participated in its design, and drafted the manuscript. XL and LL helped to draft the manuscript. All authors read and approved the final manuscript.
Funding
We are grateful for the financial support comes from the National Natural Science Foundation of China (61672334, 61972451, and 61902230) and the Fundamental Research Funds for the Central Universities (No. GK201901010).
Conflict of Interest
The authors declare that the research was conducted in the absence of any commercial or financial relationships that could be construed as a potential conflict of interest.
Acknowledgments
We thank EditSprings (https://www.editsprings.com/) for the expert linguistic services provided.
Abbreviations
AUC, area under the curve; GIP, gaussian interaction profile; LOOCV, leave-one-out cross-validation; ROC, receiver operating characteristic.
References
Akbar, J. A., Kusalik, A., and Wu, F. X. (2020). MDIPA: A microRNA-drug interaction prediction approach based on nonnegative matrix factorization. Bioinformatics 36, 5061–5067. doi: 10.1093/bioinformatics/btaa577
Boja, E. S., Fehniger, T. E., Baker, M. S., Marko-Varga, G., and Rodriguez, H. (2014). “Analytical validation considerations of multiplex mass-spectrometry-based proteomic platforms for measuring protein biomarkers. J. Proteome Res. 13, 5325–5332. doi: 10.1021/pr500753r
Charikar, M. (2002). “Similarity estimation techniques from rounding algorithms,” in Proceedings on 34th Annual ACM Symposium on Theory of Computing, (New York, NY), 380–388.
Cheng, L., Yang, H., Zhao, H., Pei, X., Shi, H., Sun, J., et al. (2017). MetSigDis: a manually curated resource for the metabolic signatures of diseases. Brief. Bioinform. 20, 203–209. doi: 10.1093/bib/bbx103
Dunn, W. B., and Ellis, D. I. (2005). Metabolomics: current analytical platforms and methodologies. Trends Anal. Chem. 24, 285–294. doi: 10.1016/j.trac.2004.11.021
Franceschet, M. (2010). PageRank: Standing on the shoulders of giants. arXiv[preprint] arXiv:1002.2858,
Friedman, J. H. (2001). Greedy function approximation: A gradient boosting machine. Annals of Statistics 29, 1189–1232.
Gu, C., Bo, L., Xiaoying, L., Lijun, C., Haowen, C., Keqin, L., et al. (2017). “Network-based collaborative filtering recommendation model for inferring novel disease-related miRNAs. RSC Advances 7, 44961–44971. doi: 10.1039/c7ra09229f
Hartzema, A. G., Porta, M. S., Tilson, H. H., Milburn, D. S., and Myers, C. W. (1991). Tryptophan toxicity: a pharmacoepidemiologic review of eosinophilia-myalgia syndrome. 25, 1259–1262. doi: 10.1177/106002809102501116
Hu, Q., Jin, L., Zeng, J., Wang, J., Zhong, S., Fan, W., et al. (2020). Tryptophan metabolite-regulated Treg responses contribute to attenuation of airway inflammation during specific immunotherapy in a mouse asthma model. Hum. Vaccin. Immunother. 16, 1891–1899. doi: 10.1080/21645515.2019.1698900
Hu, Y., Zhao, T., Zhang, N., Zang, T., Zhang, J., and Cheng, L. (2018). Identifying diseases-related metabolites using random walk. BMC Bioinformatics 19(Suppl 5):116.
Ke, G., Meng, Q., Finley, T., Wang, T., Chen, W., Ma, W., et al. (2017). “LightGBM: a highly efficient gradient boosting decision tree,” in Proceedings of the 31st International Conference on Neural Information Processing Systems, (Long Beach, CA), 3149–3157.
Lee, D. D., and Seung, H. S. J. N. (1999). “Learning the parts of objects by non-negative matrix factorization. Nature 401, 788–791. doi: 10.1038/44565
Ma, W., Zhang, L., Zeng, P., Huang, C., Li, J., Geng, B., et al. (2016). An analysis of human microbe–disease associations. Brief. Bioinform. 18, 85–97.
Nadler, J. V., Wang, A., and Hakim, A. (1988). “Toxicity of L-proline toward rat hippocampal neurons. Brain Res. 456, 168–172. doi: 10.1016/0006-8993(88)90358-7
Peterson, J. W., Boldogh, I., Popov, V. L., Saini, S. S., and Chopra, A. K. (1998). “Anti-inflammatory and antisecretory potential of histidine in Salmonella-challenged mouse small intestine. Lab. Invest. 78, 523–534.
Pite, H., Morais-Almeida, M., and Rocha, S. M. (2018). “Metabolomics in asthma: where do we stand? Curr. Opin. Pulm. Med. 24, 94–103. doi: 10.1097/mcp.0000000000000437
Schmid, G., Bahner, U., Peschkes, J., and Heidland, A. (1996). “Neurotransmitter and monoaminergic amino acid precursor levels in rat brain: effects of chronic renal failure and of malnutrition. Miner. Electrolyte Metab. 22, 115–118.
Sun, H., Li, L., and Wu, Y. (2009). Capillary electrophoresis with electrochemiluminescence detection for simultaneous determination of proline and fleroxacin in human urine. Drug Test. Anal. 1, 87–92. doi: 10.1002/dta.22
Tang, X., Lin, C. C., Spasojevic, I., Iversen, E. S., Chi, J. T., Marks, J. R., et al. (2014). A joint analysis of metabolomics and genetics of breast cancer. Breast Cancer Res. 16, 415.
Wang, X. Z., Zhang, Z. Q., Guo, R., Zhang, Y. Y., Zhu, N. J., Wang, K., et al. (2020). Dual-emission CdTe quantum dot@ZIF-365 ratiometric fluorescent sensor and application for highly sensitive detection of l-histidine and Cu2. Talanta 217, 121010. doi: 10.1016/j.talanta.2020.121010
Wishart, D. S., Feunang, Y. D., Marcu, A., Guo, A. C., Liang, K., Vázquez-Fresno, R., et al. (2017). HMDB 4.0: the human metabolome database for 2018. Nucleic Acids Res. 46, D608–D661.
Xianlin, H., Rozen, S., Boyle, S. H., Hellegers, C., Cheng, H., Burke, J. R., et al. (2011). “Metabolomics in early Alzheimer’s disease: identification of altered plasma sphingolipidome using shotgun lipidomics. PLoS One 6:e21643. doi: 10.1371/journal.pone.0021643
Zhang, Y., Chen, M., Cheng, X., and Wei, H. (2020). MSFSP: a novel mirna–disease association prediction model by federating multiple-similarities fusion and space projection. Front. Genet. 11:389.
Keywords: metabolite-disease associations, light gradient boosting machine, features, computational method, performance evaluation
Citation: Zhang C, Lei X and Liu L (2021) Predicting Metabolite–Disease Associations Based on LightGBM Model. Front. Genet. 12:660275. doi: 10.3389/fgene.2021.660275
Received: 29 January 2021; Accepted: 05 March 2021;
Published: 13 April 2021.
Edited by:
Wei Lan, Guangxi University, ChinaReviewed by:
Qi Zhao, University of Science and Technology Liaoning, ChinaWei Peng, Kunming University of Science and Technology, China
Copyright © 2021 Zhang, Lei and Liu. This is an open-access article distributed under the terms of the Creative Commons Attribution License (CC BY). The use, distribution or reproduction in other forums is permitted, provided the original author(s) and the copyright owner(s) are credited and that the original publication in this journal is cited, in accordance with accepted academic practice. No use, distribution or reproduction is permitted which does not comply with these terms.
*Correspondence: Xiujuan Lei, xjlei@snnu.edu.cn