 Xao X. Tang1
 Hiroyuki Shimada
 Naohiko Ikegaki
- 1Department of Anatomy and Cell Biology, College of Medicine, University of Illinois at Chicago, Chicago, IL, United States
- 2Departments of Pathology and Pediatrics, School of Medicine, Stanford University, Stanford, CA, United States
Neuroblastoma is the most common extracranial childhood solid tumor. The majority of high-risk neuroblastoma is resistant/refractory to the current high intensity therapy, and the survival of these patients remains poor for the last three decades. To effectively treat these extremely unfavorable neuroblastomas, innovative immunotherapy approaches would be the most promising. In this article, we discuss the identity of tumor-infiltrating effector cells and immunosuppressive cells in high-risk neuroblastoma. Neuroblastoma is unique in that it expresses little or no classical HLA Class I and II. In contrast, high-risk neuroblastomas express the stress-responsive non-classical Class I, HLA-E molecule. HLA-E is the ligand of activating receptors NKG2C/E that are expressed on memory NK cells, CD8+T cells and CD4 CTLs. By examining a comprehensive RNA-seq gene expression dataset, we detected relatively high levels of CD4 expression in high-risk neuroblastoma tissues. The majority of CD4+ cells were CD3+, and thus they were likely tumor-associated CD4+T cells. In addition, high-level of both CD4 and NKG2C/E expression was associated with prolonged survival of the high-risk neuroblastoma patients, but CD8 levels were not, further suggesting that the CD4+ NKG2C/E+ T cells or CD4 CTL conferred cytotoxicity against the neuroblastoma cells. However, this T cell mediated- “protective effect” declined over time, in part due to the progressive formation of immunosuppressive tumor microenvironment. These observations suggest that to improve survival of high-risk neuroblastoma patients, it is essential to gain insights into how to enhance CD4 CTL cytotoxicity and control the immunosuppressive tumor microenvironment during the course of the disease.
Introduction
Neuroblastoma is the most common extracranial childhood solid tumor and is known for its biological and clinical heterogeneity. There are two distinct biological types of neuroblastoma: favorable neuroblastoma (known by tumor spontaneous regression or curable simply by surgery) and unfavorable neuroblastoma that are deadly malignant tumors. Based on established prognostic factors, including age, disease stage, MYCN amplification status, ploidy, segmental chromosomal aberrations at 1p and 11q, and international neuroblastoma pathology classification (INPC), neuroblastoma is divided into three risk-based categories: low-, intermediate- and high-risk groups (1). Among those prognostic factors, INPC is the strongest prognostic factor that categorizes the tumors into Favorable Histology (FH) and Unfavorable Histology (UH) groups (2). Survival of UH neuroblastoma is essentially the same as that of high-risk neuroblastoma (3, 4). The majority (>50%) of high-risk/UH neuroblastoma will resist or refract the current high intensity multimodal therapy (3–6).
Recently, we have described an immunohistochemistry-based sub-classification of the UH neuroblastoma, which subcategorizes them into UH and Extremely Unfavorable Histology (EUH) subsets (7). As shown in Figures S1A, B, the EUH subset includes (i) MYC-driven neuroblastoma expressing high MYC and/or MYCN protein (8), (ii) Neuroblastoma with TERT overexpression due to genomic rearrangements (9–11), and (iii) Neuroblastoma of the ALT group due to ATRX loss (12, 13). The remaining tumors of the UH is called the Null group, which does not have the above three characteristics of the EUH tumors (7). The MYC-driven neuroblastoma group includes both MYCN-amplified and non-amplified tumors with high MYCN and MYC expression, respectively, and they are among the worst tumors that ultimately kill the patients. Collectively, the EUH neuroblastoma represents the most malignant and chemotherapy-resistant/refractory disease. Within the scope of this article, we discuss the identity of tumor-infiltrating effector cells and immunosuppressive cells in high-risk neuroblastoma tumor tissues. In addition, we propose an antibody-based approach that can maximize the effector’s killing activity against the tumor cells.
As described below, our data suggest that CD4 CTLs are important effector cells against high-risk neuroblastoma. CD4 CTLs can develop from TH0 (14, 15), TH1, TH2 (16), TH17 (17), and Treg (18) subsets. However, CD4 CTLs derived from TH1 cells represent the majority of CD4 CTLs (19). A hallmark of CD4 CTLs is the expression of the transcription factor EOMES (19). Previous studies have pointed that at least in some cases, CD4 CTLs are better effectors than CD8 CTLs (20–22). CD4 CTLs kill target cells by two cytotoxic effector mechanisms (23). The first involves the death receptor/ligand pathway. In that, the effector cells express the death ligands (e.g., FASLG), which bind to their cognate receptors (e.g., FAS) on the target cells to induce apoptotic cell death (24–26). The second cytotoxic mechanism is the directed exocytosis of Granzymes and Perforin into target cells to induce apoptosis (27). Others have suggested that CD4+ T cells can reject MHC Class II negative tumor cells through interplay with other infiltrating macrophages (28) and NK cells (20). In addition, it has been shown that CD4 CTLs can target tumor cells in two different ways: an MHC-restricted fashion (21, 22) and MHC-independent manner (29). Nonetheless, it is not clear how CD4 CTLs can directly engage target cells at the molecular levels when MHC Class II restriction is not applied or the tumor lacks HLA Class II expression.
Immunophenotype of Neuroblastoma
Neuroblastoma is a neural crest-derived tumor, which lacks classical HLA Class I and II expression (30, 31) and exhibits low mutation rates (32, 33). These characteristics help neuroblastoma cells evade CD8+ T cell-mediated immune surveillance. In contrast, there have been conflicting data on PD-L1 expression in neuroblastoma. Aoki et al. first showed that neuroblastoma was PD-L1 negative (34). Later, others suggested that neuroblastoma cells per se expressed PD-L1 (35–38). Recently, Shirinbak et al. reported that PD-L1 protein was expressed predominately on tumor-associated macrophages (TAMs) infiltrating into neuroblastoma tissues at diagnosis and a very few neuroblastoma cells became PD-L1 positive after chemotherapy (39). PD-L1 is an important immune checkpoint molecule; we thus carefully examined this issue by multiplex immunohistochemistry assay. As shown in Figure S1C, neither FH nor UH neuroblastoma cells expressed PD-L1, and PD-L1 positive staining was in fact detected on the cell membrane of stromal TAMs (see Discussion).
The Study Cohort
The majority of high-risk neuroblastoma is resistant to the current multimodal therapy, and this group of the tumors is our particular interest. The study cohort includes 176 high-risk neuroblastoma specimens collected at diagnosis (40, 41), and its subsets are shown in Figure 1A.
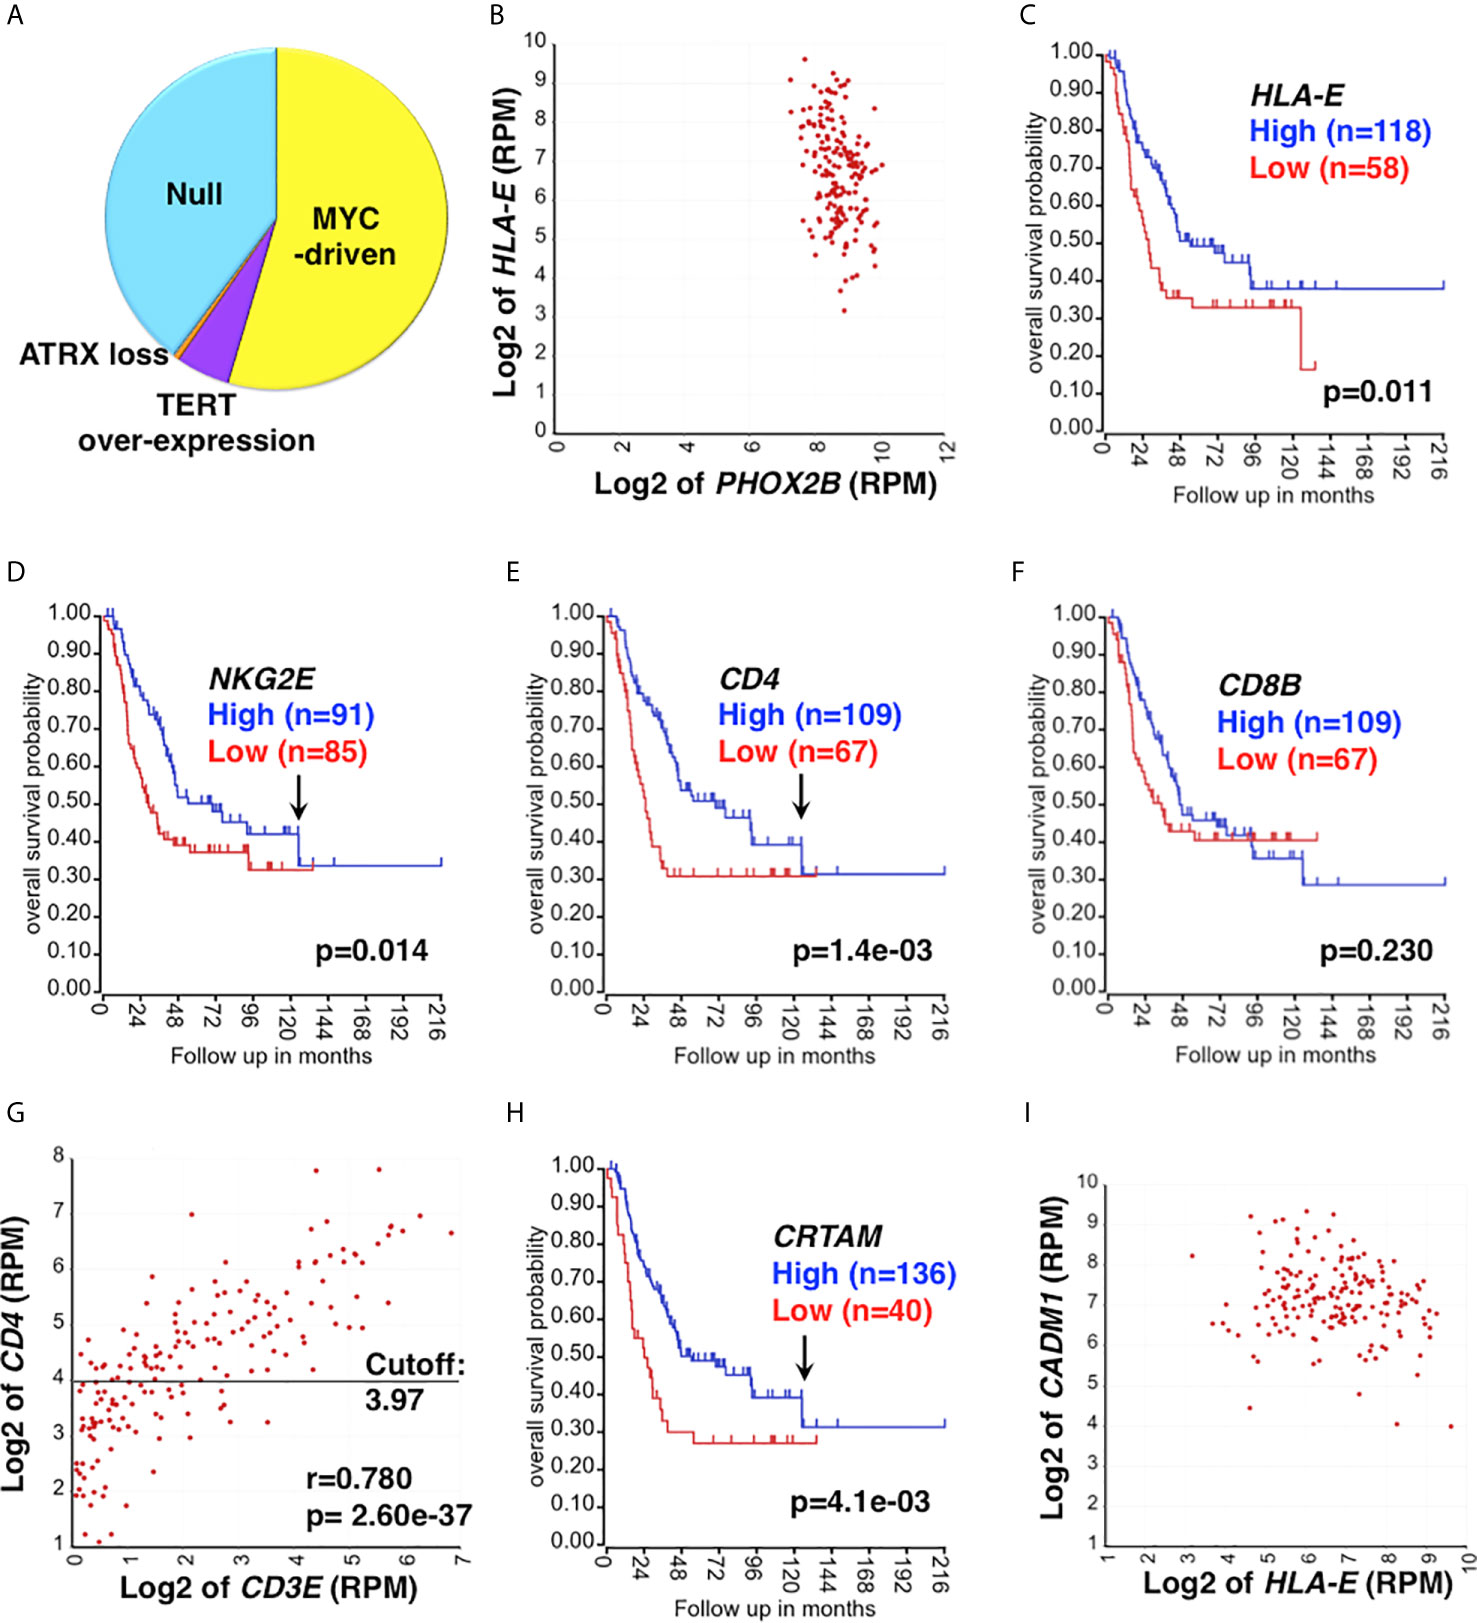
Figure 1 Clinical relevance of CD4 CTL in high-risk neuroblastoma. (A) The study cohort and its UH subgroups. The study cohort is composed of 176 high-risk neuroblastoma specimens (40, 41), which include the Null group and EUH groups (MYC-driven, TERT over-expression, and ATRX loss). The proportion of each subset was estimated based on expression levels of MYCN, MYC, TERT and ATRX. (B) HLA-E is highly expressed in high-risk neuroblastoma. HLA-E expression was correlated with PHOX2B expression (a marker of neuroblastoma) in the study cohort. All tumors were PHOX2B positive and co-expressed HLA-E. (C) The effect of HLA-E expression on survival of high-risk neuroblastoma. High HLA-E expression was associated with better outcome of high-risk neuroblastoma. Survival of high-risk neuroblastoma patients with high or low expression of HLA-E was analyzed by the R2: Genomics Analysis and Visualization Platform (http://r2.amc.nl). (D–F) The effect of NKG2E, CD4 and CD8 expression on survival of high-risk neuroblastoma. (D) High NKG2E and (E) high CD4 expressions were associated with prolonged survival of high-risk neuroblastoma. Difference in High expression (Blue) vs. Low expression (Red) was statistically significant up to 130 months after diagnosis as indicated by the arrows in (D, E). (F) No association between CD8 expression and disease outcome was found. CD8 expression is represented by CD8 β chain (CD8B). (G) Correlation between CD4 and CD3E expressions in the high-risk neuroblastoma. The expression of CD4 and CD3E were highly correlated each other, suggesting the presence of tumor-infiltrating CD4+ T cells. CD3E (encoding the CD3ε chain) expression represents CD3 expression. The horizontal bar represents the cutoff value to separate the cohort into high and low CD4 subsets, which were used in the survival analysis shown in (E). (H) The effect of CRTAM expression on high-risk neuroblastoma. High CRTAM expression, encoding a CTL activating receptor, was associated with prolonged survival of high-risk neuroblastoma. (I) High-risk neuroblastoma expresses both HLA-E and CADM1. All the high-risk tumors examined expressed both HLA-E and CADM1. CADM1, encoding the CRTAM ligand, expressed at high levels in high-risk neuroblastoma. CADM1 expression also showed a trend of being associated with better survival (p=0.096) (not shown). Unit of expression levels is expressed as Reads Per Million (RPM). Expression levels of genes shown in the figures were expressed as log2 of RPM.
Clinical Relevance of HLA-E Expression in High-Risk Neuroblastoma
HLA-E is a stress-induced molecule (42, 43), and its expression is significantly associated with high-risk neuroblastoma (Stage 4 and MYCN amplified cases) (44). We also found that all high-risk neuroblastoma examined expressed HLA-E (Figure 1B). These observations suggest that high-risk neuroblastoma are under the environmental and/or oncogenesis-associated stress, which in turn forces neuroblastoma cells to express HLA-E. HLA-E is the ligand of activating receptors NKG2C and NKG2E that are expressed on CD8+T cells, CD4 CTLs, and memory/adaptive NK cells (45–48). HLA-E is also the ligand of the inhibitory receptor NKG2A on CD8 T, CD4 CTLs, late immature and mature NK cells (19, 49). It is known that the NK cells can effectively kill HLA-E+ target cells by the ligation of NKG2C/E and HLA-E, followed by the release of effector molecules (Granzymes, Perforin) (47, 50–53). However, little is known whether CD8 T cells and CD4 CTLs would use the same molecular mechanism to directly engage and ultimately lyse the HLA-E+ target cells. To investigate a possible involvement of HLA-E in the anti-tumor immune response against high-risk neuroblastoma, we first examined survival of the patients based on HLA-E expression. As shown in Figure 1C, high HLA-E expression was significantly associated with longer survival of high-risk neuroblastoma, suggesting HLA-E is a target of the effector cells.
CD4 CTL as Effector Cells Against High-Risk Neuroblastoma
Because of the limited availability of tumor specimens, it is virtually impossible to perform live cell-based analyses on a large high-risk human neuroblastomas cohort. To gain an insight into the identity of immune effector cells against high-risk neuroblastoma, we analyzed a comprehensive RNA-seq gene expression dataset of neuroblastoma (40, 41), using the R2 Genomics Analysis Platform (http://r2.amc.nl).
Neuroblastoma tissues contain the majority of neuroblastoma cells and various stromal cells, including lymphoid and myeloid cells, endothelial cells, Schwann cells and fibroblasts. RNA-seq analysis can detect low-level transcripts from the stroma and tumor-infiltrating immune cells. As shown in Figure 1D, we detected expression of the activating receptor NKG2E in high-risk neuroblastoma, and high NKG2E expression was significantly associated with prolonged survival of high-risk neuroblastoma patients, suggesting the presence of tumor-infiltrating NKG2E+ effector cells in the high-risk neuroblastoma tissues. We also observed that high CD4 expression (Figure 1E), but not CD8 expression (Figure 1F), was associated with better outcome of the patients. Correlation analysis indicated that CD4 and CD3E expressions were significantly associated with each other in the tumor tissues (Figure 1G), suggesting the presence of tumor-infiltrating CD4+ T cells. Of note, there was a population of CD3Enegative-low and CD4low cases (Figure 1G), which could represent non-T CD4+ cells. Even when these cases are excluded from the analysis, association of survival with CD4 expression still holds. Specifically, excluding 12.5% and 25% of CD3Enegative-low cases from the survival analysis gives rise to p values of 0.021 and 0.03, respectively.
Similar to NKG2E, high-level expression of NKG2C showed a trend (p=0.09) toward being associated with prolonged survival of high-risk neuroblastoma patients (data not shown). Furthermore, high CRTAM expression was associated with better outcome of the patients (Figure 1H). CRTAM is known as an activating receptor expressed on CD4 CTLs, CD8 T cells, and NK cells and therefore a collective marker of CTLs (54, 55). On the other hand, neuroblastoma cells expressed CADM1, the ligand of CRTAM (56) (Figure 1I). The results shown in Figure 2A further suggested the presence of CRTAM+CD4+ cells in high-risk neuroblastoma tissues, which were more abundant than CRTAM+ CD8+ cells (Figure 2B) and CRTAM+ NCR1+ cells (i.e, NK cells) (Figure 2C). Together, the data suggest that the effector cells of high-risk neuroblastoma are CD4+ CD3+ NKG2C/E+ CRTAM+, namely CD4 CTLs.
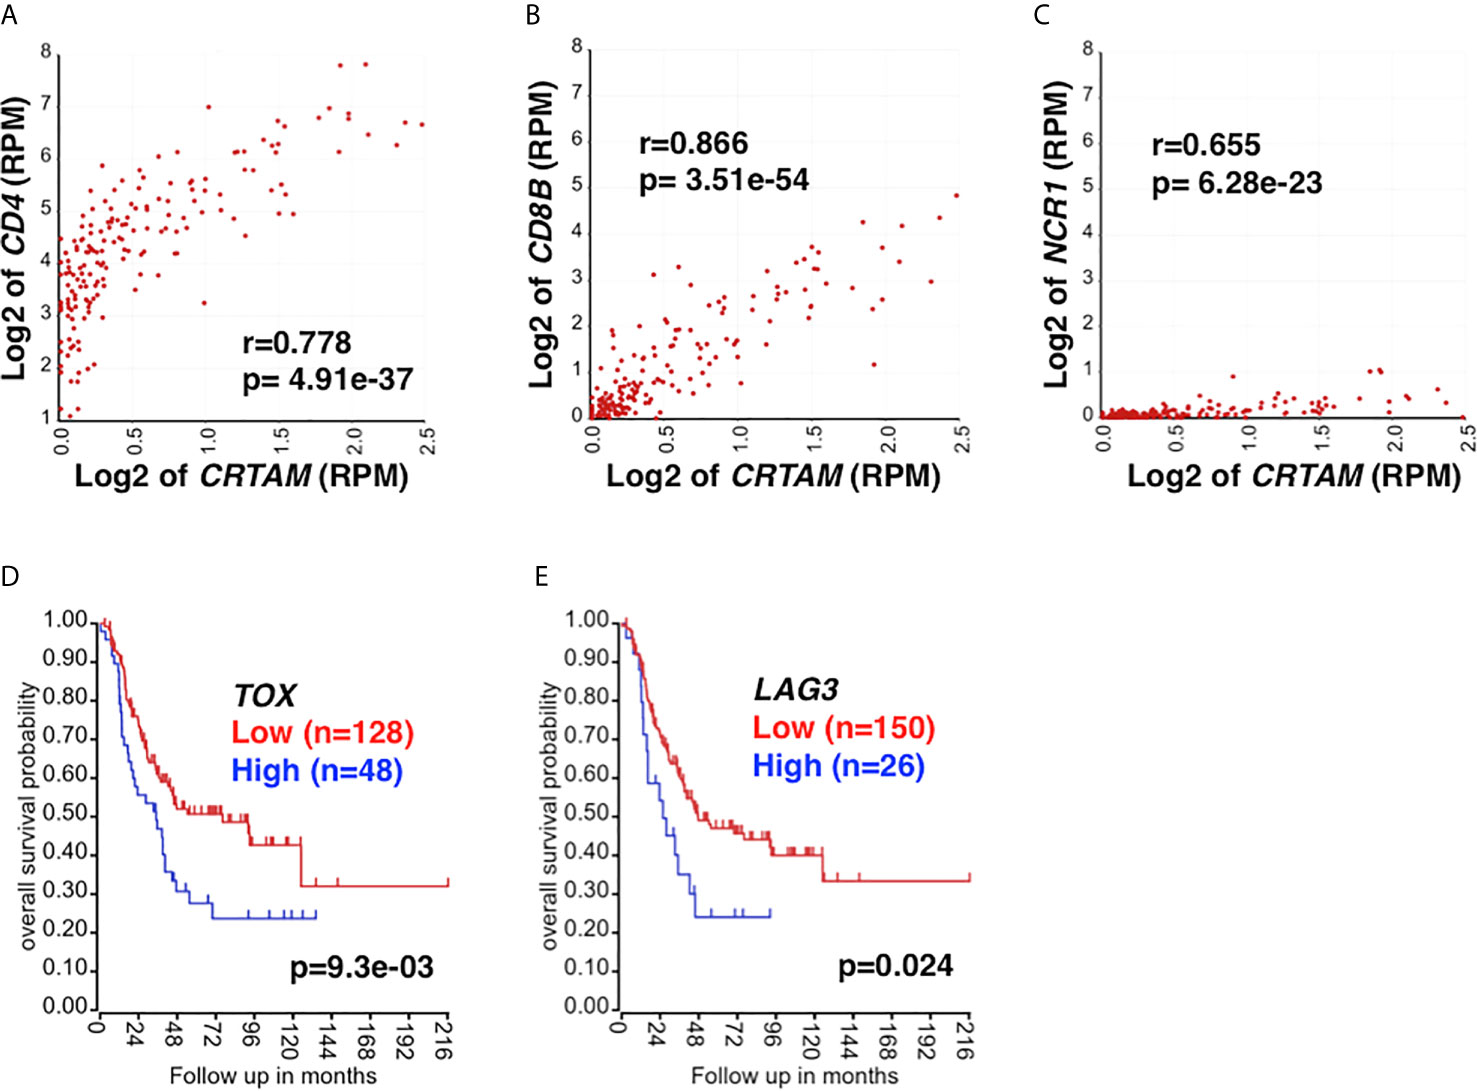
Figure 2 The relationship between CRTAM expression and CTL marker expression. CRTAM is an activating receptor of cytotoxic lymphoid cells: CD4 CTLs, CD8 T cells, and NK cells (19, 55) and therefore represents a collective marker of CTLs. (A) CRTAM and CD4 expressions were highly correlated each other in high-risk neuroblastoma tissues, suggesting the presence of CRTAM+ CD4+ T cells. (B) The expressions of CD8B (a CD8 T cell signature) and (C) NCR1 (an NK cell signature) were also found correlated with that of CRTAM, although the expression levels of these genes were much lower than that of CD4. Taken together, the results suggest that CD4 CTLs are the main CTL subset in high-risk neuroblastoma. CTL exhaustion and the dysfunctional immune response against high-risk neuroblastoma. High-level expression of T-cell exhaustion markers, TOX (D) and LAG3 (E) was associated with rapid progression and worse outcome of high-risk neuroblastoma, suggesting T-cell exhaustion had occurred in the high-risk neuroblastoma. Blue: High TOX/LAG3 expression, Red: Low TOX/LAG3 expression. Unit of expression levels is expressed as Reads Per Million (RPM). Expression levels of genes shown in the figures were expressed as log2 of RPM.
Of note, the protective effect of high NKG2E expression, high CD4 expression and high CRTAM expression declined over time with a similar kinetics (~130 months after diagnosis) as indicated by the arrows in Figures 1D, E, H. This observation suggests the progressive development of the immunosuppressive tumor microenvironment (TME) during the course of high-risk disease.
A Proposed Model for How CD4 CTLs Engage Neuroblastoma Cells Lacking HLA Class II
Based on our observations, we hypothesize that CD4 CTLs use two additive signals to directly engage neuroblastoma cells lacking HLA Class II: first, ligation between the activating receptors NKG2C/E on CD4 CTLs and the ligand HLA-E on neuroblastoma cells, and second, CRTAM of CD4 CTLs and CADM1 on neuroblastoma cells. Thus, CD4 CTLs act like NK cells and their effector mechanism would be TCR- and HLA Class II-independent. Our observation that almost all the high-risk neuroblastomas examined highly expressed both HLA-E and CADM1 lends support for this hypothesis (Figure 1I). In addition, a previous report suggests that CADM1 is a candidate of tumor suppressors for neuroblastoma at the chromosome 11q23 (56), and the patients with tumors having lost CADM1 expression on cell surface have poor prognosis (56). These observations are consistent with our hypothesis that CRTAM is an important receptor on the effector cell against high-risk neuroblastoma.
To further address the hypothesis, we examined the likely cytotoxic pathway involved in the tumor killing of high-risk neuroblastoma. We first found that FAS expression was not associated with survival of high-risk neuroblastoma patients (Figure S2A). This was in part due to the low expression of FAS on the tumor cells compared to HLA-E (Figures S2B, C). Thus, it is unlikely that CD4 CTL use the FASL/FAS pathway as an effector mechanism. In contrast, GZMA/GZMB expression was associated with longer survival of high-risk neuroblastoma patients (p=0.026 for both, not shown). Expression of OX40, encoding a co-stimulatory molecule on CD4 CTLs, was also associated with better outcome (Figures S2D, E). A similar trend was observed for 4-1BB, which was expressed at lower levels than OX40 (Figures S2F, G). Together, these observations suggest that the anti-neuroblastoma effect of CD4 CTLs relies on the perforin/granzyme pathway.
The Immunosuppressive Cells in the TME of High-Risk Neuroblastoma
Tumor-associated macrophages (TAMs) include M1 and M2 TAMs. TAMs tend to polarize toward an M2 state (anti-inflammatory, pro-tumor) in the TME and mediate immune exclusion and suppression, and ultimately promote tumor growth. Myeloid-derived suppressor cells (MDSCs) represent a heterogeneous population of immature myeloid cells that inhibit anti-tumor activities of T and NK cells and stimulate Treg, leading to tumor progression (57). As shown in Figures S3A, B, we detected the significantly correlated expression of M2 TAMs marker genes (CD163, CD204, CD206) and M-MDSC marker genes (CD11B, CD14, CD33) in the high-risk neuroblastoma examined, suggesting that the various numbers of M2 TAMs and MDSCs are present in the high-risk neuroblastoma TME.
Based on the gene expression profiling analysis, high-risk neuroblastoma tissues express relatively high levels of CCL2, CXCL12, and TGFB1, which could influence the recruitment and polarization of myeloid cells (58–65). We therefore addressed whether the various quantities of M2 TAMs and M-MDSCs linked to the variation in the cytokine/chemokine levels in the TME. To this end, we found that expressions of M2 TAMs markers (CD163, CD204 and CD206) and M-MDSC markers (CD11B, CD14 and CD33) were all correlated significantly with the expression of CCL2, CXCL12 and TGFB1 (Figure S3C). Moreover, the expression levels of TGFB1, CXCL12, and CCL2 were also highly correlative to each other in all the tumors specimens (Figure S3D). Taken together, these observations suggest that the production of these cytokines and chemokines by neuroblastoma and cells in the TME likely determines the quantity of M2 TAMs and M-MDSCs in high-risk neuroblastoma.
Tregs are a subset of CD4+T cells, which maintain peripheral tolerance and suppress anti-tumor immune responses. Tregs interact with infiltrating lymphocytes, stromal cells and tumor cells to exert their immunosuppressive effects (66). CD4+Treg cells are distinguished from other TH lineages via FOXP3 expression. FOXP3 stabilizes the suppressive phenotype and capabilities of Treg. CD4+ FOXP3+ Treg express characteristic receptors including CTLA4, GITR, and CD25 (67). Our analysis showed that FOXP3 expression correlated with CTLA4 (r=0.837 p= 2.14e-47) (Figure S3E), GITR (r=0.769 p= 1.28e-35) and CD25 (r=0.490 p= 4.92e-12) (data not shown), indicating the presence of Tregs in the TME of high-risk neuroblastoma.
TOX has been recognized in driving the epigenetic enforcement of exhaustion (68, 69). Exhausted T cells also express inhibitory receptors: PD-1, CTLA4, LAG3, and TIM3 (70). As shown in Figures 2D, E, high TOX and LAG3 expression was associated with adverse outcome of high-risk neuroblastoma, suggesting the exhaustion of CD4 CTLs. Taken together, our analysis suggests the roles of M2 TAMs, MDSCs, Treg, and T cell exhaustion in high-risk neuroblastoma in promoting tumor progression. The results also suggest that the HLA-E reactive CD4 CTL effector cells are functionally compromised in the TME of high-risk neuroblastoma.
Discussion
There have been several studies examining the immune cell profile in neuroblastoma tissues (71–73). In these reports, the emphasis was on the relationship between immune cell gene expression signatures and clinical outcomes. An additional study employed the immune-related gene expression signature to subdivide the high-risk group into further subsets (74). In this report, we conducted a series of analyses to determine the identity of specific immune effector and immunosuppressive cells in the high-risk neuroblastoma TME. Furthermore, we were particularly interested in the expression of HLA-E, which was expressed on high-risk neuroblastoma (44) (Figure 1B). Therefore, identification of effector cells against HLA-E+ tumors would help advance therapeutic strategy against these most malignant tumors.
This study suggests that CD4 CTLs are important effector cells against high-risk neuroblastoma, but their “protective effect” declines over time in part due to the progressive formation of the immunosuppressive TME, leading to the death of the patients. To improve survival of high-risk neuroblastoma patients, therapeutic strategy should include two essential tasks simultaneously: one to enhance the cytotoxicity of CD4 CTLs, and the other to remove the immunosuppressive TME.
Current understanding on cell surface molecules expressed on CD4 CTLs can provide significant insight into the first task. CD4 CTLs express not only the activating receptors NKG2C/E, but also the inhibitory receptor NKG2A, and these activating and inhibitory receptors NKG2C/E/A share the same ligand HLA-E expressed on neuroblastoma cells. CD4 CTLs also express other co-stimulatory molecules on their surface: CRTAM, 4-1BB and OX40. The biological functions of these CD4 CTLs’ cell surface molecules suggest that activating signals by NKG2C/E, CRTAM, 4-1BB, OX40 and the inhibitory signal by NKG2A determine the overall cytotoxicity of CD4 CTL. Thus, blocking of the inhibitory signal NKG2A by anti-NKG2A antibody would enhance the tumor killing of CD4 CTL. On the other hand, the use of agonistic antibodies against 4-1BB and OX40 would maximize the activating signals. This antibody-based approach via agonistic/antagonistic antibodies could in turn augment cytotoxicity of CD4 CTLs and result in a robust anti-neuroblastoma immune response.
Effective immunotherapy against solid tumors depends on how to remove the activity of the immunosuppressive TME. To date, there have been numerous studies describing innovative strategies to inactivate the immunosuppressive TME in adult cancers, and each of these studies has focused on one immunosuppressive cell type: TAMs (75–80) or MDSCs (81–83). Our analysis suggests that multiple immunosuppressive cells exist in the high-risk neuroblastoma tissues (M2 TAMs, MDSCs, Treg, exhausted T cells). In addition, a previous study reported that there were protumorigenic cancer-associated fibroblasts in the TME in neuroblastoma (84). Basic understanding of the biology of high-risk neuroblastoma, their metastatic/biological behavior, and knowledge on metabolism of the immune cells would help advance our strategy toward how to systematically remove the immunosuppressive TME and restore effector functions of the immune cells.
Intriguingly, our data show that neuroblastoma cells do not express PD-L1 (Figure S1C). The PD-1/PD-L1 ligation inhibits T-cell receptor signaling in effector T cells. Therefore, the lack of classical HLA Class I expression makes it unnecessary for the neuroblastoma cells to utilize the PD-1/PD-L1 pathway to avoid the killing by PD-1+ CD8 CTLs. On the other hand, we propose that in the absence of CD8+ T-mediated immunity, CD4 CTLs can target the HLA-E+ high-risk neuroblastoma cells in a TCR- and HLA-independent manner, which in turn would be unaffected by the PD-L1 expression status on the neuroblastoma cells.
Because of the biological heterogeneity of high-risk neuroblastoma, multiple immunotherapy protocols would be required to treat the patients. Currently, GD2, a surface glycolipid is the most common target for neuroblastoma immunotherapy. Anti-GD2 monoclonal antibodies have improved event-free survival and overall survival in patients with high-risk neuroblastoma (85, 86). However, some neuroblastomas intrinsically lack GD2 expression (87). Furthermore, in response to anti-GD2 therapy, tumor cells can down-regulate GD2 (88). In this study, we have found that the majority of high-risk neuroblastoma expresses both HLA-E and genes responsible for GD2, but ~5% of the tumors were HLA-E+ and likely GD2 negative (Figures S4A–C). Combination treatment against HLA-E and GD2 or an alternative therapy to anti-GD2 antibodies would be beneficial to these patients. Therapeutic interventions based on other cell surface molecules on neuroblastoma, including 4Ig-B7-H3 (89) and CD57 (90, 91), might be worth investigating, although these molecules are known to be expressed on both the tumor cells and immune cells.
It should be mentioned that antibody-based approaches targeting tumor surface molecules (e.g., GD2) are mediated by ADCC, which requires immune-active NK cells or macrophages (M1 TAMs). Thus, enhancing the immune-active status of tumor-infiltrating immune cells is a key strategy for anti-neuroblastoma immunotherapy. Lastly, because high-risk neuroblastoma is a metastatic disease, therapeutics given to these pediatric patients should be delivered systemically but tumor-specific with little toxicity to the normal cells. Immunotherapy would be a desirable approach to treat high-risk neuroblastoma patients, as it can target the tumor cells. This is in fact a basic principle underlying how the immune system works.
Data Availability Statement
Publicly available datasets were analyzed in this study. This data can be found here: NCBI GEO, GSE62564.
Author Contributions
XT and NI designed study, generated and analyzed the data, and conceptualized, wrote, and edited the manuscript. HS generated and analyzed the IHC data and edited the manuscript. All authors contributed to the article and approved the submitted version.
Funding
The funding was provided in part by NIH P01CA217959 (Project Leaders Seeger, Maris) to HS and DoD W81XWH-18-1-0418 (PI Asgharzadeh) to HS.
Conflict of Interest
The authors declare that the research was conducted in the absence of any commercial or financial relationships that could be construed as a potential conflict of interest.
Supplementary Material
The Supplementary Material for this article can be found online at: https://www.frontiersin.org/articles/10.3389/fimmu.2021.650427/full#supplementary-material
Supplementary Figure 1 | (A) Neuroblastoma subsets in a general cohort. In a general cohort, about 50% of the tumors are Favorable Histology (FH) group. The remaining 50% tumors belong to the Unfavorable Histology (UH) group, which is further divided into subcategories: the Null group (chemotherapy-sensitive; ~10%) and the Extremely Unfavorable Histology (EUH) group (chemotherapy-resistant/refractory). The EUH tumors include MYC-driven neuroblastomas (high MYCN and/or MYC protein expression; ~30%), TERT overexpression tumors (~7%), and ALT tumors (ATRX loss; ~4%). The proportional distribution of these subsets was estimated based on previous publications from our group (8) and others (9, 10, 92). (B) Immunohistochemical phenotypes of UH neuroblastoma subgroups. Examples of immunohistochemistry images of the EUH and Null group neuroblastomas are shown, which was performed as previously described (8, 93, 94). (C) Neuroblastoma at diagnosis does not express PD-L1. Multiplex IHC was performed to detect PD-L1 (brown, membrane staining) and PHOX2B (red, nuclear staining, one of the most reliable markers for neuroblastoma cells (95) on FH (5 cases) and UH (5 cases) neuroblastomas at diagnosis. PHOX2B positive neuroblastoma cells were always negative for PD-L1. In contrast, only PHOX2B negative cells, the majority of them appeared to be macrophages, showed positive staining for PD-L1 (see the inset in the UH tumor image). Representative cases of FH and UH IHC images of PD-L1 and PHOX2B staining are shown. The scale bar represents 20μm.
Supplementary Figure 2 | Effects of FAS, OX40 and 4-1BB expressions on survival of high-risk neuroblastoma. (A) FAS expression was not associated with survival of the high-risk neuroblastoma patients. This was likely due to low-level expression of FAS in high-risk neuroblastoma (B) as compared to HLA-E expression (C). HLA-E and PHOX2B expression in (C) is the same as Figure 1B, and it is shown here for the comparison of FAS expression to HLA-E expression. PHOX2B expression was used as a gene expression control for neuroblastoma. (D) High OX40 expression was significantly associated with better survival of the high-risk patients, and high 4-1BB expression showed a similar trend (F). The difference in the effects of OX40 and 4-1BB expressions on the patient survival was likely due to expression levels of OX40 and 4-1BB as shown in (E, G), respectively. EOMES expression signifies CD4 CTLs (19, 55, 96), and it was used to assess expression levels of OX40 and 4-1BB in tumor-infiltrating CD4 CTLs. (E) OX40 expression among the tumors with EOMES expression over 1.0 RPM was significantly higher than that of 4-1BB (G) (p=4.8e-04). Statistical analysis was done using a Student’s t-test. Unit of expression levels is expressed as Reads Per Million (RPM). Expression levels of genes shown in the figures were expressed as log2 of RPM.
Supplementary Figure 3 | M2 TAMs, M-MDSCs and Tregs in the TME of high-risk neuroblastoma. (A) The expression of M2 TAM signature genes (CD163, CD204, and CD206) (97, 98) was examined by 3D-correlation analysis in high-risk neuroblastoma. The signature gene expression was tightly associated each other, suggesting that various numbers of M2 TAMs were present in high-risk neuroblastoma tissues. (B) The expression of M-MDSC signature genes (CD11B, CD14 and CD33) (99) was also examined by 3D-correlation analysis in high-risk neuroblastoma. Based on histological observations, monocytic MDSCs (M-MDSC) appeared to be the main subset of MDSCs in neuroblastoma. Therefore, only the M-MDSC signature genes were analyzed. As shown, there was a tight association among CD11B, CD14, and CD33 gene expressions in high-risk neuroblastoma tissues, suggesting that various amounts of M-MDSCs were present in the TME. (C) Expression of M2 TAM and M-MDSC marker genes was highly correlated with the expression of cytokine and chemokines genes indicated. (D) The expression levels of chemokine and cytokine genes (CCL2, CXCL12 and TGFB1) are also highly correlated to each other in all tumors examined. These observations suggest that the establishment of M2 TAMs and M-MDSCs in the TME are dependent on the cytokine and chemokines. (E) Expressions of Treg signature genes (FOXP3 and CTLA4) in the high-risk neuroblastoma. The expressions of these genes were highly correlated each other, suggesting the presence of Treg cells in the tumor tissues. Unit of expression levels is expressed as Reads Per Million (RPM). Expression levels of genes shown in the figures were expressed as log2 of RPM.
Supplementary Figure 4 | The majority of high-risk neuroblastomas co-expressed HLA-E and genes responsible for GD2 synthesis (B4GALNT1 and ST8SIA1). GD2 is a glycolipid and an immunotherapy target of neuroblastoma, but its expression cannot directly be measured by gene expression. We thus examined the expression of B4GALNT1 encoding GD2 synthase and ST8SIA1 encoding GD3 synthase as surrogates of GD2 expression in high-risk neuroblastoma. Of note, GD3 synthase is the rate-limiting enzyme for GD2 synthesis, and therefore, expression of ST8SIA1 was included in the analysis (A, B). The result showed that the vast majority of high-risk neuroblastomas co-expressed HLA-E together with B4GALNT1 and ST8SIA1. In other words, most tumors are both HLA-E+ GD2+. (C) The majority of high-risk neuroblastomas expressed both ST8SIA1 and B4GALNT1. However, about 5% of the tumors expressed very low levels of both B4GALNT1 and ST8SIA1 (the red circle), suggesting these tumors (~5%) were negative for GD2 at diagnosis. Expression levels of genes shown in figures were expressed as log2 of RPM. (D) Average expression levels of genes examined in the study are shown. Unit of expression levels is expressed as Reads Per Million (RPM). Expression average was calculated based on the high-risk neuroblastoma cases (n=176) (40, 41). TOX is expressed in non-T cell lineage cells (e.g., B cells, NK cells, and granulocytes) and its expression levels appear higher than other T cell markers in tumor tissues (https://www.proteinatlas.org/ENSG00000198846-TOX/tissue). Housekeeping genes (HKGs) include RPL5, RPL28, TBP, RPL13A, RPLP0 and TFRC.
Abbreviations
CD4 CTL, CD4 Cytotoxic T Lymphocyte; TCR, T-cell receptor; ADCC, Antibody-dependent cell-mediated cytotoxicity.
References
1. Park JR, Bagatell R, London WB, Maris JM, Cohn SL, Mattay KK, et al. Children’s Oncology Group’s 2013 blueprint for research: neuroblastoma. Pediatr Blood Cancer (2013) 60(6):985–93. doi: 10.1002/pbc.24433
2. Sokol E, Desai AV, Applebaum MA, Valteau-Couanet D, Park JR, Pearson ADJ, et al. Age, Diagnostic Category, Tumor Grade, and Mitosis-Karyorrhexis Index Are Independently Prognostic in Neuroblastoma: An INRG Project. J Clin Oncol (2020) 38(17):1906–18. doi: 10.1200/jco.19.03285
3. Maris JM, Hogarty MD, Bagatell R, Cohn SL. Neuroblastoma. Lancet (2007) 369(9579):2106–20. doi: 10.1016/S0140-6736(07)60983-0
4. Sano H, Bonadio J, Gerbing RB, London WB, Matthay KK, Lukens JN, et al. International neuroblastoma pathology classification adds independent prognostic information beyond the prognostic contribution of age. Eur J Cancer (2006) 42(8):1113–9. doi: 10.1016/j.ejca.2005.11.031
5. Shimada H, Ambros IM, Dehner LP, Hata J, Joshi VV, Roald B, et al. The International Neuroblastoma Pathology Classification (the Shimada system). Cancer (1999) 86(2):364–72. doi: 10.1002/(SICI)1097-0142(19990715)86:2<364::AID-CNCR21>3.0.CO;2-7
6. Shimada H, Umehara S, Monobe Y, Hachitanda Y, Nakagawa A, Goto S, et al. International neuroblastoma pathology classification for prognostic evaluation of patients with peripheral neuroblastic tumors: a report from the Children’s Cancer Group. Cancer (2001) 92(9):2451–61. doi: 10.1002/1097-0142(20011101)92:9<2451::AID-CNCR1595>3.0.CO;2-S
7. Ikegaki N, Shimada H, International Neuroblastoma Pathology Committee. Subgrouping of Unfavorable Histology Neuroblastomas With Immunohistochemistry Toward Precision Prognosis and Therapy Stratification. JCO Precis Oncol (2019) 3:1–7. doi: 10.1200/PO.18.00312
8. Wang LL, Teshiba R, Ikegaki N, Tang XX, Naranjo A, London WB, et al. Augmented expression of MYC and/or MYCN protein defines highly aggressive MYC-driven neuroblastoma: a Children’s Oncology Group study. Br J Cancer (2015) 113(1):57–63. doi: 10.1038/bjc.2015.188
9. Valentijn LJ, Koster J, Zwijnenburg DA, Hasselt NE, van Sluis P, Volckmann R, et al. TERT rearrangements are frequent in neuroblastoma and identify aggressive tumors. Nat Genet (2015) 47(12):1411–4. doi: 10.1038/ng.3438
10. Peifer M, Hertwig F, Roels F, Dreidax D, Gartlgruber M, Menon R, et al. Telomerase activation by genomic rearrangements in high-risk neuroblastoma. Nature (2015) 526(7575):700–4. doi: 10.1038/nature14980
11. Kawashima M, Kojima M, Ueda Y, Kurihara S, Hiyama E. Telomere biology including TERT rearrangements in neuroblastoma: a useful indicator for surgical treatments. J Pediatr Surg (2016) 51(12):2080–5. doi: 10.1016/j.jpedsurg.2016.09.042
12. Cheung NK, Zhang J, Lu C, Parker M, Bahrami A, Tickoo SK, et al. Association of age at diagnosis and genetic mutations in patients with neuroblastoma. JAMA (2012) 307(10):1062–71. doi: 10.1001/jama.2012.228
13. Kurihara S, Hiyama E, Onitake Y, Yamaoka E, Hiyama K. Clinical features of ATRX or DAXX mutated neuroblastoma. J Pediatr Surg (2014) 49(12):1835–8. doi: 10.1016/j.jpedsurg.2014.09.029
14. Yasukawa M, Ohminami H, Arai J, Kasahara Y, Ishida Y, Fujita S. Granule exocytosis, and not the fas/fas ligand system, is the main pathway of cytotoxicity mediated by alloantigen-specific CD4(+) as well as CD8(+) cytotoxic T lymphocytes in humans. Blood (2000) 95(7):2352–5. doi: 10.1182/blood.V95.7.2352
15. Brown DM, Kamperschroer C, Dilzer AM, Roberts DM, Swain SL. IL-2 and antigen dose differentially regulate perforin- and FasL-mediated cytolytic activity in antigen specific CD4+ T cells. Cell Immunol (2009) 257(1-2):69–79. doi: 10.1016/j.cellimm.2009.03.002
16. Lancki DW, Hsieh CS, Fitch FW. Mechanisms of lysis by cytotoxic T lymphocyte clones. Lytic activity and gene expression in cloned antigen-specific CD4+ and CD8+ T lymphocytes. J Immunol (1991) 146(9):3242–9.
17. Brown DM. Cytolytic CD4 cells: Direct mediators in infectious disease and malignancy. Cell Immunol (2010) 262(2):89–95. doi: 10.1016/j.cellimm.2010.02.008
18. Sujino T, London M, Hoytema van Konijnenburg DP, Rendon T, Buch T, Silva HM, et al. Tissue adaptation of regulatory and intraepithelial CD4(+) T cells controls gut inflammation. Science (2016) 352(6293):1581–6. doi: 10.1126/science.aaf3892
19. Takeuchi A, Saito T. CD4 CTL, a Cytotoxic Subset of CD4(+) T Cells, Their Differentiation and Function. Front Immunol (2017) 8:194. doi: 10.3389/fimmu.2017.00194
20. Perez-Diez A, Joncker NT, Choi K, Chan WF, Anderson CC, Lantz O, et al. CD4 cells can be more efficient at tumor rejection than CD8 cells. Blood (2007) 109(12):5346–54. doi: 10.1182/blood-2006-10-051318
21. Quezada SA, Simpson TR, Peggs KS, Merghoub T, Vider J, Fan X, et al. Tumor-reactive CD4(+) T cells develop cytotoxic activity and eradicate large established melanoma after transfer into lymphopenic hosts. J Exp Med (2010) 207(3):637–50. doi: 10.1084/jem.20091918
22. Oh DY, Kwek SS, Raju SS, Li T, McCarthy E, Chow E, et al. Intratumoral CD4(+) T Cells Mediate Anti-tumor Cytotoxicity in Human Bladder Cancer. Cell (2020) 181(7):1612–25.e13. doi: 10.1016/j.cell.2020.05.017
23. Juno JA, van Bockel D, Kent SJ, Kelleher AD, Zaunders JJ, Munier CM. Cytotoxic CD4 T Cells-Friend or Foe during Viral Infection? Front Immunol (2017) 8:19. doi: 10.3389/fimmu.2017.00019
24. Kischkel FC, Hellbardt S, Behrmann I, Germer M, Pawlita M, Krammer PH, et al. Cytotoxicity-dependent APO-1 (Fas/CD95)-associated proteins form a death-inducing signaling complex (DISC) with the receptor. EMBO J (1995) 14(22):5579–88. doi: 10.1002/j.1460-2075.1995.tb00245.x
25. Nagata S, Golstein P. The Fas death factor. Science (1995) 267(5203):1449–56. doi: 10.1126/science.7533326
26. Krammer PH. CD95’s deadly mission in the immune system. Nature (2000) 407(6805):789–95. doi: 10.1038/35037728
27. Trapani JA, Smyth MJ. Functional significance of the perforin/granzyme cell death pathway. Nat Rev Immunol (2002) 2(10):735–47. doi: 10.1038/nri911
28. Corthay A, Skovseth DK, Lundin KU, Røsjø E, Omholt H, Hofgaard PO, et al. Primary antitumor immune response mediated by CD4+ T cells. Immunity (2005) 22(3):371–83. doi: 10.1016/j.immuni.2005.02.003
29. Jursik C, Prchal M, Grillari-Voglauer R, Drbal K, Fuertbauer E, Jungfer H, et al. Large-scale production and characterization of novel CD4+ cytotoxic T cells with broad tumor specificity for immunotherapy. Mol Cancer Res (2009) 7(3):339–53. doi: 10.1158/1541-7786.MCR-07-2208
30. Whelan JP, Chatten J, Lampson LA. HLA Class I and β2-Microglobulin Expression in Frozen and Formaldehyde-fixed Paraffin Sections of Neuroblastoma Tumors. Cancer Res (1985) 45(11 Part 2):5976–83.
31. Wölfl M, Jungbluth AA, Garrido F, Cabrera T, Meyen-Southard S, Spitz R, et al. Expression of MHC class I, MHC class II, and cancer germline antigens in neuroblastoma. Cancer Immunol Immunother (2005) 54(4):400–6. doi: 10.1007/s00262-004-0603-z
32. Lawrence MS, Stojanov P, Polak P, Kryukov GV, Cibulskis K, Sivachenko A, et al. Mutational heterogeneity in cancer and the search for new cancer-associated genes. Nature (2013) 499(7457):214. doi: 10.1038/nature12213
33. Chmielecki J, Bailey M, He J, Elvin J, Vergilio JA, Ramkissoon S, et al. Genomic Profiling of a Large Set of Diverse Pediatric Cancers Identifies Known and Novel Mutations across Tumor Spectra. Cancer Res (2017) 77(2):509–19. doi: 10.1158/0008-5472.CAN-16-1106
34. Aoki T, Hino M, Koh K, Kyushiki M, Kishimoto H, Arakawa Y, et al. Low Frequency of Programmed Death Ligand 1 Expression in Pediatric Cancers. Pediatr Blood Cancer (2016) 63(8):1461–4. doi: 10.1002/pbc.26018
35. Melaiu O, Mina M, Chierici M, Boldrini R, Jurman G, Romania P, et al. PD-L1 Is a Therapeutic Target of the Bromodomain Inhibitor JQ1 and, Combined with HLA Class I, a Promising Prognostic Biomarker in Neuroblastoma. Clin Cancer Res (2017) 23(15):4462–72. doi: 10.1158/1078-0432.ccr-16-2601
36. Majzner RG, Simon JS, Grosso JF, Martinez D, Pawel BR, Santi M, et al. Assessment of programmed death-ligand 1 expression and tumor-associated immune cells in pediatric cancer tissues. Cancer (2017) 123(19):3807–15. doi: 10.1002/cncr.30724
37. Silva MA, Triltsch N, Leis S, Kanchev I, Tan TH, Van Peel B, et al. Biomarker recommendation for PD-1/PD-L1 immunotherapy development in pediatric cancer based on digital image analysis of PD-L1 and immune cells. J Pathol Clin Res (2020) 6(2):124–37. doi: 10.1002/cjp2.152
38. Zuo S, Sho M, Sawai T, Kanehiro H, Maeda K, Yoshida M, et al. Potential role of the PD-L1 expression and tumor-infiltrating lymphocytes on neuroblastoma. Pediatr Surg Int (2020) 36(2):137–43. doi: 10.1007/s00383-019-04616-9
39. Shirinbak S, Chan RY, Shahani S, Muthugounder S, Kennedy R, Hung LT, et al. Combined immune checkpoint blockade increases CD8+CD28+PD-1+ effector T cell and provides a therapeutic strategy for patients with neuroblastoma. OncoImmunology (2021) 10(1):e1838140. doi: 10.1080/2162402X.2020.1838140
40. Zhang W, Yu Y, Hertwig F, Thierry-Mieg J, Zhang W, Thierry-Mieg D, et al. Comparison of RNA-seq and microarray-based models for clinical endpoint prediction. Genome Biol (2015) 16(1):133. doi: 10.1186/s13059-015-0694-1
41. Su Z, Fang H, Hong H, Shi L, Zhang W, Zhang W, et al. An investigation of biomarkers derived from legacy microarray data for their utility in the RNA-seq era. Genome Biol (2014) 15(12):523. doi: 10.1186/s13059-014-0523-y
42. Sasaki T, Kanaseki T, Shionoya Y, Tokita S, Miyamoto S, Saka E, et al. Microenvironmental stresses induce HLA-E/Qa-1 surface expression and thereby reduce CD8(+) T-cell recognition of stressed cells. Eur J Immunol (2016) 46(4):929–40. doi: 10.1002/eji.201545835
43. Hardy MY, Tye-Din JA. Coeliac disease: a unique model for investigating broken tolerance in autoimmunity. Clin Transl Immunol (2016) 5(11):e112. doi: 10.1038/cti.2016.58
44. Zhen Z, Guo X, Liao R, Yang K, Ye L, You Z. Involvement of IL-10 and TGF-β in HLA-E-mediated neuroblastoma migration and invasion. Oncotarget (2016) 7(28):44340. doi: 10.18632/oncotarget.10041
45. Vance RE, Jamieson AM, Raulet DH. Recognition of the class Ib molecule Qa-1(b) by putative activating receptors CD94/NKG2C and CD94/NKG2E on mouse natural killer cells. J Exp Med (1999) 190(12):1801–12. doi: 10.1084/jem.190.12.1801
46. Hidalgo L, Einecke G, Allanach K, Halloran P. The transcriptome of human cytotoxic T cells: similarities and disparities among allostimulated CD4+ CTL, CD8+ CTL and NK cells. Am J Transplant (2008) 8(3):627–36. doi: 10.1111/j.1600-6143.2007.02128.x
47. Zaguia F, Saikali P, Ludwin S, Newcombe J, Beauseigle D, McCrea E, et al. Cytotoxic NKG2C+ CD4 T cells target oligodendrocytes in multiple sclerosis. J Immunol (2013) 190(6):2510–8. doi: 10.4049/jimmunol.1202725
48. Marshall NB, Vong AM, Devarajan P, Brauner MD, Kuang Y, Nayar R, et al. NKG2C/E Marks the Unique Cytotoxic CD4 T Cell Subset, ThCTL, Generated by Influenza Infection. J Immunol (2017) 198(3):1142–55. doi: 10.4049/jimmunol.1601297
49. Lopez-Vergès S, Milush JM, Pandey S, York VA, Arakawa-Hoyt J, Pircher H, et al. CD57 defines a functionally distinct population of mature NK cells in the human CD56dimCD16+ NK-cell subset. Blood (2010) 116(19):3865–74. doi: 10.1182/blood-2010-04-282301
50. Iwaszko M, Bogunia-Kubik K. Clinical significance of the HLA-E and CD94/NKG2 interaction. Arch Immunol Ther Exp (Warsz) (2011) 59(5):353–67. doi: 10.1007/s00005-011-0137-y
51. Wagner JA, Fehniger TA. Human Adaptive Natural Killer Cells: Beyond NKG2C. Trends Immunol (2016) 37(6):351–3. doi: 10.1016/j.it.2016.05.001
52. Vély F, Golub R, Vivier E. HLA-Fatal attraction. Nat Immunol (2016) 17(9):1012–4. doi: 10.1038/ni.3541
53. Borst L, van der Burg SH, van Hall T. The NKG2A-HLA-E Axis as a Novel Checkpoint in the Tumor Microenvironment. Clin Cancer Res (2020) 26(21):5549–56. doi: 10.1158/1078-0432.ccr-19-2095
54. Boles KS, Barchet W, Diacovo T, Cella M, Colonna M. The tumor suppressor TSLC1/NECL-2 triggers NK-cell and CD8+ T-cell responses through the cell-surface receptor CRTAM. Blood (2005) 106(3):779–86. doi: 10.1182/blood-2005-02-0817
55. Takeuchi A, Badr Mel S, Miyauchi K, Ishihara C, Onishi R, Guo Z, et al. CRTAM determines the CD4+ cytotoxic T lymphocyte lineage. J Exp Med (2016) 213(1):123–38. doi: 10.1084/jem.20150519
56. Ando K, Ohira M, Ozaki T, Nakagawa A, Akazawa K, Suenaga Y, et al. Expression of TSLC1, a candidate tumor suppressor gene mapped to chromosome 11q23, is downregulated in unfavorable neuroblastoma without promoter hypermethylation. Int J Cancer (2008) 123(9):2087–94. doi: 10.1002/ijc.23776
57. Kumar V, Patel S, Tcyganov E, Gabrilovich DI. The nature of myeloid-derived suppressor cells in the tumor microenvironment. Trends Immunol (2016) 37(3):208–20. doi: 10.1016/j.it.2016.01.004
58. Quail DF, Joyce JA. Molecular Pathways: Deciphering Mechanisms of Resistance to Macrophage-Targeted Therapies. Clin Cancer Res (2017) 23(4):876–84. doi: 10.1158/1078-0432.ccr-16-0133
59. Blavier L, Yang RM, DeClerck YA. The Tumor Microenvironment in Neuroblastoma: New Players, New Mechanisms of Interaction and New Perspectives. Cancers (Basel) (2020) 12(10):2912. doi: 10.3390/cancers12102912
60. Liu KX, Joshi S. “Re-educating” Tumor Associated Macrophages as a Novel Immunotherapy Strategy for Neuroblastoma. Front Immunol (2020) 11:1947. doi: 10.3389/fimmu.2020.01947
61. Craddock JA, Lu A, Bear A, Pule M, Brenner MK, Rooney CM, et al. Enhanced tumor trafficking of GD2 chimeric antigen receptor T cells by expression of the chemokine receptor CCR2b. J Immunother (2010) 33(8):780–8. doi: 10.1097/CJI.0b013e3181ee6675
62. Liberman J, Sartelet H, Flahaut M, Mühlethaler-Mottet A, Coulon A, Nyalendo C, et al. Involvement of the CXCR7/CXCR4/CXCL12 axis in the malignant progression of human neuroblastoma. PLoS One (2012) 7(8):e43665. doi: 10.1371/journal.pone.0043665
63. McNerney KO, Karageorgos SA, Hogarty MD, Bassiri H. Enhancing Neuroblastoma Immunotherapies by Engaging iNKT and NK Cells. Front Immunol (2020) 11:873. doi: 10.3389/fimmu.2020.00873
64. Castriconi R, Dondero A, Bellora F, Moretta L, Castellano A, Locatelli F, et al. Neuroblastoma-derived TGF-β1 modulates the chemokine receptor repertoire of human resting NK cells. J Immunol (2013) 190(10):5321–8. doi: 10.4049/jimmunol.1202693
65. Ge Z, Ding S. The Crosstalk Between Tumor-Associated Macrophages (TAMs) and Tumor Cells and the Corresponding Targeted Therapy. Front Oncol (2020) 10:2404. doi: 10.3389/fonc.2020.590941
66. Whiteside TL. Clinical Impact of Regulatory T cells (Treg) in Cancer and HIV. Cancer Microenviron (2015) 8(3):201–7. doi: 10.1007/s12307-014-0159-1
67. Kumar P, Bhattacharya P, Prabhakar BS. A comprehensive review on the role of co-signaling receptors and Treg homeostasis in autoimmunity and tumor immunity. J Autoimmun (2018) 95:77–99. doi: 10.1016/j.jaut.2018.08.007
68. Blank CU, Haining WN, Held W, Hogan PG, Kallies A, Lugli E, et al. Defining ‘T cell exhaustion’. Nat Rev Immunol (2019) 19(11):665–74. doi: 10.1038/s41577-019-0221-9
69. Khan O, Giles JR, McDonald S, Manne S, Ngiow SF, Patel KP, et al. TOX transcriptionally and epigenetically programs CD8(+) T cell exhaustion. Nature (2019) 571(7764):211–8. doi: 10.1038/s41586-019-1325-x
70. Fuertes Marraco SA, Neubert NJ, Verdeil G, Speiser DE. Inhibitory Receptors Beyond T Cell Exhaustion. Front Immunol (2015) 6:310. doi: 10.3389/fimmu.2015.00310
71. Zhang P, Wu X, Basu M, Dong C, Zheng P, Liu Y, et al. MYCN amplification is associated with repressed cellular immunity in neuroblastoma: an in silico immunological analysis of TARGET database. Front Immunol (2017) 8:1473. doi: 10.3389/fimmu.2017.01473
72. Layer JP, Kronmüller MT, Quast T, van den Boorn-Konijnenberg D, Effern M, Hinze D, et al. Amplification of N-Myc is associated with a T-cell-poor microenvironment in metastatic neuroblastoma restraining interferon pathway activity and chemokine expression. Oncoimmunology (2017) 6(6):e1320626. doi: 10.1080/2162402x.2017.1320626
73. Wei JS, Kuznetsov IB, Zhang S, Song YK, Asgharzadeh S, Sindiri S, et al. Clinically Relevant Cytotoxic Immune Cell Signatures and Clonal Expansion of T-Cell Receptors in High-Risk MYCN-Not-Amplified Human Neuroblastoma. Clin Cancer Res (2018) 24(22):5673–84. doi: 10.1158/1078-0432.ccr-18-0599
74. Liu Z, Grant CN, Sun L, Miller BA, Spiegelman VS, Wang HG. Expression Patterns of Immune Genes Reveal Heterogeneous Subtypes of High-Risk Neuroblastoma. Cancers (Basel) (2020) 12(7):1739. doi: 10.3390/cancers12071739
75. Dahal LN, Dou L, Hussain K, Liu R, Earley A, Cox KL, et al. STING Activation Reverses Lymphoma-Mediated Resistance to Antibody Immunotherapy. Cancer Res (2017) 77(13):3619–31. doi: 10.1158/0008-5472.CAN-16-2784
76. Varner JA. Abstract PL03-03: Taming the beast: Strategies to target the immune-suppressive macrophage to enhance cancer immune therapy. Philadelphia (PA): AACR (2019). doi: 10.1158/1538-7445.AM2019-PL03-03
77. Zhang F, Parayath NN, Ene CI, Stephan SB, Koehne AL, Coon ME, et al. Genetic programming of macrophages to perform anti-tumor functions using targeted mRNA nanocarriers. Nat Commun (2019) 10(1):3974. doi: 10.1038/s41467-019-11911-5
78. Hartley GP, Chow L, Ammons DT, Wheat WH, Dow SW. Programmed Cell Death Ligand 1 (PD-L1) Signaling Regulates Macrophage Proliferation and Activation. Cancer Immunol Res (2018) 6(10):1260–73. doi: 10.1158/2326-6066.CIR-17-0537
79. Gordon SR, Maute RL, Dulken BW, Hutter G, George BM, McCracken MN, et al. PD-1 expression by tumour-associated macrophages inhibits phagocytosis and tumour immunity. Nature (2017) 545(7655):495–9. doi: 10.1038/nature22396
80. Chao MP, Alizadeh AA, Tang C, Myklebust JH, Varghese B, Gill S, et al. Anti-CD47 antibody synergizes with rituximab to promote phagocytosis and eradicate non-Hodgkin lymphoma. Cell (2010) 142(5):699–713. doi: 10.1016/j.cell.2010.07.044
81. Tavazoie MF, Pollack I, Tanqueco R, Ostendorf BN, Reis BS, Gonsalves FC, et al. LXR/ApoE Activation Restricts Innate Immune Suppression in Cancer. Cell (2018) 172(4):825–40.e18. doi: 10.1016/j.cell.2017.12.026
82. Strauss L, Mahmoud MAA, Weaver JD, Tijaro-Ovalle NM, Christofides A, Wang Q, et al. Targeted deletion of PD-1 in myeloid cells induces antitumor immunity. Sci Immunol (2020) 5(43):eaay1863. doi: 10.1126/sciimmunol.aay1863
83. Baumann T, Dunkel A, Schmid C, Schmitt S, Hiltensperger M, Lohr K, et al. Regulatory myeloid cells paralyze T cells through cell-cell transfer of the metabolite methylglyoxal. Nat Immunol (2020) 21(5):555–66. doi: 10.1038/s41590-020-0666-9
84. Borriello L, Nakata R, Sheard MA, Fernandez GE, Sposto R, Malvar J, et al. Cancer-Associated Fibroblasts Share Characteristics and Protumorigenic Activity with Mesenchymal Stromal Cells. Cancer Res (2017) 77(18):5142–57. doi: 10.1158/0008-5472.can-16-2586
85. Yu AL, Gilman AL, Ozkaynak MF, London WB, Kreissman SG, Chen HX, et al. Anti-GD2 antibody with GM-CSF, interleukin-2, and isotretinoin for neuroblastoma. N Engl J Med (2010) 363(14):1324–34. doi: 10.1056/NEJMoa0911123
86. Sait S, Modak S. Anti-GD2 immunotherapy for neuroblastoma. Expert Rev Anticancer Ther (2017) 17(10):889–904. doi: 10.1080/14737140.2017.1364995
87. Schumacher-Kuckelkorn R, Volland R, Gradehandt A, Hero B, Simon T, Berthold F. Lack of immunocytological GD2 expression on neuroblastoma cells in bone marrow at diagnosis, during treatment, and at recurrence. Pediatr Blood Cancer (2017) 64(1):46–56. doi: 10.1002/pbc.26184
88. Sujjitjoon J, Atchaneeyasakul L-o, Tsao S-T, Sayour E. Yenchitsomanus, P-t and Chang, L-J: GD2-specific chimeric antigen receptor T cells targeting retinoblastoma. Philadelphia (PA): AACR (2015). doi: 10.1158/1538-7445.AM2015-3150
89. Castriconi R, Dondero A, Augugliaro R, Cantoni C, Carnemolla B, Sementa AR, et al. Identification of 4Ig-B7-H3 as a neuroblastoma-associated molecule that exerts a protective role from an NK cell-mediated lysis. Proc Natl Acad Sci USA (2004) 101(34):12640–5. doi: 10.1073/pnas.0405025101
90. Schlitter A-M, Dorneburg C, Barth TF, Wahl J, Schulte JH, Brüderlein S, et al. CD57high neuroblastoma cells have aggressive attributes ex situ and an undifferentiated phenotype in patients. PLoS One (2012) 7(8):e42025. doi: 10.1371/journal.pone.0042025
91. Hata JL, Correa H, Krishnan C, Esbenshade AJ, Black JO, Chung DH, et al. Diagnostic utility of PHOX2B in primary and treated neuroblastoma and in neuroblastoma metastatic to the bone marrow. Arch Pathol Lab Med (2015) 139(4):543–6. doi: 10.5858/arpa.2014-0255-OA
92. Brady SW, Liu Y, Ma X, Gout AM, Hagiwara K, Zhou X, et al. Pan-neuroblastoma analysis reveals age- and signature-associated driver alterations. Nat Commun (2020) 11(1):5183. doi: 10.1038/s41467-020-18987-4
93. Nael A, Matsuno R, Shows J, Warren M, Gastier-Foster J, Ikegaki N, et al. Loss of ATRX Expression in Neuroblastoma. In: Abstracts from Society for Pediatric Pathology Spring meeting. San Antonio, TX: SAGE Publishing Pediatr Dev Pathol (2017) 20(6):528. doi: 10.1177/1093526617742042
94. Nael A, Matsuno R, Shows J, Warren M, Gastier-Foster J, Ikegaki N, et al. TERT Overexpression in Neuroblastoma. In: Society for Pediatric Pathology, Fall meeting, Denver, CO. 2017 Scientific Abstract Book. Chicago, IL: Society for Pediatric Pathology (2017). Available at: https://www.spponline.org/SPP/media/OldSite/2017_Scientific_Abstract_Book.pdf.
95. Warren M, Matsuno R, Tran H, Shimada H. Utility of Phox2b immunohistochemical stain in neural crest tumours and non-neural crest tumours in paediatric patients. Histopathology (2018) 72(4):685–96. doi: 10.1111/his.13412
96. Kim HJ, Cantor H. CD4 T-cell subsets and tumor immunity: the helpful and the not-so-helpful. Cancer Immunol Res (2014) 2(2):91–8. doi: 10.1158/2326-6066.cir-13-0216
97. Haque A, Moriyama M, Kubota K, Ishiguro N, Sakamoto M, Chinju A, et al. CD206(+) tumor-associated macrophages promote proliferation and invasion in oral squamous cell carcinoma via EGF production. Sci Rep (2019) 9(1):14611. doi: 10.1038/s41598-019-51149-1
98. Jayasingam SD, Citartan M, Thang TH, Mat Zin AA, Ang KC, Ch’ng ES. Evaluating the Polarization of Tumor-Associated Macrophages Into M1 and M2 Phenotypes in Human Cancer Tissue: Technicalities and Challenges in Routine Clinical Practice. Front Oncol (2019) 9:1512. doi: 10.3389/fonc.2019.01512
Keywords: HLA-E, NKG2E/KLRC3, CRTAM, CADM1, TME (tumor microenvironment), neuroblastoma
Citation: Tang XX, Shimada H and Ikegaki N (2021) Clinical Relevance of CD4 Cytotoxic T Cells in High-Risk Neuroblastoma. Front. Immunol. 12:650427. doi: 10.3389/fimmu.2021.650427
Received: 07 January 2021; Accepted: 16 March 2021;
Published: 22 April 2021.
Edited by:
Ilaria Marigo, Veneto Institute of Oncology (IRCCS), ItalyReviewed by:
Kawaljit Kaur, University of California, Los Angeles, United StatesMartina Spiljar, University of Geneva, Switzerland
Copyright © 2021 Tang, Shimada and Ikegaki. This is an open-access article distributed under the terms of the Creative Commons Attribution License (CC BY). The use, distribution or reproduction in other forums is permitted, provided the original author(s) and the copyright owner(s) are credited and that the original publication in this journal is cited, in accordance with accepted academic practice. No use, distribution or reproduction is permitted which does not comply with these terms.
*Correspondence: Naohiko Ikegaki, ikegaki@uic.edu