 Lianghe Yu1†Ningjia Shen1†Yan Shi1†Xintong Shi1Xiaohui Fu1Shuang Li2*Bin Zhu1*
 Wenlong Yu1*
 Yongjie Zhang1*
- 1Hepatobiliary Surgery, the third affiliated hospital, Naval Military Medical University, Shanghai, China
- 2Bioinformatics R&D Department, Hangzhou Mugu Technology Co., Ltd, Hangzhou, China
Background: Cancer-associated fibroblasts (CAFs) are involved in tumor growth, angiogenesis, metastasis, and resistance to therapy. We sought to explore the CAFs characteristics in hepatocellular carcinoma (HCC) and establish a CAF-based risk signature for predicting the prognosis of HCC patients.
Methods: The signal-cell RNA sequencing (scRNA-seq) data was obtained from the GEO database. Bulk RNA-seq data and microarray data of HCC were obtained from the TCGA and GEO databases respectively. Seurat R package was applied to process scRNA-seq data and identify CAF clusters according to the CAF markers. Differential expression analysis was performed to screen differentially expressed genes (DEGs) between normal and tumor samples in TCGA dataset. Then Pearson correlation analysis was used to determine the DEGs associated with CAF clusters, followed by the univariate Cox regression analysis to identify CAF-related prognostic genes. Lasso regression was implemented to construct a risk signature based on CAF-related prognostic genes. Finally, a nomogram model based on the risk signature and clinicopathological characteristics was developed.
Results: Based on scRNA-seq data, we identified 4 CAF clusters in HCC, 3 of which were associated with prognosis in HCC. A total of 423 genes were identified from 2811 DEGs to be significantly correlated with CAF clusters, and were narrowed down to generate a risk signature with 6 genes. These six genes were primarily connected with 39 pathways, such as angiogenesis, apoptosis, and hypoxia. Meanwhile, the risk signature was significantly associated with stromal and immune scores, as well as some immune cells. Multivariate analysis revealed that risk signature was an independent prognostic factor for HCC, and its value in predicting immunotherapeutic outcomes was confirmed. A novel nomogram integrating the stage and CAF-based risk signature was constructed, which exhibited favorable predictability and reliability in the prognosis prediction of HCC.
Conclusion: CAF-based risk signatures can effectively predict the prognosis of HCC, and comprehensive characterization of the CAF signature of HCC may help to interpret the response of HCC to immunotherapy and provide new strategies for cancer treatment.
Introduction
Liver cancer is a lethal disease with high prevalence and unfavorable outcomes, where liver hepatocellular carcinoma (HCC) is the primary malignancy of liver cancer, consisting of 75%–85% of cases (1). Although significantly progression in the treatment of HCC, the average 5- year survival rate remains below 20% due to the development of recurrence (2, 3). It has been suggested that several factors such as chronic liver disease, alcohol addiction, and metabolic syndrome, increasing obesity rates, contribute to an increased incidence and mortality of HCC (4). Over the past decades, our understanding of the molecular pathogenesis of HCC has improved significantly thanks to the rapid development of omics technology (5, 6). A series of omic data-derived signatures were generated to predict the clinical outcomes of HCC (7). Accordingly, more novel multigene signature are valuable for predicting the outcome and recurrence of HCC.
The tumor microenvironment (TME) is composed of tumor cells and stromal cells. The malignant potential of tumors has long been thought to be entirely due to cancer cells (8). However, the dynamic crosstalk between cancer cells and stromal cells has been shown to be involved in cancer progression (9). The stroma consists of fibroblasts, pericytes, mesenchymal stem cells, and various types of immune cells, which were surrounded by fibrous structural proteins in the extracellular matrix (10). Cancer-associated fibroblasts (CAFs) are important components of the TME which arise from bone marrow-derived mesenchymal stem cells, hematopoietic stem cells, adipocytes, and endothelial cells (8, 11), as well as cancer cells (12). CAFs have been observed in a majority of cancers, such as breast cancer, prostate cancers, and HCC (13, 14), and its crosstalk with cancer cells has been revealed to be crucial for tumor progression (15). CAFs secrete a variety of growth factors and cytokines, and degrade extracellular matrix proteins, thereby affecting tumor cell proliferation, metastasis and chemotherapy resistance (16–18). CAFs could be stably maintained the tumor-promoting characteristics even without exposure to cancer cells (19). Therefore, it has become a potential strategy to shut down the downstream effects of CAFs or inhibit CAF-secreted factors that facilitate tumor development and progression for HCC intervention.
Although many studies focusing on CAF have been carried out in HCC, the systematic CAF characteristics and its relationship with HCC prognosis and immunotherapy response remain poorly understood. Herein, we obtained HCC single-cell RNA-sequencing (scRNA-seq) data and transcriptome data from accessible databases. We distinguished CAFs subclusters and identified CAF-based risk signature for HCC. Clinical relevance of the CAF-based signature was determined, and the immune landscaoe and responsiveness to immunotherapy underlying the CAF-based signature were further analzyed. Finally, we developed a novel nomogram combining the CAF-based risk signature and clinicopathological features to facilitate the clinical application of CAF features in the prognosis of HCC. It may provide new insights into the pathophysiology of HCC, leading to more tailored treatments and improved outcomes for patients with HCC.
Materials and methods
Data acquisition and processing
ScRNA-seq data of GSE149614 was downloaded from the Gene Expression Omnibus (GEO) database, including 10 samples of primary tumors, 2 samples of portal vein tumor thrombi, 1 sample of metastatic lymph node, and 8 samples of non-tumor liver. For scRNA-seq data, single cells were firstly screened with each gene expressing in at least 3 cells and each cell expressing at least 250 genes. Then PercentageFeatureSet function in Seurat R package was conducted to evaluate the proportion of mitochondria and rRNA. The single cells were further screened by setting each cell expressing at least 6000 genes with UMI > 100. Finally, a total of 69145 cells were remained. The transcriptome data, single-nucleotide variant (SNV) and copy number variants (CNV) data of Masked Copy Number Segment, and corresponding clinical information of HCC were obtained from The Cancer Genome Atlas (TCGA) database. For transcriptome data, the samples without survival data and outcome status were removed, and eventually, 360 tumor samples and 50 para-cancerous samples were included. GSE76427 cohort with 115 HCC samples was downloaded from the GEO database as a validation cohort after the removal of normal tissue samples and tumor samples without follow-up and outcome status information. Ten cancer-related pathways (Cell Cycle, HIPPO, MYC, NOTCH, NRF1, PI3K, TGF-Beta, RAS, TP53, and WNT) were retrieved from the literature (20).
Definition of CAF
We re-analyzed the scRNA-seq data of HCC using the Seurat package (21) to comprehensively characterize the CAF signature. Firstly, we removed the cells with over 6000 or below 250 expressed genes, followed by log normalization of expressed genes. The batch effects for 21 samples were eliminated using the FindIntegrationAnchors function. The non-linear dimensional reduction was conducted using the uniform manifold approximation and projection method, with 15 principal components and a resolution at 0.2. Single cells were clustered into different subgroups by using the functions of FindNeighbors and FindClusters (dim = 40 and resolution = 0.2).Then t-distributed stochastic neighbor embedding (TSNE) dimensional reduction was conducted using the RunTSNE function. Fibroblasts were annotated with 4 marker genes, including ACTA2, FAP, PDGFRB, and NOTCH3. The fibroblasts were re-clustered with the same algorithm of FindNeighbors and FindClusters functions. TSNE dimensionality reduction was further performed on fibroblasts clusters. Marker genes of each CAF cluster were identified using FindAllMarkers function by comparing one cluster with other clusters with logFC = 0.5, minpct = 0.35, and adjusted p-value<0.05. Kyoto Encyclopedia of Genes and Genomes (KEGG) enrichment analysis on the marker genes of CAFs clusters using the clusterProfiler package (22), and the CNV characteristics among the CAFs clusters were analyzed using the CopyKAT R package to differentiate between tumor cells and normal cells in each sample (23).
Identification of hub genes of CAF
Firstly, the differentially expressed genes (DEGs) between the tumor and normal tissue were screened out via limma package with a false discovery rate (FDR)<0.05 and |log2(Fold Change)|>1 (24). Then, we assessed the correlations between the DEGs and CAF clusters, and identify the key CAF-related genes with p<0.001 and cor>0.4. The prognosis-related genes were further identified using univariate Cox regression analysis in survival package with p<0.05 (https://rdocumentation.org/packages/survival/versions/2.42-3). To compress the gene number, we performed the least absolute shrinkage and selection operator (lasso) cox regression analysis, followed by multivariate Cox regression analysis with a stepwise regression method. According to the results of the multivariate Cox model, we constructed a risk signature with the following formula: risk score=Σβi*Expi. Where i is the gene in risk signature, expi represents the expression of the gene i, and βi represents the coefficients of gene i in multivariate Cox model. The patients were divided into the high- and low-risk groups after zero-mean normalization. The receiver operating characteristic curve (ROC) analysis was performed using the timeROC package (https://cran.r-project.org/web/packages/timeROC/index.html) to analyze the predictive performance of the risk signature. Similar analyses were conducted in the validation cohort.
Immune landscape analysis
The proportions of 22 immune cell subtypes in the TCGA cohort were evaluated by the CIBERSORT algorithm (25), a tool for assessing immune cell infiltration, and the immune and stromal scores were calculated using the ESTIMATE algorithm (https://sourceforge.net/projects/estimateproject/) to further explore the TME.
Construction of a risk signature and nomogram
To construct a nomogram model for clinical use, we first perform the univariate and multivariate Cox regression analysis on clinicopathological and risk signature. The variables with p<0.05 in the multivariate Cox model were used to construct a nomogram for the prediction of HCC prognosis using the rms package (26). The calibration curve was generated to evaluate the predictive accuracy of the model. The reliability of the model was evaluated using decision curve analysis (DCA).
Responsiveness to immune checkpoint blocks
We downloaded the transcriptomic, and matched clinical data of patients with HCC treated with an anti-PD-L1 agent (atezolizumab) (27) from IMvigor210 cohort (http://research-pub.gene.com/IMvigor210CoreBiologies). Meanwhile, GSE78220 cohort comprised of transcriptomic data from pre-treatment melanomas receiving anti-PD-1 checkpoint inhibition therapy (28), and also download for the determination of the potential value of the risk signature score in the prediction of responsiveness to immune checkpoint blocks (ICB).
Statistical analysis
All statistical analyses were performed using the R software (v3.6.3). The correlation matrices were conducted using Pearson or Spearman correlation. Wilcoxon test was conducted for the comparisons between the two groups. Survival differences were compared using K–M curves with a Log-rank test. P-value < 0.05 was considered statistical significance.
Results
Screening the CAFs in scRNA-seq samples
The flow chart of this study was shown in Figure 1. A total of 69145 cells were obtained from the scRNA-seq data after initial screening (Table 1). The detailed results of data preprocessing were shown in Figure S1. After log-normalization and dimensionality reduction, 15 subpopulations were obtained, and 9 CAF populations were identified based on four marker genes, including ACTA2, FAP, PDGFRB, and NOTCH3 (Figures S2A, B). The cells of 9 CAF populations were extracted for further clustering and dimensionality reduction. The CAF populations were further clustered by using the same clustering algorithm and four CAF clusters were identified (Figures S2C, D). The epithelial cell specific gene was not expressed in all four CAF clusters, supporting the accuracy of CAF identification (Figure S3). Figure 2A showed the TSNE plot of 21 sample distributions. As a result, four CAF clusters were finally generated and used for subsequent analysis (Figure 2B). A total of 211 DEGs among the 4 CAF clusters were identified and the expression of the top 5 DEGs (determined as the marker genes of CAF clusters) in the 4 clusters was shown in Figure 2C. The proportion of the 4 clusters in each cohort were illustrated in Figure 2D. As shown in Figure 2E, the results of KEGG analysis demonstrated that these DEGs were enriched in multiple pathways, including vascular smooth muscle contraction, focal adhesion, oxytcosin signaling pathway, PPARG signaling pathway, etc. In addition, the 4 CAF clusters consist of 1533 tumor cells and normal cells according to the CNV characteristics (Figure 2F).
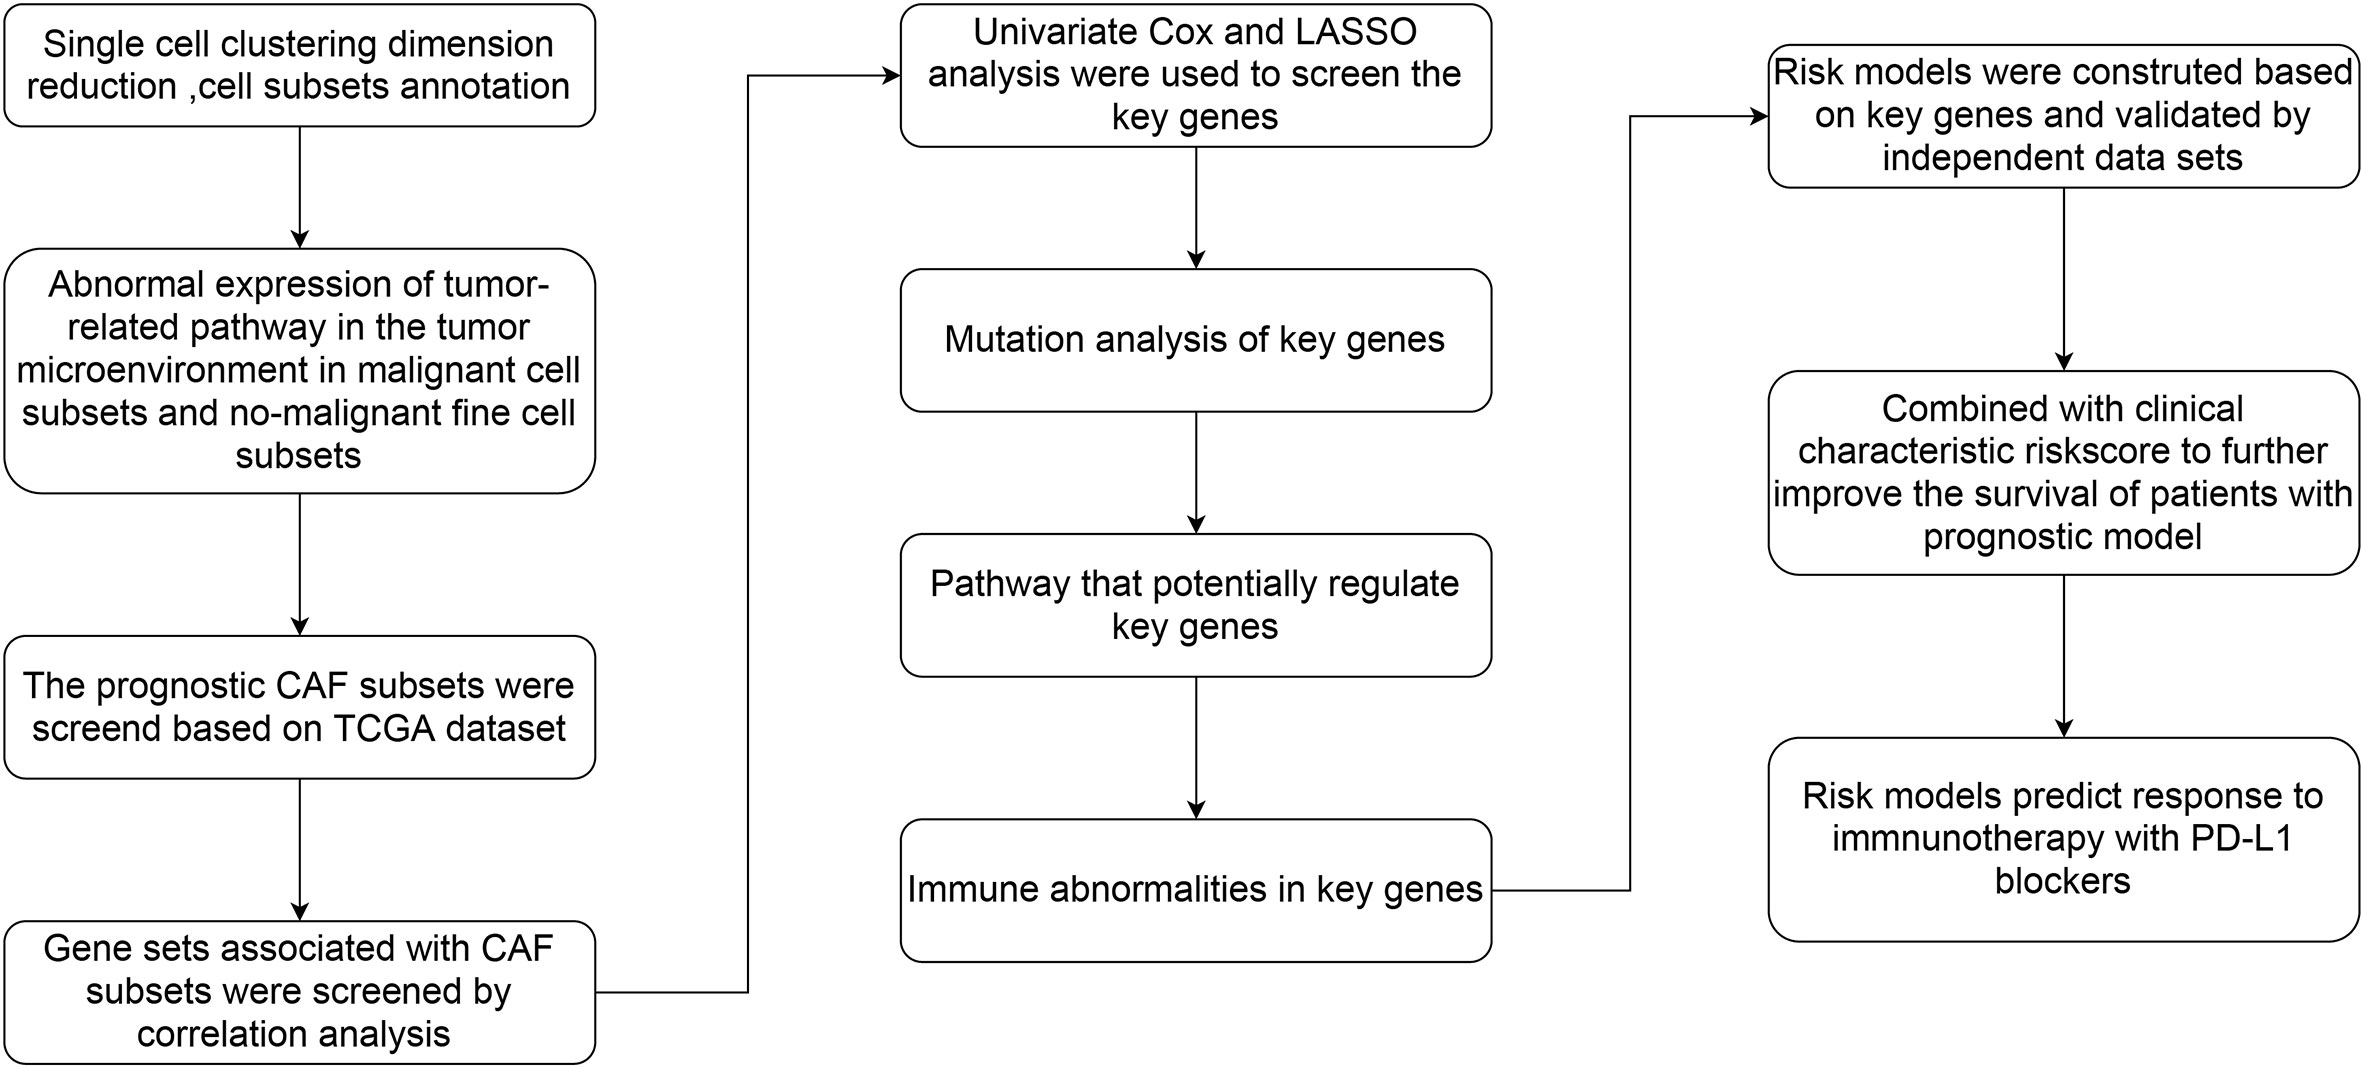
Figure 1 The flow chart of this study.
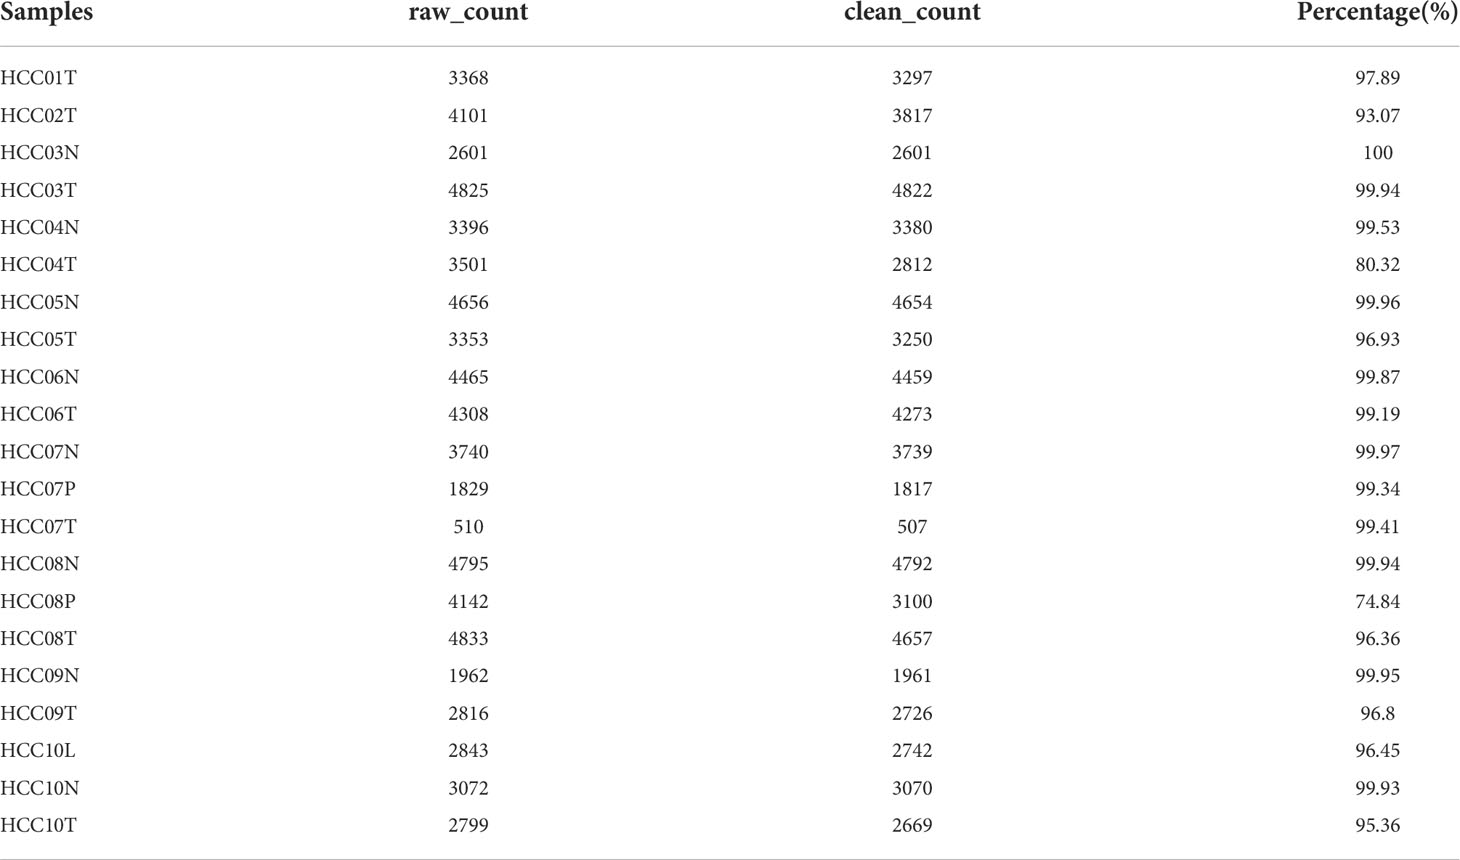
Table 1 Cell counts before and after filtration of samples.
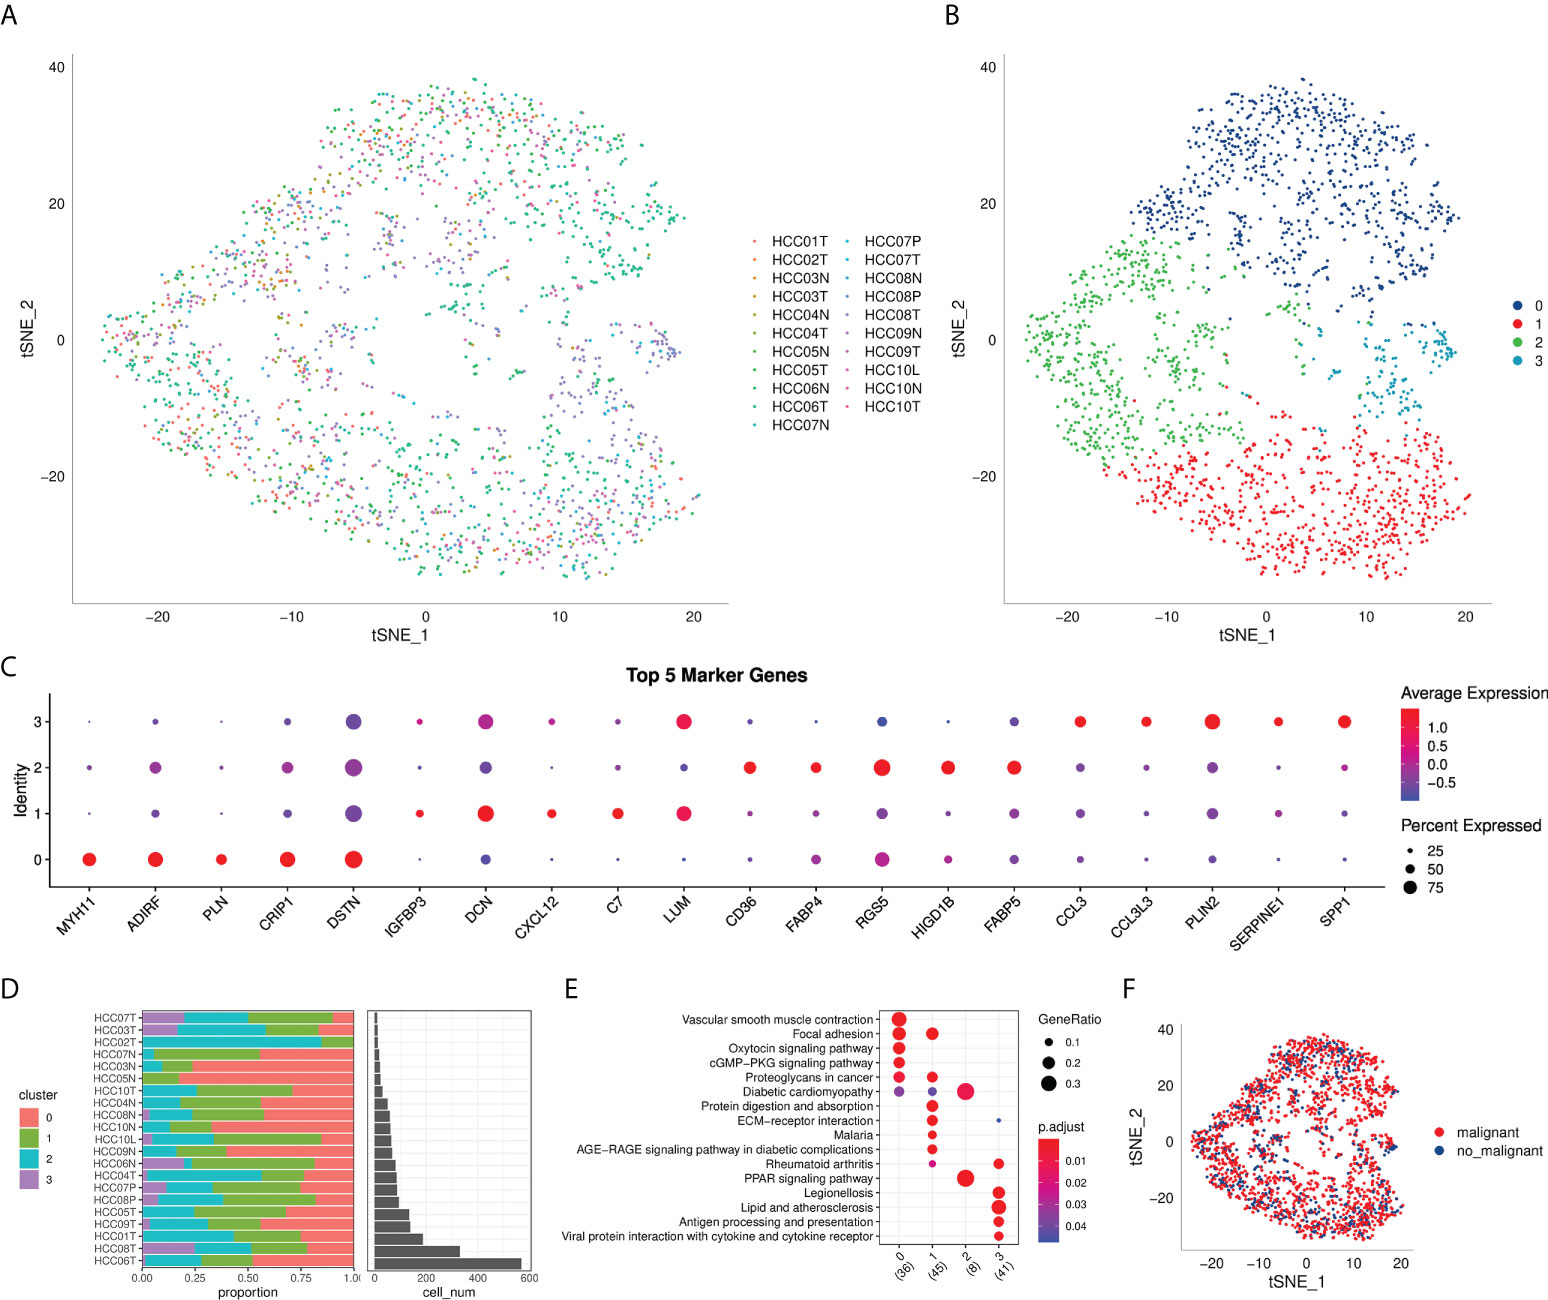
Figure 2 The identification of CAF clusters based on scRNA seq data of HCC patients. (A) tsne plot of the distribution of 21 samples; (B) tsne plot of the distribution of four fibroblasts after clustering; (C) dot plot of the top 5 marker gene expression of subgroups; (D) subgroups in cancer tissue and Proportion and cell number of adjacent tissue; (E) kegg enrichment analysis of 4 fibroblast subsets; (F) tsne distribution map of malignant and non-malignant cells predicted by copykat package.
The expression of cancer-related pathways in CAF
To elucidate the associations between the CAF clusters and tumor progression, we investigated the characteristics of ten tumor-related pathways in the four CAF clusters. The GSVA scores of the ten tumor-related pathways in different CAF clusters were shown in Figure 3A. The ratio of malignant cells in CAF_0 cluster was significantly higher than that in the other three clusters (Figure 3B). However, there were no significant differences among the CAF_1, CAF_2, and CAF_3. Furthermore, we analyzed the GSVA scores of the ten tumor-related pathways between malignant and non-malignant cells in each CAF cluster, with slight differences observed (Figures 3C-F).
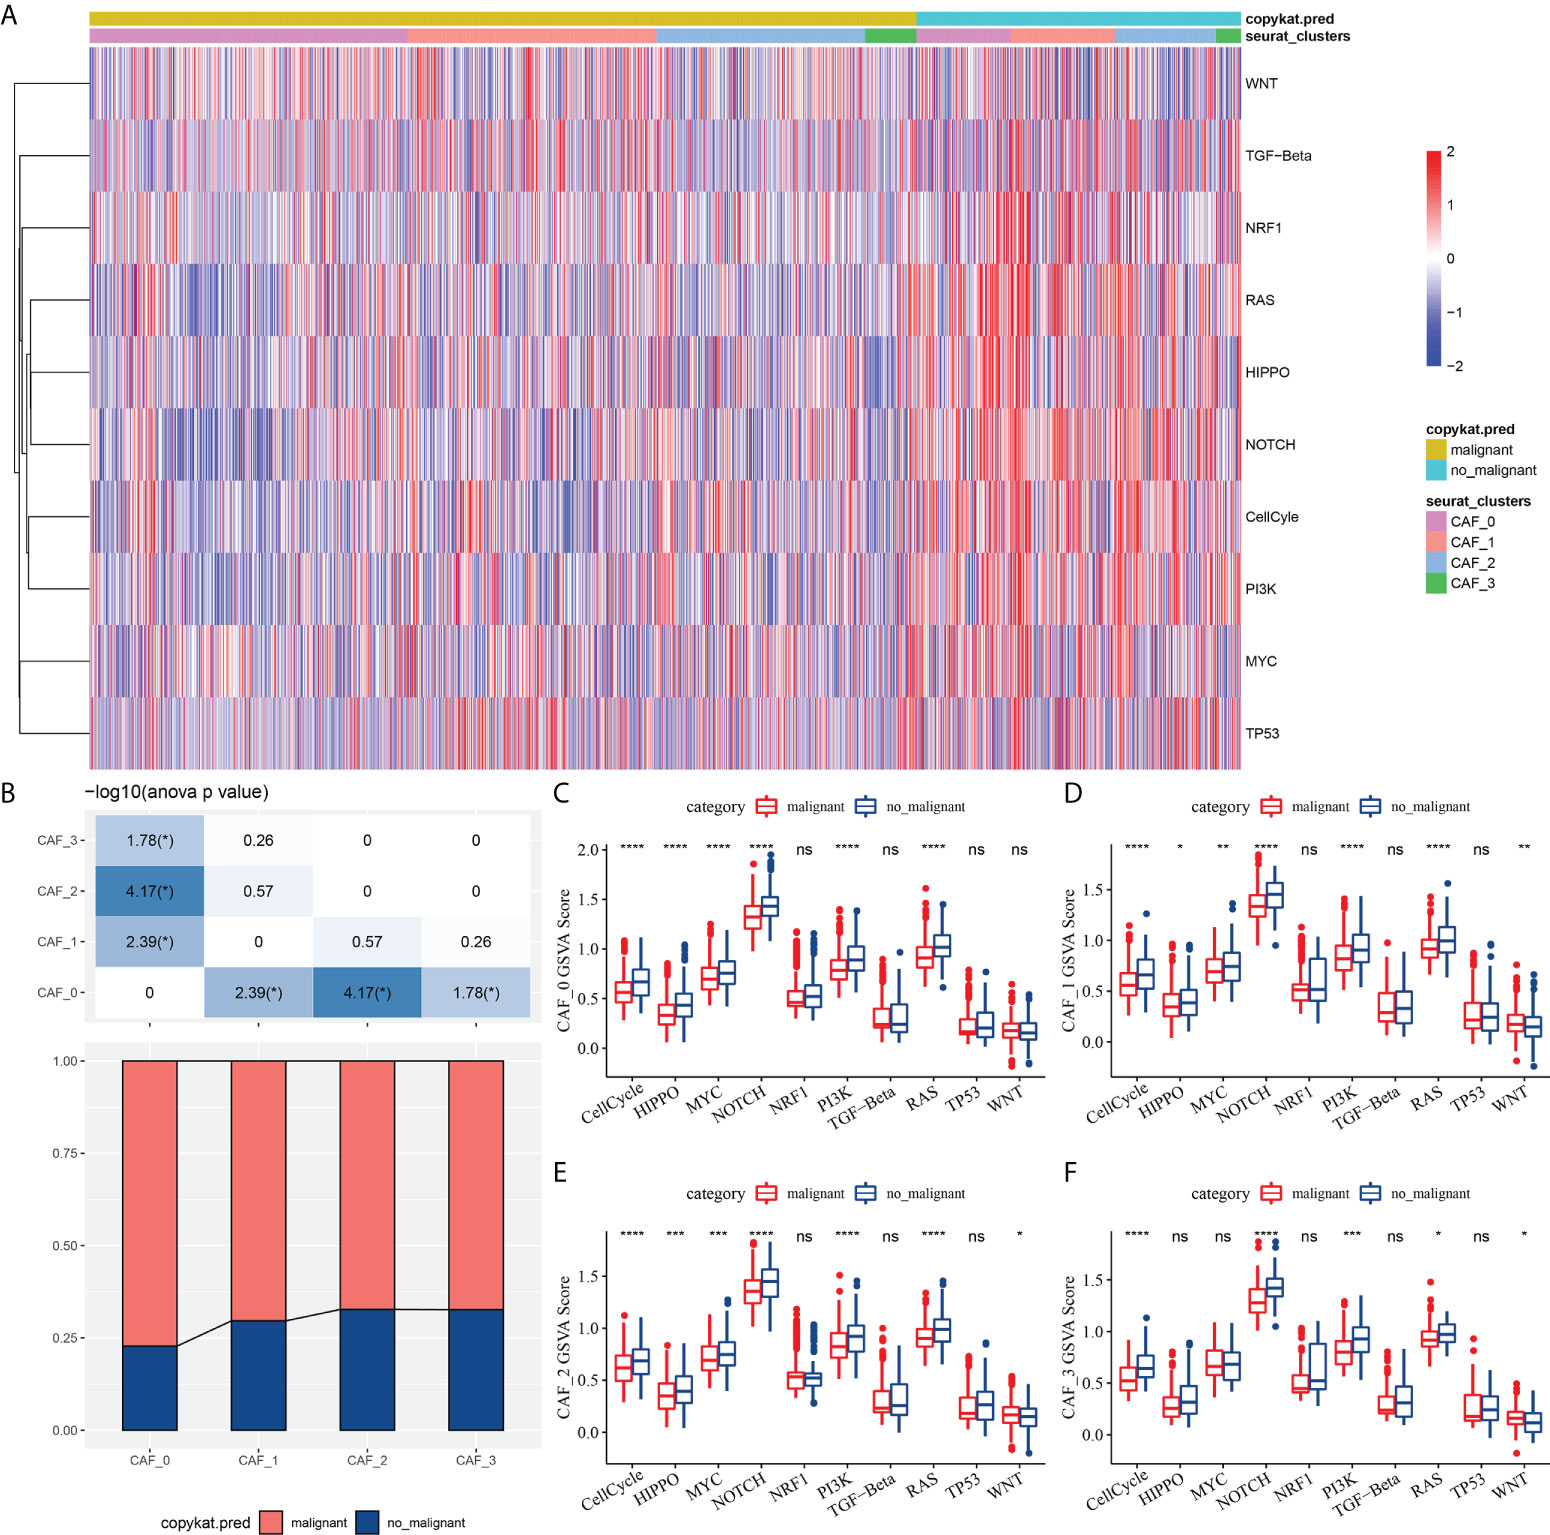
Figure 3 The characteristics of tumor-related pathways in CAF clusters. (A) Heatmap of 10 tumor-related pathway scores enriched in CAF cells; (B) Comparison of CAF clusters in malignant and non-malignant cells; Comparison of GSVA score of each pathways between malignant and non-malignant cells in CAF_0 (C), CAF_1 (D),CAF_2 (E), and CAF_3 cluster (F). (wilcox.test, *P < 0.05; **P < 0.01; ***P < 0.001; and ****P < 0.0001). ns, not significant.
To determine the associations between the CAF clusters and prognosis, we first calculated the ssGSEA score of the marker genes (the top 5 DEGs of CAF clusters defined in Figure 2C) of each CAF cluster based on the TCGA cohort. The results demonstrated that the CAF_2 cluster had a significantly higher score in tumor samples than in normal samples, whereas the other CAF clusters had an opposite trend, with a higher score in normal samples than in tumor samples (Figure 4A). The HCC samples of TCGA dataset were separated into the high- and low-CAF score groups according to the optimal cut-off value analyzed by survminer R package. The samples in the high-CAF score group had a better prognosis in the CAF_0, CAF_1, and CAF_2 clusters than those in the low-CAF score group, whereas the CAF_3 was not associated with the prognosis of HCC (Figures 4B-E). The above results suggested that CAF_3 cluster may contribute little in the HCC progression although CAF_3 enrichment was differential in HCC and normal samples.
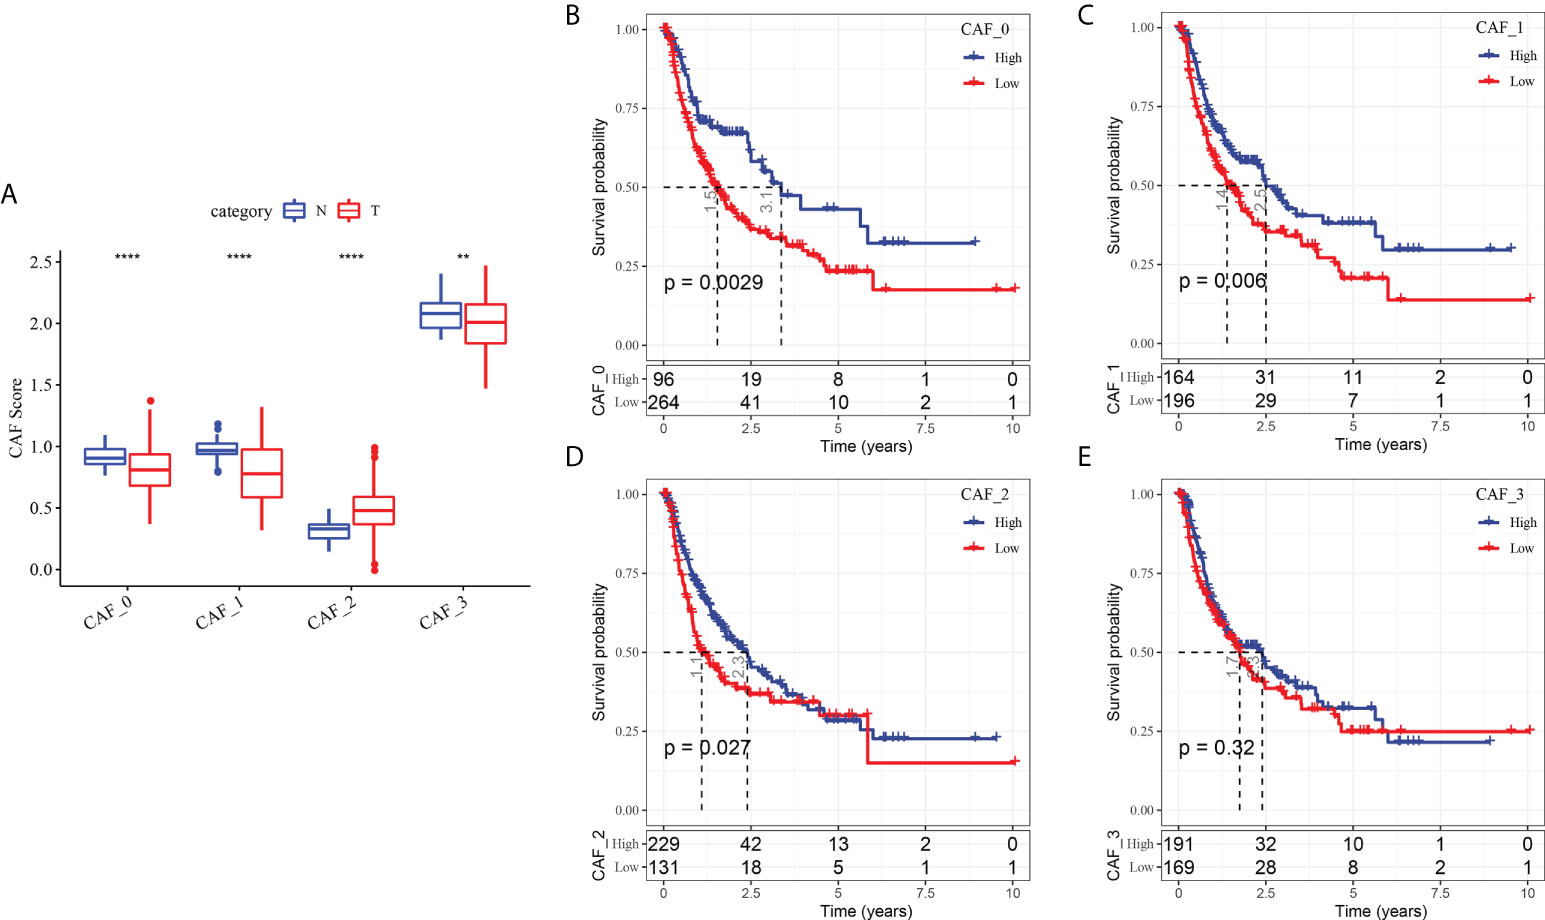
Figure 4 The associations between the four CAF cluster and prognosis of HCC patients. (A) Comparison of four CAF scores in cancer and normal tissues; K-M curves of the high and low CAF score groups in the CAF_0 cluster (B), CAF_0 cluster (C), CAF_0 cluster (D), and CAF_0 cluster (E). **P < 0.01, ****P < 0.0001.
Identification of hub genes associated with CAF
To construct a risk signature, we firstly screened out DEGs between the tumor and normal tissues. As shown in Figure 5A, a total of 2349 DEGs were obtained, with 462 up-regulated DEGs and 1887 down-regulated DEGs. Among them, there are 423 genes that showed significant correlations with those prognosis-related CAF clusters. Furthermore, the prognostic value of each gene was assessed via univariate Cox regression analysis, with 234 genes exhibiting prognostic values (Figures 5A, B). Lasso Cox regression analysis was performed to narrow down the number of genes, with 11 genes left as lambda=0.047 (Figures 5C, D). Finally, we included 6 genes, including HMG-box containing 3 (HMGXB3), GCN1 activator of EIF2AK4 (GCN1), LUC7 like 3 pre-mRNA splicing factor (LUC7L3), ADAMTS like 2 (ADAMTSL2), solute carrier organic anion transporter family member 2A1 (SLCO2A1), and CD4 molecule (CD4), in the risk signature after multivariate Cox regression analysis with stepwise regression method (Figure 5E). The final 6-gene signature formula is as follows: RiskScore = -0.088*ADAMTSL2 - 0.121*SLCO2A1 - 0.217*CD4 + 0.249*GCN1 + 0.345*HMGXB3 + 0.271*LUC7L3. We calculated the risk score for each sample and divided them into the high- and low-risk groups after z-mean normalization. The AUC values of the model for 1- to 5-year survival range from 0.68 to 0.76 in the TCGA cohort and range from 0.65 to 0.7 in the GEO cohort (Figures 5F, G). Kaplan-Meier survival analyses revealed that high-risk patients had significantly poorer survival outcomes compared with low-risk patients in the TCGA cohort, as well as in the GEO cohort (Figures 5H, I).
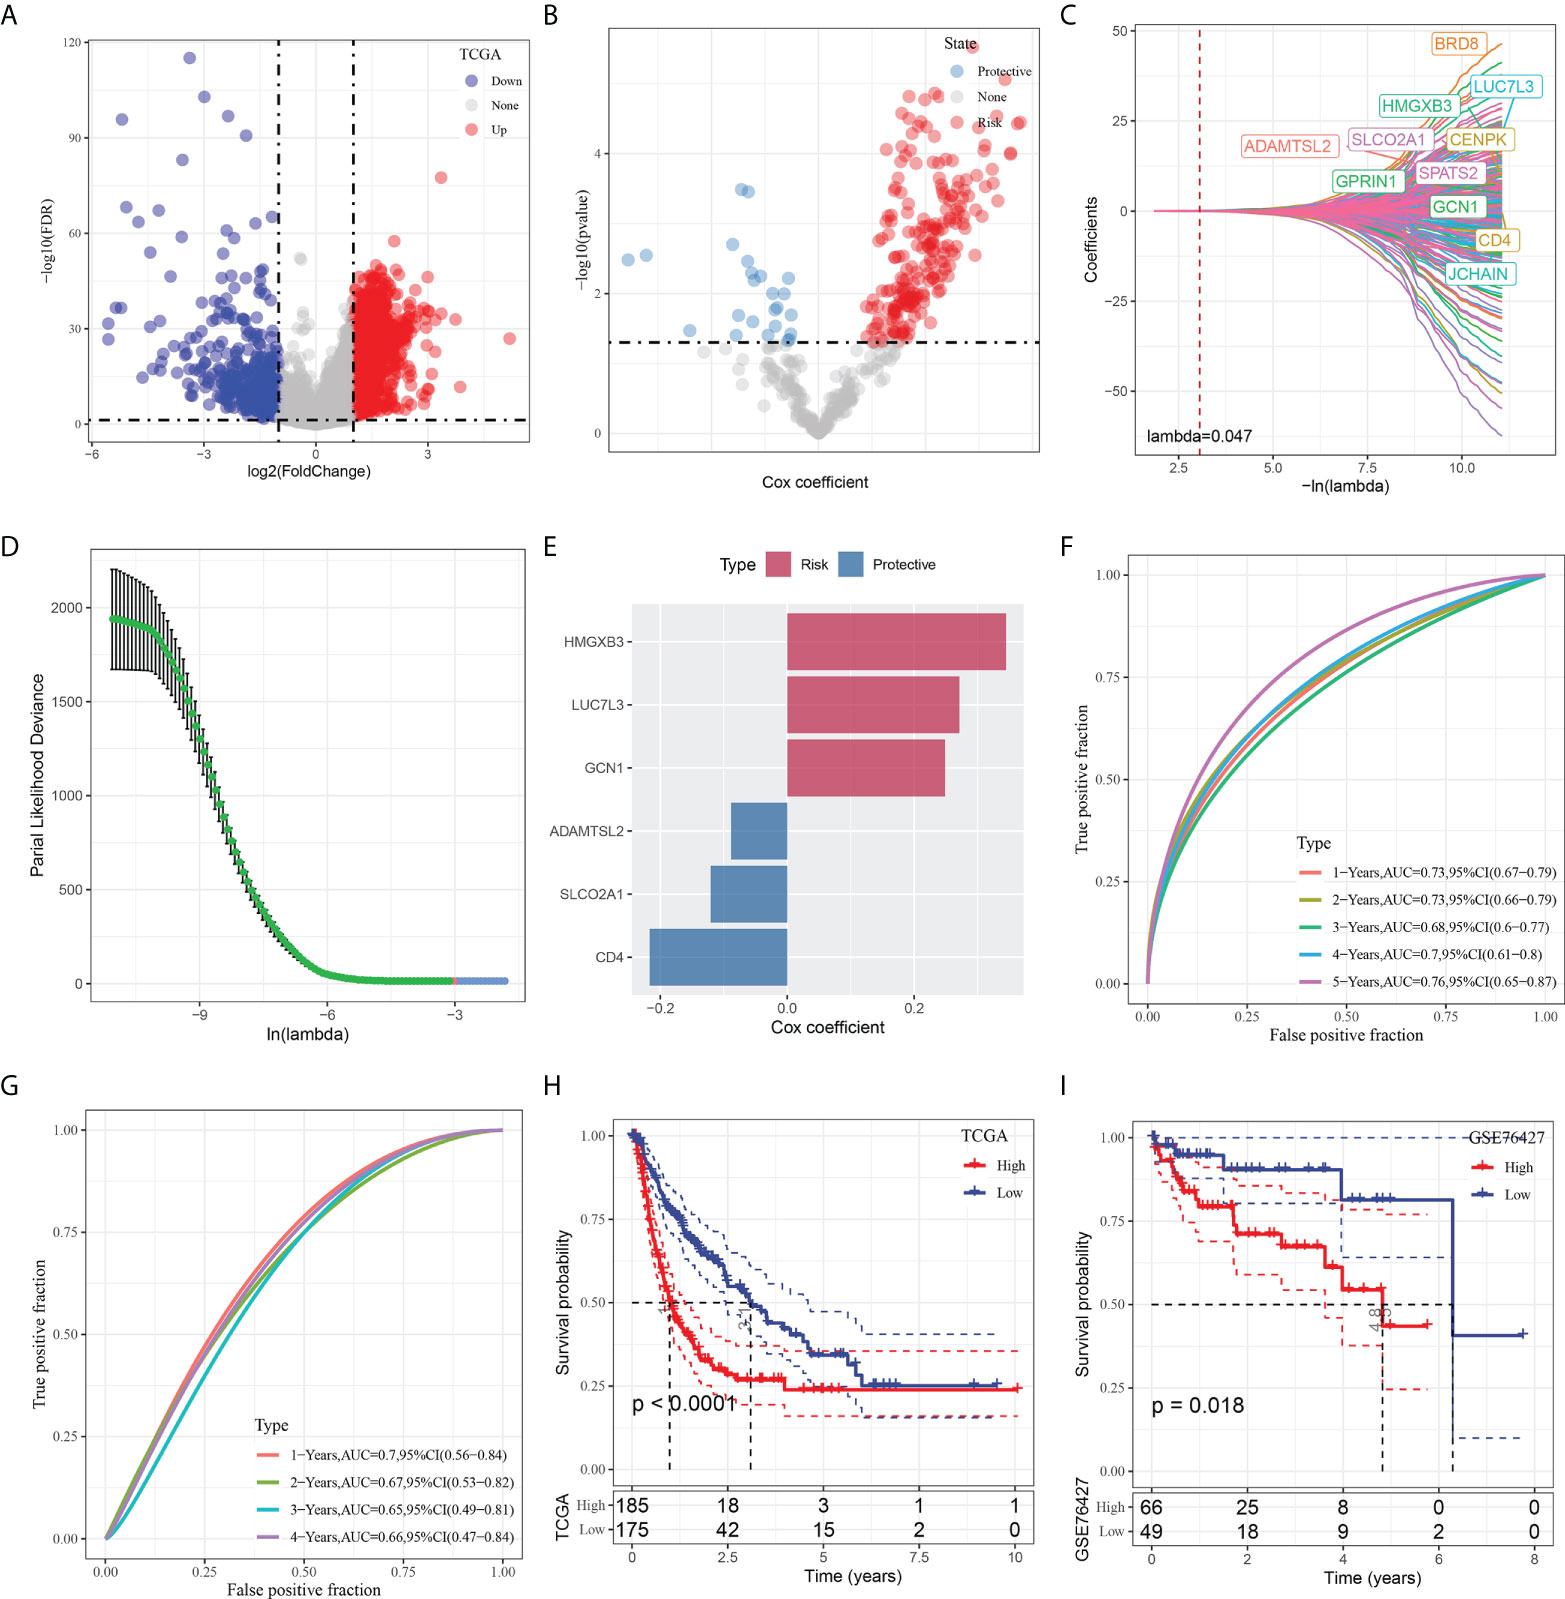
Figure 5 Identification of the hub predictive genes to construct a risk signature. (A) Volcano plot of differentially expressed genes of cancer and normal tissues in TCGA cohort; (B) Volcano plot of prognosis-related genes identified from univariate Cox regression analysis; (C) The trajectory of each independent variable with lambda; (D) Plots of the produced coefficient distributions for the logarithmic (lambda) series for parameter selection (lambda); (E) The multivariate Cox coefficients for each genes in the risk signature. (F) and (G) ROC curves of risk model constructed by 6 genes in TCGA cohort and GEO cohort; (H) and (I) K-M curves of risk model constructed by 6 genes in TCGA cohort and GEO cohort.
Mutation and pathway analysis of the hub genes
Next, we checked out the SNV mutations of the six genes of the risk signature. It showed that ADAMTSL2, SLCO2A1, HMGXB3, LUC7L3, and CD4 have SNV mutations in more samples, while no SNV mutation was observed in GCN1 (Figure S4A). We analyzed the co-occurrence probability of these key genes and the 10 most mutated genes. As revealed in Figure S4B, there was no significant probability of co-occurrence of the mutations in these 5 genes, but LUC7L3 presented a significant probability of co-occurrence with ABCA13 mutation. In the 6 genes, it was found that only a very small number of samples had gain/loss of CNV (Figure S4C). To further elucidate the associations between the risk genes and HCC, we analyzed the correlations between these genes and several molecular signatures of HCC. The results demonstrated that SLCO2A1 had significantly negative correlations with Aneuploidy Score, Homologous Recombination Defects, Fraction Altered, Number of Segments, and Nonsilent Mutation Rate, whereas HMGXB3, LUC7L3, and GCN1 showed significantly positive correlations with Homologous Recombination Defects and Fraction Altered (Figure S4D). In addition, we analyzed the potential pathways associated with each risk gene. As shown in Figures 6A, B, a total of 39 pathways were significantly correlated with these six genes, including angiogenesis, apical junction, apoptosis, etc.
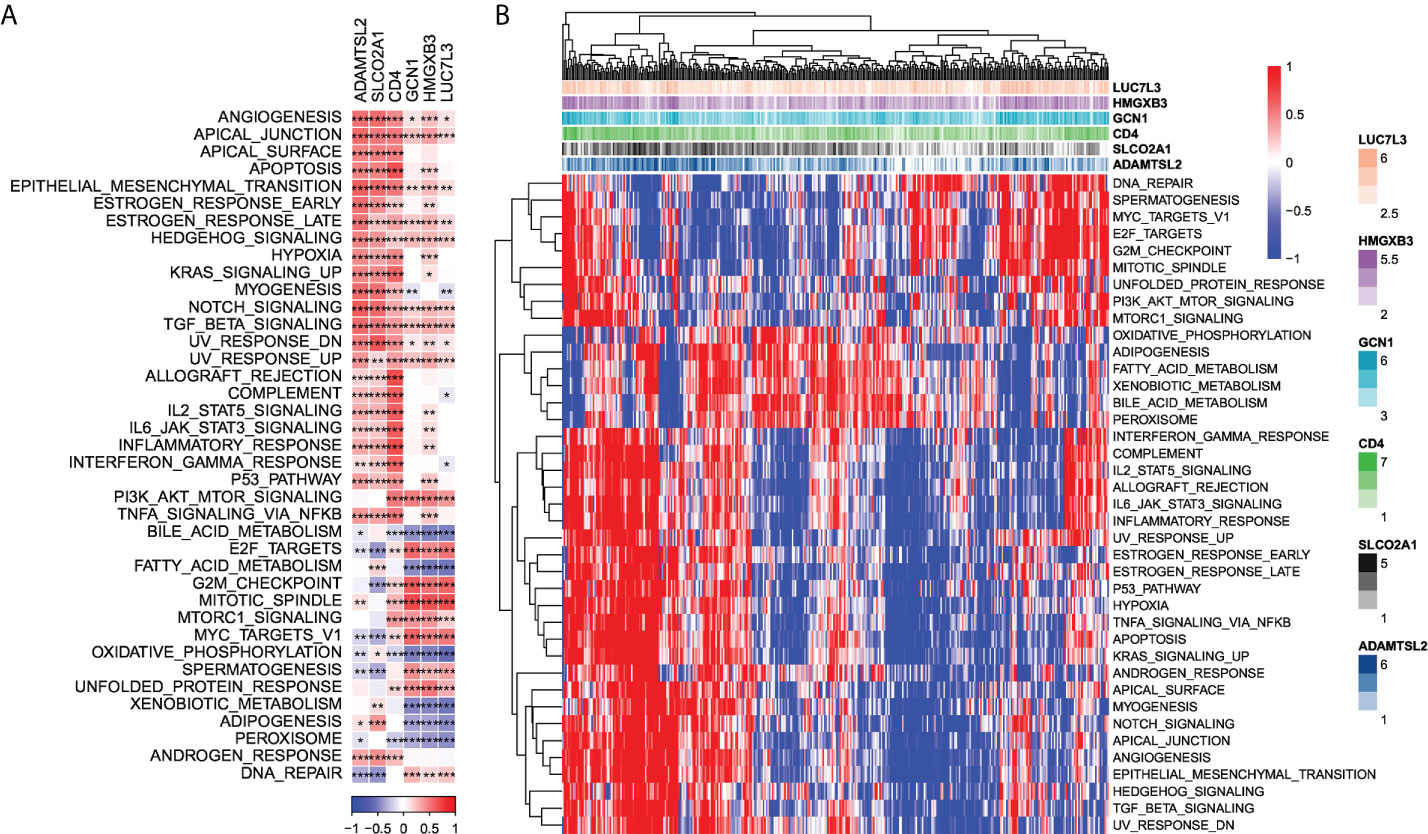
Figure 6 Identification of pathways that the risk genes involved in. (A) Gene-pathway correlation heatmap; (B) Enrichment score heatmap for key pathways. *P < 0.05, **P < 0.01, ***P < 0.001.
Relationship between hub genes and immunity
Our data demonstrated that ADAMTSL2, SLCO2A1, and CD4 presented significantly positive correlations with the stromal score, immune score, and estimate score, while LUC7L3 showed significantly negative correlations with the stromal, immune, and estimate scores. However, there was no significant correlations observed between the three scores and the other genes (GCN1 and HMGXB3) (Figure S5A). After grouping according to the median value of expression of each gene, we compared the three scores in different expressed groups. The results showed that, with regard to the ADAMTSL2, SLCO2A1, and CD4 genes, the three scores of the high expression group were significantly higher than those of the low expression group (Figure S5B). Correlation analysis revealed that ADAMTSL2, SLCO2A1, and CD4 presented a significantly negative correlation with the majority of T cells. Additionally, LUC7L3, GCN1, and HMGXB3 significantly positively correlated with M0 macrophages and neutrophils (Figure S5C). Moreover, we also observed significant differences between the high and low expression groups of risk genes in several immune cells (Figure S5D).
The responsiveness of risk signature to PD-L1 blockade immunotherapy
T-cell immunotherapy has emerged as an anticancer treatment with synergistic survival benefits (29). Therefore, we assessed the prognostic value of risk signature for immune-checkpoint therapy in the IMvigor210 and GSE78220 cohorts. The 348 patients in the IMvigor210 cohort showed varying degrees of response to anti-PD-L1 receptor blockers, including complete response (CR), partial response (PR), stable disease (SD), and progressive disease (PD). SD/PD patients presented higher risk scores than CR/PR patients (Figure 7A). In the high-risk group, the percentage of SD/PD was higher than that in the low-risk group (Figure 7B). We observed that in the IMvigor210 cohort, patients in the low-risk group showed significant clinical benefits and a significantly longer overall survival as compared with those in the high-risk group (Figure 7C, p=0.0053). Specifically, there were significant survival differences in Stage I+II patients between the different risk groups (Figure 7D, p=0.0017), but not in Stage III+IV patients (Figure 7E, p=0.5). It suggested that the risk score is more sensitive in early-stage patients. In the GSE78220 cohort, we also found a significantly longer overall survival of patients in low-risk group than in high-risk group (Figure 7F, p=0.036). Meanwhile, the percentage of SD/PD in the high-risk group was higher than that in the low risk group (Figure 7G).
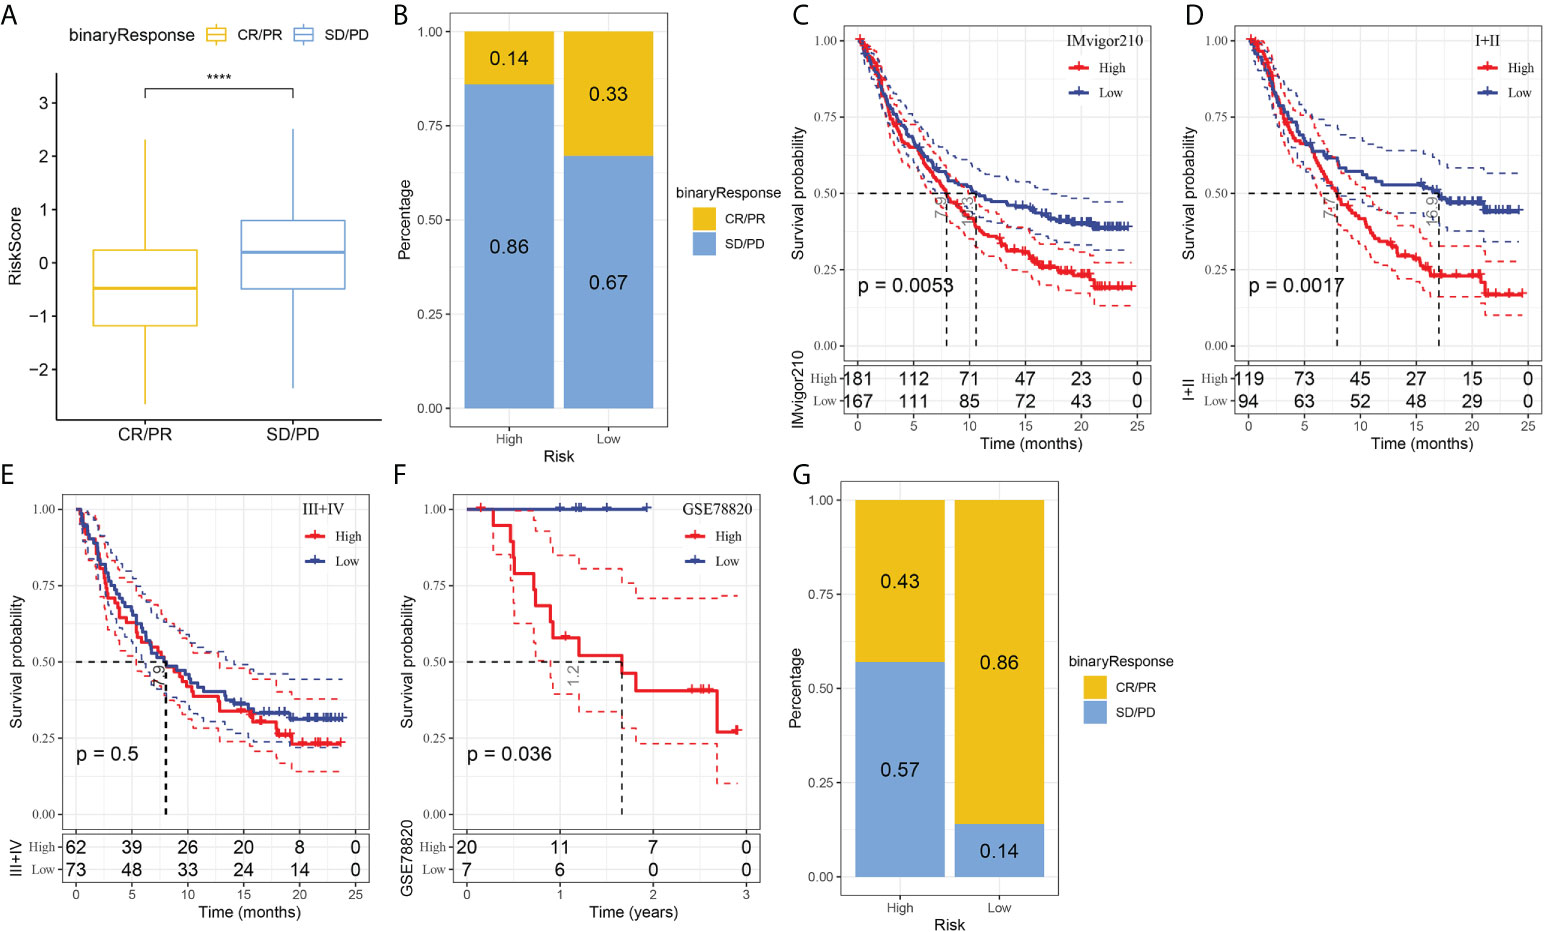
Figure 7 The responsiveness of risk score to PD-L1 blockade immunotherapy in IMvigor210 cohort. (A) Differences in risk scores among immunotherapy responses in the IMvigor210 cohort; (B) Distribution of immunotherapy responses among risk score groups in the IMvigor210 cohort; (C) Prognostic differences among risk score groups in the IMvigor210 cohort; (D) Prognostic differences between risk score groups in early stage patients in the IMvigor210 cohort; (E) prognostic differences between risk score groups in advanced patients in the IMvigor210 cohort; (F) prognostic differences in risk score groups in the GSE78220 cohort; (G) Distribution of immunotherapy responses among risk score groups in the GSE78220 cohort. ****P < 0.0001.
Identification of independent risk factors and nomogram developing
To optimize the predictive performance of the risk signature, we integrated the clinicopathological characteristics and risk score via univariate and multivariate Cox regression analysis. Multivariate analysis demonstrated that risk signature was the most significant independent prognostic factor of osteosarcoma [hazard ratio (HR) = 1.77, 95% confidence interval (CI): 1.42 - 2.13, P < 0.001], followed by metastatic status (HR = 1.74, 95%CI: 1.22 - 2.46, P = 0.002) (Figures 8A, B). Therefore, a nomogram combining stage and risk score was constructed, as shown in Figure 8C. The calibration plot demonstrated that the nomogram can effectively forecast the actual survival outcomes (Figure 8D). Moreover, DCA revealed a better discriminative ability of the nomogram in recognizing patients at high risk than the risk score and stage, as shown in Figure 8E. TimeROC analysis showed that the AUC of the risk score and nomogram was higher than that of other indicators in the TCGA cohort (Figure 8F).
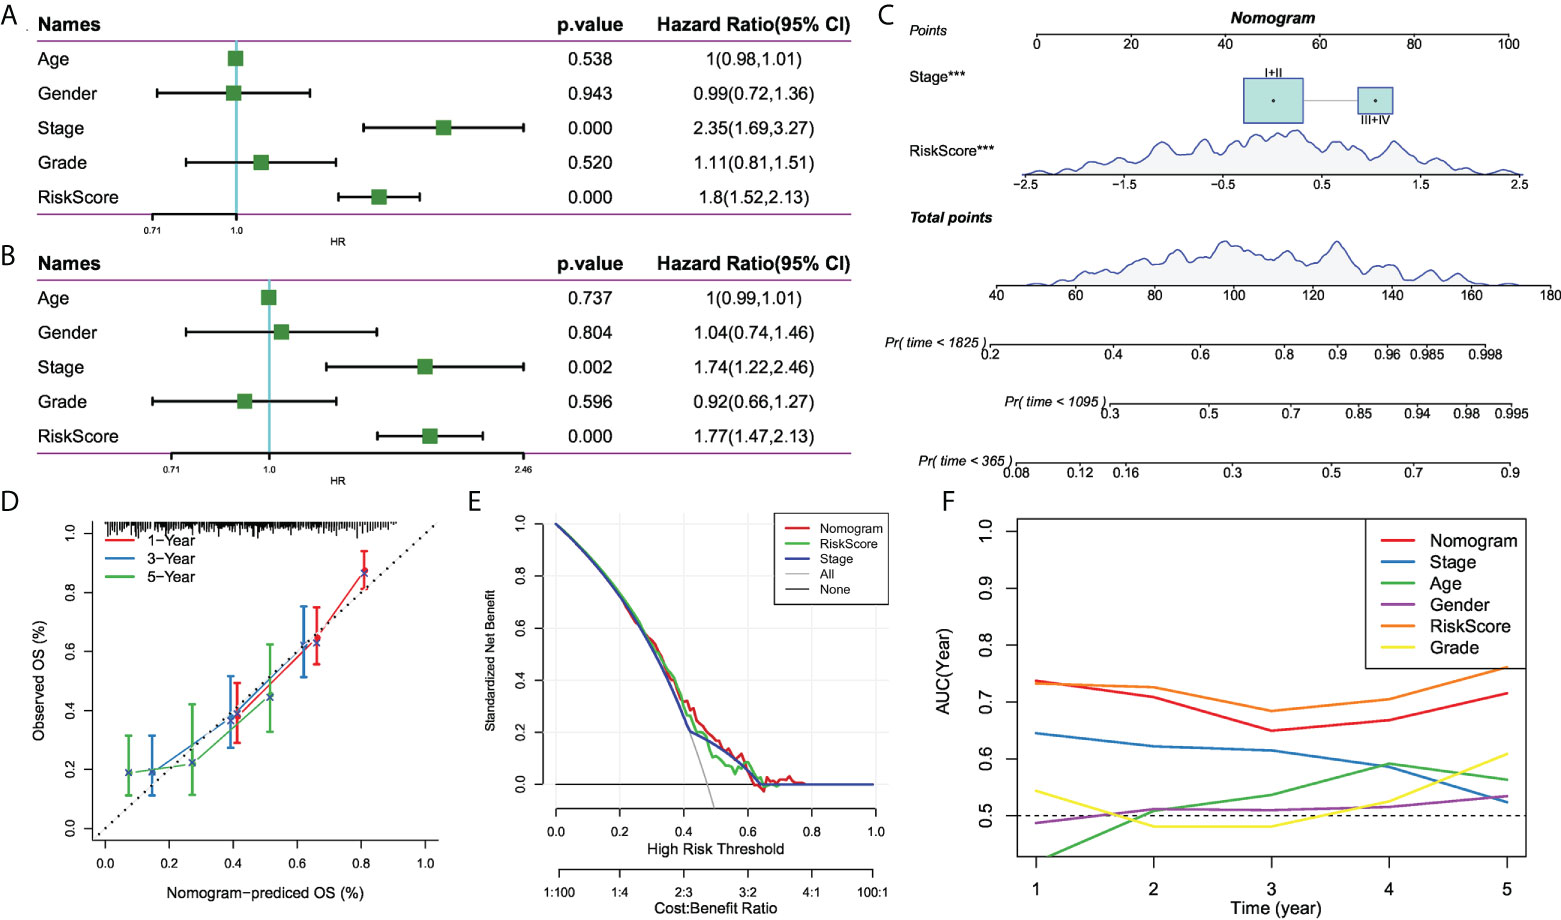
Figure 8 The development of a nomogram for predicting the prognosis of HCC. (A, B) Univariate and multivariate Cox analysis of risk score and clinicopathological characteristics; (C) Nomogram model integrating the risk score and stage was constructed; (D) Calibration curves for 1, 3, and 5 years of nomogram; (E) Decision curve for nomogram; (F) Comparison of predictive capacity of clinicopathological features and the nomogram using time-ROC analysis. ***P < 0.001
Discussion
Accumulating evidence has demonstrated the dynamic crosstalk between tumor cells and the stromal cells contributes to tumor progression (9), As CAFs have been confirmed to be involved in tumor proliferation, angiogenesis, metastasis, as well as chemotherapy resistance via releasing various factors into the TME (30). In the present study, we concentrated on the diversity of CAFs and performed a systematic characterization and classification of CAFs of HCC based on scRNA-seq data. Eventually, we identified four CAF clusters with distinct properties, which might contribute to the regulation of different aspects of the biology of the TME. Accumulating evidence has confirmed the prognostic value of CAF-secreted factors or CAF-related gene signature in HCC (31). Consistently, our data revealed three of the clusters with a significant association with HCC prognosis, which were determined using a score derived from DEGs across the four clusters. Interestingly, we observed the differences in HIPPO and MYC among the CAF clusters might may partially contribute to the prognostic value of CAF. Hepatic Hippo signaling inhibits development of HCC (32), and the MYC-mediated axis has been confirmed as a dominant part of HCC in terms of proliferation, migration, invasion, and drug resistance (33).
Given the prognostic values of three CAF clusters, we established a CAF-based risk signature with 6 genes. It consisted of three protective genes (ADAMTSL2, SLCO2A1, and CD4) and three risk genes (HMGXB3, GCN1, and LUC7L3). In our study, SNV mutations were observed in ADAMTSL2, SLCO2A1, HMGXB3, LUC7L3, and CD4 without significant co-occurrence probability. Sense SNV mutations affect protein activity or function, leading to HCC development or affecting HCC progression (34). Although there are no independent studies linking SNV mutations in these risk genes to HCC progression, our data also suggest a potential role of SNV mutations in these genes in HCC progression. A recent study constructed a genomic instability-derived genes signature, which contains SLCO2A1, for the prediction of HCC prognosis (35). We further found that the six genes were significantly correlated with 39 pathways, while protective genes and risk genes clearly had different pathway signatures. For example, the protective genes were significantly positively associated with allograft rejection, myogenesis, complement, interferon-gamma response, whereas risk genes were significantly connected with fatty acid metabolism, xenobiotic metabolism, and adipogenesis. The alterations of fatty acid metabolism plays an important role in HCC and the prognostic value of fatty acid metabolism-related genes in HCC has also been revealed (36). Polymorphisms in xenobiotic metabolism-related genes were suggested to increase the risk of developing HCC (37). Adipogenesis is an indication of the development of obesity and is associated with multiple cancers (38). Hence, these data provide us with the direction to further study the regulation of these risk genes in HCC.
Recent evidence suggests that the interaction of CAFs and the tumor immune microenvironment (TIME) can promote tumor progression (39). In our study, three predictive genes were significantly positively correlated with immune score, while a risk gene was negatively associated with the immune score. These data indicated the potential crosstalk between these genes with TIME in HCC and implied the potential values of these genes as therapeutic targets of HCC. Various immune cells in tumor islets make up the TIME and synergistically determine the antitumor immunological state in the TME. CAFs can interact with these immune cells to form a immunosuppressive TME, thereby enable tumor cells to evade the surveillance of the immune system (40). In the risk signature, multiple types of T cells were negatively associated with the predictive genes. T cells are involved in tumor progression and the potential of T cell-derived therapies, including checkpoint blockade and chimeric antigen receptors T (CAR-T) cell therapy, has been confirmed (41).
Nevertheless, most of the patients show innate or acquired resistance to immunotherapies (42). Our data found that the risk signature was capable to distinguish patients who were more likely to benefit from immunotherapies. Additionally, it was reported that CAF-expressed endosialin regulated macrophage recruitment and polarization in HCC (43). In the defined signature, the risk genes were positively correlated with M0 macrophages and negatively correlated with M2 macrophages, indicating the potential involvement of the risk genes in the macrophage polarization. It was demonstrated that CAFs regulated neutrophil survival, activation, and function in HCC via the IL6-STAT3-PDL1 signaling cascade (44). Meanwhile, our data showed that CAF-based signature could predict the responsiveness to anti-PD-L1 immunotherapy. There data provided novel clues of the role of CAF in remodeling the cancer niche and immune status in TME. However, it requires more experiments to explore the role of CAF-TIME communication in HCC and its potential value in HCC immunotherapy.
Nevertheless, several limitations in our study should be acknowledged. First, the CAF clusters and CAF-based risk signature was generated using retrospective data from public databases. Therefore, it should be validated in more prospective and multi-center HCC cohorts in the future. Second, we only investigated the potential prognostic value of the CAF-based risk signature, so further studies are required to explore the underlying mechanisms of the signature in the development of HCC.
Conclusion
In summary, this study systematically characterized the CAF populations in HCC and generated four CAF clusters with distinct diversity. The DEGs among the four clusters were enriched in vascular smooth muscle contraction, focal adhesion, oxytcosin and PPARG signaling pathway, etc. Three of the cluster were significantly associated with HCC prognosis, and used to construct a CAF-based prognostic risk signature with 6 genes. The CAF-based gene signature was observed to be connected with the immune landscape and could be used for the prediction of the responsiveness to PD-L1 blockade immunotherapy. Finally, a novel nomogram integrating the risk signature and clinicopathological features were developed, which provided a favorable predictive performance in the clinical outcome of patients with HCC.
Data availability statement
The original contributions presented in the study are included in the article/Supplementary Material. Further inquiries can be directed to the corresponding authors.
Author contributions
LY and NS conducted statistical analyses of the data and prepared the draft manuscript. YS, XS and XF edited the manuscript. SL, BZ, WY and YZ provide critical comments to the manuscript. All authors checked and proofread the final version of the manuscript.
Funding
This study was supported by Sangerbox platform (45) and Shanghai Science and Technology Committee (09411965400).
Conflict of interest
Author SL is employed by Bioinformatics R&D Department, Hangzhou Mugu Technology Co., Ltd.
The remaining authors declare that the research was conducted in the absence of any commercial or financial relationships that could be construed as a potential conflict of interest.
Publisher’s note
All claims expressed in this article are solely those of the authors and do not necessarily represent those of their affiliated organizations, or those of the publisher, the editors and the reviewers. Any product that may be evaluated in this article, or claim that may be made by its manufacturer, is not guaranteed or endorsed by the publisher.
Supplementary material
The Supplementary Material for this article can be found online at: https://www.frontiersin.org/articles/10.3389/fimmu.2022.1009789/full#supplementary-material
Supplementary Figure 1 | The results of re-process of scRNA-seq data of LIHC. (A): The relationship between mitochondrial genes and the amount of UMI/mRNA, the relationship between UMI and the amount of mRNA; (B) The relationship among mRNA, UMI, mitochondrial content, and rRNA content of each sample before filtering; (C) The relationship among mRNA, UMI, mitochondrial content, and rRNA content of each sample after filtering; (D) The sample distribution map of PCA dimensionality reduction and the anchor point map of PCA.
Supplementary Figure 2 | The clustering of CAF populations and dimensionality reduction. (A) Distribution of subpopulations after clustering of all cells; (B) TSNE map of fibroblast marker gene expression; (C) Distribution of subpopulations after re-clustering of fibroblasts; (D) TSNE diagram.of marker expression in four CAF clusters.
Supplementary Figure 3 | The expression of EPCAM in four CAF clusters.
Supplementary Figure 4 | The characteristics of mutations of the genes included in the risk signature. (A) Waterfall diagram of SNV mutations of 6 key genes; (B) Colinearity and mutual exclusion analysis of key genes and the 10 most mutated genes in tumors; (C) CNV mutations (gain, loss, none) of 6 key genes; (D) Correlation heatmap of 6 key genes with Aneuploidy Score, Homologous Recombination Defects, Fraction Altered, Number of Segments, and Nonsilent Mutation Rate.
Supplementary Figure 5 | The relationship between the risk genes and immune landscape. (A) The correlation matric of the risk genes and stromal score, immune score, and estimate score. (B) Comparison of high and low expression of key genes and immune score (wilcox.test); (C) Correlation between key genes and immune cell score predicted by CIBERSORT analysis; (D) Comparison of high and low expression of key genes with 22 immune cell scores (wilcox.test). *P < 0.05; **P < 0.01; ***P < 0.001; and ****P < 0.0001.
References
1. Bray F, Ferlay J, Soerjomataram I, Siegel RL, Torre LA, Jemal A. Global cancer statistics 2018: GLOBOCAN estimates of incidence and mortality worldwide for 36 cancers in 185 countries. CA Cancer J Clin (2018) 68(6):394–424. doi: 10.3322/caac.21492
2. Allemani C, Weir HK, Carreira H, Harewood R, Spika D, Wang XS, et al. Global surveillance of cancer survival 1995-2009: Analysis of individual data for 25,676,887 patients from 279 population-based registries in 67 countries (CONCORD-2). Lancet (2015) 385(9972):977–1010. doi: 10.1016/S0140-6736(14)62038-9
3. Meniconi RL, Komatsu S, Perdigao F, Boëlle PY, Soubrane O, Scatton O. Recurrent hepatocellular carcinoma: A Western strategy that emphasizes the impact of pathologic profile of the first resection. Surgery (2015) 157(3):454–62. doi: 10.1016/j.surg.2014.10.011
4. El-Serag HB. Hepatocellular carcinoma. N Engl J Med (2011) 365(12):1118–27. doi: 10.1056/NEJMra1001683
5. Zucman-Rossi J, Villanueva A, Nault JC, Llovet JM. Genetic landscape and biomarkers of hepatocellular carcinoma. Gastroenterology (2015) 149(5):1226–1239.e4. doi: 10.1053/j.gastro.2015.05.061
6. Nakagawa H, Fujita M, Fujimoto A. Genome sequencing analysis of liver cancer for precision medicine. Semin Cancer Biol (2019) 55:120–7. doi: 10.1016/j.semcancer.2018.03.004
7. Zhang BH, Yang J, Jiang L, Lyu T, Kong LX, Tan YF, et al. Development and validation of a 14-gene signature for prognosis prediction in hepatocellular carcinoma. Genomics (2020) 112(4):2763–71. doi: 10.1016/j.ygeno.2020.03.013
8. Shiga K, Hara M, Nagasaki T, Sato T, Takahashi H, Takeyama H. Cancer-associated fibroblasts: Their characteristics and their roles in tumor growth. Cancers (Basel) (2015) 7(4):2443–58. doi: 10.3390/cancers7040902
9. Zhang W, Huang P. Cancer-stromal interactions: Role in cell survival, metabolism and drug sensitivity. Cancer Biol Ther (2011) 11(2):150–6. doi: 10.4161/cbt.11.2.14623
10. Werb Z, Lu P. The role of stroma in tumor development. Cancer J (2015) 21(4):250–3. doi: 10.1097/PPO.0000000000000127
11. Gascard P, Tlsty TD. Carcinoma-associated fibroblasts: Orchestrating the composition of malignancy. Genes Dev (2016) 30(9):1002–19. doi: 10.1101/gad.279737.116
12. Cirri P, Chiarugi P. Cancer associated fibroblasts: the dark side of the coin. Am J Cancer Res (2011) 1(4):482–97.
13. Musa M. Single-cell analysis on stromal fibroblasts in the microenvironment of solid tumours. Adv Med Sci (2020) 65(1):163–9. doi: 10.1016/j.advms.2019.12.001
14. Gandellini P, Andriani F, Merlino G, D'Aiuto F, Roz L, Callari M. Complexity in the tumour microenvironment: Cancer associated fibroblast gene expression patterns identify both common and unique features of tumour-stroma crosstalk across cancer types. Semin Cancer Biol (2015) 35:96–106. doi: 10.1016/j.semcancer.2015.08.008
15. Sukowati CH, Anfuso B, Crocé LS, Tiribelli C. The role of multipotent cancer associated fibroblasts in hepatocarcinogenesis. BMC Cancer (2015) 15:188. doi: 10.1186/s12885-015-1196-y
16. Terada T, Makimoto K, Terayama N, Suzuki Y, Nakanuma Y. Alpha-smooth muscle actin-positive stromal cells in cholangiocarcinomas, hepatocellular carcinomas and metastatic liver carcinomas. J Hepatol (1996) 24(6):706–12. doi: 10.1016/s0168-8278(96)80267-4
17. Yamamura Y, Asai N, Enomoto A, Kato T, Mii S, Kondo Y, et al. Akt-girdin signaling in cancer-associated fibroblasts contributes to tumor progression. Cancer Res (2015) 75(5):813–23. doi: 10.1158/0008-5472.CAN-14-1317
18. Song J, Ge Z, Yang X, Luo Q, Wang C, You H, et al. Hepatic stellate cells activated by acidic tumor microenvironment promote the metastasis of hepatocellular carcinoma via osteopontin. Cancer Lett (2015) 356(2 Pt B):713–20. doi: 10.1016/j.canlet.2014.10.021
19. Littlepage LE, Egeblad M, Werb Z. Coevolution of cancer and stromal cellular responses. Cancer Cell (2005) 7(6):499–500. doi: 10.1016/j.ccr.2005.05.019
20. Sanchez-Vega F, Mina M, Armenia J, Chatila WK, Luna A, La KC, et al. Oncogenic signaling pathways in the cancer genome atlas. Cell (2018) 173(2):321–337.e10. doi: 10.1016/j.cell.2018.03.035
21. Butler A, Hoffman P, Smibert P, Papalexi E, Satija R. Integrating single-cell transcriptomic data across different conditions, technologies, and species. Nat Biotechnol (2018) 36(5):411–20. doi: 10.1038/nbt.4096
22. Yu G, Wang LG, Han Y, He QY. clusterProfiler: an r package for comparing biological themes among gene clusters. OMICS (2012) 16(5):284–7. doi: 10.1089/omi.2011.0118
23. Gao R, Bai S, Henderson YC, Lin Y, Schalck A, Yan Y, et al. Delineating copy number and clonal substructure in human tumors from single-cell transcriptomes. Nat Biotechnol (2021) 39(5):599–608. doi: 10.1038/s41587-020-00795-2
24. Ritchie ME, Phipson B, Wu D, Hu Y, Law CW, Shi W, Smyth GK, et al. Limma powers differential expression analyses for RNA-sequencing and microarray studies. Nucleic Acids Res (2015) 43(7):e47. doi: 10.1093/nar/gkv007
25. Chen B, Khodadoust MS, Liu CL, Newman AM, Alizadeh AA. Profiling tumor infiltrating immune cells with CIBERSORT. Methods Mol Biol (2018) 1711:243–59. doi: 10.1007/978-1-4939-7493-1_12
26. Zhang S, Tong YX, Zhang XH, Zhang YJ, Xu XS, Xiao AT, et al. A novel and validated nomogram to predict overall survival for gastric neuroendocrine neoplasms. J Cancer (2019) 10(24):5944–54. doi: 10.7150/jca.35785
27. Mariathasan S, Turley SJ, Nickles D, Castiglioni A, Yuen K, Wang Y, et al. TGFβ attenuates tumour response to PD-L1 blockade by contributing to exclusion of T cells. Nature (2018) 554(7693):544–8. doi: 10.1038/nature25501
28. Hugo W, Zaretsky JM, Sun L, Song C, Moreno BH, Hu-Lieskovan S, et al. Genomic and transcriptomic features of response to anti-PD-1 therapy in metastatic melanoma. Cell (2016) 165(1):35–44. doi: 10.1016/j.cell.2016.02.065
29. Curran MA, Montalvo W, Yagita H, Allison JP. PD-1 and CTLA-4 combination blockade expands infiltrating T cells and reduces regulatory T and myeloid cells within B16 melanoma tumors. Proc Natl Acad Sci U.S.A. (2010) 107(9):4275–80. doi: 10.1073/pnas.0915174107
30. Biffi G, Tuveson DA. Diversity and biology of cancer-associated fibroblasts. Physiol Rev (2021) 101(1):147–76. doi: 10.1152/physrev.00048.2019
31. Kato K, Fukai M, Hatanaka KC, Takasawa A, Aoyama T, Hayasaka T, et al. Versican secreted by cancer-associated fibroblasts is a poor prognostic factor in hepatocellular carcinoma. Ann Surg Oncol (2022) doi: 10.1245/s10434-022-11862-0
32. Liu Y, Wang X, Yang Y. Hepatic hippo signaling inhibits development of hepatocellular carcinoma. Clin Mol Hepatol (2020) 26(4):742–50. doi: 10.3350/cmh.2020.0178
33. Xia P, Zhang H, Xu K, Jiang X, Gao M, Wang G, et al. MYC-targeted WDR4 promotes proliferation, metastasis, and sorafenib resistance by inducing CCNB1 translation in hepatocellular carcinoma. Cell Death Dis (2021) 12(7):691. doi: 10.1038/s41419-021-03973-5
34. Wang H, Cao H, Xu Z, Wang D, Zeng Y. SNP rs2596542G>A in MICA is associated with risk of hepatocellular carcinoma: a meta-analysis. Biosci Rep 2019 39(5):BSR20181400. doi: 10.1042/BSR20181400.
35. Song ZB, Yu Y, Zhang GP, Li SQ. Genomic instability of mutation-derived gene prognostic signatures for hepatocellular carcinoma. Front Cell Dev Biol (2021) 9:728574. doi: 10.3389/fcell.2021.728574
36. He D, Cai L, Huang W, Weng Q, Lin X, You M, Liao S, et al. Prognostic value of fatty acid metabolism-related genes in patients with hepatocellular carcinoma. Aging (Albany NY) (2021) 13(13):17847–63. doi: 10.18632/aging.203288
37. Ferreira GD, Fernandes GMM, Penteado C, Cória VR, Galbiatti-Dias ALDS, Russo A, et al. Polymorphisms in xenobiotic metabolism-related genes in patients with hepatocellular carcinoma: A case-control study. Xenobiotica (2021) 51(6):737–44. doi: 10.1080/00498254.2021.1893408
38. Oshi M, Tokumaru Y, Angarita FA, Lee L, Yan L, Matsuyama R, et al. Adipogenesis in triple-negative breast cancer is associated with unfavorable tumor immune microenvironment and with worse survival. Sci Rep (2021) 11(1):12541. doi: 10.1038/s41598-021-91897-7
39. Barrett RL, Puré E. Cancer-associated fibroblasts and their influence on tumor immunity and immunotherapy. Elife (2020) 9:e57243. doi: 10.7554/eLife.57243
40. Mao X, Xu J, Wang W, Liang C, Hua J, Liu J, et al. Crosstalk between cancer-associated fibroblasts and immune cells in the tumor microenvironment: New findings and future perspectives. Mol Cancer (2021) 20(1):131. doi: 10.1186/s12943-021-01428-1
41. Kudo M. Immuno-oncology therapy for hepatocellular carcinoma: Current status and ongoing trials. Liver Cancer (2019) 8(4):221–38. doi: 10.1159/000501501
42. Desbois M, Wang Y. Cancer-associated fibroblasts: Key players in shaping the tumor immune microenvironment. Immunol Rev (2021) 302(1):241–58. doi: 10.1111/imr.12982
43. Yang F, Wei Y, Han D, Li Y, Shi S, Jiao D, et al. Interaction with CD68 and regulation of GAS6 expression by endosialin in fibroblasts drives recruitment and polarization of macrophages in hepatocellular carcinoma. Cancer Res (2020) 80(18):3892–905. doi: 10.1158/0008-5472.CAN-19-2691
44. Cheng Y, Li H, Deng Y, Tai Y, Zeng K, Zhang Y, et al. Cancer-associated fibroblasts induce PDL1+ neutrophils through the IL6-STAT3 pathway that foster immune suppression in hepatocellular carcinoma. Cell Death Dis (2018) 9(4):422. doi: 10.1038/s41419-018-0458-4
Keywords: cancer-associated fibroblasts, liver hepatocellular carcinoma, differentially expressed genes, immunotherapy, nomogram
Citation: Yu L, Shen N, Shi Y, Shi X, Fu X, Li S, Zhu B, Yu W and Zhang Y (2022) Characterization of cancer-related fibroblasts (CAF) in hepatocellular carcinoma and construction of CAF-based risk signature based on single-cell RNA-seq and bulk RNA-seq data. Front. Immunol. 13:1009789. doi: 10.3389/fimmu.2022.1009789
Received: 02 August 2022; Accepted: 07 September 2022;
Published: 23 September 2022.
Edited by:
Jinghua Pan, Jinan University, ChinaCopyright © 2022 Yu, Shen, Shi, Shi, Fu, Li, Zhu, Yu and Zhang. This is an open-access article distributed under the terms of the Creative Commons Attribution License (CC BY). The use, distribution or reproduction in other forums is permitted, provided the original author(s) and the copyright owner(s) are credited and that the original publication in this journal is cited, in accordance with accepted academic practice. No use, distribution or reproduction is permitted which does not comply with these terms.
*Correspondence: Shuang Li, lishuang@cqu.edu.cn; Bin Zhu, bbinzhu@sina.com; Wenlong Yu, 909240168@qq.com; Yongjie Zhang, yjoy005@126.com
†These authors have contributed equally to this work