Development and Validation of a Predictive Model for Severe COVID-19: A Case-Control Study in China
 Zirui Meng1†
  Minjin Wang1†
  Zhenzhen Zhao1 Yongzhao Zhou2 Ying Wu2
  Shuo Guo1 Mengjiao Li1
  Yanbing Zhou1 Shuyu Yang1 Weimin Li2*
  Binwu Ying1*
- 1Department of Laboratory Medicine, West China Hospital, Sichuan University, Chengdu, China
- 2Department of Respiratory and Critical Care Medicine, West China Hospital, Sichuan University, Chengdu, China
Background: Predicting the risk of progression to severe coronavirus disease 2019 (COVID-19) could facilitate personalized diagnosis and treatment options, thus optimizing the use of medical resources.
Methods: In this prospective study, 206 patients with COVID-19 were enrolled from regional medical institutions between December 20, 2019, and April 10, 2020. We collated a range of data to derive and validate a predictive model for COVID-19 progression, including demographics, clinical characteristics, laboratory findings, and cytokine levels. Variation analysis, along with the least absolute shrinkage and selection operator (LASSO) and Boruta algorithms, was used for modeling. The performance of the derived models was evaluated by specificity, sensitivity, area under the receiver operating characteristic (ROC) curve (AUC), Akaike information criterion (AIC), calibration plots, decision curve analysis (DCA), and Hosmer–Lemeshow test.
Results: We used the LASSO algorithm and logistic regression to develop a model that can accurately predict the risk of progression to severe COVID-19. The model incorporated alanine aminotransferase (ALT), interleukin (IL)-6, expectoration, fatigue, lymphocyte ratio (LYMR), aspartate transaminase (AST), and creatinine (CREA). The model yielded a satisfactory predictive performance with an AUC of 0.9104 and 0.8792 in the derivation and validation cohorts, respectively. The final model was then used to create a nomogram that was packaged into an open-source and predictive calculator for clinical use. The model is freely available online at https://severeconid-19predction.shinyapps.io/SHINY/.
Conclusion: In this study, we developed an open-source and free predictive calculator for COVID-19 progression based on ALT, IL-6, expectoration, fatigue, LYMR, AST, and CREA. The validated model can effectively predict progression to severe COVID-19, thus providing an efficient option for early and personalized management and the allocation of appropriate medical resources.
Introduction
The current outbreak of coronavirus disease 2019 (COVID-19) has spread rapidly and widely across the world, causing panic and major public health challenges in the international community (1). COVID-19 presents a wide clinical manifestation, including asymptomatic infection, mild upper respiratory tract illness, and severe viral pneumonia, with respiratory failure. Only a small proportion of the total number of cases progress to a severe condition (~15–20%); however, ~40% of patients with severe disease die (2–5). Although some research has shown that initial therapy with remdesivir or non-invasive positive pressure ventilation (NIPPV) is very efficient for severe cases, there is currently a lack of accepted recommendations for severe patients with regard to individualized treatment (6–8). Therefore, the rapid deterioration of patients with severe COVID-19 deserves special attention. There is an urgent need to develop options for the personalized diagnosis and treatment of such patients, particularly with regard to protecting the relative shortage of medical resources.
Fever, cough, and fatigue are commonly present in patients with mild COVID-19 (9, 10). As the disease progresses further, patients may also experience respiratory failure, acute respiratory distress syndrome, heart failure, metabolic acidosis, and septic shock (11). Besides the well-defined clinical characteristics of COVID-19, previous studies have shown that abnormal laboratory findings and cytokine levels are often associated with disease progression, including coagulation-related markers such as D-dimer and fibrinogen (FIB), neutrophil count, lymphocyte count, and high-sensitivity C-reactive protein (HsCRP) (5, 12–15). In addition, research has identified that a cytokine storm could be the primary driver of severe progression in COVID-19 patients (16, 17). However, the application of these independent indicators is limited by many factors, including insufficient information, individual differences, the experience of the attending physician, and the complexity of disease. Thus, there is an urgent need for advanced multivariable prediction models (18, 19). Although several studies have attempted to develop prediction models, most of the existing models were developed in a single center and based on retrospective data; in some cases, only partial datasets were used, and there was a clear lack of validation. These factors may lead to the omission of key variables and the risk of over-fitting, thus limiting the clinical application of such models. Therefore, there is a critical need to develop more effective prediction models (14, 15, 20, 21).
Here, we prospectively and consecutively enrolled a cohort of COVID-19 patients with a complete set of demographic data, clinical characteristics, laboratory findings, and cytokine information, and we then constructed a multiparameter prediction model for the early identification of severe COVID-19. Our model could help to monitor and guide precision medicine.
Methods
Participants
COVID-19 patients were prospectively and consecutively enrolled from regional medical institutions by the West China Medical Center between December 20, 2019, and April 10, 2020. The patients were divided into severe and non-severe groups according to the China National Health Commission Guidelines for Diagnosis and Treatment of COVID-19 infection (Versions 5 and 7). Serum samples were collected from patients within 3 days of infection confirmation and stored at −80°C for the subsequent detection of cytokine levels. Demographic data, clinical characteristics, and laboratory findings were acquired from electronic medical records (Figure 1). Two independent researchers reviewed the data collection forms.
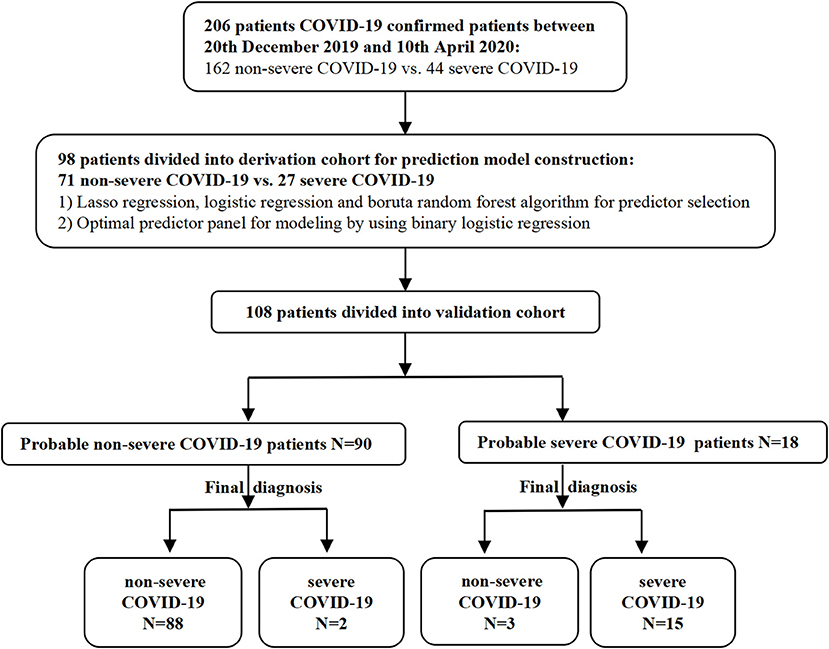
Figure 1. Study flowchart.
Diagnostic and Severity Classification Criteria
Patients with pneumonia, typical findings on computed tomography (CT) chest scan, and positive severe acute respiratory syndrome coronavirus 2 (SARS-CoV-2) nucleic acid results, as determined by real-time fluorescent reverse transcription-polymerase chain reaction assessment from bronchoalveolar lavage (BAL) or sputum, were considered as COVID-19 “cases” according to the diagnosis and treatment guidelines released by the China Health and Medical Commission (22). Patients with at least one of the following symptoms during hospitalization were allocated into the severe group: (1) respiratory distress, respiratory rate ≥30 times/min; (2) oxygen saturation ≤93% at rest; and (3) oxygen partial pressure (PaO2)/oxygen concentration (FiO2) in arterial blood ≤300 mmHg. All patients were discharged or had died by the time the model was developed.
The Detection of Cytokines
Circulating levels of interferon (IFN)-α2, IFN-β, IFN-γ, tumor necrosis factor (TNF)-α, interleukin (IL)-1α, IL-1β, IL-2, IL-4, IL-6, IL-8, IL-10, IL-17A, IL-17E, IL-17F, IL-22, and IL-33 in serum samples were measured by a multiplexed flow cytometric assay using Human Cytokine Kits on a Luminex® system (MAGPIX® with xPONENT) according to the manufacturer's instructions (MILLIPLEX® Analyst 5.1). All samples were measured in duplicate. Based on standard curves, we calculated the coefficient of variation (CV); this did not exceed 20%.
Construction of the Predictive Model and Internal Validation
Patients from the Chengdu region were divided into a derivation cohort, including a training set for modeling and a testing set for internal validation. Stepwise selection was based on p-values; least absolute shrinkage and selection operator (LASSO) and the Boruta algorithm were used to select variables (23, 24). Stepwise selection, as based on p-values, is a classic regression-based method. A variable's value with a p < 0.05 was regarded as significant and was retained. This practice generally achieves a better performance in smaller datasets and has been extensively used in previous research. LASSO regression can compress the coefficients of the features via penalty function to obtain optimal constraint models; this practice has been used effectively to avoid over-fitting and co-linearity in classical analysis methods based on significance differences and also enhances the ability of a model to be generalized. Boruta algorithm is a wrapper algorithm that uses random forest classification. This practice can iteratively remove features that prove to be less relevant than random probes and thus aims to retain relevant variables for the function of a response variable. In addition, these two algorithms are particularly suitable for a dataset with a small sample size but with a large number of variables. By using these three different variable selection methods, we were able to select three candidate predictor panels to construct different binary logistic regression models, which were then verified internally by 10-fold cross-validation. The optimal model was then selected by comparing the area under the curve (AUC) and the Akaike information criterion (AIC) in order to generate a nomogram that could be encapsulated as an open-source online predictive calculator.
Independent Validation
The independent validation cohort consisted of patients from outside Chengdu; this was used for external verification to predict the generalization ability of the model by comparing the predicted results with a set of follow-up results to calculate several metrics: sensitivity, specificity, positive predictive value (PPV), and negative predictive value (NPV). AUCs and decision curve analysis (DCA) were used to comprehensively evaluate the model's discrimination and net clinical benefits (25).
Statistical Analysis
Continuous variables and categorical variables are presented as the median (upper and lower quartiles) and as a frequency, respectively. The chi-squared test for categorical variables and the Student t-test or Mann–Whitney U-test for continuous variables were used to test the data between groups. Pearson correlation was used to determine the linear correlation between two variables. The diagnostic performance of equations was then displayed by AIC and receiver operating characteristic (ROC) curve and quantified by AUCs. An open-source online predictive calculator was then created using the Shiny tool in the R environment (version 1.2.0). All statistical analyses were completed using R 3.5.0 version. All statistical tests were two-tailed, and p ≤ 0.05 was considered to indicate statistical significance.
Standard Protocol Approvals, Registrations, and Patient Consent
The protocol for this study was approved by the West China Hospital, Sichuan University Medical Ethics Committee (reference no. 193, 2020), and conformed to the principles of the Declaration of Helsinki. Written informed consent was obtained from all participants.
Results
Epidemiological Characteristics
We recruited 206 patients with a confirmed diagnosis of COVID-19; of these, 44 patients progressed to severe COVID-19, and 162 patients were classified as having non-severe COVID-19. Patients in the severe group were significantly older (50 vs. 46, p = 0.005) and had a significantly higher frequency of underlying diseases (diabetes and hypertension) than the non-severe group (p < 0.001 and p = 0.013, respectively). There were no differences between the two groups in terms of gender (male: 54.940 vs. 56.810%, p = 0.400). With regard to epidemiological exposure, most of the patients (79.000%) in the severe group had been overseas or had visited Wuhan or surrounding regions within 14 days of disease onset; patients who had been overseas accounted for 50% of the patients with non-severe COVID-19. As of April 28, 2020, the time for the reversal of a negative nucleic acid test result in the non-severe and severe groups was 11 and 18 days (median) except for three patients who died from multiple organ failure (MOF).
Differences in Characteristics and Correlation Analysis
Demographic data, clinical characteristics, laboratory findings, and cytokine levels are shown in Table 1 and Supplementary Figures 1, 2. Several cytokines were significantly elevated in the severe COVID-19 group (p ≤ 0.010). The predictive value of each single cytokine, and a combined panel of cytokines, were evaluated by ROC curve analysis and quantified by AUC (Supplementary Figure 3). Results showed that the AUCs were 0.830, 0.796, 0.729, 0.707, 0.694, 0.667, 0.656, and 0.653 for single IL-10, IL-6, IL-1α, IL-1β, IL-17A, IL-4, TNF-α, and IL-2 and that the binary logistic model had a similar AUC (0.796–0.848). These data indicated that IL-10 and IL-6 may represent potential biomarkers for patients with severe COVID-19. We found significant differences between the severe and non-severe COVID-19 group with regard to a range of clinical characteristics, including respiratory rate, cough, expectoration, dyspnea, asthma, and debilitation. Significant differences were also identified in several laboratory findings; lymphocyte ratio (LYMR), eosinophil ratio (EOSR), monocyte ratio (MONOR), total bilirubin (TBIL), total protein (TP), albumin (ALB), Ca, and URIC were all significantly lower in the severe COVID-19 group, while neutrophil ratio (NEUTR), FIB, aspartate transaminase (AST), glucose (GlU), and HsCRP were all significantly higher. However, the AUCs for these indicators when used to predict severe COVID-19 were all <0.690. Simple logistic analysis was not suited for the severe COVID-19 group, owing to the feature selection of such a large number of indicators.
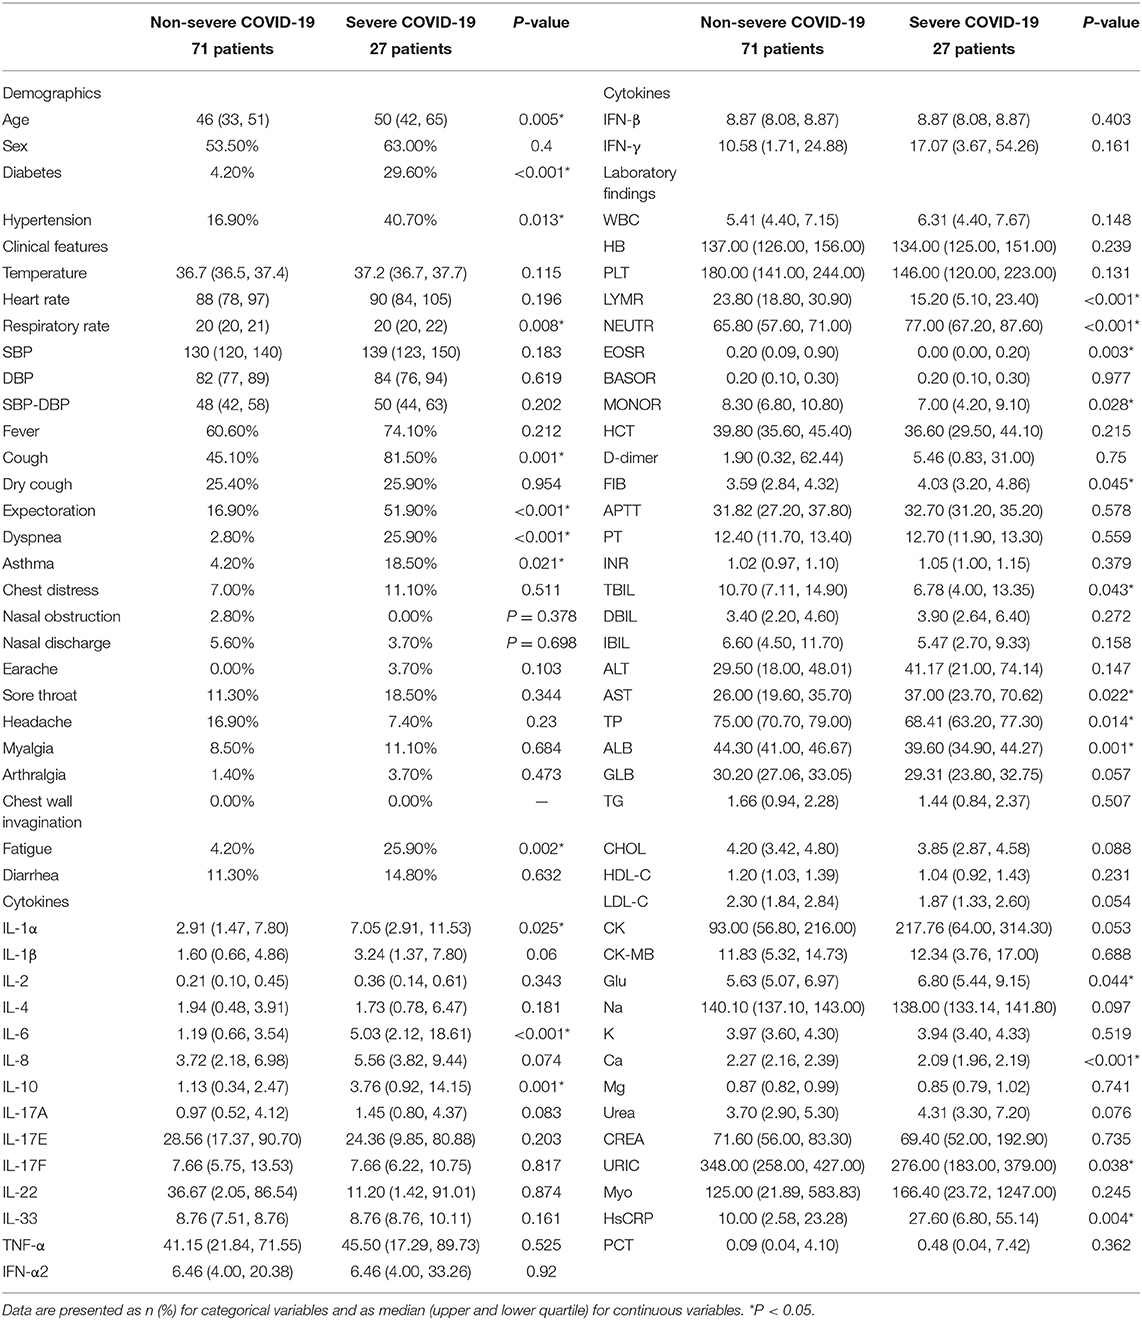
Table 1. Patients' characteristics in training set.
We identified significant correlations between each pair for all cytokines except IL-33 and IFN-β. In addition, IL-6, IL-10, and IFN-β were closely associated with certain laboratory indicators of hepatobiliary function. Similarly, hematocrit (HCT), tBIL, direct bilirubin (DBIL), indirect bilirubin (IBIL), TP, creatine kinase (CK), and myoglobin (Myo) were significantly associated with most cytokines except IL-33, which was not correlated with any of the indices.
The Selection of Predictors and Model Construction
Next, we used variation analysis, LASSO regression, and the Boruta algorithm, to select three predictive panels and construct corresponding predictive models (predictive models A, B, and C, respectively) (Table 2, Figure 2). Predictive model B exhibited a better performance than the other two models in terms of sensitivity, specificity, discrimination, calibration, and clinical net benefit. In addition, the predictors included in this model are objective and universal. An optimal model, with seven features, alanine aminotransferase (ALT), IL-6, expectoration, fatigue, LYMR, AST, and serum creatinine (CREA), were used to generate a nomogram (Figure 3) and were encapsulated as an open-source online predictive calculator with R/Shiny (https://severeconid-19predction.shinyapps.io/SHINY/).
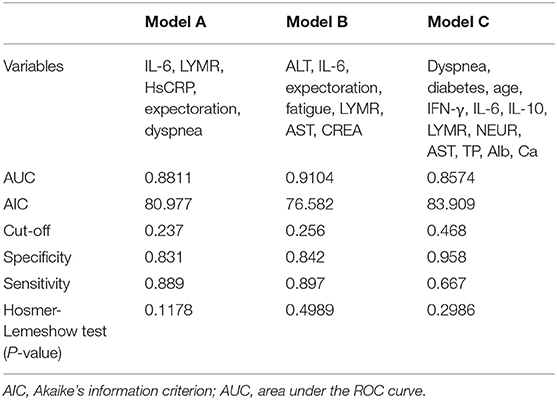
Table 2. Comprehensive performance of three prediction models.
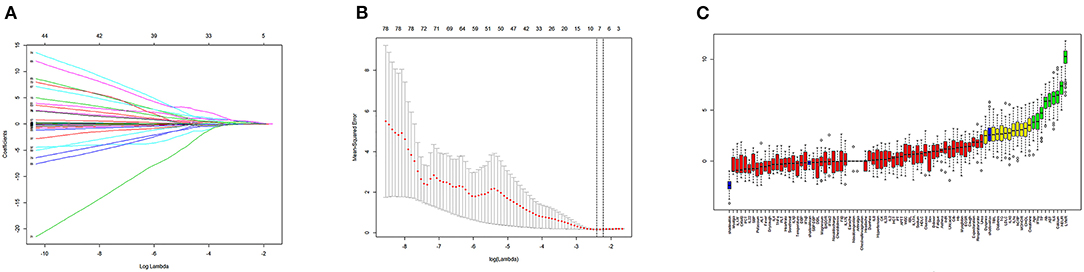
Figure 2. (A) Coefficient diagram of least absolute shrinkage and selection operator (LASSO) variables. Each curve in the figure represents the trajectory of the coefficient of an independent variable. The ordinate represents the value of the coefficient. The lower abscissa, λ, is a parameter that controls the severity of the penalty. The upper abscissa represents the number of non-zero coefficients in the model under the penalty parameter. (B) Adjustment parameters in the LASSO model; λ was screened by 10-fold cross-validation. A dashed vertical line was drawn at one standard error (1–SE standard) of the minimum and minimum standards. Λ 0.1 se corresponds to a model with good performance but the fewest number of arguments. (C) A variable importance plot according to Boruta feature selection. Blue boxplots correspond to minimal, average, and maximum Z scores of a shadow attribute. The Z-score clearly separates important and non-important attributes. Red, yellow, and green colors represent rejected, suggestive, and confirmed attributes by Boruta selection, respectively.
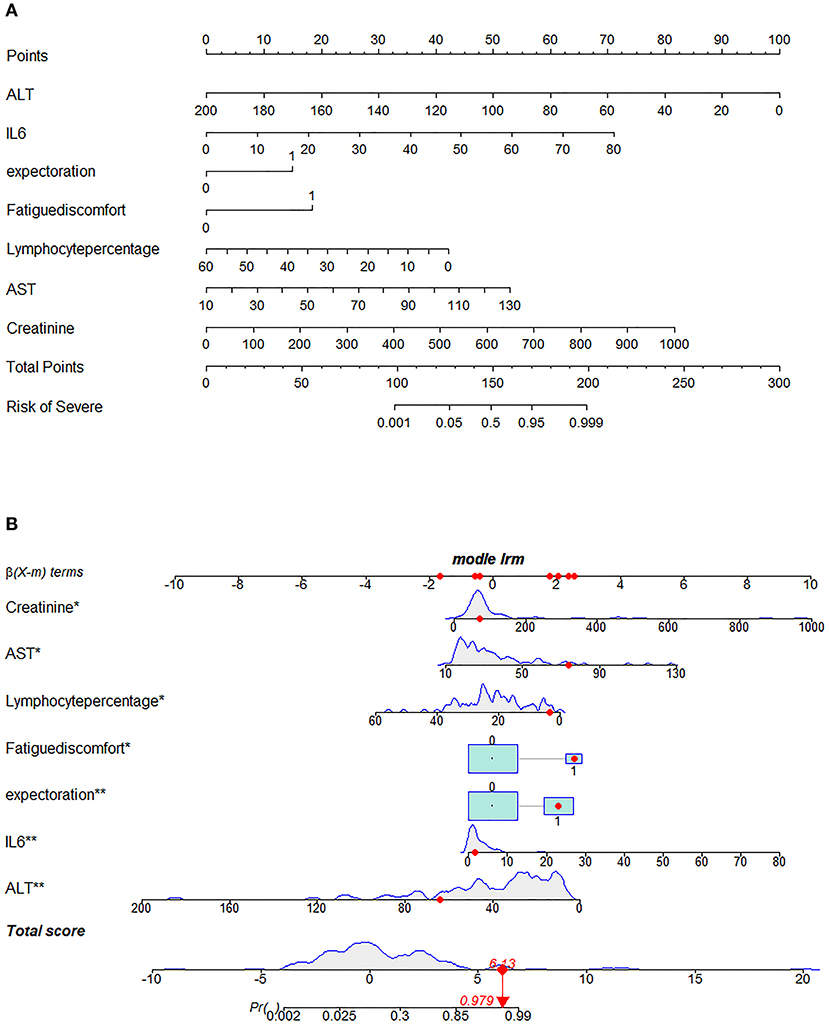
Figure 3. Nomogram for predicting severe coronavirus disease 2019 (COVID-19). (A) To use the nomogram for an individual patient, the points (top gridline) for each predictor variable are first assigned and the total points calculated. A vertical line from this value on the Total Points gridline then provides a probability for predicting severe COVID-19. The results of the binary variable are encoded as 0 and 1, representing the absence and presence of this symptom, respectively. The calculation is further illustrated in (B), which shows the results of a patient with certain laboratory findings; the probability of this patient progressing to severe COVID-19 is 97.9%.
Validation of the Online Predictive Model
Finally, we predicted the disease progression of the 108 patients in the validation cohort using our model. The model predicted that 18 patients would progress to severe COVID-19 while the remaining 90 would not. Compared with the follow-up results (91 patients with non-severe COVID-19 and 17 patients with severe COVID-19), the sensitivity, specificity, PPV, and NPV of our assay were 0.882 (95% CI; 0.622–0.979), 0.967 (95% CI; 0.890–0.991), 0.833 (95% CI; 0.747–0.896), and 0.978 (95% CI; 0.914–0.996), respectively. The model also achieved excellent discrimination (AUC = 0.879), calibration, and clinical net benefit (Figures 4, 5).
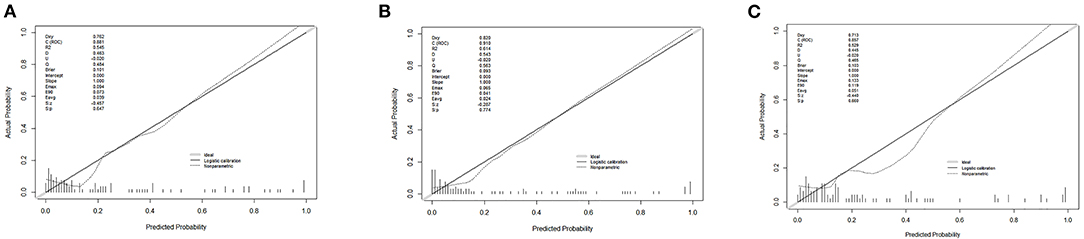
Figure 4. Calibration curves for the three predictive models. (A) Predictive model A, (B) predictive model B, and (C) predictive model C.
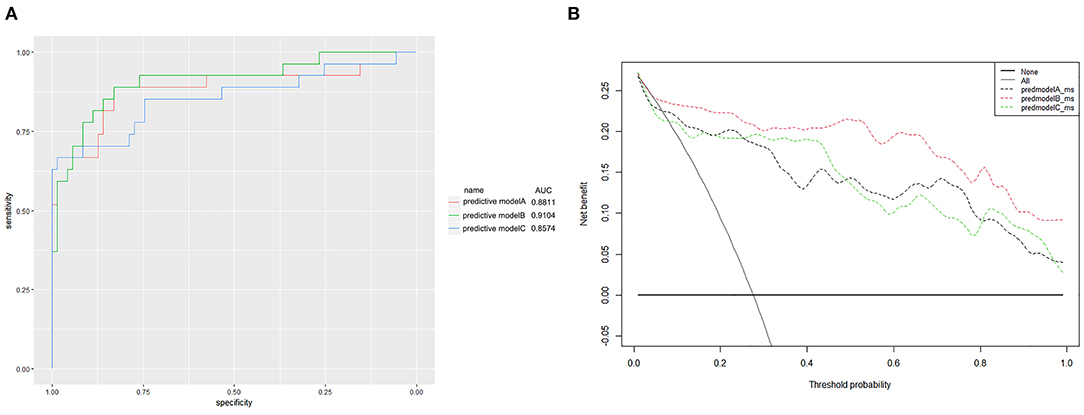
Figure 5. (A) Receiver operating characteristic curves for the three predictive models. The areas under the receiver operating characteristic curves were 0.8811, 0.9104, and 0.8574, for predictive models A, B, and C, respectively. (B) The decision curve analysis (DCA) of three predictive models.
Discussion
The accurate and individualized assessment of a patient who may progress to severe COVID-19 will promote the efficiency of clinical intervention and improve the rational use of medical resources. In the present study, we recruited 206 patients (162 patients with non-severe COVID-19 and 44 patients with severe COVID-19). We analyzed a range of indicators associated with severe COVID-19 and developed a novel predictive model that included ALT, IL-6, expectoration, fatigue, LYMR, AST, and CREA. This model proved to have excellent ability to predict the progression of COVID-19 during hospitalization, in both the derivation and validation cohorts.
Our final model was visualized in the form of a nomogram and was then packaged into an open-source and free predictive calculator (https://severeconid-19predction.shinyapps.io/SHINY/). The model represents a powerful tool with which to aid decision-making and guide treatment strategies for target patients who are at high risk of developing severe progression. The model could also be used to facilitate personalized management.
Previous research reported wide differences in the levels of a large number of cytokines from patients with non-severe and severe COVID-19 (26–28). Our present results identified obvious elevations of various cytokines in patients with severe COVID-19, including IL-1α, IL-1β, IFN-γ, TNF-α, IL-2, IL-4, IL-6, IL-10, and IL-17A. Of these cytokines, IL-6 and IL-10 showed the highest fold-change, thus indicating the presence of a strong inflammatory reaction; this could be a sufficient response to trigger a cytokine storm. Univariate logistic analysis showed that a number of cytokines can be used as predictors for patients with severe illness, although their predictive efficacies can vary considerably; these cytokines could not be used individually. We also found that underlying diseases (diabetes and hypertension), initial clinical characteristics (cough, expectoration, dyspnea, asthma, and debilitation), and laboratory findings [LYMR ALT, AST, CK, GlU, and procalcitonin (PCT)] were also significantly associated with disease progression, although these were non-specific. The extensive correlation between cytokines and the clinical response spectrum may be explained by multiple organ damage caused by the over-exuberant inflammatory response in severe COVID-19 (12, 29).
Univariate logistic analysis indicated that using a certain evaluation index could not provide sufficient evidence for the prediction of progression and that modeling by data mining may be a more efficient and viable tool with which to compensate for the lack of a single source of information (30). We used the LASSO algorithm and logistic regression and compared different modeling approaches. Finally, we selected a predictive model that included ALT, IL-6, expectoration, fatigue, LYMR, AST, and CREA. Our model achieved satisfactory predictive performance with AUCs of 0.910 and 0.879 in the derivation and validation cohorts, respectively. We also packaged this model into an open-source online format for clinical use. Although several predictive models have been published previously, these studies were associated with obvious limitations, including the fact that they were retrospective reviews or were associated with suboptimal predictive abilities or were not validated externally (31–33). Taking these limitations into account, our study is superior in several respects. First, we considered potential predictors for severe COVID-19 and included a comprehensive dataset retrospectively. Second, our shrinking model, featuring representative key variables, may exhibit better levels of performance than a complex model. This can be supported by the fact that our predictive model was established by comparing several different methods; the optimal method had a significantly higher AUC than the other models; this finding was reconfirmed in the validation cohort. Third, the predictive model was used to create a nomogram that was then used to generate an open-source online calculator format with visualization and maneuverability function.
There are also some limitations associated with our study that need to be considered. For example, we mainly focused on the changes of symptoms and the levels of key indicators in patients after SARS-CoV-2 infection and did not consider the influence of individual differences on the progression of disease. More in-depth investigations and longitudinal dynamic monitoring studies now need to be conducted to explain the specific characteristics of the potential predictors. Furthermore, the predictive model needs to be validated in a larger patient cohort and other populations outside of China.
Conclusion
In this study, we developed and validated an online predictive calculator that provides personalized probability for the progression of disease based on seven commonly used variables. The model will be vital for early personalized management, to promote the appropriate allocation of medical resources, and to ensure that patients who may develop severe COVID-19 can receive appropriate treatment as soon as possible.
Data Availability Statement
The original contributions presented in the study are included in the article/Supplementary Material, further inquiries can be directed to the corresponding author/s.
Ethics Statement
The studies involving human participants were reviewed and approved by West China Hospital, Sichuan University Medical Ethics Committee. The patients/participants provided their written informed consent to participate in this study.
Author Contributions
ZM and MW designed the research and wrote the manuscript. ZZ and YoZ responsible for the recruitment of COVID-19 patients and clinical treatment. YW and SG responsible for the detection of candidate biomarkers. ML, SY, and YaZ responsible for collecting and organizing data. All authors contributed to the article and approved the submitted version.
Funding
This study was supported by the Sichuan Provincial Department of Science and Technology Program (References: 2020YFS0002 and 2020YFS0004) and the Science and Technology Project of West China Hospital (Reference: HX-2019-nCov-066).
Conflict of Interest
The authors declare that the research was conducted in the absence of any commercial or financial relationships that could be construed as a potential conflict of interest.
Acknowledgments
The authors would like to express their gratitude to EditSprings (https://www.editsprings.com/) for the expert linguistic services provided.
Supplementary Material
The Supplementary Material for this article can be found online at: https://www.frontiersin.org/articles/10.3389/fmed.2021.663145/full#supplementary-material
Supplementary Figure 1. Box plots of continuous variables.
Supplementary Figure 2. Bar plots of categorical variables.
Supplementary Figure 3. ROC curves for each single cytokine and a combined panel of cytokines.
References
1. Yao D, Yan K, Duan J, Zhang X, Zhou L. Coronavirus disease 2019 (COVID-19): prevention and control in gynecological outpatient clinic. Front Public Health. (2020) 8:618494. doi: 10.3389/fpubh.2020.618494
2. Zhou F, Yu T, Du R, Fan G, Liu Y, Liu Z, et al. Clinical course and risk factors for mortality of adult inpatients with COVID-19 in Wuhan, China: a retrospective cohort study. Lancet. (2020) 395:1054–62. doi: 10.1016/S0140-6736(20)30566-3
3. Sun L, Song F, Shi N, Liu F, Li S, Li P, et al. Combination of four clinical indicators predicts the severe/critical symptom of patients infected COVID-19. J Clin Virol. (2020) 128:104431. doi: 10.1016/j.jcv.2020.104431
4. Zheng YL, He YK, Ma XQ, Gao ZC. Feasibility of coronavirus disease 2019 eradication. Chin Med J. (2020) 133:1387–9. doi: 10.1097/CM9.0000000000000936
5. Kim SR, Nam SH, Kim YR. Risk factors on the progression to clinical outcomes of COVID-19 patients in South Korea: using national data. Int J Environ Res Public Health. (2020) 17:8847. doi: 10.3390/ijerph17238847
6. Alhazzani W, Moller MH, Arabi YM, Loeb M, Gong MN, Fan E, et al. Surviving sepsis campaign: guidelines on the management of critically ill adults with coronavirus disease 2019 (COVID-19). Crit Care Med. (2020). 48:E440–69. doi: 10.1097/CCM.0000000000004363
7. Hossein-khannazer N, Shokoohian B, Shpichka A, Aghdaei HA, Timashev P, Vosough M. Novel therapeutic approaches for treatment of COVID-19. J Mol Med. (2020) 98:789–803. doi: 10.1007/s00109-020-01927-6
8. Yadav P, Vats R, Bano A, Bhardwaj R. Mesenchymal stem cell immunomodulation and regeneration therapeutics as an ameliorative approach for COVID-19 pandemics. Life Sci. (2020) 263:8588. doi: 10.1016/j.lfs.2020.118588
9. Xu R, Hou KK, Zhang K, Xu HY, Zhang N, Fu H, et al. Performance of two risk-stratification models in hospitalized patients with coronavirus disease. Front Med-Lausanne. (2020) 7:518. doi: 10.3389/fmed.2020.00518
10. Jamwal S, Gautam A, Elsworth J, Kumar M, Chawla R, Kumar P. An updated insight into the molecular pathogenesis, secondary complications and potential therapeutics of COVID-19 pandemic. Life Sci. (2020) 257:118105. doi: 10.1016/j.lfs.2020.118105
11. Wiersinga WJ, Rhodes A, Cheng AC, Peacock SJ, Prescott HC. Pathophysiology, transmission, diagnosis, and treatment of coronavirus disease 2019 (COVID-19) A review. JAMA-J Am Med Assoc. (2020) 324:782–93. doi: 10.1001/jama.2020.12839
12. Tian JB, Yuan XL, Xiao J, Zhong Q, Yang CG, Liu B, et al. Clinical characteristics and risk factors associated with COVID-19 disease severity in patients with cancer in Wuhan, China: a multicentre, retrospective, cohort study. Lancet Oncol. (2020) 21:893–903. doi: 10.1016/S1470-2045(20)30309-0
13. Luo Y, Mao LY, Yuan X, Xue Y, Lin Q, Tang GX, et al. Prediction model based on the combination of cytokines and lymphocyte subsets for prognosis of SARS-CoV-2 infection. J Clin Immunol. (2020) 40:960–9. doi: 10.1007/s10875-020-00821-7
14. Gong J, Ou JY, Qiu XP, Jie YS, Chen YQ, Yuan LX, et al. A tool for early prediction of severe coronavirus disease 2019 (COVID-19): a multicenter study using the risk Nomogram in Wuhan and Guangdong, China. Clin Infect Dis. (2020). 71:833–40. doi: 10.1093/cid/ciaa443
15. Hu CY, Liu ZQ, Jiang YF, Shi OM, Zhang X, Xu KL, et al. Early prediction of mortality risk among patients with severe COVID-19, using machine learning. Int J Epidemiol. (2020) 49:1918–29. doi: 10.1101/2020.04.13.20064329
16. Edalatifard M, Akhtari M, Salehi M, Naderi Z, Jamshidi A, Mostafaei S, et al. Intravenous methylprednisolone pulse as a treatment for hospitalised severe COVID-19 patients: results from a randomised controlled clinical trial. Eur Respir J. (2020) 56:2002808. doi: 10.1183/13993003.02808-2020
17. Marfia G, Navone S, Guarnaccia L, Campanella R, Mondoni M, Locatelli M, et al. Decreased serum level of sphingosine-1-phosphate: a novel predictor of clinical severity in COVID-19. Embo Mol Med. (2021) 13:e13424. doi: 10.15252/emmm.202013424
18. Michel-Kabamba N, Ngatu NR, Leon-Kabamba N, Katumbo-Mukemo A, Mukuku O, Ngoyi-Mukonkole J, et al. Occupational COVID-19 prevention among congolese healthcare workers: knowledge, practices, PPE compliance, and safety imperatives. Trop Med Infect Dis. (2021) 6:6. doi: 10.3390/tropicalmed6010006
19. Wynants L, Van Calster B, Bonten MMJ, Collins GS, Debray TPA, De Vos M, et al. Prediction models for diagnosis and prognosis of covid-19 infection: systematic review and critical appraisal. Bmj-Brit Med J. (2020) 369:m1328. doi: 10.1101/2020.03.24.20041020
20. Li Q, Zhang JL, Ling Y, Li WX, Zhang XY, Lu HZ, et al. A simple algorithm helps early identification of SARS-CoV-2 infection patients with severe progression tendency. Infection. (2020) 48:577–84. doi: 10.1007/s15010-020-01446-z
21. Dong YL, Zhou HF, Li MY, Zhang ZL, Guo WN, Yu T, et al. A novel simple scoring model for predicting severity of patients with SARS-CoV-2 infection. Transbound Emerg Dis. (2020) 67:2823–9. doi: 10.1111/tbed.13651
22. Shen B, Yi X, Sun YT, Bi XJ, Du JP, Zhang C, et al. Proteomic and metabolomic characterization of COVID-19 patient sera. Cell. (2020) 182:59. doi: 10.1016/j.cell.2020.05.032
23. MacWilliam D, Kowalewski J, Kumar A, Pontrello C, Ray A. Signaling mode of the broad-spectrum conserved CO2 receptor is one of the important determinants of odor valence in drosophila. Neuron. (2018) 97:1153. doi: 10.1016/j.neuron.2018.01.028
24. Rubbens P, Schmidt ML, Props R, Biddanda BA, Boon N, Waegeman W, et al. Randomized lasso links microbial taxa with aquatic functional groups inferred from flow cytometry. Msystems. (2019) 4:e00093-19. doi: 10.1128/mSystems.00093-19
25. Muntner P, Colantonio LD, Cushman M, Goff DC, Howard G, Howard VJ, et al. Validation of the atherosclerotic cardiovascular disease pooled cohort risk equations. JAMA-J Am Med Assoc. (2014) 311:1406–15. doi: 10.1001/jama.2014.2630
26. Udomsinprasert W, Jittikoon J, Sangroongruangsri S, Chaikledkaew U. Circulating levels of interleukin-6 and interleukin-10, but not tumor necrosis factor-alpha, as potential biomarkers of severity and mortality for COVID-19: systematic review with meta-analysis. J Clin Immunol. (2021) 41:11–22. doi: 10.1007/s10875-020-00899-z
27. Ahmad T, Chaudhuri R, Joshi MC, Almatroudi A, Rahmani AH, Ali SM. COVID-19: the emerging immunopathological determinants for recovery or death. Front Microbiol. (2020) 11:588409. doi: 10.3389/fmicb.2020.588409
28. Mannino F, Bitto A, Irrera N. Severe acute respiratory syndrome coronavirus-2 induces cytokine storm and inflammation during coronavirus disease 19: perspectives and possible therapeutic approaches. Front Pharmacol. (2020) 11:592169. doi: 10.3389/fphar.2020.592169
29. Reznik SE, Tiwari AK, Ashby CR. Edaravone: a potential treatment for the COVID-19-induced inflammatory syndrome? Pharmacol Res. (2020) 160:105055. doi: 10.1016/j.phrs.2020.105055
30. Wang W, Zhang YF, Liu MX, Wang Y, Yang T, Li DS, et al. TIMP2 is a poor prognostic factor and predicts metastatic biological behavior in gastric cancer. Sci Rep-Uk. (2018) 8:9629. doi: 10.1038/s41598-018-27897-x
31. Bello-Chavolla OY, Antonio-Villa NE, Ortiz-Brizuela E, Vargas-Vazquez A, Gonzalez-Lara MF, de Leon AP, et al. Validation and repurposing of the MSL-COVID-19 score for prediction of severe COVID-19 using simple clinical predictors in a triage setting: The Nutri-CoV score. PLoS ONE. (2020) 15:244051. doi: 10.1371/journal.pone.0244051
32. Xiao LS, Li P, Sun FL, Zhang YP, Xu CH, Zhu HB, et al. Development and validation of a deep learning-based model using computed tomography imaging for predicting disease severity of coronavirus disease 2019. Front Bioeng Biotech. (2020) 8:898. doi: 10.3389/fbioe.2020.00898
33. Xiao LS, Zhang WF, Gong MC, Zhang YP, Chen LY, Zhu HB, et al. Development and validation of the HNC-LL score for predicting the severity of coronavirus disease 2019. Ebiomedicine. (2020) 57:102880. doi: 10.1016/j.ebiom.2020.102880
Glossary
AIC, Akaike information criterion; ALB, albumin; ALT, alanine aminotransferase; APTT, activated partial thromboplastin time; AST, aspartate transaminase; AUC, area under the ROC curve; BASOR, basophil ratio; CHOL, cholesterol; CK, creatine kinase; CREA, serum creatinine; DBIL, direct bilirubin; DBP, diastolic blood pressure; DCA, decision curve analysis; DM, diabetes; EOSR, eosinophil ratio; FIB, fibrinogen; GLB, globulin; GLU, glucose; Hb, hemoglobin; HCT, hematocrit; HDL-C, high-density lipoprotein cholesterol; HLP, hyperlipidemia; HP, hypertension; HsCRP, high-sensitivity C reactive protein; IBIL, indirect bilirubin; IFN, interferon; IL, interleukins; INR, International Normalized Ratio; LDL-C, low-density lipoprotein cholesterol; LYMR, lymphocyte ratio; MONOR, monocyte ratio; Myo, myoglobin; NEUTR, neutrophil ratio; PCT, procalcitonin; PLT, platelets; PT, prothrombin time; ROC, receiver operating characteristic; SBP, systolic blood pressure; TBIL, total bilirubin; TG, triglyceride; TNF, tumor necrosis factor; TP, total protein; URIC, uric acid; WBC, white blood cell.
Keywords: COVID-19, severe COVID-19, predictive model, laboratory findings, cytokines, online predictive calculator
Citation: Meng Z, Wang M, Zhao Z, Zhou Y, Wu Y, Guo S, Li M, Zhou Y, Yang S, Li W and Ying B (2021) Development and Validation of a Predictive Model for Severe COVID-19: A Case-Control Study in China. Front. Med. 8:663145. doi: 10.3389/fmed.2021.663145
Received: 02 February 2021; Accepted: 12 April 2021;
Published: 25 May 2021.
Edited by:
Huahao Shen, Zhejiang University, ChinaReviewed by:
Chuan Hu, Qingdao University Medical College, ChinaChayan Kanti Nandi, Indian Institute of Technology Mandi, India
Copyright © 2021 Meng, Wang, Zhao, Zhou, Wu, Guo, Li, Zhou, Yang, Li and Ying. This is an open-access article distributed under the terms of the Creative Commons Attribution License (CC BY). The use, distribution or reproduction in other forums is permitted, provided the original author(s) and the copyright owner(s) are credited and that the original publication in this journal is cited, in accordance with accepted academic practice. No use, distribution or reproduction is permitted which does not comply with these terms.
*Correspondence: Binwu Ying, binwuyin@126.com; Weimin Li, weimin003@163.com
†These authors have contributed equally to this work