 Yingjie Xv1,2†
 Fajin Lv1†
 Haoming Guo1
 Zhaojun Liu2Di Luo1,2Jing Liu2Xin Gou2Weiyang He2Mingzhao Xiao2*
 Yineng Zheng1*
- 1Department of Radiology, The First Affiliated Hospital of Chongqing Medical University, Chongqing, China
- 2Department of Urology, The First Affiliated Hospital of Chongqing Medical University, Chongqing, China
Objective: This study aims to develop and validate a CT-based radiomics nomogram integrated with clinic-radiological factors for preoperatively differentiating high-grade from low-grade clear cell renal cell carcinomas (CCRCCs).
Methods: 370 patients with complete clinical, pathological, and CT image data were enrolled in this retrospective study, and were randomly divided into training and testing sets with a 7:3 ratio. Radiomics features were extracted from nephrographic phase (NP) contrast-enhanced images, and then a radiomics model was constructed by the selected radiomics features using a multivariable logistic regression combined with the most suitable feature selection algorithm determined by the comparison among least absolute shrinkage and selection operator (LASSO), recursive feature elimination (RFE) and ReliefF. A clinical model was established using clinical and radiological features. A radiomics nomogram was constructed by integrating the radiomics signature and independent clinic-radiological features. Performance of these three models was assessed using receiver operating characteristic (ROC) curve analysis and decision curve analysis (DCA).
Results: Using multivariate logistic regression analysis, three clinic-radiological features including intratumoral necrosis (OR=3.00, 95% CI=1.30-6.90, p=0.049), intratumoral angiogenesis (OR=3.28, 95% CI=1.22-8.78, p=0.018), and perinephric metastasis (OR=2.90, 95% CI=1.03-8.17, p=0.044) were found to be independent predictors of WHO/ISUP grade in CCRCC. Incorporating the above clinic-radiological predictors and radiomics signature constructed by LASSO, a CT-based radiomics nomogram was developed, and presented better predictive performance than clinic-radiological model and radiomics signature model, with an AUC of 0.891 (95% CI=0.832-0.962) and 0.843 (95% CI=0.718-0.975) in the training and testing sets, respectively. DCA indicated that the nomogram has potential clinical usefulness.
Conclusion: The CT-based radiomics nomogram is a promising tool to predict WHO/ISUP grade of CCRCC preoperatively and noninvasively.
Introduction
Renal cell carcinoma (RCC) represents the most common malignant neoplasm of the kidney in adults, of which 70–80% are categorized as clear cell renal cell carcinoma (CCRCC) (1, 2). With a continuously increasing incidence for decades, CCRCC is the RCC subtype that accounts for the most metastatic cases and deaths (3–5).
Compared to early-stage CCRCC, advanced CCRCC is considered more aggressive and has a worse prognosis (6). The prognosis of patients with CCRCC is closely related to the tumor nuclear grade (7). As the most generally adopted grading system, the World Health Organization/International Society of Urological Pathology (WHO/ISUP) classification system categorizes tumors of nuclear grade I and II as low-grade and of grade III and IV as high- grade. High-grade CCRCC differs from low-grade CCRCC in malignant biological behaviors that generate mortal clinical outcomes (8). Therefore, it is crucial for clinicians to identify the nuclear differentiation degree of CCRCC because of the important role it plays in formulating a clinical treatment strategy. However, although percutaneous biopsy has been criticized for the risks of procedural complications, potential sampling errors, and mismatch with pathology outcomes, it is the only preoperative method for identifying the confirmed grade of CCRCC (9). A noninvasive, efficient method for identifying the pathological grade of CCRCC is urgently needed.
Computed tomography (CT) is a common noninvasive imaging modality for diagnosing tumor staging and assessing tumor aggressiveness in patients with CCRCC (4). Nonetheless, CT has limited predictive performance in differentiating high-grade from low-grade CCRCCs, and the accuracy of diagnosis based on CT images depends on the experience of radiologists to a great extent, which is extremely subjective (10). Radiomics, a promising and emerging technique, enables the conversion of medical images into enormous quantities of image-related features which can be analyzed in model-building algorithms (11–13). To date, radiomics has successfully been applied in several fields of RCC, including prediction of the Fuhrman stages and therapy response of CCRCC and discrimination of RCC’s subtypes (14–16). However, most studies developed models based on texture analysis only, which neglected the importance of clinical risk factors and radiological features that could improve predictive performance.
The purpose of this study was to develop and validate a radiomics nomogram that incorporates NP CT radiomics signature, clinical factors, and radiological features to preoperatively differentiate high-grade CCRCC from low-grade CCRCC.
Materials and Methods
Patients
All patients were recruited between May 2013 to May 2019 at the First Affiliated Hospital of Chongqing Medical University. The inclusion criteria were as follows: 1) patients underwent partial/radical nephrectomy and pathologically diagnosed as CCRCC; 2) availability of complete clinical, pathological, and CT image data. A total of 795 patients met the inclusion criteria were initially enrolled. We excluded patients whose CCRCC nuclear grades were determined by the Fuhrman classification system (n=215), and those received preoperative treatment (n=15). Patients without portal venous phase CT images or with the images in poor definition were also excluded (n=195). Finally, 370 patients were retained and allocated to the training (n=255) and testing (n=115) sets. The flowchart of recruiting the patient cohort is shown in Figure 1. Two independent pathologists rechecked the CCRCC samples of our study population and reported the histopathological nuclear grade based on the 2016 WHO/ISUP nuclear grading system. Discordant reports were resolved by a third senior pathologist. These tumors were divided into low-grade (grade I and II) and high-grade (grade III and IV). Ethics approval of the institutional review board of our hospital was achieved before the conduction of all protocols and the requirement for obtaining informed consent was waived in this retrospective study.

Figure 1 Flowchart of recruiting study population and model construction.
CT Imaging Parameters
The routine abdominal CT scanning were acquired using a 64-slice multidetector CT equipment (Discovery 750 HD, GE Healthcare, Milwaukee, WI). The scanning parameters were 120-140 kVp tube voltage, 220–300 mAs tube current, 64 × 0.625 mm detector collimation, matrix of 512 × 512, gantry rotation time of 0.5 s and slice thickness of 5 mm. An iodinated nonionic contrast agent dosed at 1 mL/kg body weight was injected into the antecubital vein at 2.5-3.0 mL/s using an electric power injector. Pre-contrast CT of the abdomen was first acquired, followed by two post-contrast CT scans obtained in corticomedullary phase (CMP, 25-28 s after contrast agent was administrated) and nephrographic phase (NP, 65-70 s after contrast agent was administrated). Finally, excretory phase was acquired (EP, 6-8 min after contrast agent was administrated) (17–19).
Tumor Segmentation
All NP phase CT images in DICOM format with original dimensions and resolution were transferred into the ITK-SNAP software (version 3.8, www.itksnap.org) for three-dimensional (3-D) segmentation of the region of interests (ROIs). To ensure the accuracy of the tumor boundaries, the ROIs were meticulously manually delineated on all slices, by a radiologist with 10 years of experience in abdominal imaging, who was blinded to the pathological results (reader 1). To test feature stability, radiomics features of 30 randomly chosen patients (from the whole study set) were re-extracted by reader 1 and another radiologist (with 15 years of experience; reader 2). The intraclass correlation coefficient (ICC) was calculated to evaluate the consistency and reproducibility of the features. Features with ICC>0.80 in both intra- and inter-observer agreement analyses were included in subsequent analysis. To avoid partial volume effect, the top and bottom layers were excluded.
Radiomics Feature Extraction
The following image preprocessing steps was performed to decrease the feature variability prior to radiomics feature extraction, including gray-level discretization, intensity normalization and voxel resampling. Then, radiomics features were extracted from NP CT images via an open-source PyRadiomics library, and classified into four categories: size and morphological features, descriptors of the image intensity histogram, descriptors of the relationships between image voxels (e.g. gray-level co-occurrence matrix (GLCM), run length matrix (RLM), size zone matrix (SZM), and neighborhood gray tone difference matrix (NGTDM) derived textures), and higher-order texture features extracted from filtered images.
Radiomics Signature Construction
Radiomics features with ICCs greater than 0.80 in the agreement analysis were reserved. Next, three feature selection algorithms including least absolute shrinkage and selection operator (LASSO), recursive feature elimination (RFE) and ReliefF were applied to select the optimized subset of features for radiomics model construction, respectively, which was used as the input fed into multivariable logistic regression. Third, the predictive performance of the three prediction models were compared and the one with top performance was retained. The selected radiomics features were used to construct radiomics signature.
Clinic-Radiological Model Building
Clinical parameters such as age, sex, body mass index (BMI), smoking history, hypertension history, diabetes history, tumor location, specific clinical symptoms (hematuria and flank pain), and distant metastasis were retrieved from the electronic medical record system of our institution. The radiological features including tumor size, intratumoral necrosis, cystic degeneration, intratumoral calcification, invasion of the renal capsule, intratumoral angiogenesis, venous invasion, and perinephric metastasis were reviewed and reported by two radiologists with 10 and 15 years of experience in abdominal imaging who were blinded to the radiological reports and pathologic details. The diagnostic criteria were summarized in Table S1. For the construction of the clinic–radiological model, the univariate regression was firstly applied to analyze the above clinic-radiological features, and the statistically significant features in the univariate regression analysis were then processed in the multivariate regression model. Finally, features with a P-value lower than 0.05 were adopted to establish clinic–radiological model. Two representative nephrographic phase CT images in which one was low-grade CCRCC (Figure 2A) and another was high-grade (Figure 2B) were exhibited in Figure 2.
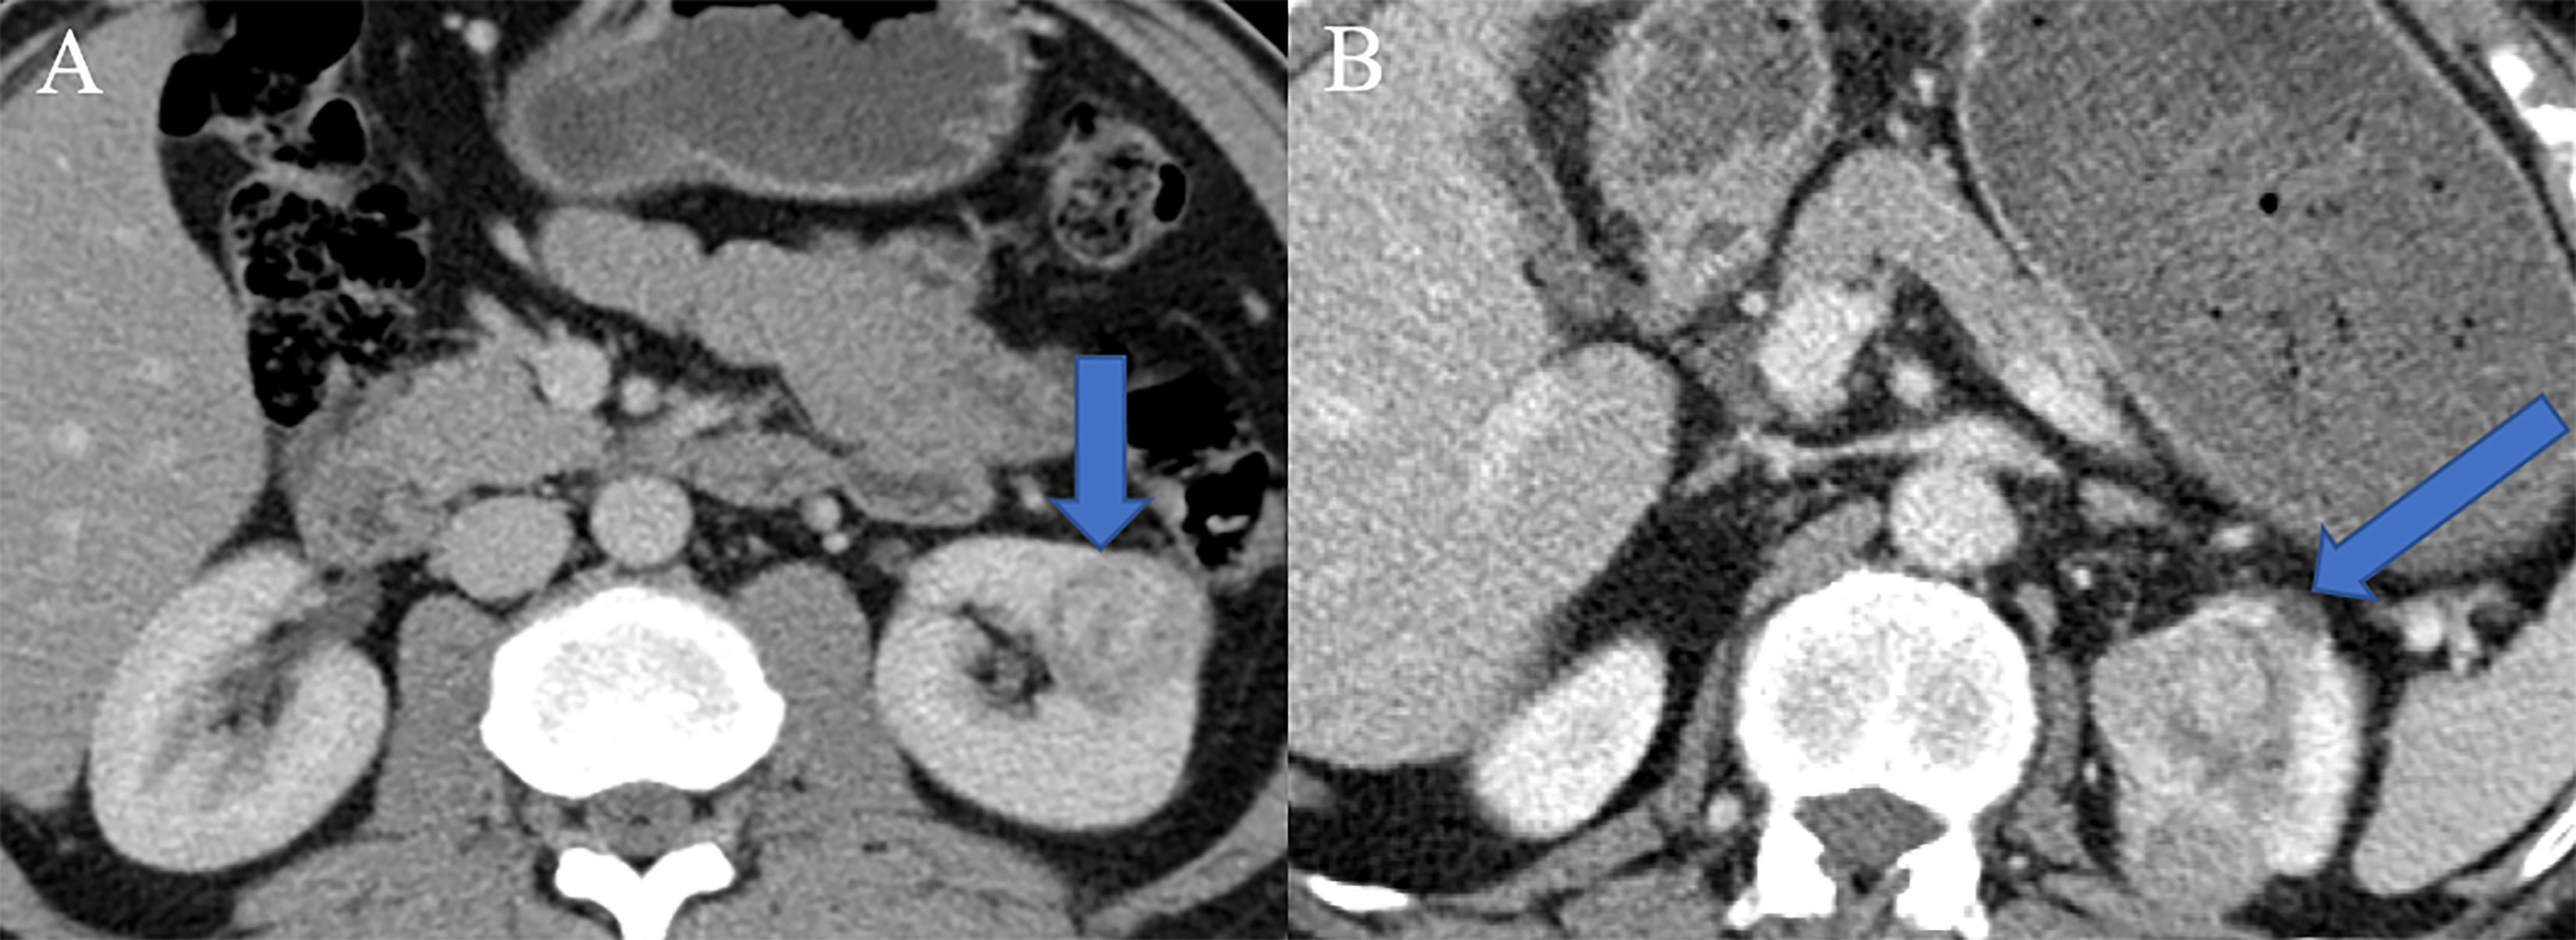
Figure 2 Two representative nephrographic phase CT images. (A) A patient with low-grade CCRCC, there was no specific radiological features in the presented CT image. (B) A patient with high-grade CCRCC, tumor necrosis, angiogenesis, and perinephric invasion phenomena were observed in the presented CT image.
Development of Radiomics Nomogram
To provide the clinician with a quantitative tool to discriminate high-grade from low-grade CCRCCs, radiomics signature and clinic-radiological characteristics were combined by multivariable logistic regression analysis to construct a radiomics nomogram model as the combined model.
Model Evaluation
5-fold cross validation was used in model training, and the diagnostic performance of clinic-radiological, radiomics, and combined models were validated in terms of the receiver operating characteristic (ROC) curve and area under the curve (AUC) in a testing set. Sensitivity, specificity, positive predictive value (PPV), negative predictive value (NPV), and accuracy were also calculated. The Delong test was used to compare the AUC values in different models in both training and testing sets. The calibration curve analysis was performed to determine the predictive performance of the nomogram in the testing set, accompanied with the Hosmer-Lemeshow test. Decision curve analysis (DCA) was also performed to assess the clinical significance of the radiomics nomogram by calculating the net benefits at different threshold probabilities.
Statistical Analysis
Continuous variables are expressed as mean values ± standard deviations and categorical variables are expressed as counts (n) and percentages (%). Normally distributed continuous data were compared using the student’s t-test. The Chi-square test was used to compare the distribution of categorical data between groups. The multivariate logistic regression analysis was applied to determine the independent predictors among all the clinical variables. All statistical analyses were performed using R software (version 3.5.2). A two-tailed P-value lower than 0.05 was considered statistically significant.
Results
Clinic-Radiological Characteristics
A total of 370 patients were enrolled in our study, with collected clinical and radiological data. The differences in clinic-radiological variables between patients with low- and high-grade CCRCCs in the training and testing sets are summarized in Table 1. The training set included 255 patients (152 males and 103 females), in which 202 patients were diagnosed with low-grade CCRCC while 53 were diagnosed with high-grade one. Patients with high-grade CCRCC were significantly different from those with low-grade CCRCC in terms of tumor size (p<0.001), surgical method (p<0.001), intratumoral necrosis (p<0.001), intratumoral calcification (p=0.027), invasion of the renal capsule (p<0.001), intratumoral angiogenesis (p<0.001), venous invasion (p<0.001), and perinephric metastasis (p<0.001).
Table 1 Clinic-radiological characteristics of CCRCC patients in the training and testing sets.
Clinic-Radiological Model Building
Univariate analysis showed that tumor size, intratumoral necrosis, intratumoral calcification, invasion of the renal capsule, intratumoral angiogenesis, venous invasion, and perinephric metastasis served as the risk factors of WHO/ISUP grade in CCRCC. After multivariate logistic regression analysis, intratumoral necrosis (OR=3.00, 95% CI=1.30-6.90, p=0.049), intratumoral angiogenesis (OR=3.28, 95% CI=1.22-8.78, p=0.018), and perinephric metastasis (OR=2.90, 95% CI=1.03-8.17, p=0.044) remained to be independent clinic-radiological predictors (Table 2).
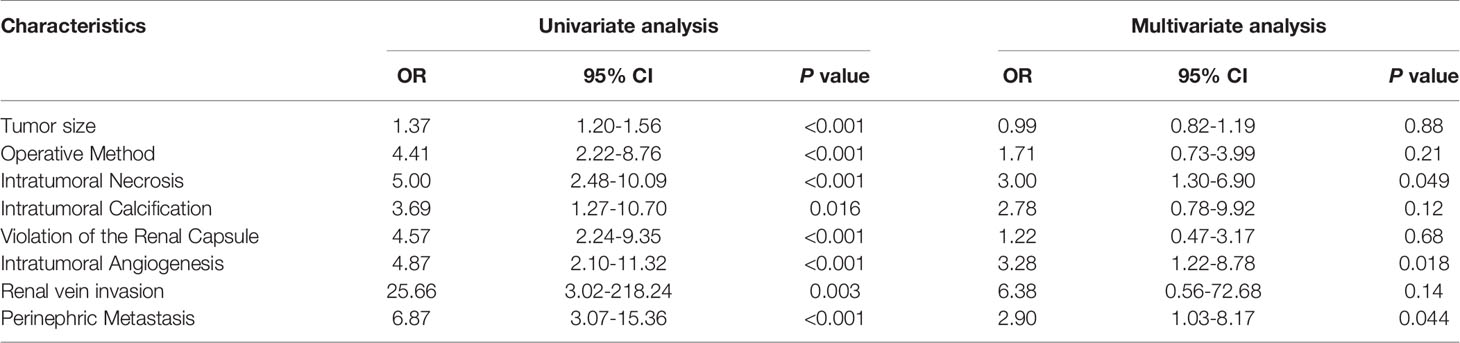
Table 2 Univariate and multivariate logistic regression analysis of the clinic-radiological features in predicting the WHO/ISUP grade of CCRCC.
Radiomics Feature Selection and Radiomics Model Construction
In total, 1320 radiomics features were extracted from NP CT images of each CCRCC patients, among which 480 features with good reproducibility were selected for radiomics model establishment. Three feature selection algorithms such as LASSO, RFE, and ReliefF were applied and compared for dimensionality reduction, and the different feature subsets were fed into logistic regression model for differentiating high-grade from low-grade CCRCCs, respectively. The classification performance for different feature selection algorithms was presented in Table 3. It was observed that 10 optimized features were selected by the LASSO algorithm to construct the radiomics model (Figure 3), which outperformed than others constructed by RFE and ReliefF and yielded an AUC value of 0.833 (95% CI=0.751-0.925) and 0.804 (95% CI=0.667-0.958) in the training and testing sets, respectively. A radiomics signature was calculated, based on the weighting coefficients of the selected features, using the formula as follows:
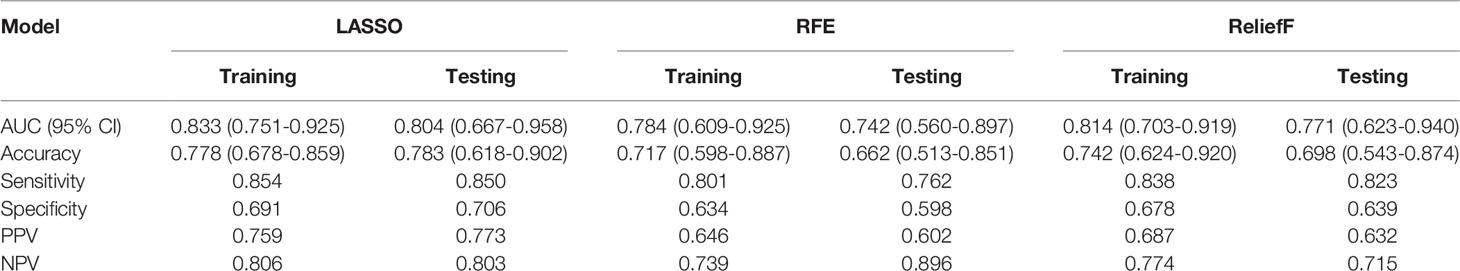
Table 3 Predictive performance of three feature selection algorithms.
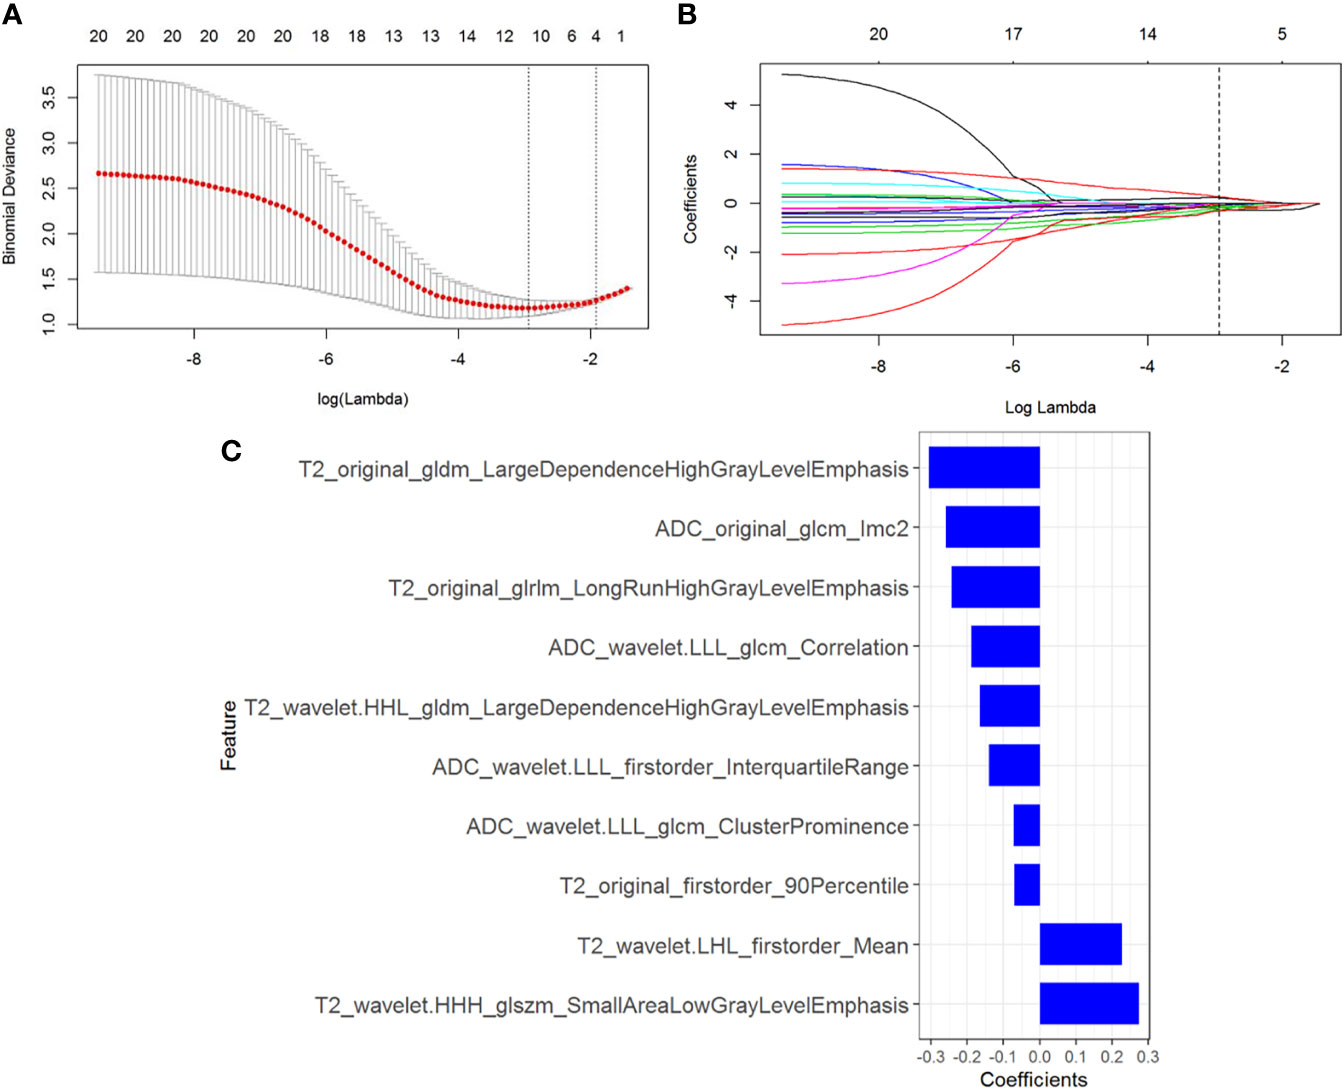
Figure 3 Radiomics feature selection using the least absolute shrinkage and selection operator (LASSO) regression. (A) Tuning parameter (λ) selection in the LASSO model. The optimal value of λ= 0.053, with log(λ) =-2.937 was selected. (B) LASSO coefficient profiles of the N radiomics features. A coefficient profile plot was generated versus the selected log (λ) value with 5-fold cross validation. (C) The selected radiomics features (with nonzero coefficients) and their coefficients.
Rad-score = -0.244*T2_original_glrlm_LongRunHighGrayLevelEmphasis+-0.188*ADC_wavelet.LLL_glcm_Correlation+-0.166*T2_wavelet.HHL_gldm_LargeDependenceHighGrayLevelEmphasis+-0.072*ADC_wavelet.LLL_glcm_ClusterProminence+-0.069*T2_original_firstorder_90Percentile+-0.26*ADC_original_glcm_Imc2+0.227*T2_wavelet.LHL_firstorder_Mean+0.275*T2_wavelet.HHH_glszm_SmallAreaLowGrayLevelEmphasis+-0.14*ADC_wavelet.LLL_firstorder_InterquartileRange+-0.305*T2_original_gldm_LargeDependenceHighGrayLevelEmphasis + 0.101.
Radiomics Nomogram Construction
By incorporating three independent clinic-radiological factors such as intratumoral necrosis, intratumoral angiogenesis, and perinephric metastasis, a combined model was constructed and presented as a CT-based radiomics nomogram (Figure 4A). Using the calibration curve analysis, a good agreement between the predicted and actual probabilities for predicting the WHO/ISUP grade of CCRCC in the training and testing sets was illustrated (Figures 4B, C). The Hosmer-Lemeshow test yielded a nonsignificant statistical difference (P =0.397 and 0.302).
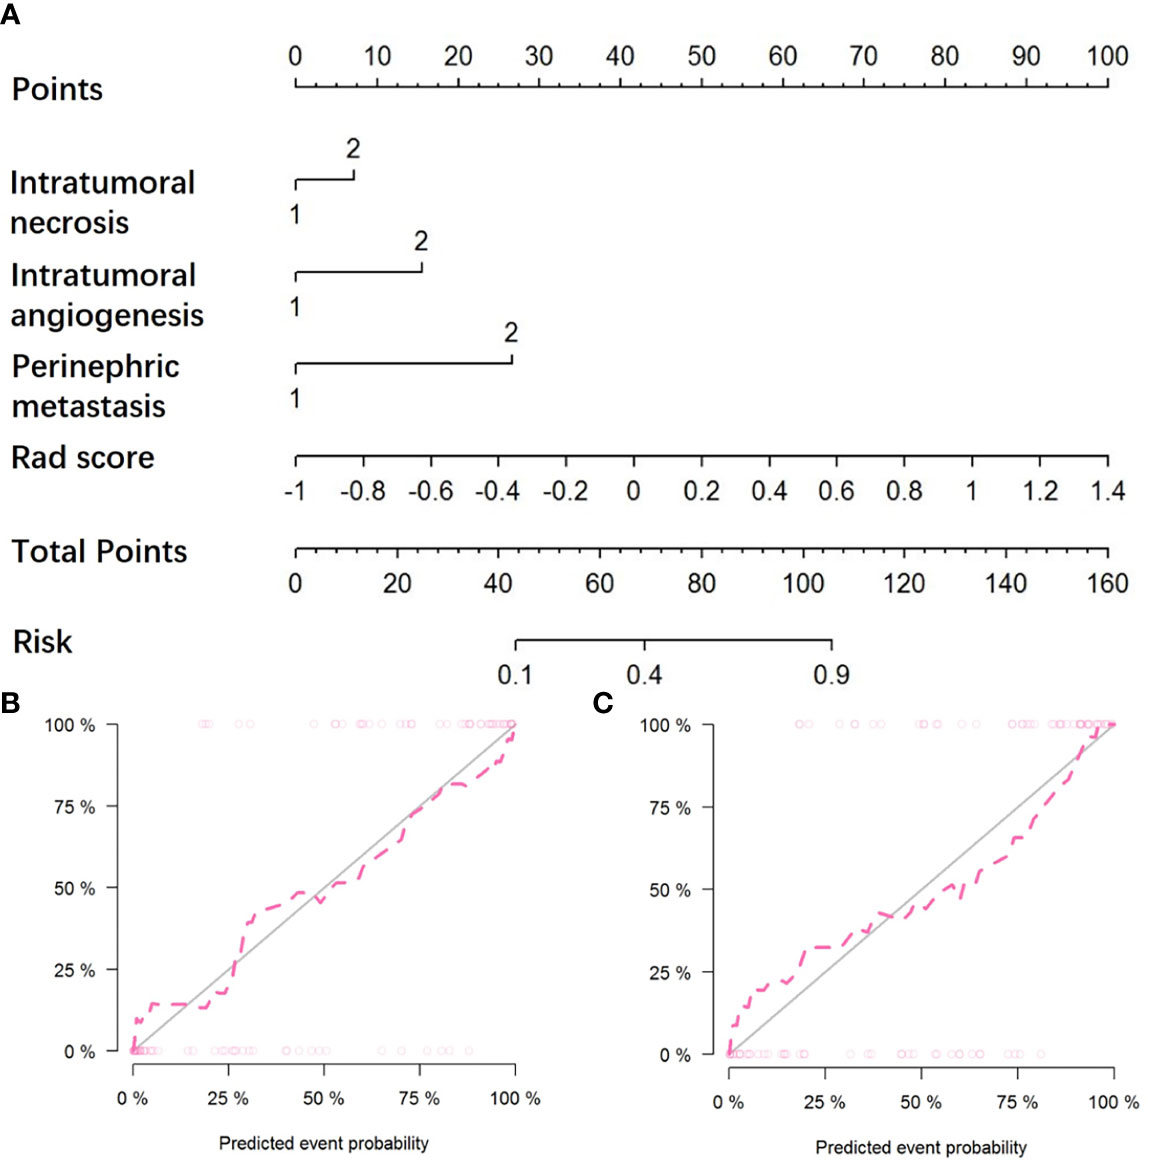
Figure 4 The CT-based radiomics nomogram and calibration curves of the nomogram. (A) Integrating radiomics signature, intratumoral necrosis, intratumoral angiogenesis, and perinephric metastasis, the CT-based nomogram was established. Calibration curves of the nomogram in the training (B) and testing (C) sets.
Comparison Among Different Models
The predictive performance and the ROC curves of the clinic-radiological, radiomics signature, and nomogram in the training and testing sets are presented in Table 4 and Figure 5. The clinic-radiological model yielded an AUC value of 0.809 (95% CI=0.715-0.897) in the training set and 0.722 (95% CI=0.546-0.894) in the testing set, while the radiomics signature model obtained an AUC value of 0.833 (95% CI=0.751-0.925) and 0.804 (95% CI=0.667-0.958) in both sets. The nomogram achieved the best discrimination in the training (AUC, 0.891; 95% CI, 0.832-0.962) and testing (AUC, 0.843; 95% CI, 0.718-0.975) sets, with accuracy of 0.822 and 0.811, sensitivity of 0.796 and 0.727, and specificity of 0.848 and 0.933, respectively. Using the Delong test, significant differences between the clinic-radiological model and the CT-based radiomics nomogram with respect to AUC were demonstrated for the training (p =0.003) and testing (p < 0.001) sets. The DCA was presented in Figure 6. The radiomics nomogram demonstrated the higher overall net benefit than radiomics model, indicating the radiomics nomogram had an excellent clinical utility in distinguishing high-grade from low-grade CCRCCs.
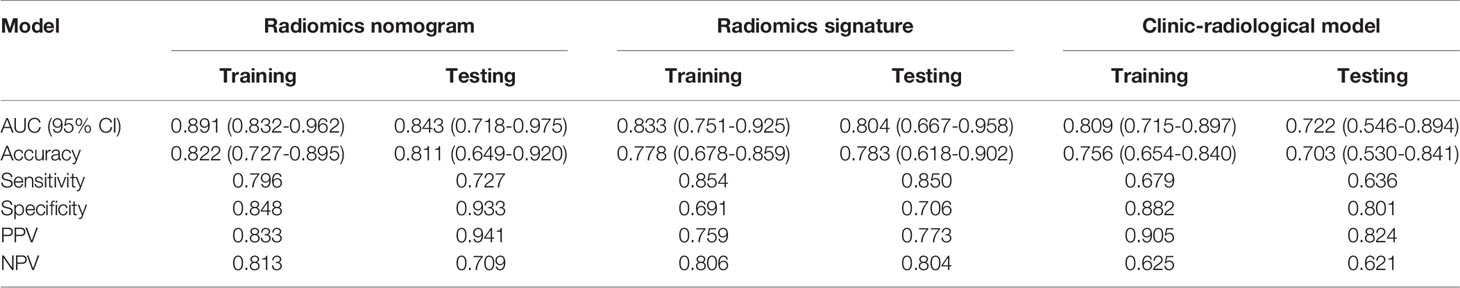
Table 4 Predictive performance of clinic-radiological model, radiomics signature, and radiomics nomogram.
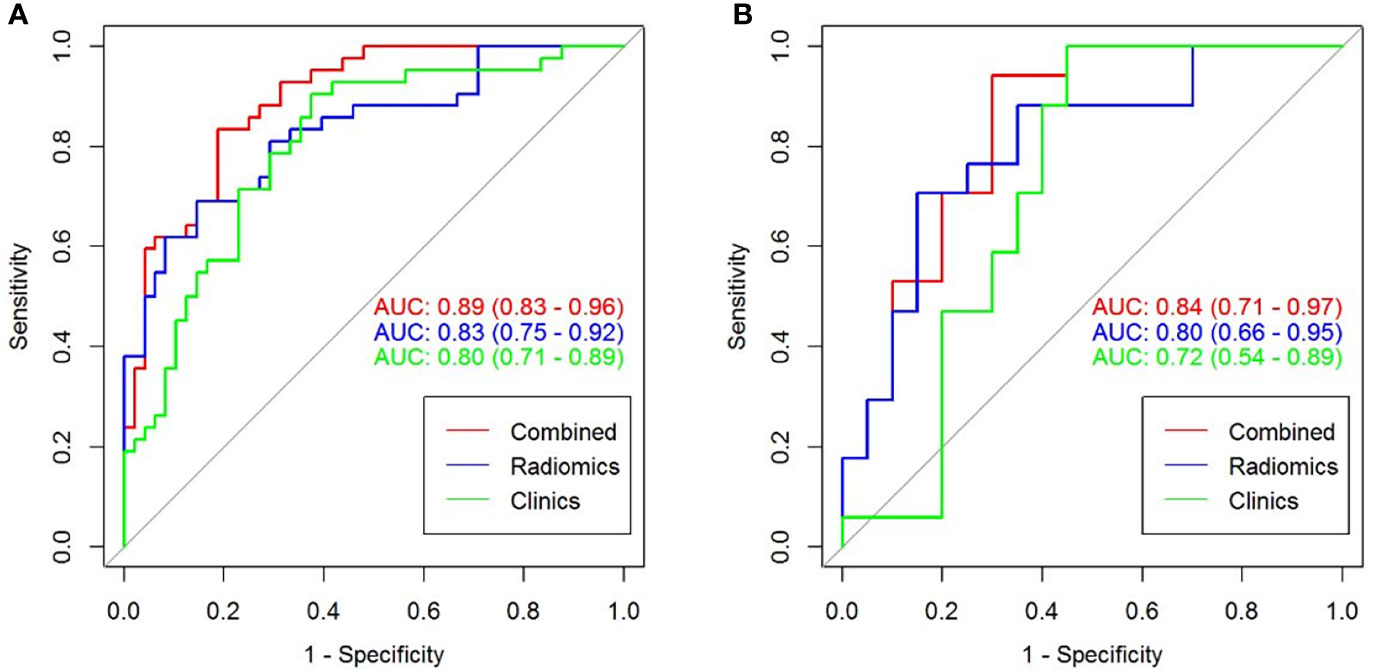
Figure 5 The ROC curves (AUC) of the three models in the training (A) and testing sets (B).
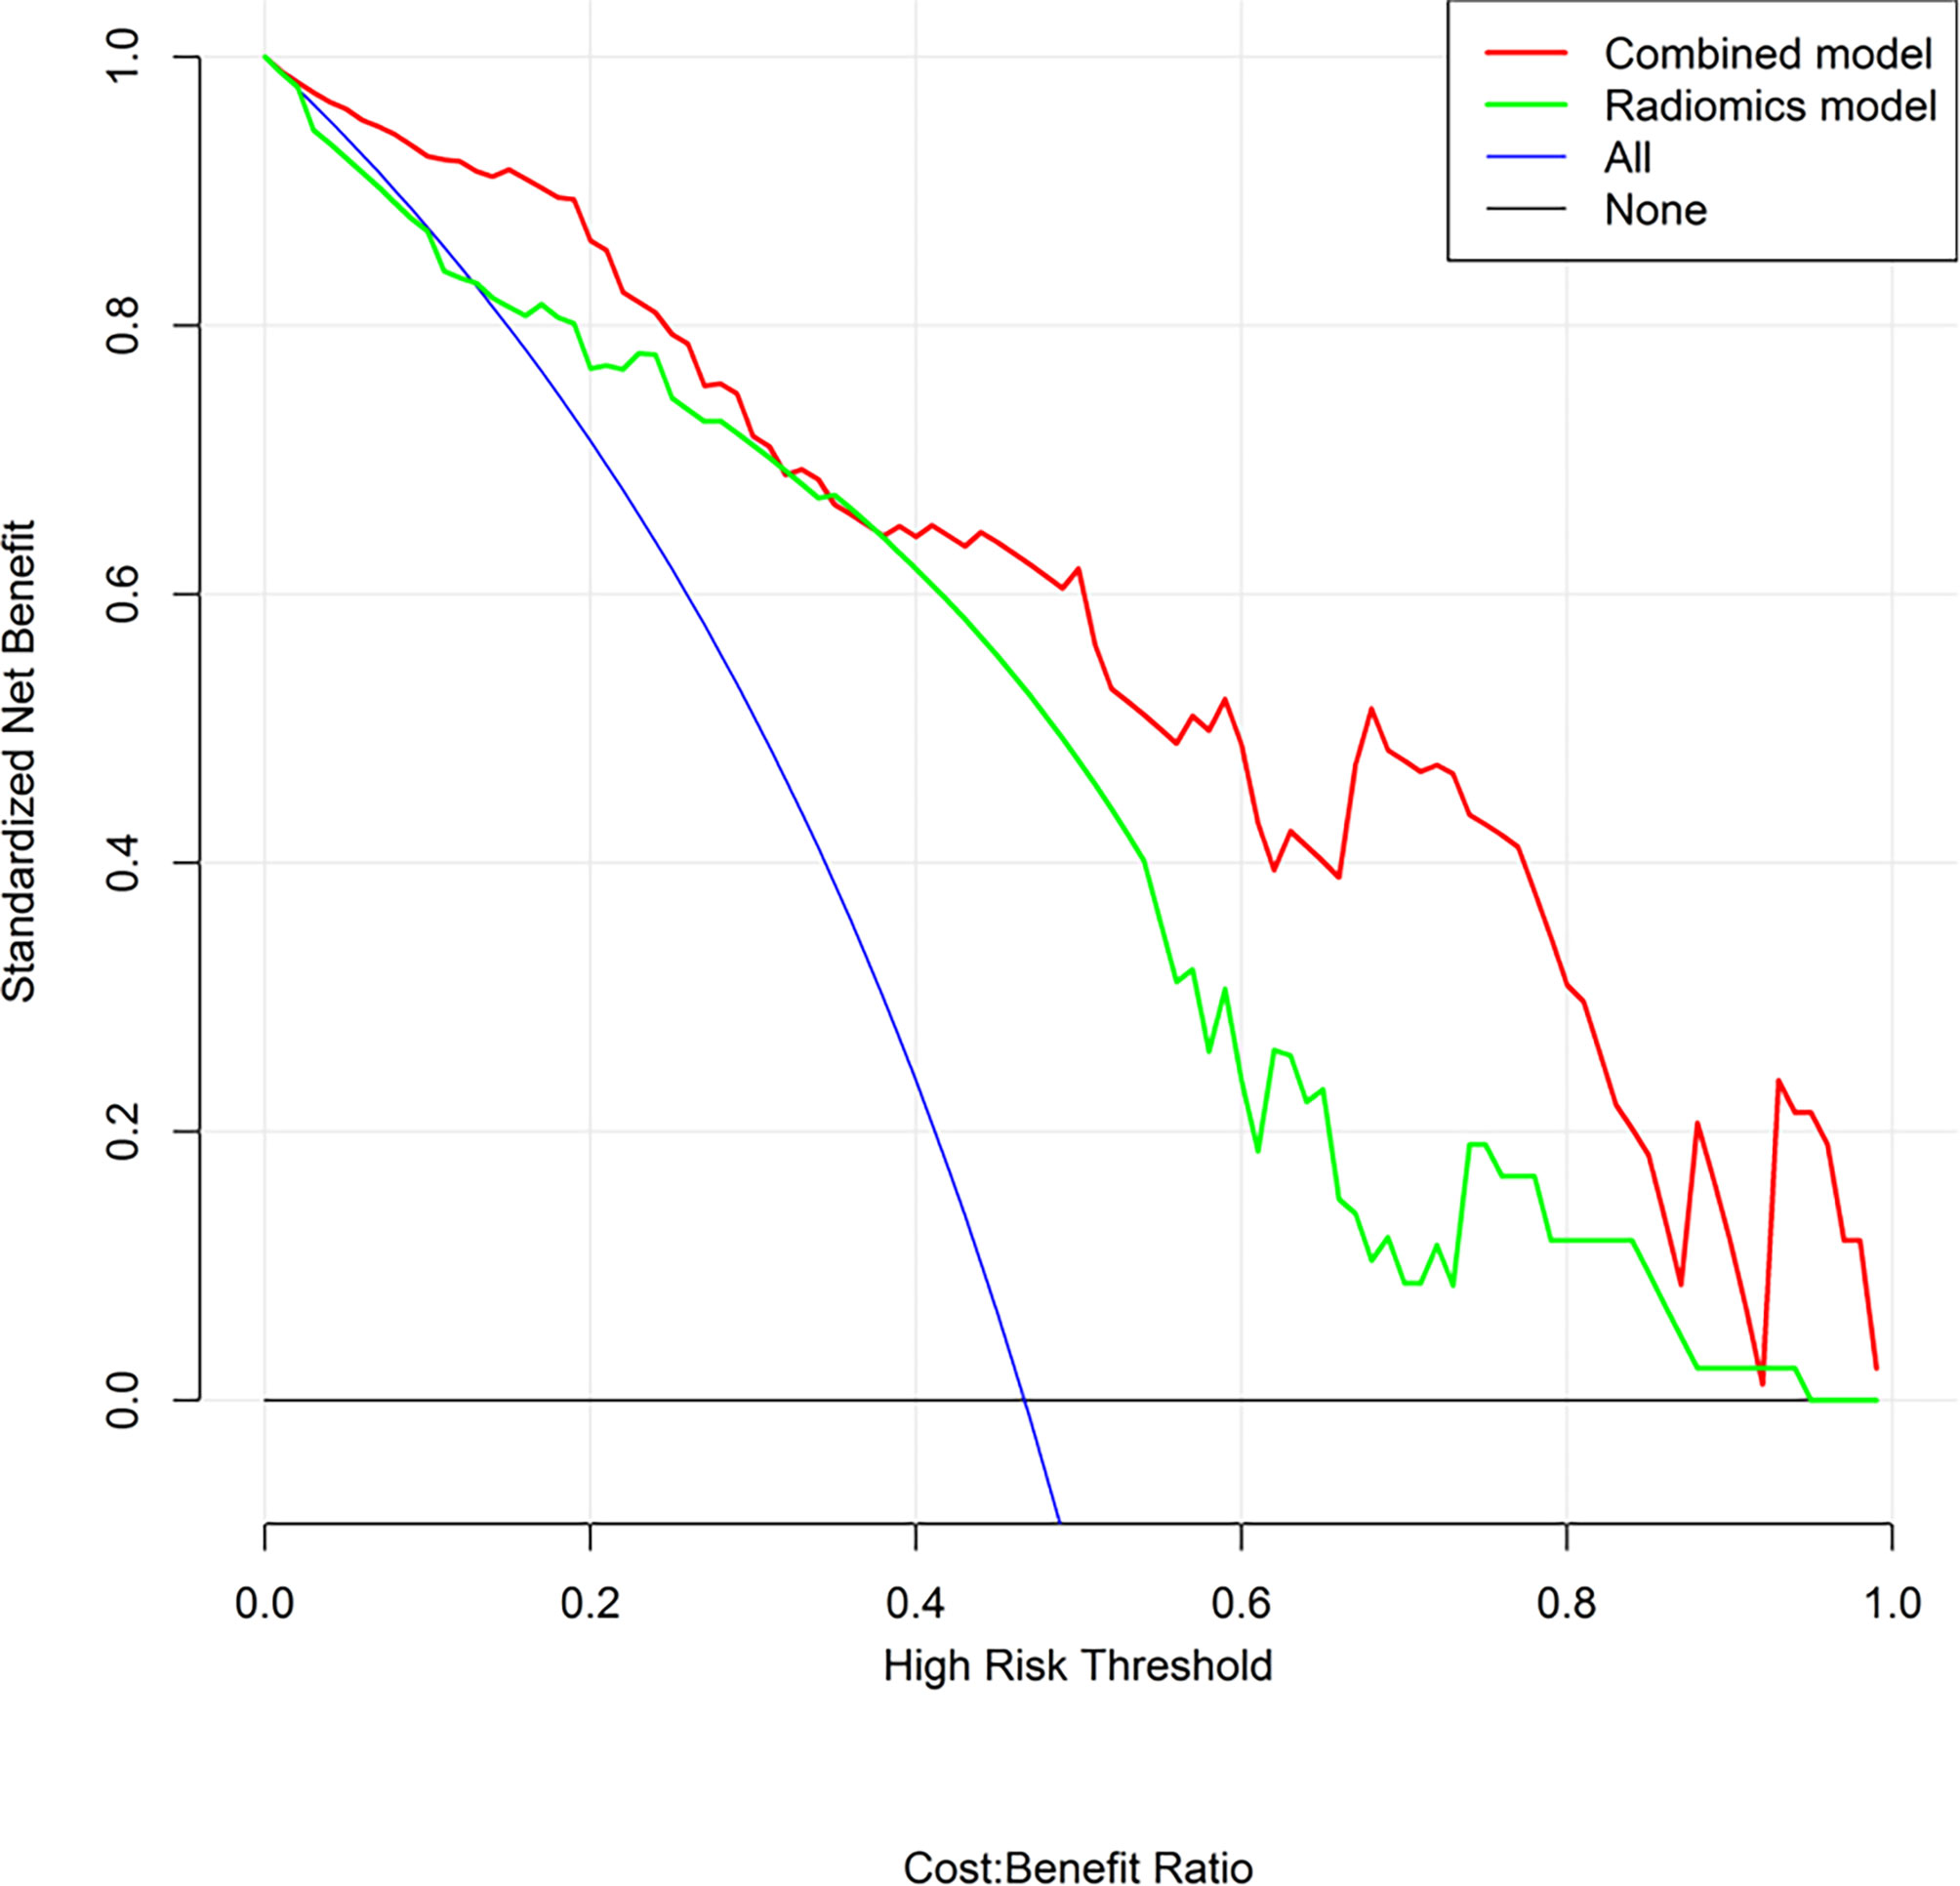
Figure 6 Decision curve analysis (DCA) for the radiomics nomogram and radiomics model. The DCA indicated that more net benefits within the most of thresholds probabilities were achieved using the radiomics nomogram.
Discussion
In this retrospective study, we developed and validated a radiomics nomogram for noninvasive, and individualized prediction of WHO/ISUP nuclear grade of CCRCC. The nomogram incorporates clinic-radiological characteristics and NP CT radiomics signature, which demonstrated impressive predictive efficiency (AUC=0.84, 95% CI=0.71-0.97) in stratifying the WHO/ISUP grading levels of CCRCC patients with satisfactory reproducibility and reliability.
The nuclear grade of CCRCC is correlated with metastatic potential and affects patient prognosis (4, 7). Therefore, the preoperative prediction of the nuclear grade is of great significance for clinical decisions. CT diagnosis is superior to percutaneous biopsy because of its noninvasiveness; however, it is inferior in terms of diagnostic accuracy (20, 21). Novel imaging techniques, such as magnetic resonance imaging (MRI) and dual-energy spectral CT, are capable to assess the grading level of CCRCC, however, their predictive performance do not match that of percutaneous biopsy, and the diagnostic results depend on the experience of radiologists (22–24). By quantifying tumor heterogeneity through the spatial arrangement of image voxels with signal-intensity variations and detecting the imperceptible differences of the intensity distribution in medical images, CT radiomics can noninvasively predict the pathological grade of tumors with satisfactory performance (25–27). To our knowledge, no previous study has predicted the WHO/ISUP grade of CCRCC using the combination of NP CT-based radiomics features and clinic-radiological characteristics.
Several studies have demonstrated that machine learning (ML)-based CT radiomics models can distinguish Fuhrman grade or WHO/ISUP grade of CCRCC (17, 19, 28–30). However, most of these studies built ML models based on radiomics features only, neglecting the importance of clinical and radiological characteristics (17, 19). The radiomics-derived data are not a panacea for computerized clinical decision-support systems. Our study summarized the imperceptible distinctions of CCRCC patients’ clinic-radiological characteristics and CT radiomics features and analyzed them using a nomogram. In terms of clinical information, we chose to investigate several indicators that can be independent predictors for WHO/ISUP grade. Regarding radiological data, we concentrated on features such as necrosis, tumor microvessels, early metastasis, and tiny calcification, which may indicate a poor prognosis, and display different density and texture on CT images. Previous reports have shown that CCRCC is a highly angiogenic and vascularized tumor (31). In addition, the differences in enhancement patterns between low- and high-grade CCRCCs have been proved to correlate to the hemodynamics and microvessel density (MVD) of individual RCC lesions (32, 33). Ficarra et al. (34) validated that intratumoral necrosis as a prognostic factor is useful in the clinical management of CCRCC patients, which is recommended by the Mayo Clinic Stage, Size, Grade, and Necrosis (SSIGN) scoring system (35). Our results were consistent with former researches, as intratumoral necrosis (OR=3.00, 95% CI=1.30-6.90, p=0.049), intratumoral angiogenesis (OR=3.28, 95% CI=1.22-8.78, p=0.018), and perinephric metastasis (OR=2.90, 95% CI=1.03-8.17, p=0.044) were proved to be independent factors of high-grade CCRCC and were used to establish a clinic-radiological model.
Contrast-enhanced CT examination revealed different information as time progressed. To the best of our knowledge, features extracted from full-phase or CMP combined with NP images are the most common objects of the ML-based radiomics model to predict the Fuhrman or WHO/ISUP grade of CCRCC (19, 28, 36, 37). Huhdanpaa et al. (38) found that absolute enhancement and residual enhancement in the NP phase are both more heterogeneous for low-grade tumors. As a result, even though the predictive performance of based NP CT-based model may decline compared with that using the full-phase CT images, the effectiveness of nomogram based on NP CT images alone has been explored first for predicting the WHO/ISUP grade of CCRCC. Surprisingly, the prediction model we built reached a relatively superior performance compared to the relevant studies (AUC=0.843, 95% CI, 0.718-0.975; accuracy=0.811, sensitivity=0.727, and specificity=0.933), and this could be attributed to the comparatively large sample size and aggregation of a variety of features in our study.
To explore clinical use, further incorporating the radiomics signature, intratumoral necrosis, intratumoral angiogenesis, and perinephric metastasis, an easy-to-use CT-based radiomics nomogram was constructed, which could preoperatively distinguish high-grade from low-grade CCRCCs and facilitate personalized treatment decisions. With AUCs of 0.891 (95% CI, 0.832-0.962) and 0.843 (95% CI, 0.718-0.975) in the training and testing set, respectively, the nomogram achieved an improved predictive performance compared with the radiomics model or clinic-radiological model alone. Moreover, DCA was performed to assess the overall net benefit of the nomogram. As a result, more net benefits within the most of thresholds probabilities were achieved using the radiomics nomogram, indicating that using the nomogram may obtain a better clinical outcome in formulating therapy strategies. Therefore, the CT-based radiomics nomogram can be regarded as a promising assistive tool to preoperatively differentiate high-grade from low-grade CCRCCs.
This study is limited to several conditions. First, as a single-center retrospective study, it might be subject to inherent biases and unknown confounders that make it less generalizable to other institutions. Second, the exact tumor region deviates from manual tumor segmentation in some tiny areas, which may result in absence of necessary features in the tumor edge; as such, an automated segmentation tool with accurate tumor identification ability is highly anticipated. Third, manual tumor segmentation was time-consuming, and automatic segmentation methods should be developed in the future.
In conclusion, this study proposed and validated a CT-based radiomics nomogram that integrating with clinic-radiological predictors and radiomics signature, which demonstrated an excellent predictive ability in differentiating high-grade from low-grade CCRCCs. As a non-invasive, preoperative method, the radiomics nomogram may facilitate patient stratification and clinical decision making for the patients with CCRCC.
Data Availability Statement
The raw data supporting the conclusions of this article will be made available by the authors, without undue reservation.
Ethics Statement
The studies involving human participants were reviewed and approved by the institutional review board of the First Affiliated Hospital of Chongqing Medical University. The patient informed consent was waived for the retrospective usage of patients’ medical images.
Author Contributions
MX, YZ, and FL conceived the project. YX and YZ analysed the data and wrote the paper. YX, ZL, DL and HG collected the data. JL, XG and WH provided clinical expertise. All authors contributed to the article and approved the submitted version.
Funding
The project was funded by the Chongqing municipal health and Health Committee (CQYC2020020318).
Conflict of Interest
The authors declare that the research was conducted in the absence of any commercial or financial relationships that could be construed as a potential conflict of interest.
Publisher’s Note
All claims expressed in this article are solely those of the authors and do not necessarily represent those of their affiliated organizations, or those of the publisher, the editors and the reviewers. Any product that may be evaluated in this article, or claim that may be made by its manufacturer, is not guaranteed or endorsed by the publisher.
Acknowledgments
The authors would like to acknowledge all clinicians and technicians of radiology department, urology department and pathology department in our institution, that provided us professional advice and guidance.
Supplementary Material
The Supplementary Material for this article can be found online at: https://www.frontiersin.org/articles/10.3389/fonc.2021.712554/full#supplementary-material
References
1. Motzer R, Agarwal N, Beard C, Bolger GB, Boston B, Carducci MA, et al. NCCN Clinical Practice Guidelines in Oncology: Kidney Cancer. J Natl Compr Cancer Network JNCCN (2009) 7:618–30. doi: 10.6004/jnccn.2009.0043
2. Xing T, He H. Epigenomics of Clear Cell Renal Cell Carcinoma: Mechanisms and Potential Use in Molecular Pathology. Chin J Cancer Res = Chung-Kuo Yen Cheng Yen Chiu (2016) 28:80–91. doi: 10.3978/j.issn.1000-9604.2016.02.09
3. Reuter V. The Pathology of Renal Epithelial Neoplasms. Semin Oncol (2006) 33:534–43. doi: 10.1053/j.seminoncol.2006.06.009
4. Ljungberg B, Albiges L, Abu-Ghanem Y, Bensalah K, Dabestani S, Fernández-Pello S, et al. European Association of Urology Guidelines on Renal Cell Carcinoma: The 2019 Update. Eur Urol (2019) 75:799–810. doi: 10.1016/j.eururo.2019.02.011
5. Znaor A, Lortet-Tieulent J, Laversanne M, Jemal A, Bray F. International Variations and Trends in Renal Cell Carcinoma Incidence and Mortality. Eur Urol (2015) 67:519–30. doi: 10.1016/j.eururo.2014.10.002
6. Leibovich B, Lohse CM, Crispen PL, Boorjian SA, Thompson RH, Blute ML, et al. Histological Subtype Is an Independent Predictor of Outcome for Patients With Renal Cell Carcinoma. J Urol (2010) 183:1309–15. doi: 10.1016/j.juro.2009.12.035
7. Dagher J, Delahunt B, Rioux-Leclercq N, Egevad L, Srigley JR, Coughlin G, et al. Clear Cell Renal Cell Carcinoma: Validation of World Health Organization/International Society of Urological Pathology Grading. Histopathology (2017) 71:918–25. doi: 10.1111/his.13311
8. Moch H, Cubilla A, Humphrey P, Reuter V, Ulbright T. The 2016 WHO Classification of Tumours of the Urinary System and Male Genital Organs-Part A: Renal, Penile, and Testicular Tumours. Eur Urol (2016) 70:93–105. doi: 10.1016/j.eururo.2016.02.029
9. Leveridge M, Finelli A, Kachura JR, Evans A, Chung H, Shiff DA, et al. Outcomes of Small Renal Mass Needle Core Biopsy, Nondiagnostic Percutaneous Biopsy, and the Role of Repeat Biopsy. Eur Urol (2011) 60:578–84. doi: 10.1016/j.eururo.2011.06.021
10. Orlhac F, Frouin F, Nioche C, Ayache N, Buvat I. Validation of A Method to Compensate Multicenter Effects Affecting CT Radiomics. Radiology (2019) 291:53–9. doi: 10.1148/radiol.2019182023
11. Lambin P, Rios-Velazquez E, Leijenaar R, Carvalho S, van Stiphout RGPM, Granton P, et al. Radiomics: Extracting More Information From Medical Images Using Advanced Feature Analysis. Eur J Cancer (Oxford Engl 1990) (2012) 48:441–6. doi: 10.1016/j.ejca.2011.11.036
12. Dong D, Zhang F, Zhong L-Z, Fang M-J, Huang C-L, Yao J-J, et al. Development and Validation of a Novel MR Imaging Predictor of Response to Induction Chemotherapy in Locoregionally Advanced Nasopharyngeal Cancer: A Randomized Controlled Trial Substudy (NCT01245959). BMC Med (2019) 17:190. doi: 10.1186/s12916-019-1422-6
13. Lambin P, Leijenaar RTH, Deist TM, Peerlings J, de Jong EEC, van Timmeren J, et al. Radiomics: The Bridge Between Medical Imaging and Personalized Medicine. Nat Rev Clin Oncol (2017) 14:749–62. doi: 10.1038/nrclinonc.2017.141
14. Shu J, Tang Y, Cui J, Yang R, Meng X, Cai Z, et al. Clear Cell Renal Cell Carcinoma: CT-Based Radiomics Features for the Prediction of Fuhrman Grade. Eur J Radiol (2018) 109:8–12. doi: 10.1016/j.ejrad.2018.10.005
15. Shu J, Wen D, Xi Y, Xia Y, Cai Z, Xu W, et al. Clear Cell Renal Cell Carcinoma: Machine Learning-Based Computed Tomography Radiomics Analysis for the Prediction of WHO/ISUP Grade. Eur J Radiol (2019) 121:108738. doi: 10.1016/j.ejrad.2019.108738
16. Scrima A, Lubner MG, Abel EJ, Havighurst TC, Shapiro DD, Huang W, et al. Texture Analysis of Small Renal Cell Carcinomas at MDCT for Predicting Relevant Histologic and Protein Biomarkers. Abdominal Radiol (New York) (2019) 44:1999–2008. doi: 10.1007/s00261-018-1649-2
17. Lai S, Sun L, Wu J, Wei R, Luo S, Ding W, et al. Multiphase Contrast-Enhanced CT-Based Machine Learning Models to Predict the Fuhrman Nuclear Grade of Clear Cell Renal Cell Carcinoma. Cancer Manage Res (2021) 13:999–1008. doi: 10.2147/cmar.S290327
18. Coy H, Young JR, Douek ML, Pantuck A, Brown MS, Sayre J, et al. Association of Qualitative and Quantitative Imaging Features on Multiphasic Multidetector CT With Tumor Grade in Clear Cell Renal Cell Carcinoma. Abdominal Radiol (New York) (2019) 44:180–9. doi: 10.1007/s00261-018-1688-8
19. Moldovanu C, Boca B, Lebovici A, Tamas-Szora A, Feier DS, Crisan N, et al. Preoperative Predicting the WHO/ISUP Nuclear Grade of Clear Cell Renal Cell Carcinoma by Computed Tomography-Based Radiomics Features. J Pers Med (2020) 11(1):8. doi: 10.3390/jpm11010008
20. Cotta B, Meagher MF, Bradshaw A, Ryan ST, Rivera-Sanfeliz G, Derweesh IH. Percutaneous Renal Mass Biopsy: Historical Perspective, Current Status, and Future Considerations. Expert Rev Anticancer Ther (2019) 19:301–8. doi: 10.1080/14737140.2019.1571915
21. Marconi L, Dabestani S, Lam TB, Hofmann F, Stewart F, Norrie J. Systematic Review and Meta-Analysis of Diagnostic Accuracy of Percutaneous Renal Tumour Biopsy. Eur Urol (2016) 69:660–73. doi: 10.1016/j.eururo.2015.07.072
22. Wei J, Zhao J, Zhang X, Wang D, Zhang W, Wang Z. Analysis of Dual Energy Spectral CT and Pathological Grading of Clear Cell Renal Cell Carcinoma (ccRCC). PloS One (2018) 13:e0195699. doi: 10.1371/journal.pone.0195699
23. Moran K. Can MRI be Used to Diagnose Histologic Grade in T1a (< 4 Cm) Clear Cell Renal Cell Carcinomas? Abdominal Radiol (New York) (2019) 44:2841–51. doi: 10.1007/s00261-019-02018-y
24. Wang S, Li J, Zhu D, Hua T, Zhao B. Contrast-Enhanced Magnetic Resonance (MR) T1 Mapping With Low-Dose Gadolinium-Diethylenetriamine Pentaacetic Acid (Gd-DTPA) Is Promising in Identifying Clear Cell Renal Cell Carcinoma Histopathological Grade and Differentiating Fat-Poor Angiomyolipoma. QuanT Imaging Med Surg (2020) 10:988–98. doi: 10.21037/qims-19-723
25. Bian Y, Jiang H, Ma C, Wang L, Zheng J, Jin G, et al. CT-Based Radiomics Score for Distinguishing Between Grade 1 and Grade 2 Nonfunctioning Pancreatic Neuroendocrine Tumors. AJR Am J Roentgenol (2020) 215:852–63. doi: 10.2214/ajr.19.22123
26. Zhang G, Xu L, Zhao L, Mao L, Li X, Jin Z. CT-Based Radiomics to Predict the Pathological Grade of Bladder Cancer. Eur Radiol (2020) 30:6749–56. doi: 10.1007/s00330-020-06893-8
27. Ye J, Luo J, Xu S, Wu W. One-Slice CT Image Based Kernelized Radiomics Model for the Prediction of Low/Mid-Grade and High-Grade HNSCC. Comput Med Imaging Graphics Off J Comput Med Imaging Soc (2020) 80:101675. doi: 10.1016/j.compmedimag.2019.101675
28. Zhou H, Mao H, Dong D, Fang M, Gu D, Liu X. Development and External Validation of Radiomics Approach for Nuclear Grading in Clear Cell Renal Cell Carcinoma. Ann Surg Oncol (2020) 27:4057–65. doi: 10.1245/s10434-020-08255-6
29. Han D, Yu Y, Yu N, Dang S, Wu H, Jialiang R, et al. Prediction Models for Clear Cell Renal Cell Carcinoma ISUP/WHO Grade: Comparison Between CT Radiomics and Conventional Contrast-Enhanced CT. Br J Radiol (2020) 93:20200131. doi: 10.1259/bjr.20200131
30. Zheng Z, Chen Z, Xie Y, Zhong Q, Xie W. Development and Validation of a CT-Based Nomogram for Preoperative Prediction of Clear Cell Renal Cell Carcinoma Grades. Eur Radiol (2021) 31:6078–86. doi: 10.1007/s00330-020-07667-y
31. Shinagare A, Krajewski K, Braschi-Amirfarzan M, Ramaiya N. Advanced Renal Cell Carcinoma: Role of the Radiologist in the Era of Precision Medicine. Radiology (2017) 284:333–51. doi: 10.1148/radiol.2017160343
32. Coy H, Young JR, Pantuck AJ, Douek ML, Sisk A, Magyar C, et al. Association of Tumor Grade, Enhancement on Multiphasic CT and Microvessel Density in Patients With Clear Cell Renal Cell Carcinoma. Abdominal Radiol (New York) (2020) 45:3184–92. doi: 10.1007/s00261-019-02271-1
33. Villalobos-Gollás M, Aguilar-Davidov B, Culebro-García C, Gómez-Alvarado MO, Rojas-Garcia P, Ibarra-Fombona R, et al. Pathological Implications of Areas of Lower Enhancement on Contrast-Enhanced Computed Tomography in Renal-Cell Carcinoma: Additional Information for Selecting Candidates for Surveillance Protocols. Int Urol Nephrol (2012) 44:1369–74. doi: 10.1007/s11255-012-0199-8
34. Ficarra V, Novara G, Galfano A, Brunelli M, Cavalleri S, Martignoni G, et al. The 'Stage, Size, Grade and Necrosis' Score Is More Accurate Than the University of California Los Angeles Integrated Staging System for Predicting Cancer-Specific Survival in Patients With Clear Cell Renal Cell Carcinoma. BJU Int (2009) 103:165–70. doi: 10.1111/j.1464-410X.2008.07901.x
35. Frank I, Blute ML, Cheville JC, Lohse CM, Weaver AL, Zincke H. An Outcome Prediction Model for Patients With Clear Cell Renal Cell Carcinoma Treated With Radical Nephrectomy Based on Tumor Stage, Size, Grade and Necrosis: The SSIGN Score. J Urol (2002) 168(6):2395–400. doi: 10.1097/01.ju.0000035885.91935.d5
36. Luo S, Wei R, Lu S, Lai S, Wu J, Wu Z, et al. Fuhrman Nuclear Grade Prediction of Clear Cell Renal Cell Carcinoma: Influence of Volume of Interest Delineation Strategies on Machine Learning-Based Dynamic Enhanced CT Radiomics Analysis. Eur Radiol (2021). doi: 10.1007/s00330-021-08322-w
37. Wang R, Hu Z, Shen X, Wang Q, Zhang L, Wang M, et al. Computed Tomography-Based Radiomics Model for Predicting the WHO/ISUP Grade of Clear Cell Renal Cell Carcinoma Preoperatively: A Multicenter Study. Front Oncol (2021) 11:543854. doi: 10.3389/fonc.2021.543854
Keywords: radiomics nomogram, computed tomography, clear cell renal cell carcinoma, WHO/ISUP grading, prediction model
Citation: Xv Y, Lv F, Guo H, Liu Z, Luo D, Liu J, Gou X, He W, Xiao M and Zheng Y (2021) A CT-Based Radiomics Nomogram Integrated With Clinic-Radiological Features for Preoperatively Predicting WHO/ISUP Grade of Clear Cell Renal Cell Carcinoma. Front. Oncol. 11:712554. doi: 10.3389/fonc.2021.712554
Received: 20 May 2021; Accepted: 02 November 2021;
Published: 03 December 2021.
Edited by:
Sebastian Cerdan, Autonomous University of Madrid, SpainReviewed by:
Zhongqiu Wang, Affiliated Hospital of Nanjing University of Chinese Medicine, ChinaAlbert Guvenis, Boğaziçi University, Turkey
Giuseppe Simone, Regina Elena National Cancer Institute (IRCCS), Italy
Copyright © 2021 Xv, Lv, Guo, Liu, Luo, Liu, Gou, He, Xiao and Zheng. This is an open-access article distributed under the terms of the Creative Commons Attribution License (CC BY). The use, distribution or reproduction in other forums is permitted, provided the original author(s) and the copyright owner(s) are credited and that the original publication in this journal is cited, in accordance with accepted academic practice. No use, distribution or reproduction is permitted which does not comply with these terms.
*Correspondence: Mingzhao Xiao, xmz.2004@163.com; Yineng Zheng, yinengzheng@cqmu.edu.cn
†These authors have contributed equally to this work