 Wei Han
 Yi-Zhu Wu
 Xiao-Yu Zhao1,2*
- 1Department of Burn and Plastic Surgery, The First Affiliated Hospital of Soochow University, Suzhou, China
- 2Department of Surgery, Soochow University, Suzhou, China
- 3Department of Burn and Plastic Surgery, Affiliated Hospital 2 of Nantong University, The First People’s Hospital of Nantong, Nantong, China
Background: Minichromosome maintenance (MCM) is known for participating in cell cycle progression, as well as DNA replication. While the diverse expression patterns and prognostic values of MCMs in melanoma still remained unclear.
Methods: In the present study, the transcriptional and clinical profiles of MCMs were explored in patients with melanoma from multiple databases, including GEO, TCGA, ONCOMINE, GEPIA, UALCAN, cBioPortal, and TIMER databases.
Results: We found that the elevated expressions of MCM2–6 and MCM10 were significantly expressed in melanoma compared to normal skin. High mRNA levels of MCM4, MCM5, and MCM10 were closely related to worse prognosis in patients with melanoma. GSEA showed hallmark pathways were most involved in mTORC1 signaling, G2M checkpoint, E2F targets, and mitotic spindle. Furthermore, we found potential correlations between the MCM expression and the immune cell infiltration, including B cells, CD4+ T cells, CD8+ T cells, neutrophils, macrophages, and dendritic cells.
Conclusion: Upregulated MCM gene expression in melanoma probably played a crucial part in the development and progression of melanoma. The upregulated MCM4/5/10 expressions could be used as potential prognostic markers to improve the poor outcome and prognostic accuracy in patients with melanoma. Our study might shed light on the selection of prognostic biomarkers as well as the underlying molecular pathogenesis of melanoma.
Introduction
Skin cutaneous melanoma (SKCM) is one of the most life-threatening skin malignancies. It accounts for approximately 80% of yearly deaths among patients with skin cancers worldwide (1). Formation of banal nevi, dysplastic nevi, melanoma in situ, and invasive melanoma are the four steps of the progression from melanocytes to SKCM (2). Surgical resection is the preferred treatment for primary melanoma, and metastatic melanoma is not sensitive to chemotherapy or radiotherapy (3). Immunotherapy has greatly improved in recent years and has been used to treat patients with SKCM. For example, immune checkpoint inhibitors that target programmed death ligand 1 (PD-L1) have been used, but such treatments benefit only a small number of patients with SKCM (4, 5). Therefore, early diagnosis of melanoma and identification of biomarkers are essential for effective and rapid intervention and treatment of patients with melanoma.
Genes that encode minichromosome maintenance proteins (MCMs) were originally found in Saccharomyces cerevisiae, which could be used to detect proteins that participate in plasmid maintenance in the cell cycle process (6). MCM2–10 are highly conserved members of the MCM family. MCMs are crucial participants in the initiation and elongation of DNA replication and are considered to be potential indicators of cell proliferation (7). Because of their significant roles in DNA replication, MCMs are useful tools for diagnosis and prognosis prediction of tumors (8). MCM1 (also known as SRF) is a transcription factor that is also required for minichromosome maintenance (9). Some members of the MCM gene family have been shown to be aberrantly highly expressed in multiple human malignancies, and upregulation of these genes contributes to tumor cell progression and prognosis prediction in patients with tumors (8, 10). However, comprehensive analysis of the clinical characteristics of MCMs in patients with SKCM has rarely been reported, and further exploration of their characteristics is still needed. In this study, we performed bioinformatics analysis to explore the expression patterns and prognostic significance of MCMs in patients with SKCM.
Methods
Gene Expression Profiling Interactive Analysis (GEPIA) Database
GEPIA (http://gepia.cancer-pku.cn/) could provide users with customizable and quick functionalities based on data from the Cancer Genome Atlas (TCGA; https://tcga-data.nci.nih.gov/tcga/) and the Genotype-Tissue Expression project (GTEx; https://www.gtexportal.org/home/index.html) (11). One-way ANOVA is applied when differential analysis is performed. Tumor stage or disease state is used as variables to calculate differential expressions. In addition, survival analyses based on gene expression levels can also be performed using a log-rank test by using the GEPIA. In our study, GEPIA is used to show the differential expressions and survival analyses of MCMs graphically among all TCGA cancers, as well as the correlations between tumor stages of SKCM patients and the expressions of MCMs.
Oncomine Database
Oncomine online database (http://www.oncomine.com) is used to investigate the mRNA expressions of MCMs among 20 common tumors (12). Differential expressions of MCMs were selected by using the cut-off criteria: p = 0.01 (Student’s t-test), fold change = 1.5, and differentially expressed gene rank ≤10%.
UALCAN
To analyze MCM expression in SKCM patients with different sample types, further UALCAN database analyses were performed as well (13). In the UALCAN analysis page, the TCGA dataset was defined as “skin cutaneous melanoma” for MCM expression analysis. The MCM expressions based on different sample types were analyzed.
Statistical Analysis
Next, GraphPad Prism (version 8.0) was used to analyze and show the phenotype and transcriptional expression profiles in SKCM patients. The T1-2 and T3-4 among MCMs in melanoma from TCGA patients were compared, and p < 0.05 was considered of statistical significance.
The Human Protein Atlas Database
The Human Protein Atlas database (https://www.proteinatlas.org/) is used to explore the immunohistochemistry (IHC)‐based protein expression profiles in normal tissues, different neoplasms, and cell lines (14). MCM protein expression IHC images in normal skin tissues as well as in clinical specimens of SKCM patients were downloaded from this database.
cBioPortal for Cancer Genomics Dataset
The cBioPortal (http://cbioportal.org) could help users search for multidimensional cancer genomics datasets and obtain the data for over 5,000 tumor samples from more than 20 cancer studies (15). Thus, we used cBioPortal database to analyze MCM mutations in SKCM. In the current study, we analyzed the genomic alteration types and alteration frequency in SKCM by using cBioPortal, including mRNA upregulation, copy number amplification, deep deletion, and missense mutation with unknown significance.
STRING Database
In this study, we used STRING (http://string-db.org; version 11.0) to show the protein co-regulation of MCMs and describe functional interactions among nodes (16). The interaction specificity score >0.4 (the default threshold in the STRING database) was considered statistically significant.
The Database for Annotation, Visualization and Integrated Discovery (DAVID)
DAVID (https://david.ncifcrf.gov/) is an efficient online tool that can provide users with systematic and integrative functional annotations and help them explore biological meanings of target genes. Thus, it was applied to perform functional annotations and pathway enrichment analyses in this study. The biological process (BP), cellular component (CC), and molecular function (MF) are included in the gene ontology (GO) analyses, and Kyoto Encyclopedia of Genes and Genomes (KEGG) pathway enrichment analyses were performed for MCMs by DAVID (17, 18), visualized in the bubble charts. P-value <0.05 was considered of statistical significance.
Cytoscape Software
ClueGO (version 2.5.3) of Cytoscape is a plug-in to analyze the GO and KEGG functional enrichment based on target genes (19). Thus, ClueGO was used to show and plot the GO (BP, CC, MF) and KEGG analyses.
Gene Set Enrichment Analysis (GSEA)
GSEA tool (version 2.10.1) is a useful tool that can be utilized to detect the up- and downregulated genes, as well as the significantly changed pathways according to the expression data from the TCGA database (20). Student’s t-test statistical score is conducted in consistent pathways, and the mean of the differentially expressed genes is calculated in each separate analysis. The significantly involved hallmark pathways was identified by using a permutation test with 1,000 times. The adj. P using Benjamini and Hochberg (BH) and false discovery rate (FDR) method by default is applied to correct for the occurrence of false-positive results. An adj. P < 0.01 and FDR < 0.25 are considered to define the significantly involved genes.
Tumor Immune Estimation Resource (TIMER) Database
TIMER (https://cistrome.shinyapps.io/timer/) is a straightforward website that provides a systematical analysis of immune infiltrates in various tumors (21). TIMER algorithm can estimate the abundances of six immune infiltrate (B cells, CD8+ T cells, CD4+ T cells, Neutrophils, Macrophages, and Dendritic cells). In this study, TIMER was conducted to perform a comprehensive correlation analysis between MCMs and tumor-infiltrating immune cell signatures.
Results
Expression Pattern and Survival Analysis of MCMs in Pan-Cancer Perspective
As shown in Figure 1A, MCMs were mostly overexpressed in many cancer types by using the Oncomine database. In melanoma, upregulation of all MCMs was observed in cancer tissues, except MCM1/2/8, which may be due to the limited samples. Transcriptional expression of MCMs in SKCM is analyzed and displayed in Table 1. MCM3 and MCM4 overexpression were present in Talantov’s datasets (22) and Haqq’s datasets (23). In Riker’s dataset, the transcription levels of MCM5 and MCM6 in melanoma are higher than those in normal skin tissues, and those fold changes are 2.119 and 2.392 (24). MCM7 is significantly upregulated in benign melanocytic skin nevus, with fold changes of 8.786 in Talantov’s dataset (22). The overexpression of MCM9 and MCM10 was observed in Haqq’s datasets (23) and Talantov’s datasets (22), respectively. Then, Kaplan-Meier curve, as well as log-rank test analyses, weas applied to show the overall survival (OS). Results are graphically demonstrated in Figure 1B, and there was an apparent heterogeneity between different types of tumors. Three members of MCMs were greatly related to OS in SKCM patients.
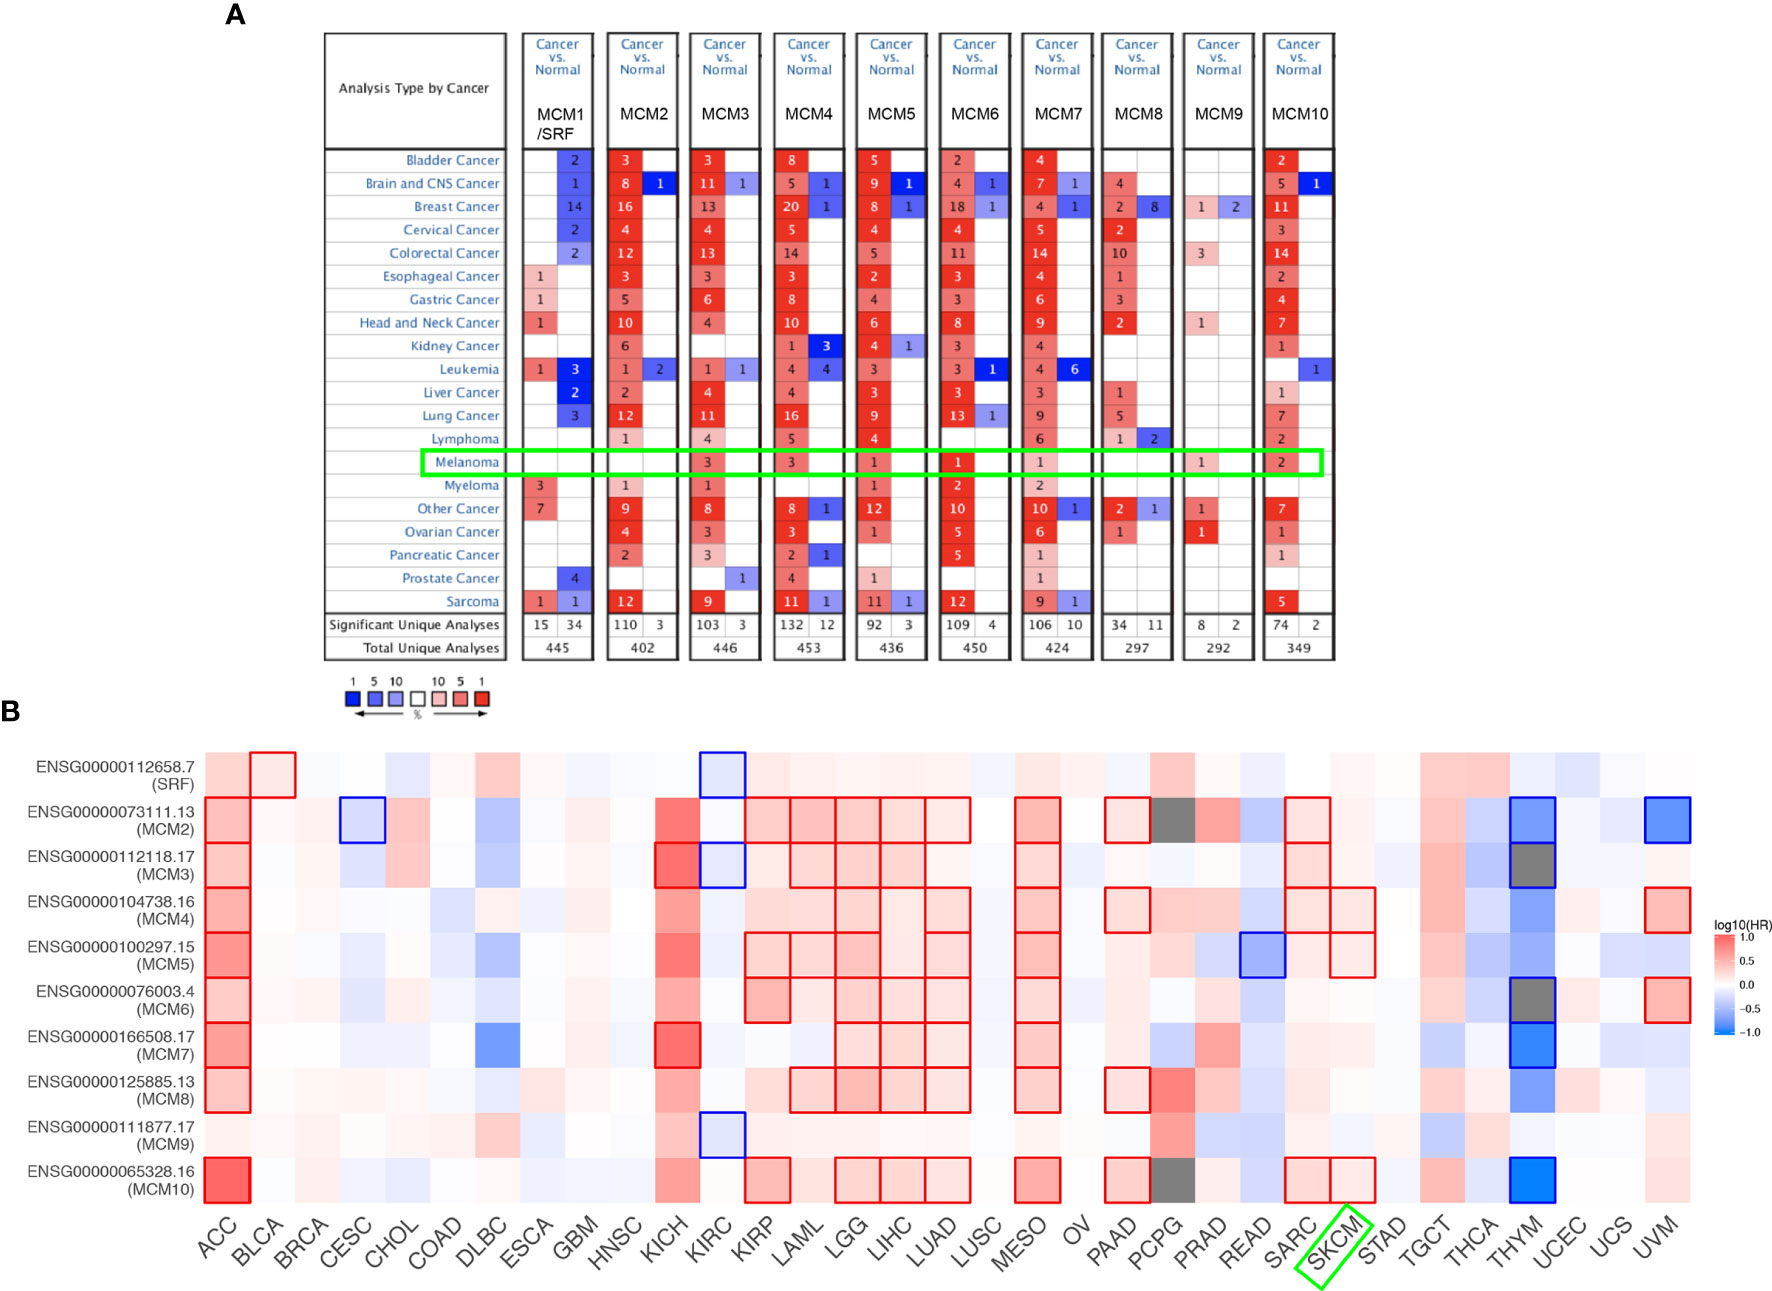
Figure 1 Expression level and survival analysis of MCMs by ONCOMINE and GEPIA. (A) The figure shows the numbers of datasets with statistically significant mRNA overexpression (red) or downregulated expression (blue) of MCMs. (B) Summary of hazard ratios (HR) illustrating cancer-MCM pairs with altered prognosis. ACC, Adrenocortical Carcinoma; BLCA, Bladder Urothelial Carcinoma; BRCA, Breast Invasive Carcinoma; CESC, Cervical Squamous Cell Carcinoma and Endocervical Adenocarcinoma; CHOL, Cholangiocarcinoma; COAD, Colon Adenocarcinoma; DLBC, Lymphoid Neoplasm Diffuse Large B-cell Lymphoma; ESCA, Esophageal Carcinoma; HNSC, Head and Neck Squamous Cell Carcinoma; KICH, Kidney Chromophobe; KIRC, Kidney Renal Clear Cell Carcinoma; KIRP, Kidney Renal Papillary Cell Carcinoma; LAML, Acute Myeloid Leukemia; LGG, Brain Lower Grade Glioma; LIHC, Liver Hepatocellular Carcinoma; LUAD, Lung Adenocarcinoma; LUSC, Lung Squamous Cell Carcinoma; MESO, Mesothelioma; OV, Ovarian Serous Cystadenocarcinoma; PAAD, Pancreatic Adenocarcinoma; PCPG, Pheochromocytoma and Paraganglioma; PRAD, Prostate Adenocarcinoma; READ, Rectum Adenocarcinoma; SARC, Sarcoma; SKCM, Skin Cutaneous Melanoma; STAD, Stomach Adenocarcinoma; TGCT, Testicular Germ Cell Tumors; THCA, Thyroid carcinoma; THYM, Thymoma; UCEC, Uterine Corpus Endometrial Carcinoma; UCS, Uterine Carcinosarcoma; UVM, Uveal Melanoma.
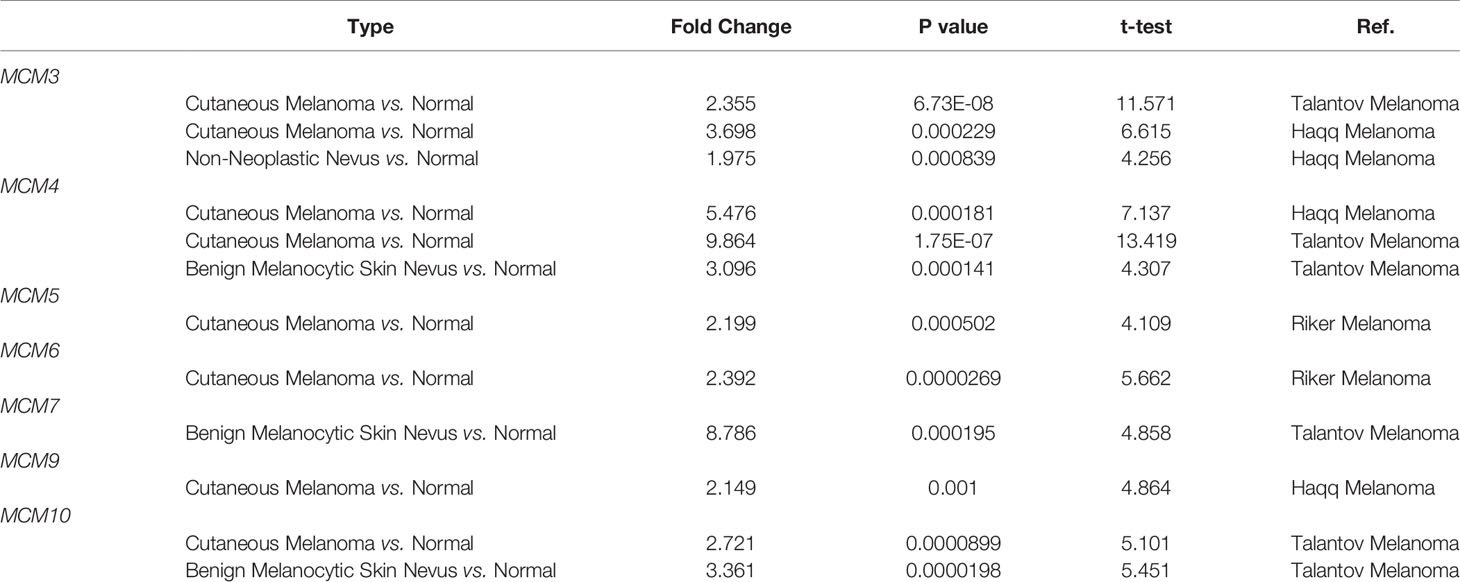
Table 1 Comparison of mRNA expression of MCMs in melanoma and normal skin tissues from the Oncomine database.
Transcriptional Levels of MCMs in Patients With SKCM
Except for MCM9, GEPIA analyses showed that MCM1-8 and MCM10 were overexpressed in SKCM than in normal skin (Figure 2), although statistically significant differences were observed for MCM2–6 and MCM10 only. Furthermore, the expression level of MCMs between primary and metastatic melanoma was also compared in this study. Except for MCM7, MCM1–6 and MCM8–10 were all highly expressed in metastatic melanoma than in primary melanoma in the TCGA cohort (P < 0.05) (Figure 3).

Figure 2 Transcriptional expression of distinct MCM family members in TCGA cohort. (A–J) Except for MCM9, GEPIA analyses showed that MCM1–8 and MCM10 were overexpressed in SKCM than in normal skin, although statistically significant differences were observed for MCM2–6 and MCM10 only (*p < 0.05).
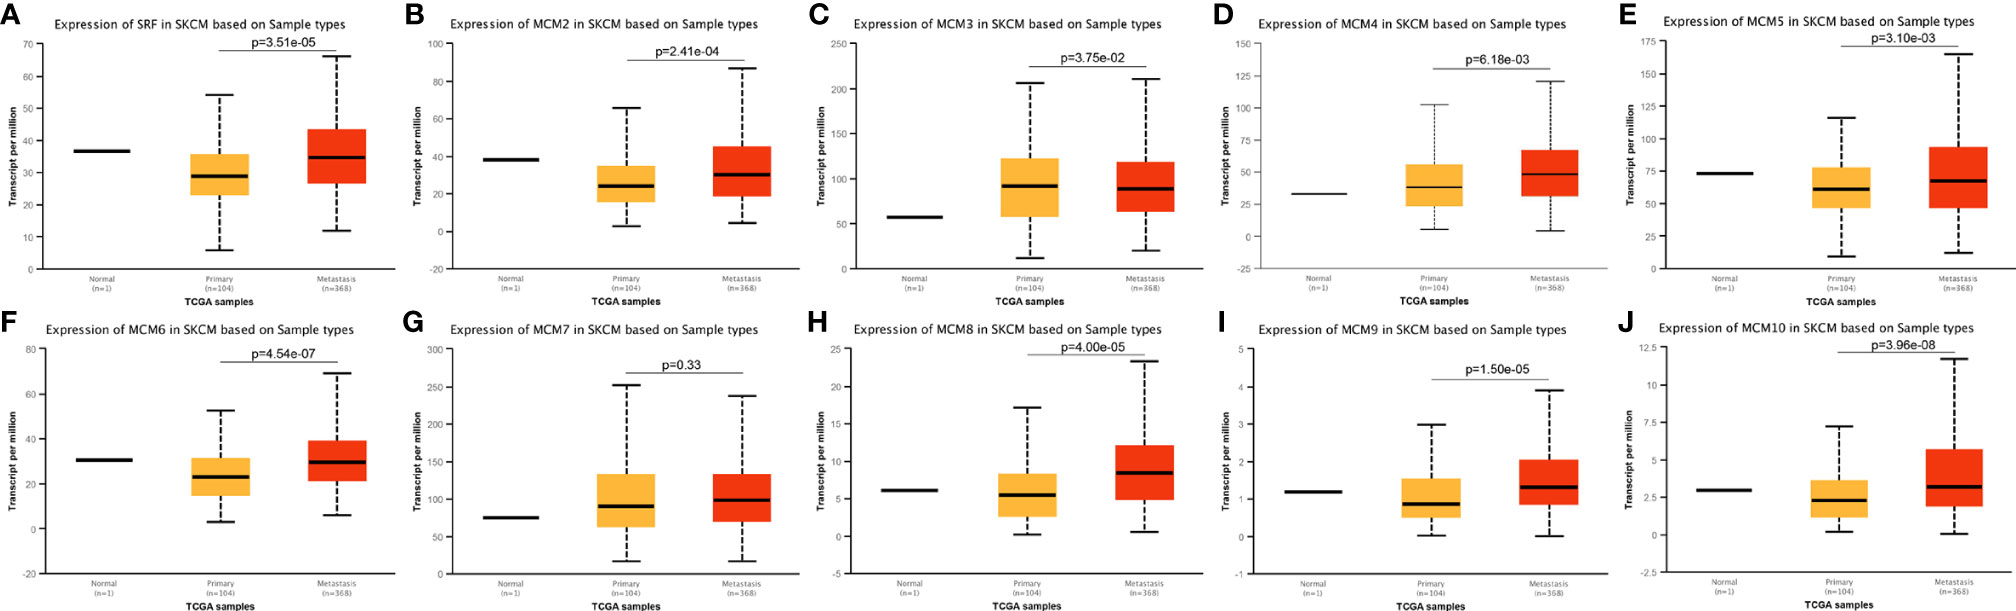
Figure 3 Transcriptional expression of MCMs in different sample types of melanoma. (A–J) Except MCM7, MCM1–6 and MCM8–10 were all overexpressed in metastatic melanoma than in primary melanoma in the TCGA cohort (p < 0.05).
Relationship Between the Clinicopathological Parameters of SKCM Patients and the mRNA Levels of MCMs
Next, we analyzed the expressions of MCMs with tumor stages for SKCM by GEPIA. MCM2, MCM3, MCM6, MCM8, MCM9, and MCM10 groups significantly varied and associated with the tumor stages (Figure 4). In addition, expression patterns of MCM2, MCM6, MCM8, MCM9, and MCM10 were greatly related to the T stage (T1-T2 vs T3-T4) (Figure 5).
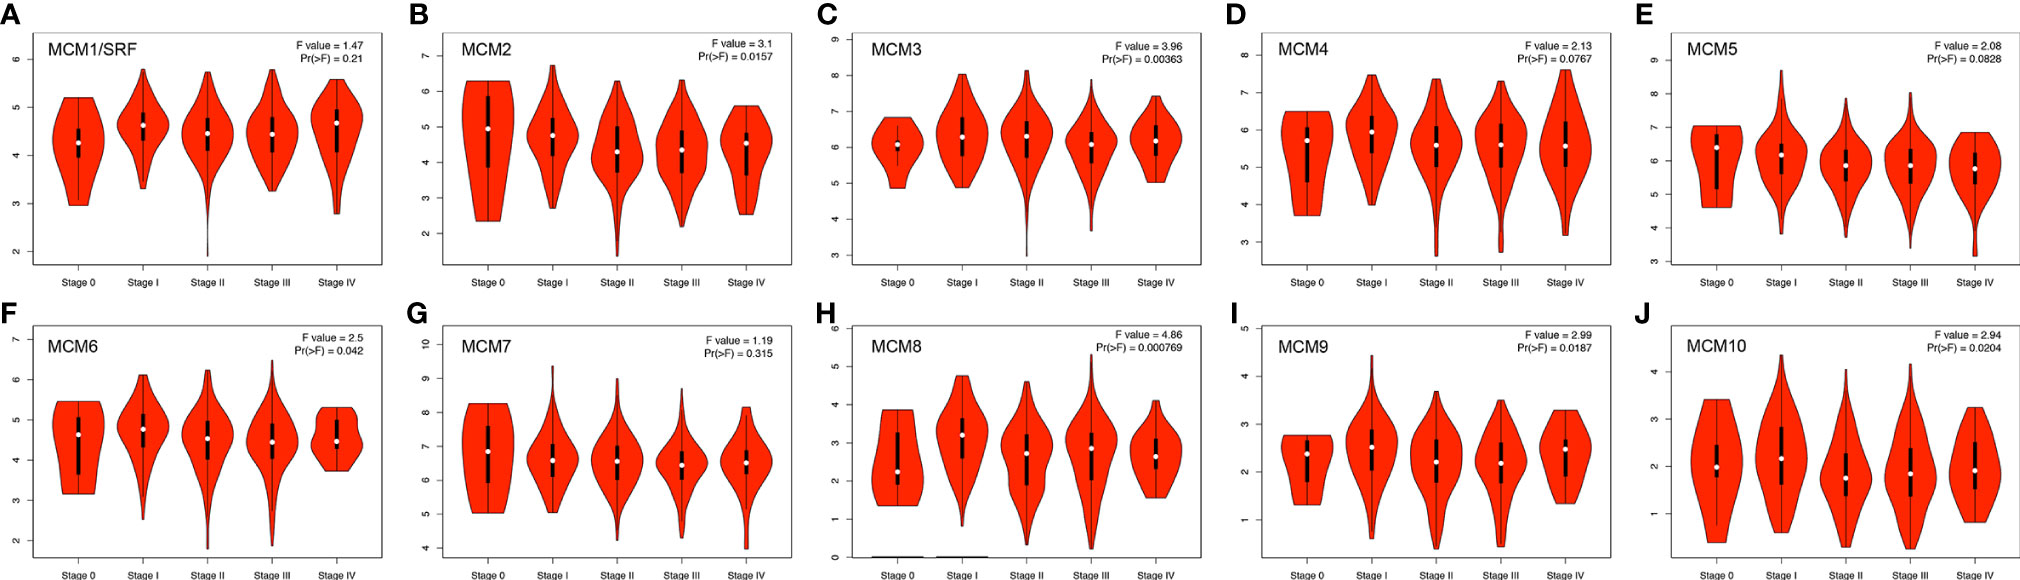
Figure 4 (A–J) Correlation between MCM expression and tumor stage in SKCM patients (GEPIA). MCM2, MCM3, MCM6, MCM8, MCM9, and MCM10 groups significantly varied and associated with the tumor stages.
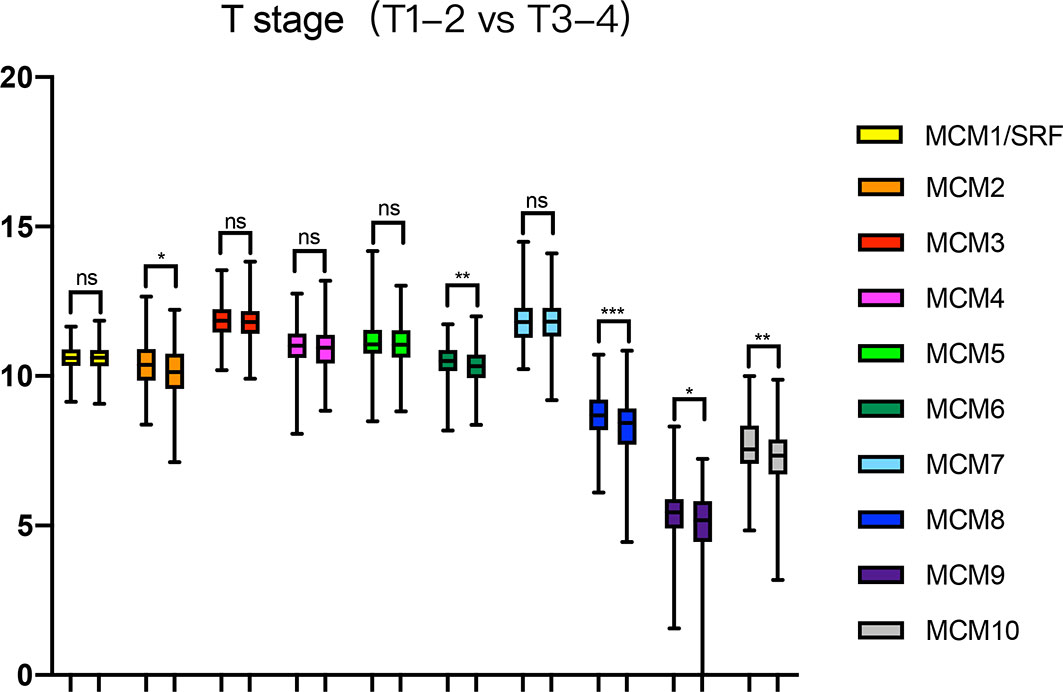
Figure 5 Relationship between transcriptional expressions of distinct MCM family members and T stage of SKCM patients. MCM2/6/8/9/10 showed significant correlations with T stages in SKCM patients (ns, no significance; *p < 0.05, **p < 0.01, ***p < 0.001).
Relationship Between the Survival Outcomes of SKCM Patients and the mRNA Levels of MCMs
Then, GEPIA was applied to show the prognostic value of MCMs in SKCM patients, as well as the correlation between survival status of SKCM patients and MCM mRNA expression. Results indicated that the higher expressions of MCM4, MCM5, and MCM10 were significantly associated with the worse OS in SKCM patients (Figure 6).
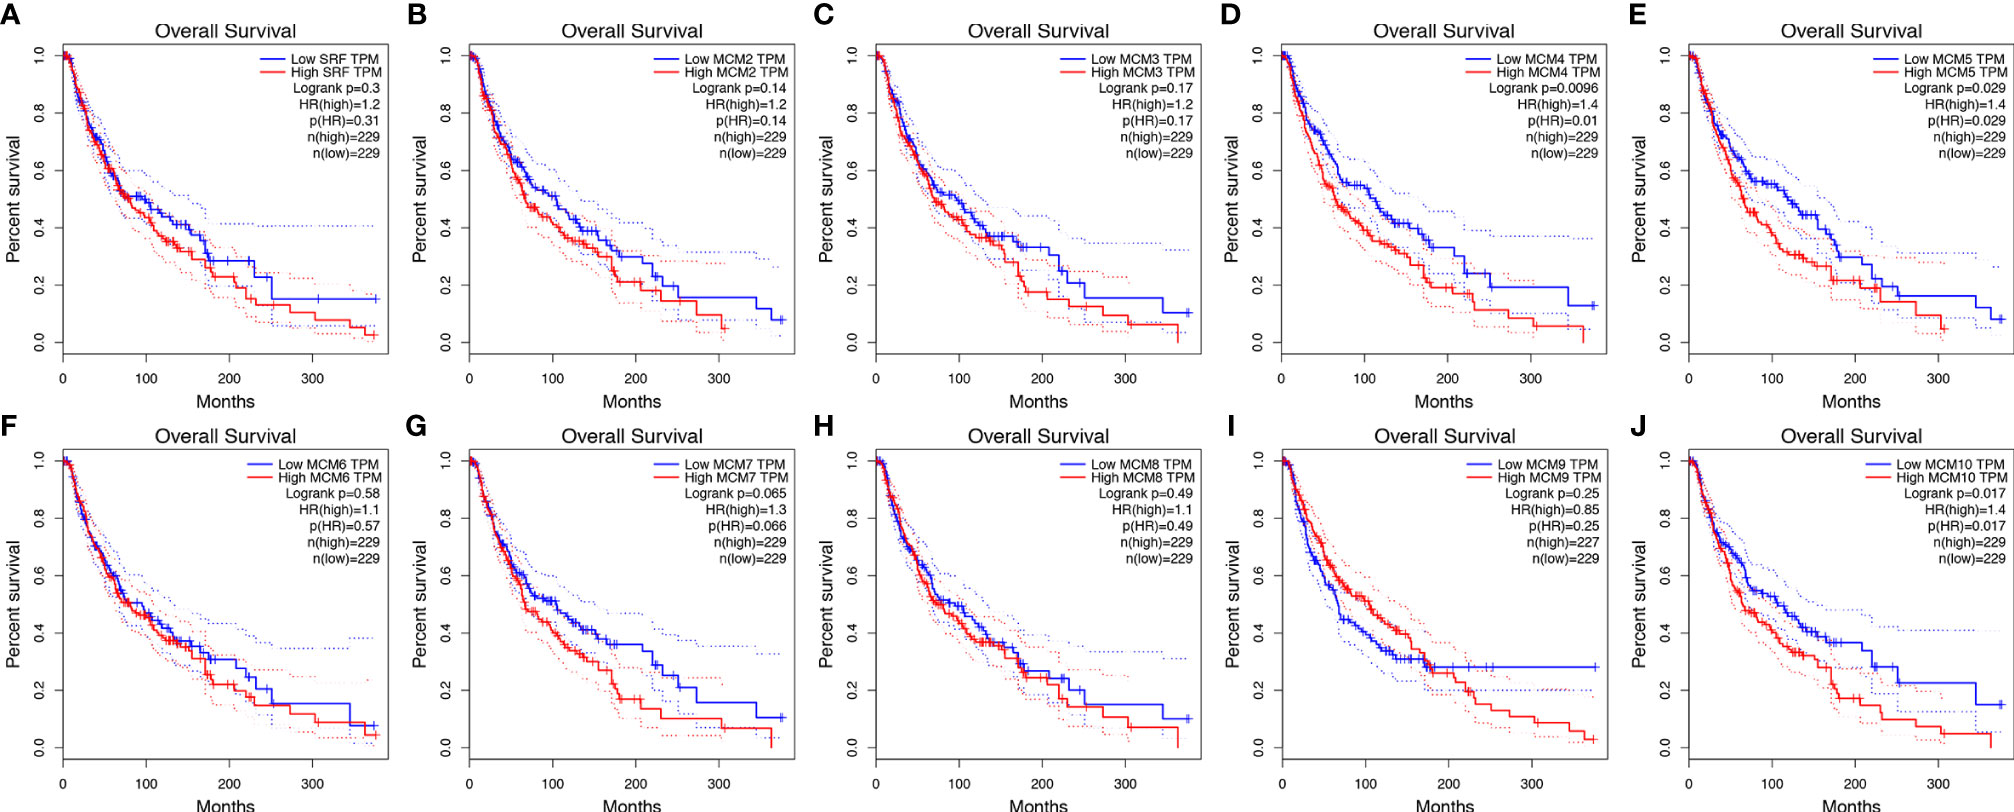
Figure 6 (A–J) Kaplan-Meier survival analyses on differential MCM expression groups with OS in the TCGA SKCM patients. High expression of MCM4/5/10 were significantly correlated with poor OS.
Protein Expression Levels of MCMs in Patients With SKCM
Furthermore, IHC staining images for the MCM proteins in both normal skin tissues and melanoma were downloaded from the Human Protein Atlas database to investigate the differentially expressed MCM proteins in melanoma tissues (Figure 7). The results revealed MCM1–7 protein levels were higher in melanoma tissues than in normal skin tissues, consistent with the results of MCM mRNA expression, whereas MCM9 and MCM10 proteins showed no great difference between melanoma and normal skin.
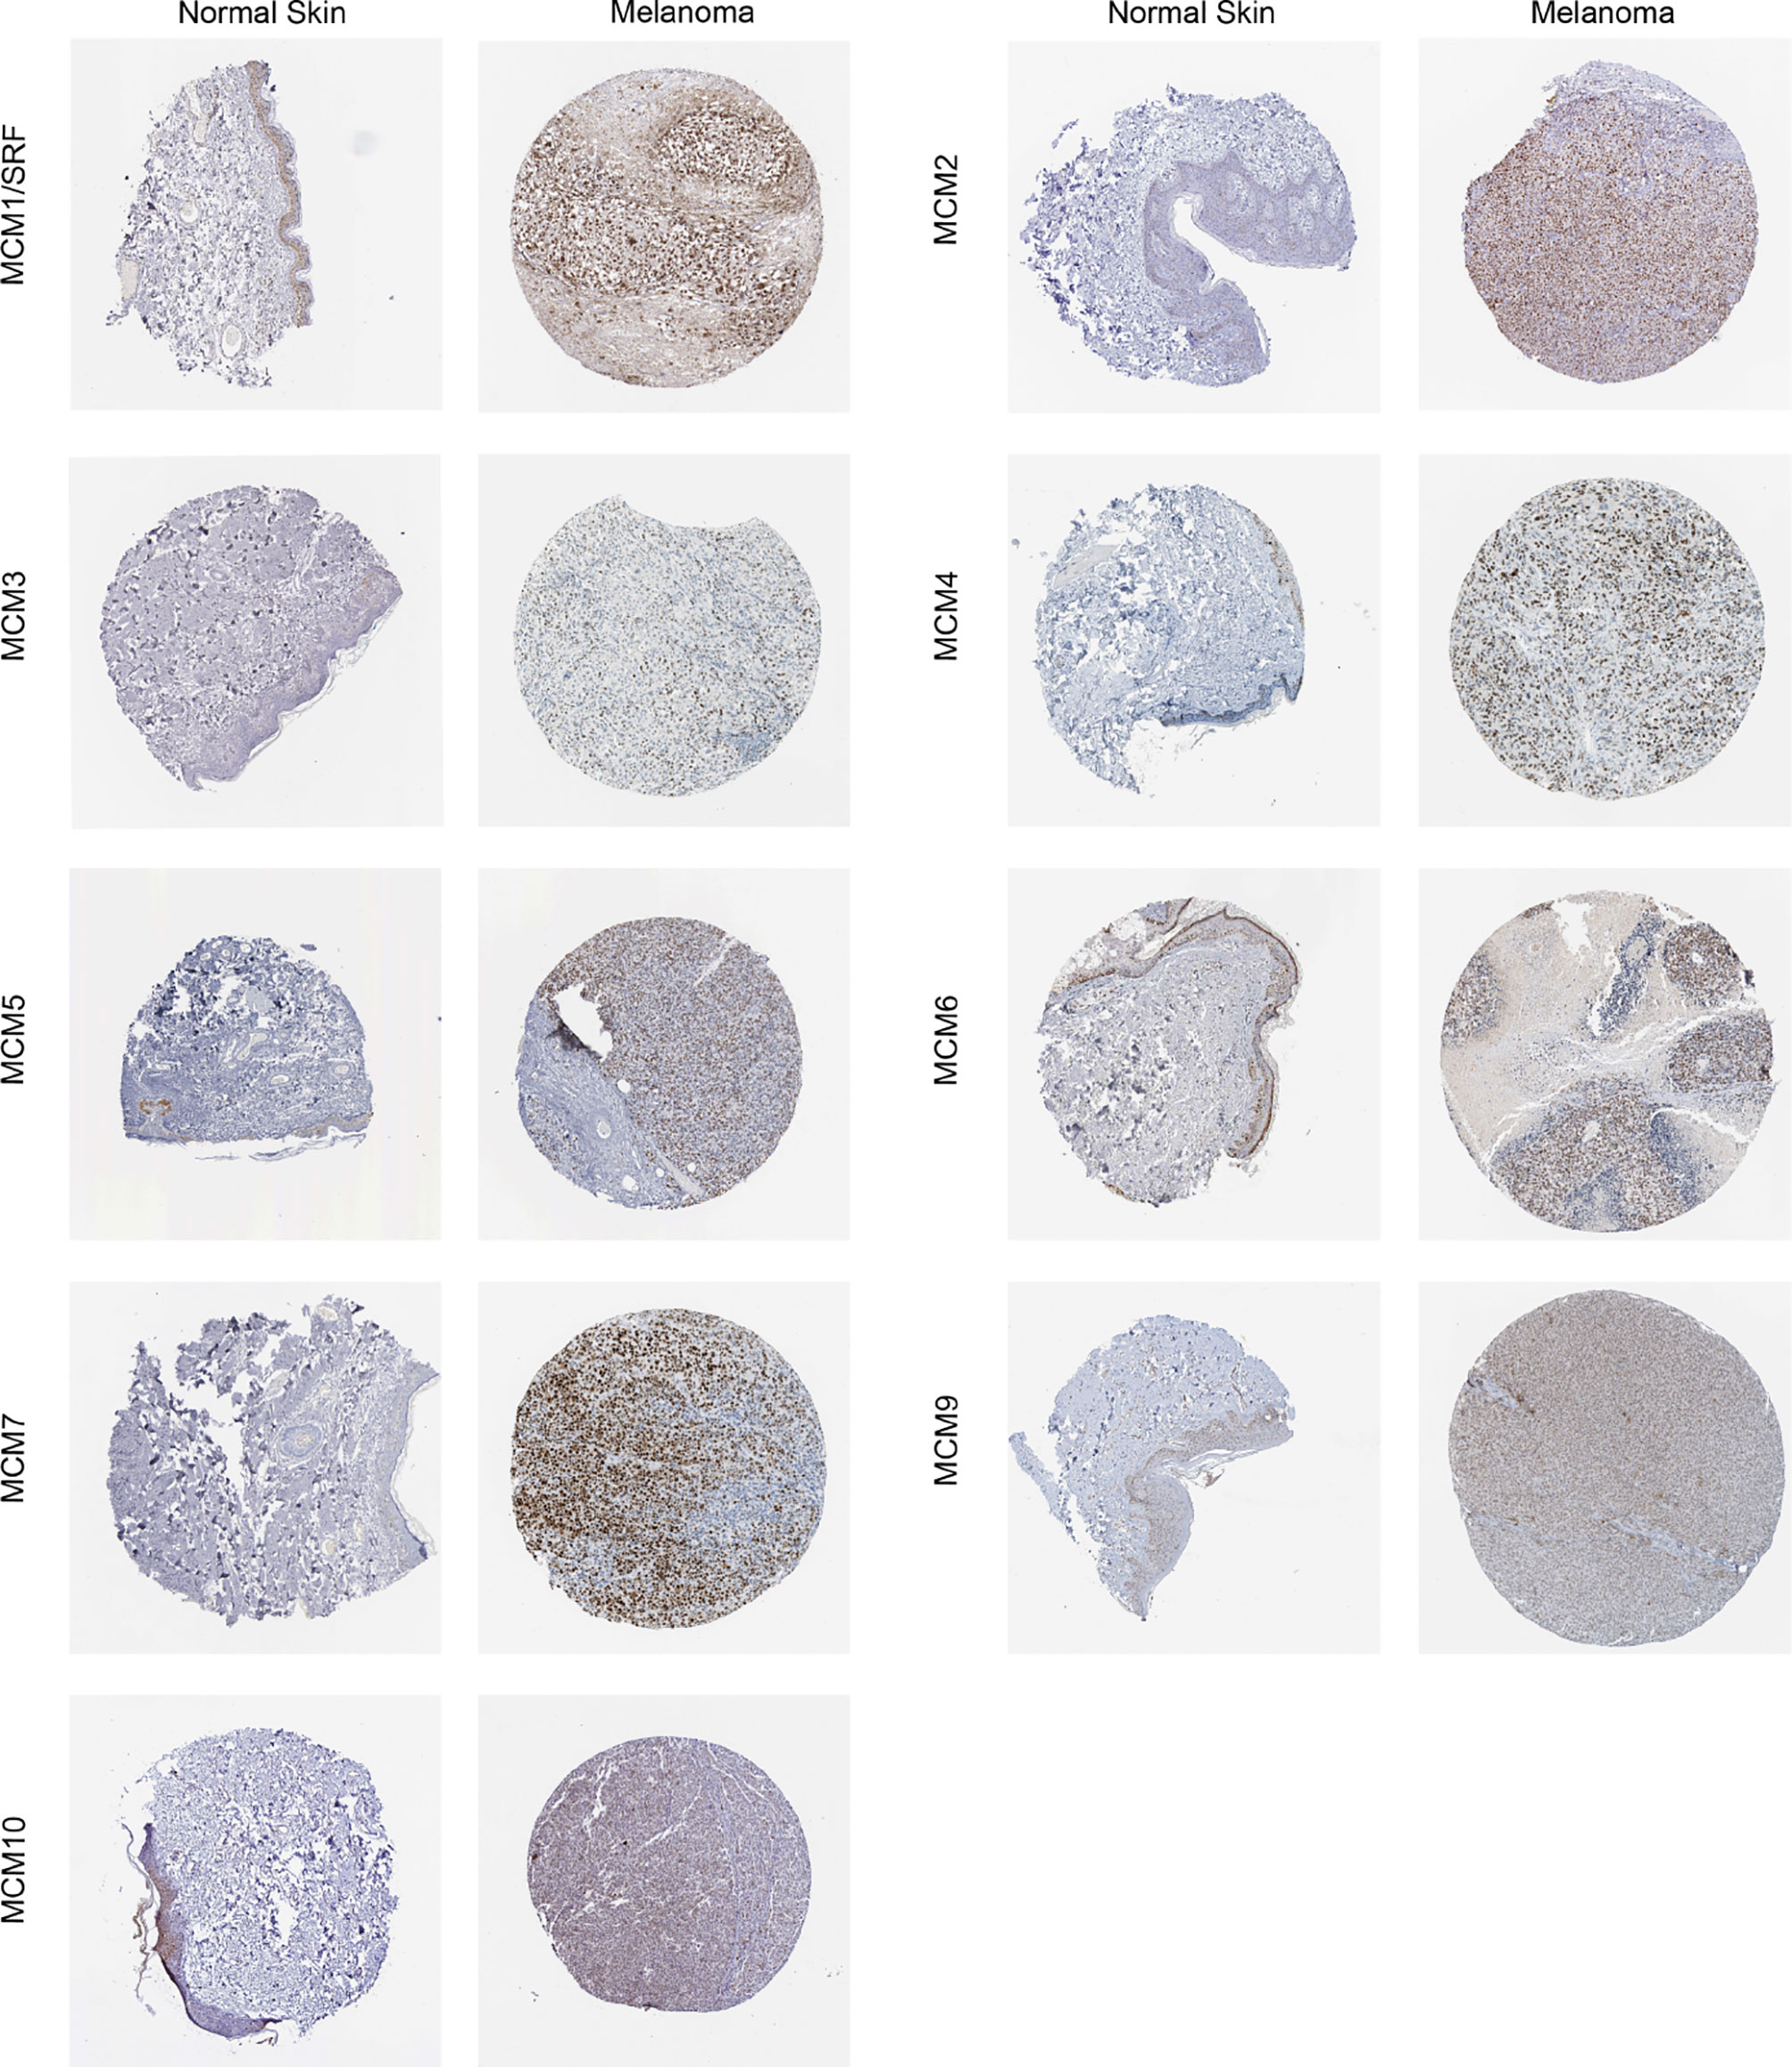
Figure 7 Immunohistochemical staining for protein expression of MCMs in tissues from patients with SKCM and normal tissues. The results revealed MCM1–7 protein levels were higher in melanoma tissues than in normal skin tissues, consistent with the results of MCM mRNA expression, whereas MCM9 and MCM10 proteins showed no great difference between melanoma and normal skin.
Genetic Mutations of MCMs in SKCM
MCM alterations and correlations were analyzed by cBioPortal for TCGA SKCM cohort. MCMs were altered in 255 samples out of 444 SKCM patients (57.43%). MCM1(SRF) (19%) was the most frequently altered gene among the MCM genes, followed by MCM3 (17%), MCM4 (13%), and MCM7 (13%), including amplification, deep deletion, and missense mutations (Figure 8).
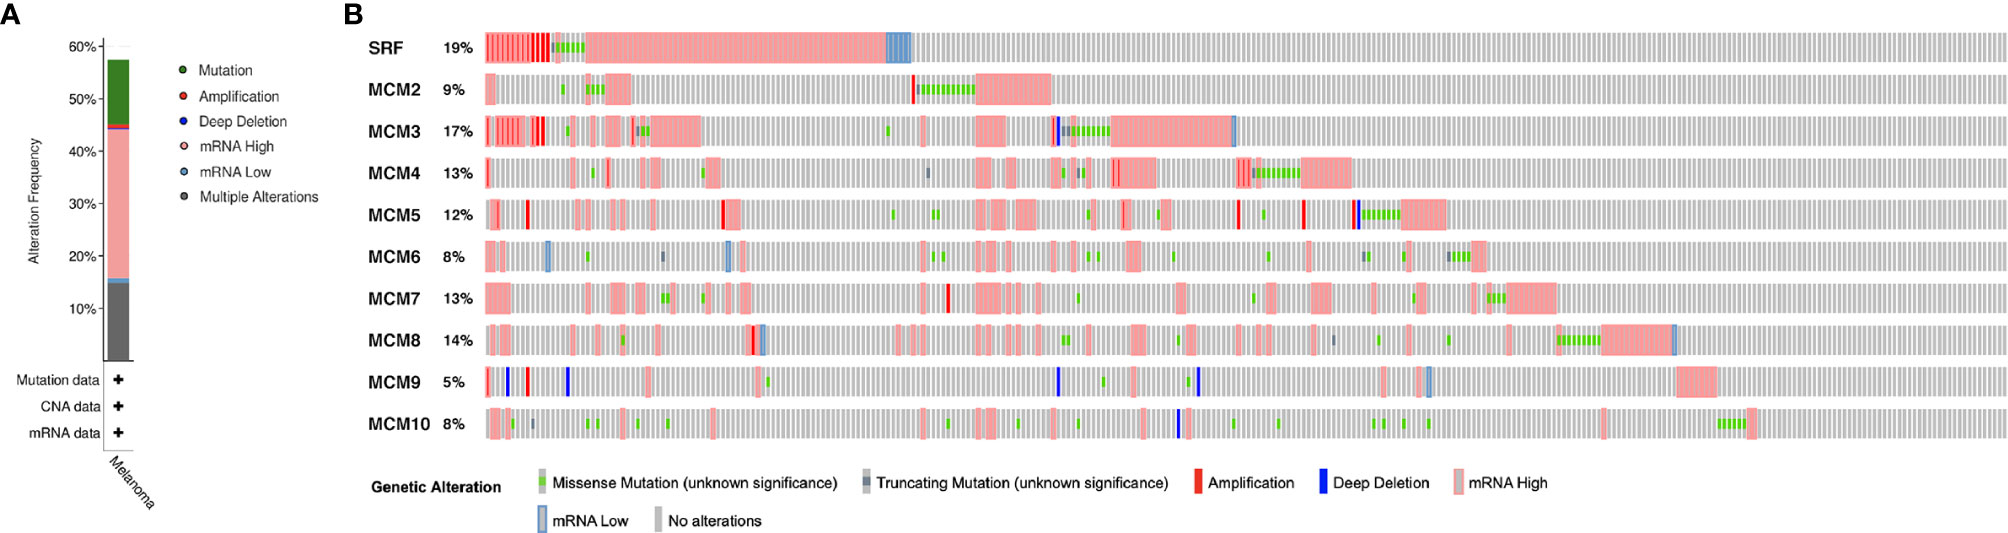
Figure 8 Genetic mutations in MCM family members (cBioPortal). (A) A visual summary of alteration based on a query of 10 MCMs, which was altered in 255 samples out of 444 SKCM patients (57.43%). (B) MCM1 (SRF) (19%) was the most frequently altered gene among the MCM genes, followed by MCM3 (17%), MCM4 (13%), and MCM7 (13%), including amplification, deep deletion, and missense mutations.
Predicted Interaction Networks and Signaling Pathways of MCMs
A protein-protein interaction (PPI) network of differentially expressed MCMs was conducted to identify the potential interactions among them by STRING (Figure 9A). Then, ClueGO functional annotations performed a network of the MCM genes (Figure 9B). The GO and KEGG enrichment analyses of the MCMs are presented in different colors (Figure 9B). The detailed functional notes and classification pie charts are listed in Supplementary Figure 1; 63.64% of terms belong to DNA replication, 18.18% to DNA replication initiation, 9.09% to helicase activity, and 9.09% to DNA replication origin binding.
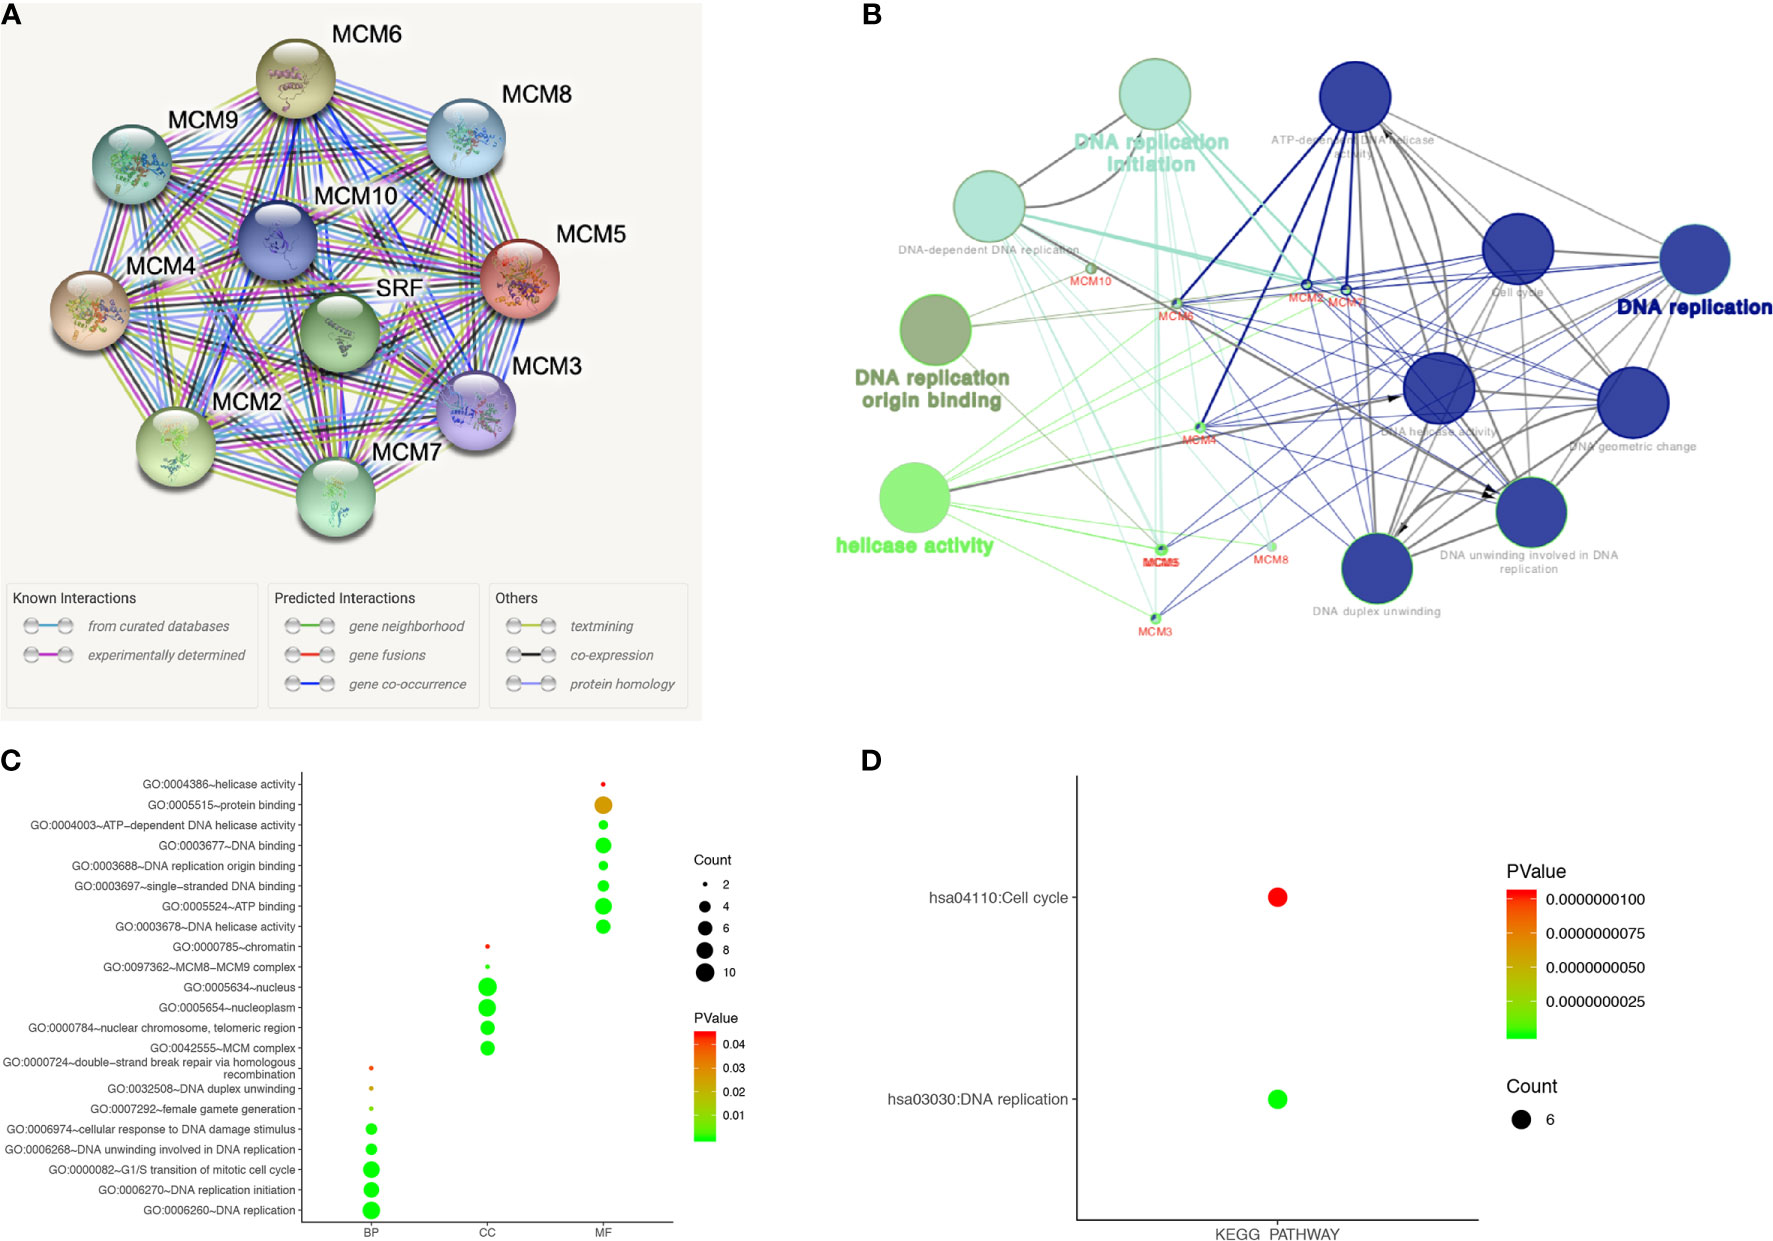
Figure 9 Functions enrichment and signaling pathways analysis of the mutations in MCMs in SKCM patients. (A) A PPI network analysis of differentially expressed MCMs with STRING was conducted to show the close interactions among them. (B) The functional annotation analyses of MCMs were constructed using ClueGO, including DNA replication, DNA replication initiation, helicase activity, and DNA replication origin binding. (C, D) GO and KEGG pathway enrichment analyses of MCMs were performed using DAVID and visualized in bubble chart. The biological processes of MCMs were greatly enriched in DNA replication, G1/S transition of the mitotic cell cycle, DNA replication initiation, DNA unwinding involved in DNA replication, cellular response to DNA damage stimulus, and DNA duplex unwinding. Changes in cellular components were significantly enriched in the nucleus, nucleoplasm, nuclear chromosome, telomeric region, and MCM complex. As for molecular function, changes were mostly enriched in protein binding, ATP binding, DNA binding, DNA helicase activity, and single-stranded DNA binding. KEGG analyses revealed that MCMs were most involved in cell cycle and DNA replication (BP, biological process; CC, cellular component; MF, molecular function).
The functions of MCMs were also predicted by analyzing GO in the DAVID, visualized in bubble charts (Figure 9C). The biological processes of MCMs were greatly enriched in DNA replication, G1/S transition of the mitotic cell cycle, DNA replication initiation, DNA unwinding involved in DNA replication, cellular response to DNA damage stimulus, and DNA duplex unwinding. Changes in cellular components were significantly enriched in the nucleus, nucleoplasm, nuclear chromosome, telomeric region, and MCM complex. As for molecular function, changes were mostly enriched in protein binding, ATP binding, DNA binding, DNA helicase activity, and single-stranded DNA binding. KEGG analyses revealed that MCMs were most involved in the cell cycle and DNA replication (Figure 9D).
Afterwards, a total of 100 significantly changed genes with positive correlation obtained from GSEA were plotted. GSEA, including MCM2–8 and MCM10, showed that the most involved hallmark pathways were E2F targets, G2M checkpoint, mitotic spindle, and mTORC1 signaling. The details are displayed in Figure 10.
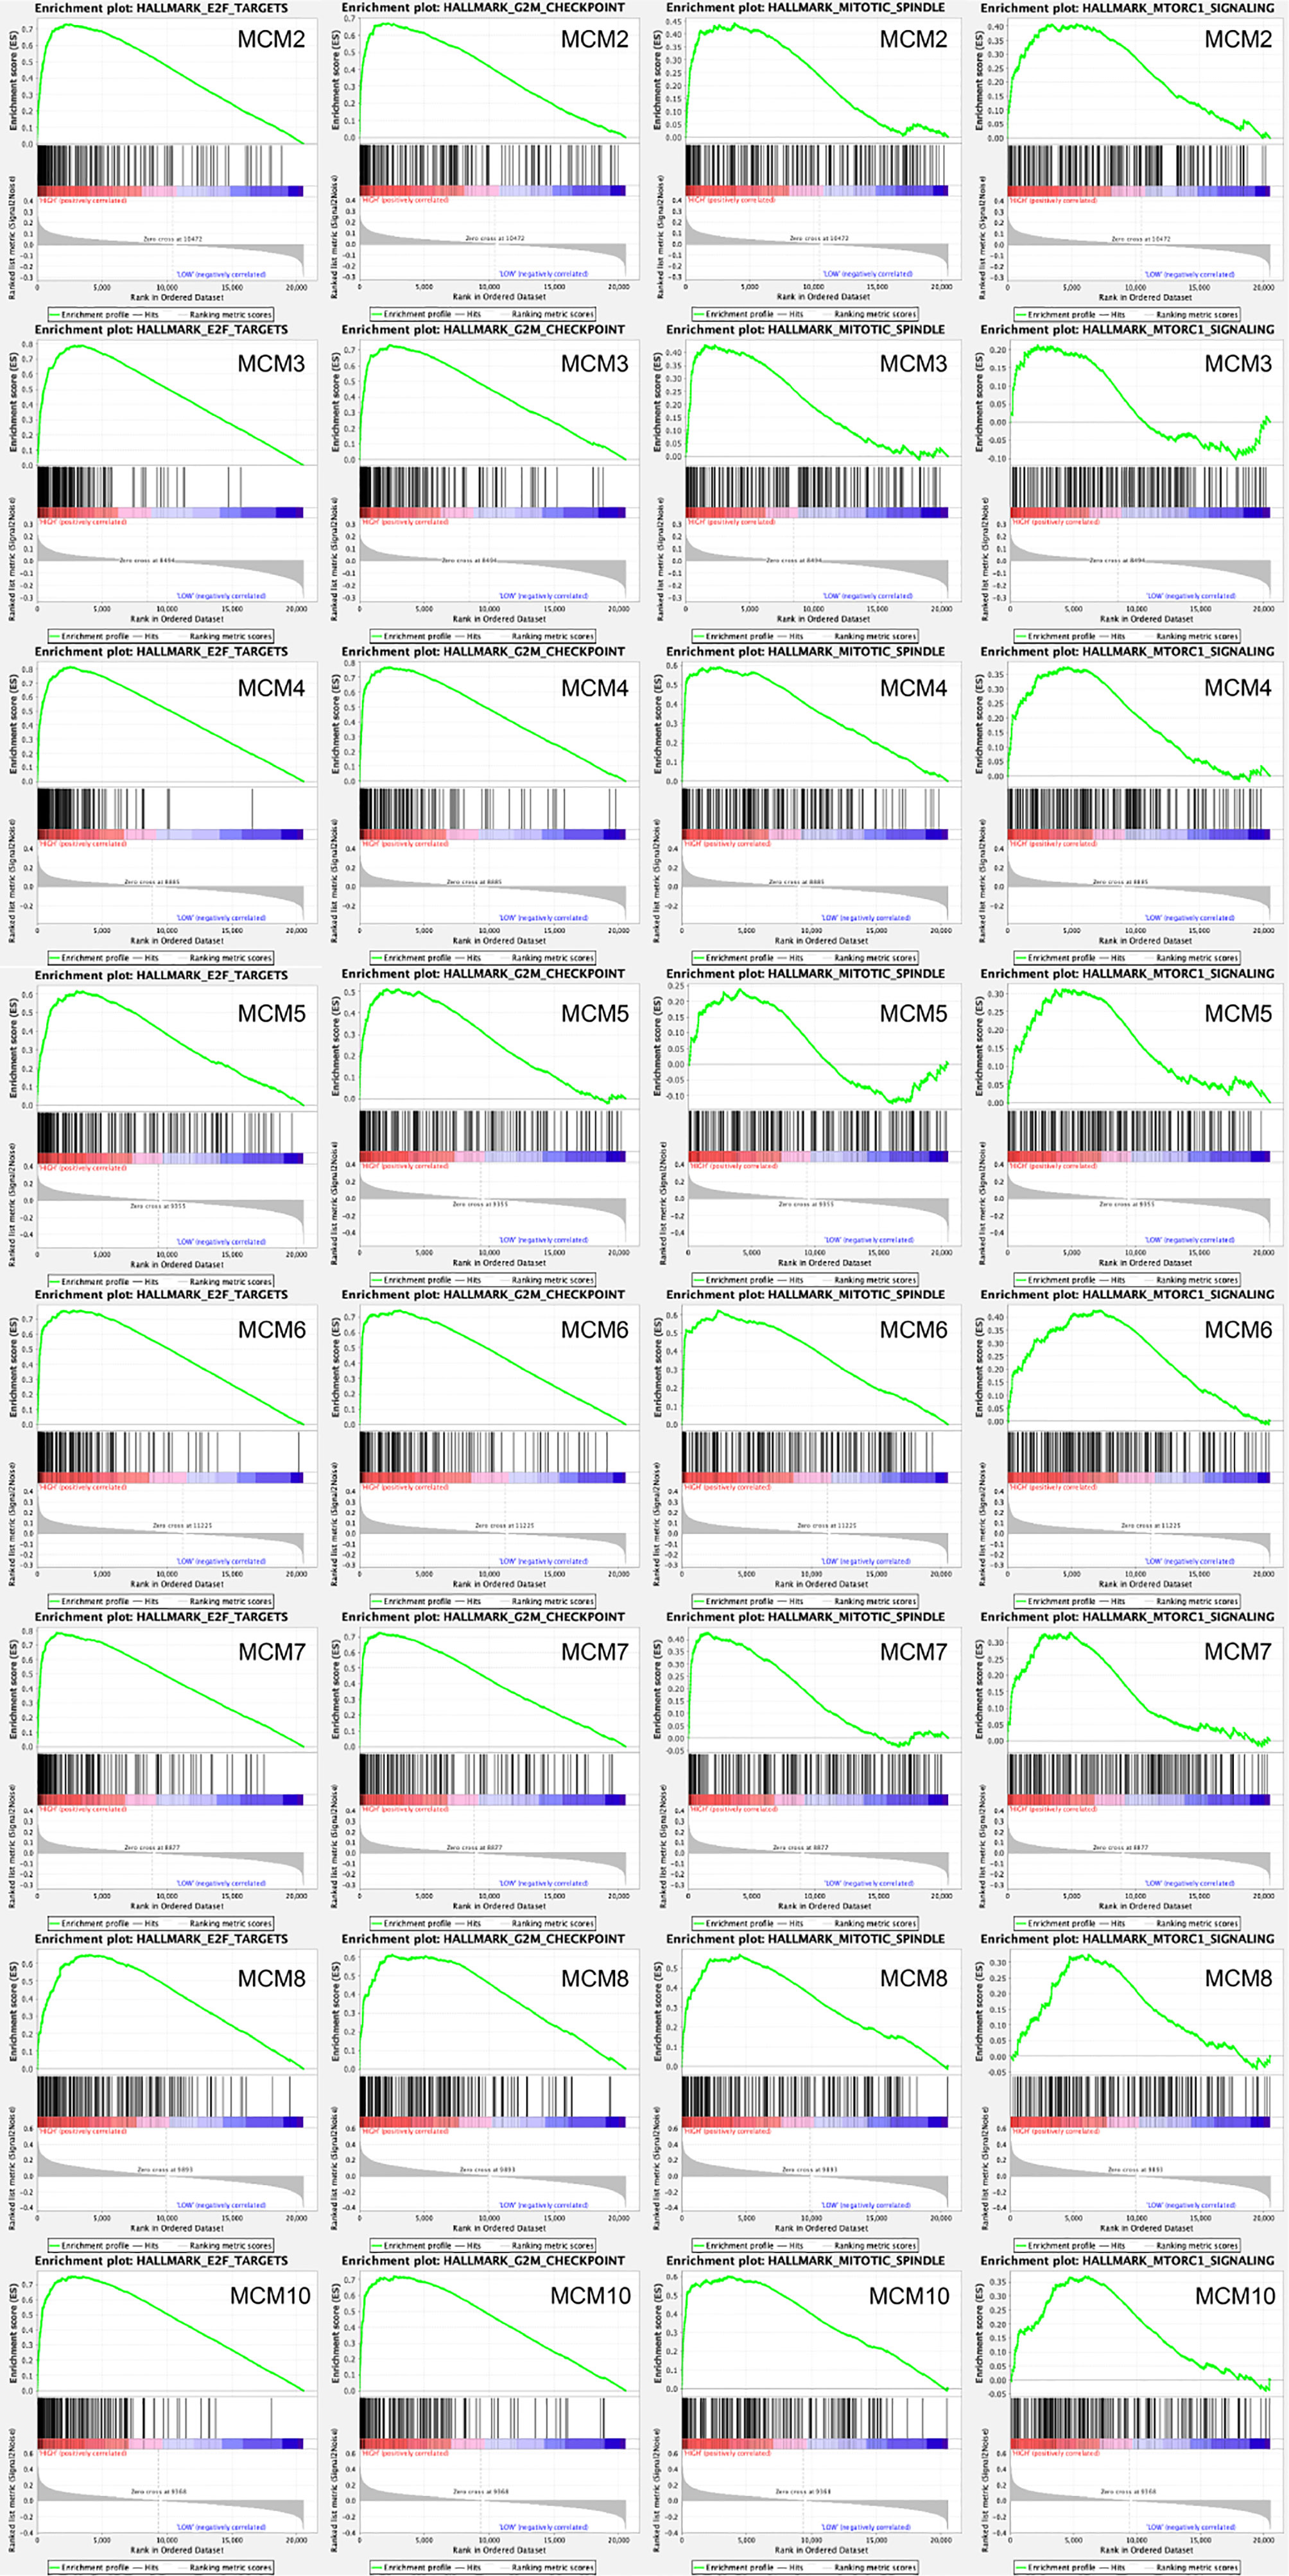
Figure 10 GSEA was used to perform hallmark signaling analysis in MCMs, respectively. A total of 100 significant genes were obtained from GSEA with positive and negative correlation. GSEA, including MCM2–8 and MCM10, indicated that the most involved hallmark pathways were E2F targets, G2M checkpoint, mitotic spindle, and mTORC1 signaling.
Immune Cell Infiltration of MCMs in Patients With SKCM
Furthermore, we explored the correlations between differentially expressed MCMs and immune cell infiltration by TIMER database. There was a positive correlation between MCM1 expression and the infiltration of B cells (Cor = 0.101, p = 3.22e−2), CD8+T cells (Cor = 0.151, p = 1.57e−3), CD4+T cells (Cor = 0.217, p = 3.93e−6), macrophages (Cor = 0.183, p = 8.61e−5), neutrophils (Cor = 0.244, p = 1.42e−7), and dendritic cells (Cor = 0.209, p = 8.71e−6; Figure 11A). Similar results were observed for MCM2 and MCM3. MCM2 and MCM3 expressions were positively associated with the infiltration of B cells, CD8+T cells, CD4+T cells, neutrophils and dendritic cells (Figures 11B, C). The expression of MCM4 was negatively associated with the infiltration of B cells (Cor = 0.126, p = 7.73e−5), CD8+ T cells (Cor = 0.189, p = 6.87e−5), macrophages (Cor = 0.119, p = 1.14e−2), neutrophils (Cor = 0.238, p = 2.92e−7), and dendritic cells (Cor = 0.17, p = 3.20e−4; Figure 11D). There was a negative correlation between MCM5 expression and the infiltration of B cells (Cor = 0.136, p = 3.95e−3) and dendritic cells (Cor = 0.203, p = 1.49e−5; Figure 11E). MCM6 and MCM9 expressions negatively correlated with infiltration of the all six immune cell types (B cells, CD8+ T cells, CD4+ T cells, macrophages, neutrophils, and dendritic cells; all p < 0.05; Figures 11F, I). Similarly, the expressions of MCM7 and MCM10 were also positively associated with the infiltration of B cells, neutrophils and dendritic cells (Figures 11G, J).We also found that the higher the infiltrations of B cells (Cor = 0.133, p = 4.77e−3), CD8+ T cells (Cor = 0.374, p = 5.12e−16), macrophages (Cor = 0.196, p = 2.73e−5), neutrophils (Cor = 0.46, p = 5.27e−25), and dendritic cells (Cor = 0.236, p = 4.42e−7), the higher the expressions of MCM8 (Figure 11H).
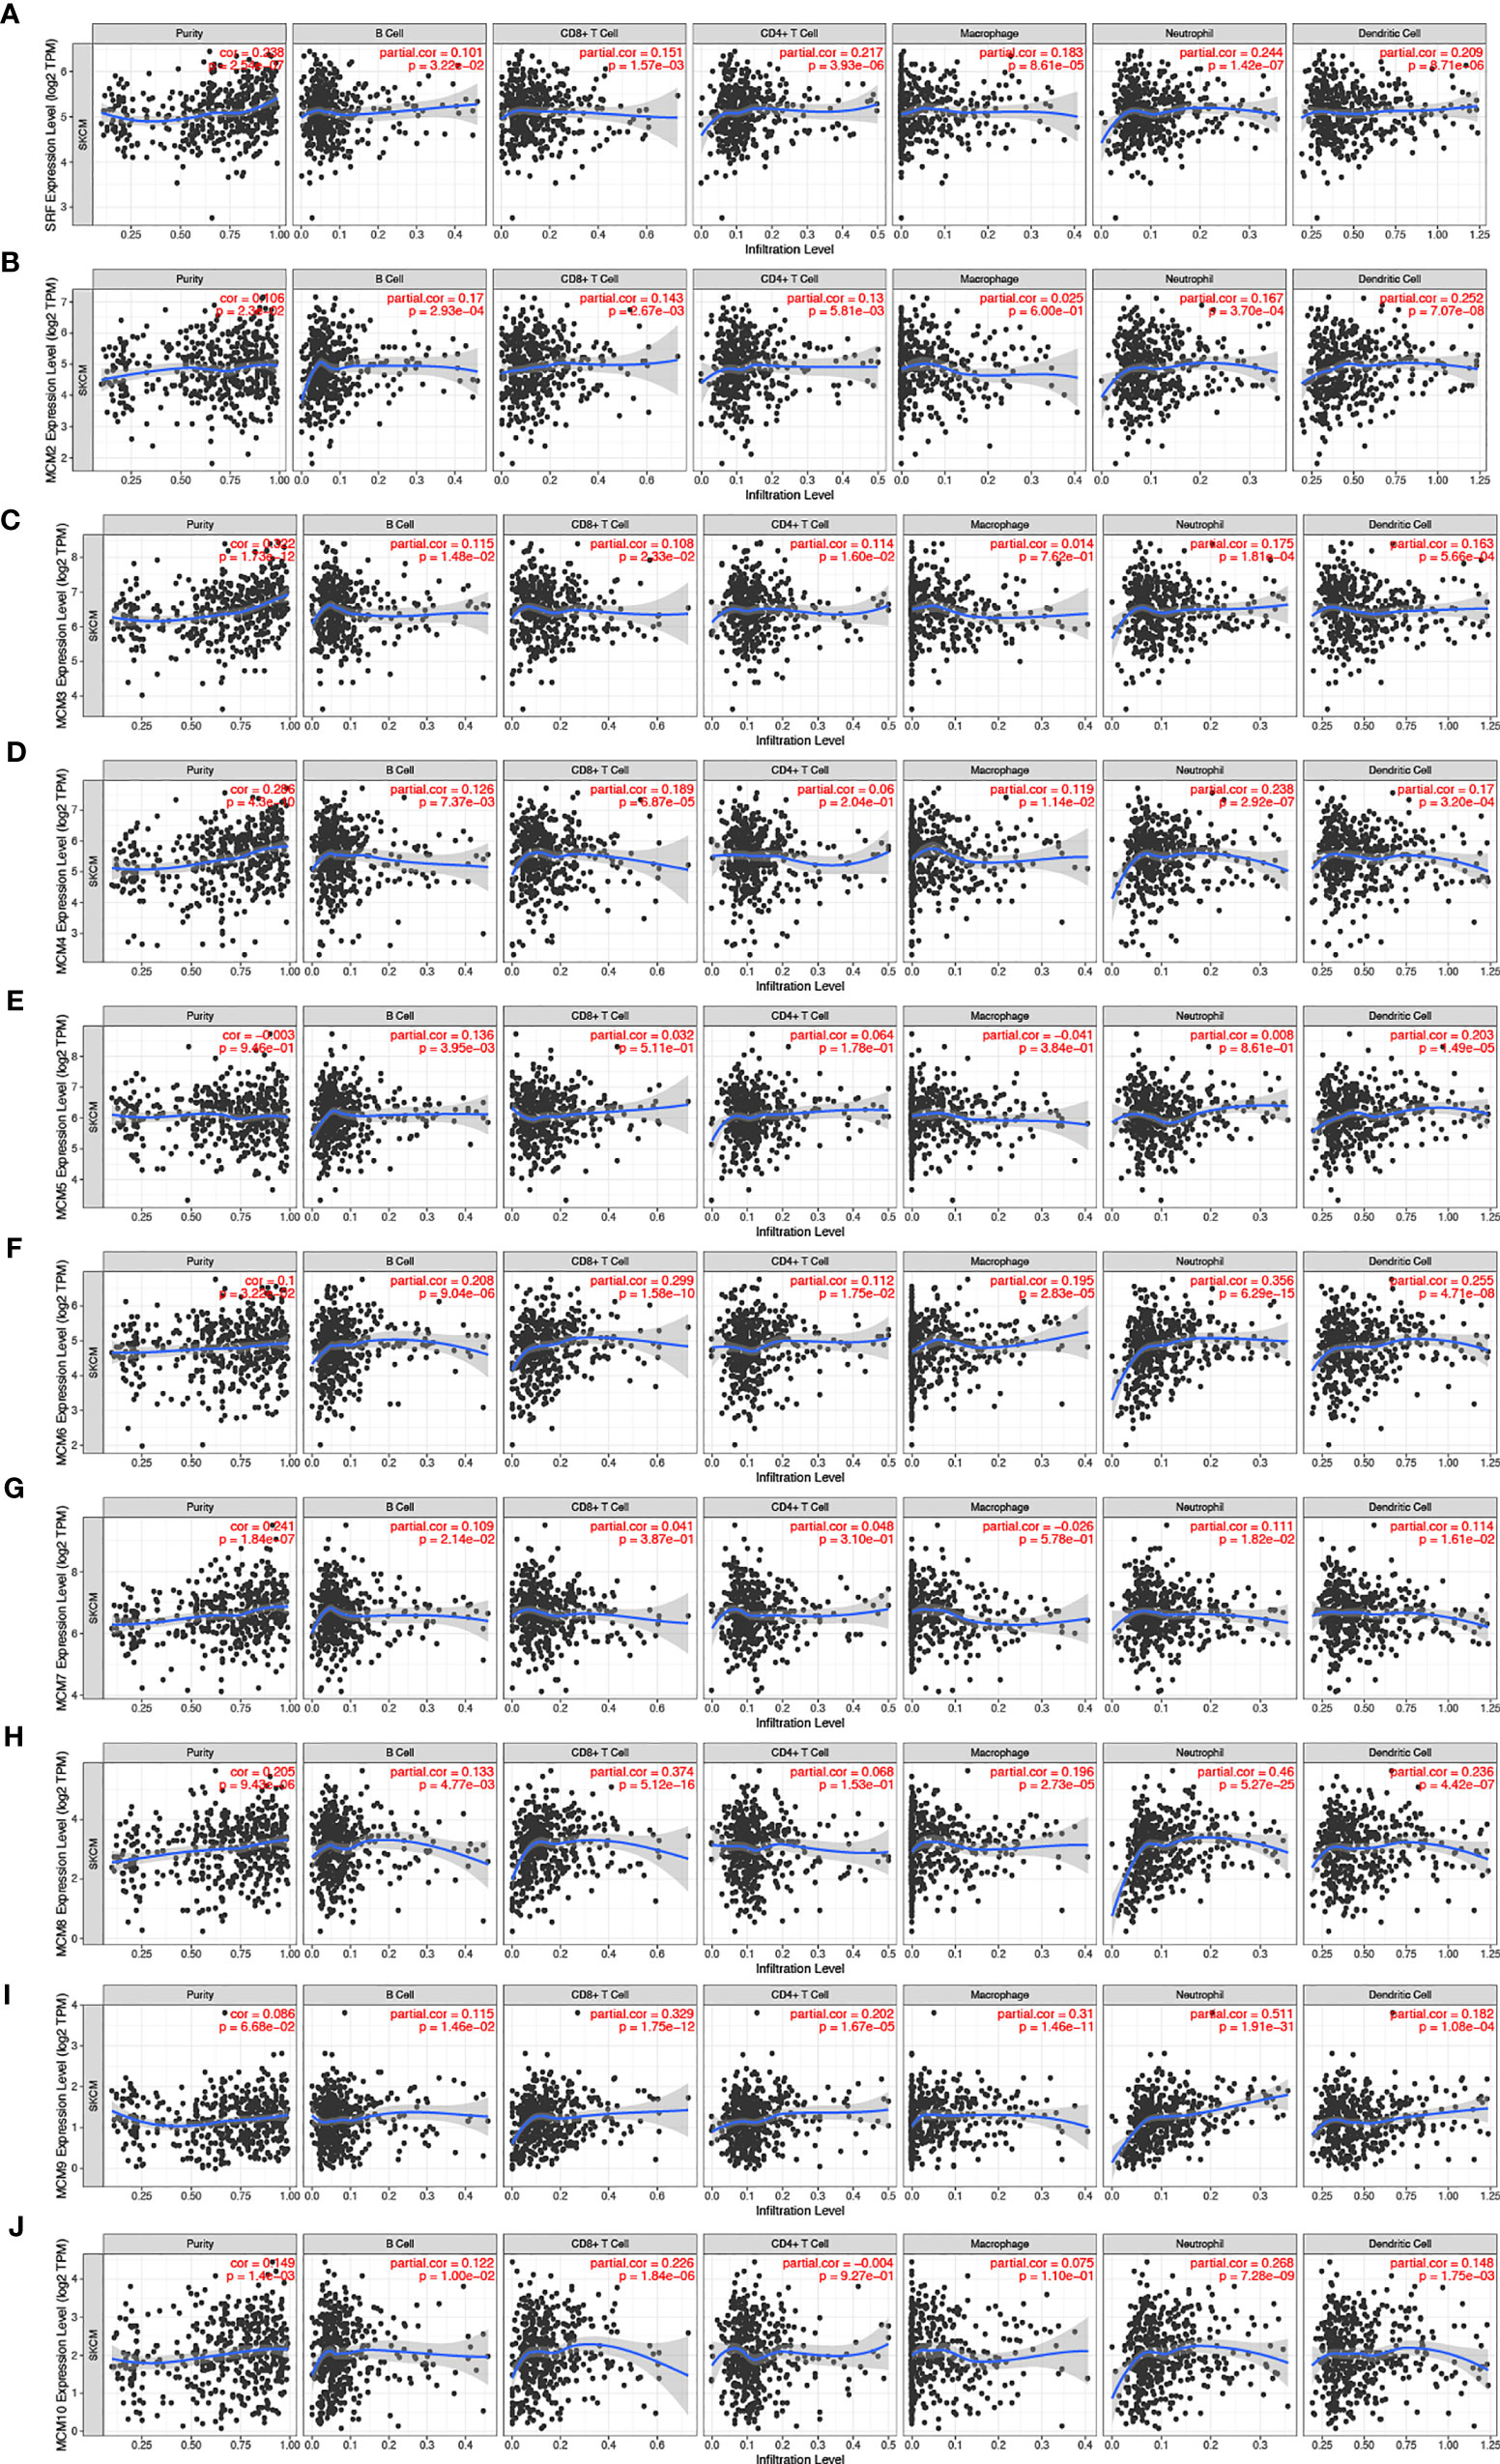
Figure 11 (A–J) The correlation between different expressed MCMs and immune cell infiltration (TIMER). There was a positive correlation between MCM1/2/3/7/8/10 expression and the infiltration of immune cells. Instead, MCM4/5/6/9 were negatively associated with the infiltration of immune cells.
Discussion
MCMs have recently been found to be effective biomarkers for the diagnosis and prognosis prediction of various tumors. MCMs can be used to distinguish differentiated cells from undifferentiated cells because of their decreased abundance following cell cycle exit (25). One significant hallmark of tumors is the loss of differentiation and unscheduled re-entry into the cell cycle (7). However, there are few reports about the functions of MCMs in melanoma. In this study, we found that that MCMs were heterogeneous in different types of tumors. According to the pan-cancer expression profiling analysis and survival analysis of TCGA data, we identified three MCM genes that were significantly associated with the prognosis of patients with SKCM. We also found that MCM mRNA levels were correlated with the T and tumor stages of SKCM. The GO and KEGG functional analyses indicated that the MCM genes that were differentially expressed between melanoma and normal skin tissues were significantly enriched in cell cycle and DNA replication. The GSEA showed that the most involved hallmark pathways were E2F targets, G2M checkpoint, mitotic spindle, and mTORC1 signaling. It has been shown previously that mTORC1 signaling was regulated by both MAPK and PI3K signaling and played an essential role in melanoma cell proliferation (26). Furthermore, the proliferation of T lymphocytes were induced by IL-4 with the coordinate transcriptional induction of the cell cycle regulatory genes that encode MCMs (27). Therefore, we investigated the correlation between differentially expressed MCM genes and immune cell infiltration using the TIMER database and showed that MCMs may be involved in immune responses and thus might affect the clinical outcome of patients with melanoma. These results demonstrate that differentially expressed MCM genes may play key roles in SKCM.
Altered MCM2 expression was shown to signify cell-cycle deregulation, which is necessary for the initiation and progression of cancers (28). Increased expression of MCM2 was found to be an independent adverse prognostic factor, and MCM2 has served as a prognostic marker for multiple myeloma (29). MCM2 was shown to be a more sensitive proliferation biomarker than Ki67 and geminin in oral melanoma (30). MCM2 was also found to be associated with lower survival rates, suggesting its possible role as a prognostic predictor in melanoma (31). The different expression levels of MCM2 in melanocytic neoplasms potentially provide a useful tool to distinguish benign melanocytic lesions from malignant melanocytic lesions (32). In our study, the GEPIA showed that the MCM2 mRNA level was much higher in melanoma than in normal skin tissues. Expression of MCM2 was significantly associated with the clinical characteristics (e.g., T stage and tumor stage) of patients with SKCM. Although the statistical significance was low, we found that high MCM2 expression was associated with poor OS in patients with melanoma, which is consistent with the results of the previous study (31).
MCM3 was found to be more reliable prognosis biomarker than Ki-67 for malignant melanoma and salivary gland tumors (33). Nodin et al. (34) reported the MCM3 expression could be considered as an independent prognostic biomarker for patients with primary melanoma, and the absence of MCM3 was correlated with tumor progression and worse outcomes in SKCM. The expression of MCM3 was also associated with poor survival outcomes in medulloblastoma and malignant glioma (35). In the present study, MCM3 was found to be overexpressed in melanoma tissue compared with normal skin tissue. We also demonstrated that MCM3 expression was significantly associated with the pathological stages in patients with SKCM. Similarly, we found elevated expression of MCM3 was related to worse prognosis in melanoma patients, which is consistent with the previous study (34), but the statistical significance was low. The TIMER analysis showed that MCM3 was closely correlated with B cells and CD4+ and CD8+ T cells, which may provide a new approach to immunotherapy for melanoma.
Upregulation of MCM4 was found to be a potential prognostic biomarker for lung cancers by coordinating the cell cycle, DNA replication, and other biological processes and pathways (36). The loss of MCM4 improved the therapeutic effect of cisplatin because of the induced DNA damage, indicating that MCM4 could be a potential cancer treatment target in cervical cancer (33). Moreover, significantly more MCM4 was expressed in melanoma compared with in-nevi tissue (37). Orange (38) demonstrated that a mutation in the MCM4 gene could be a genetic cause of natural killer (NK) cell deficiency and suggested a critical role for MCMs in NK cells and in NK cell–mediated host defense. In this study, we found that the expression of MCM4 was higher in melanoma than in normal skin tissues. Importantly, high expression of MCM4 was found to be highly associated with worse OS in patients with melanoma, and MCM4 had a positive correlation with B cells and T cells.
MCM5 was overexpressed in lung cancers, and elevated MCM5 expression was associated with increased morbidity (39). The SOX10–MCM5 axis was found to be a significant pathway that regulates melanocyte proliferation, which is required for melanocyte survival (40). Knockdown of SOX10 in melanocytes inhibited cell proliferation and decreased MCM5 expression (40). In the present study, we found that MCM5 was upregulated in melanoma compared with its expression in normal skin and that increased expression of MCM5 was significantly associated with poor OS of patients with SKCM.
Overexpression of MCM6 is related to the diagnosis and poor prognosis of hepatocellular carcinoma (41). MCM6 has also been used to identify cancer cell proliferation and may be a useful prognostic biomarker in diffuse large B-cell lymphoma (42). However, few studies have reported its role in melanoma. In this study, we found that MCM6 expression was higher in melanoma than in normal skin in our analysis of TCGA data, and it was closely associated with T and tumor stages in patients with melanoma.
MCM7 was involved in oncogenic signaling pathways and was highly expressed in various tumor tissues, including melanoma. MCM7 silencing promoted autophagy and apoptosis, which inhibited the migration, viability, and invasion of tumor cells in melanoma (43). MCM7 was significantly correlated with tumorigenesis, progression, malignant conversion, and prognosis in skin squamous cell carcinoma (44). In our study, although it was not statistically significant, we found that MCM7 was more highly expressed in melanoma than in normal skin, and increased expression of MCM7 was correlated with worse outcomes in melanoma, which is consistent with its oncogenic role.
MCM8 is involved in the repair of double-strand DNA breaks and homologous recombination (45). Loss of MCM8 can induce a higher apoptotic rate as well as lower cell viability. MCM8 was found to be helpful in treating patients with chronic myelogenous leukemia (29). In our study, high expression of MCM8 was closely related to the T and tumor stages. MCM8 also was associated with immune cell infiltration in patients with melanoma, which may provide novel insights for the diagnosis and treatment of malignant melanoma.
MCM9 is found only in vertebrates and is more closely related to MCM8 than to the other MCM family members, implying a recent duplication of MCM8 (7). The relationship between MCM9 and cancers remains elusive. MCM9 knockout mice were more likely to have ovarian and liver tumors than wild-type mice (46). Moreover, carriers of homozygous mutations in MCM9 had a high risk of early colorectal carcinoma and premature ovarian insufficiency (47). In our study, MCM9 was correlated with the T and tumor stages in patients with melanoma. We noticed that the expression and survival curve of MCM9 was quite different from those of other MCM family members. This finding needs to be studied further in the future.
MCM10 is an essential protein in DNA replication by forming complexes with MCM2–7, and it participates in multiple molecular and cellular processes, such as DNA replication, early embryogenesis, and normal embryonic development. MCM10 is also involved in the formation and development of multiple tumors, including glioma, prostate cancer, urothelial cancer, neuroblastoma, and breast cancer (48). Together with MCM7, the upregulation of MCM10 expression was associated with an increase of NK cells (49). In the present study, we found that MCM10 was overexpressed in melanoma compared with its expression in normal skin, and showed significant differences in expression at the T and pathological stages. Increased MCM10 expression was closely associated with poor prognosis in patients with SKCM.
Although MCM1 is not a member of the MCM family, it is also required for minichromosome maintenance and plays a role in DNA synthesis (7). MCM1 interacts with serum response elements to activate the immediate-early genes and further perform its function. Notably, MCM1 is the downstream target of the mitogen-activated protein kinase (MAPK) pathway (50), which is the pathway most involved in SKCM, suggesting that MCM1 may play a role in melanoma tumorigenesis.
This is the first study to systematically investigate the oncogenic and prognostic utility of MCMs in SKCM. Although the potential role of MCMs in various tumors has been reported previously, little was known about their involvement in SKCM. In this study, we found that MCMs were significantly overexpressed in SKCM and were associated with T stage, tumor stage, and OS. We also discovered that genetic mutations in MCMs were present in 57.43% of the patients with SKCM. Importantly, we identified significant correlations between the expression of MCMs and the infiltration of immune cells (B cells, CD4+ T cells, CD8+ T cells, macrophages, neutrophils, and dendritic cells), which may provide new clues for immunotherapeutic targets and prognostic markers for melanoma. However, further experiments are required to validate our findings and promote the clinical utility of MCMs as prognostic biomarkers or therapeutic targets for patients with melanoma.
In summary, we detected elevated expression levels of MCM2–6 and MCM10 in melanoma and found that increased MCM4/5/10 mRNA levels were associated with a worse prognosis for patients with melanoma. In the future study, further functional works, as well as validated cohorts, are needed to verify the absoluteness of these findings, which will provide new insights into the molecular alterations in SKCM and will contribute to finding more potential biomarkers in this area.
Data Availability Statement
The original contributions presented in the study are included in the article/Supplementary Material. Further inquiries can be directed to the corresponding authors.
Author Contributions
G-LS, Z-HG, and X-YZ developed the idea, designed the research, and revised the writing. WH and Y-ZW analyzed the data and drafted the manuscript. All authors contributed to the article and approved the submitted version.
Funding
Medical Research Project of Jiangsu Provincial Health Commission (Z2019031); Medical Research Project of Nantong Health Commission (MA2020001); Nantong Science and Technology Bureau (MS12021093, JCZ21126).
Conflict of Interest
The authors declare that the research was conducted in the absence of any commercial or financial relationships that could be construed as a potential conflict of interest.
Publisher’s Note
All claims expressed in this article are solely those of the authors and do not necessarily represent those of their affiliated organizations, or those of the publisher, the editors and the reviewers. Any product that may be evaluated in this article, or claim that may be made by its manufacturer, is not guaranteed or endorsed by the publisher.
Acknowledgments
We thank Liwen Bianji (Edanz) (www.liwenbianji.cn) for editing the language of a draft of this manuscript.
Supplementary Material
The Supplementary Material for this article can be found online at: https://www.frontiersin.org/articles/10.3389/fonc.2021.715173/full#supplementary-material
References
1. Schadendorf PD, van Akkooi ACJ, Berking C, Griewank KG, Gutzmer R, Hauschild A, et al. Melanoma. Lancet (2018) 392(10151):971–84. doi: 10.1016/S0140-6736(18)31559-9
2. Clark WH, Elder DE, Guerry D, Epstein MN, Greene MH, Van Horn M. A Study of Tumor Progression: The Precursor Lesions of Superficial Spreading and Nodular Melanoma. Hum Pathol (1984) 15(12):1147–65. doi: 10.1016/S0046-8177(84)80310-X
3. Gadeliya Goodson A, Grossman D. Strategies for Early Melanoma Detection: Approaches to the Patient With Nevi. J Am Acad Dermatol (2009) 60(5):719–35. doi: 10.1016/j.jaad.2008.10.065
4. Flaherty KT, Hodi FS, Fisher DE. From Genes to Drugs: Targeted Strategies for Melanoma. Nat Rev Cancer (2012) 12(5):349–61. doi: 10.1038/nrc3218
5. Bajor DL, Mick R, Riese MJ, Huang AC, Sullivan B, Richman LP, et al. Long-Term Outcomes of a Phase I Study of Agonist CD40 Antibody and CTLA-4 Blockade in Patients With Metastatic Melanoma. Oncoimmunology (2018) 7(10):e1468956. doi: 10.1080/2162402X.2018.1468956
6. Johnson EM, Kinoshita Y, Daniel DC. A New Member of the MCM Protein Family Encoded by the Human MCM8 Gene, Located Contrapodal to GCD10 at Chromosome Band 20p12.3-13. Nucleic Acids Res (2003) 31(11):2915–25. doi: 10.1093/nar/gkg395
7. Maiorano D, Lutzmann M, Mechali M. MCM Proteins and DNA Replication. Curr Opin Cell Biol (2006) 18(2):130–6. doi: 10.1016/j.ceb.2006.02.006
8. Gou K, Liu J, Feng X, Li H, Yuan Y, Xing C. Expression of Minichromosome Maintenance Proteins (MCM) and Cancer Prognosis: A Meta-Analysis. J Cancer (2018) 9(8):1518–26. doi: 10.7150/jca.22691
9. Christopher J, McInerny JFP, Mikesell GE, Creemer DP, Linda L. Breeden A Novel Mcml-Dependent Element in the WI4, CLN3, CDC6, and CDC4S7 Promoters Activates M:Gi-Specific Transcription. Genes Dev (1997) 11:1277–88. doi: 10.1101/gad.11.10.1277
10. Tang J, Kong D, Cui Q, Wang K, Zhang D, Gong Y, et al. Prognostic Genes of Breast Cancer Identified by Gene Co-Expression Network Analysis. Front Oncol (2018) 8:374. doi: 10.3389/fonc.2018.00374
11. Tang Z, Li C, Kang B, Gao G, Li C, Zhang Z. GEPIA: A Web Server for Cancer and Normal Gene Expression Profiling and Interactive Analyses. Nucleic Acids Res (2017) 45(W1):W98–102. doi: 10.1093/nar/gkx247
12. Rhodes DR, Yu J, Shanker K, Deshpande N, Varambally R, Ghosh D, et al. ONCOMINE: A Cancer Microarray Database and Integrated Data-Mining Platform. Neoplasia (2004) 6(1):1–6. doi: 10.1016/S1476-5586(04)80047-2
13. Chandrashekar DS, Bashel B, Balasubramanya SAH, Creighton CJ, Ponce-Rodriguez I, Chakravarthi B, et al. UALCAN: A Portal for Facilitating Tumor Subgroup Gene Expression and Survival Analyses. Neoplasia (2017) 19(8):649–58. doi: 10.1016/j.neo.2017.05.002
14. Ponten F, Jirstrom K, Uhlen M. The Human Protein Atlas–A Tool for Pathology. J Pathol (2008) 216(4):387–93. doi: 10.1002/path.2440
15. Cerami E, Gao J, Dogrusoz U, Gross BE, Sumer SO, Aksoy BA, et al. The Cbio Cancer Genomics Portal: An Open Platform for Exploring Multidimensional Cancer Genomics Data: Figure 1. Cancer Discovery (2012) 2(5):401–4. doi: 10.1158/2159-8290.CD-12-0095
16. Franceschini A, Szklarczyk D, Frankild S, Kuhn M, Simonovic M, Roth A, et al. STRING V9.1: Protein-Protein Interaction Networks, With Increased Coverage and Integration. Nucleic Acids Res (2013) 41(Database issue):D808–15. doi: 10.1093/nar/gks1094
17. Huang DW, Sherman BT, Tan Q, Collins JR, Alvord WG, Roayaei J, et al. The DAVID Gene Functional Classification Tool: A Novel Biological Module-Centric Algorithm to Functionally Analyze Large Gene Lists. Genome Biol (2007) 8(9):R183. doi: 10.1186/gb-2007-8-9-r183
18. Ashburner M, Ball CA, Blake JA, Botstein D, Butler H, Cherry JM, et al. Gene Ontology: Tool for the Unification of Biology. The Gene Ontology Consortium. Nat Genet (2000) 25(1):25–9. doi: 10.1038/75556
19. Bindea G, Galon J, Mlecnik B. CluePedia Cytoscape Plugin: Pathway Insights Using Integrated Experimental and In Silico Data. Bioinformatics (2013) 29(5):661–3. doi: 10.1093/bioinformatics/btt019
20. Subramanian A, Tamayo P, Mootha VK, Mukherjee S, Ebert BL, Gillette MA, et al. Gene Set Enrichment Analysis: A Knowledge-Based Approach for Interpreting Genome-Wide Expression Profiles. Proc Natl Acad Sci USA (2005) 102(43):15545–50. doi: 10.1073/pnas.0506580102
21. Li T, Fan J, Wang B, Traugh N, Chen Q, Liu JS, et al. TIMER: A Web Server for Comprehensive Analysis of Tumor-Infiltrating Immune Cells. Cancer Res (2017) 77(21):e108–10. doi: 10.1158/0008-5472.CAN-17-0307
22. Talantov D, Mazumder A, Yu JX, Briggs T, Jiang Y, Backus J, et al. Novel Genes Associated With Malignant Melanoma But Not Benign Melanocytic Lesions. Clin Cancer Res (2005) 11(20):7234–42. doi: 10.1158/1078-0432.CCR-05-0683
23. Haqq C, Nosrati M, Sudilovsky D, Crothers J, Khodabakhsh D, Pulliam BL, et al. The Gene Expression Signatures of Melanoma Progression. Proc Natl Acad Sci USA (2005) 102(17):6092–7. doi: 10.1073/pnas.0501564102
24. Riker AI, Enkemann SA, Fodstad O, Liu S, Ren S, Morris C, et al. The Gene Expression Profiles of Primary and Metastatic Melanoma Yields a Transition Point of Tumor Progression and Metastasis. BMC Med Genomics (2008) 1:13. doi: 10.1186/1755-8794-1-13
25. Chen Y, Hennessy KM, Botstein D, Tye BK. CDC46/MCM5, a Yeast Protein Whose Subcellular Localization Is Cell Cycle-Regulated, Is Involved in DNA Replication at Autonomously Replicating Sequences. Proc Natl Acad Sci USA (1992) 89(21):10459–63. doi: 10.1073/pnas.89.21.10459
26. Silva JM, Deuker MM, Baguley BC, McMahon M. PIK3CA-Mutated Melanoma Cells Rely on Cooperative Signaling Through Mtorc1/2 for Sustained Proliferation. Pigment Cell Melanoma Res (2017) 30(3):353–67. doi: 10.1111/pcmr.12586
27. Christine Mcdonald SV, Hearing P, Reich NC. Induction of Genes Involved in Cell Cycle Progression by Interleukin-4. J Interferon Cytokine Res (2004) 24:729–38. doi: 10.1089/jir.2004.24.729
28. Rajendra S, Sharma P, Gautam SD, Saxena M, Kapur A, Sharma P, et al. Association of Biomarkers for Human Papillomavirus With Survival Among Adults With Barrett High-Grade Dysplasia and Esophageal Adenocarcinoma. JAMA Netw Open (2020) 3(2):e1921189. doi: 10.1001/jamanetworkopen.2019.21189
29. Quan L, Qian T, Cui L, Liu Y, Fu L, Si C. Prognostic Role of Minichromosome Maintenance Family in Multiple Myeloma. Cancer Gene Ther (2020) 27:819–29. doi: 10.1038/s41417-020-0162-2
30. de Andrade BAB, León JE, Carlos R, Delgado-Azañero W, Mosqueda-Taylor A, de Almeida OP. Expression of Minichromosome Maintenance 2, Ki-67, and Geminin in Oral Nevi and Melanoma. Ann Diagn Pathol (2013) 17(1):32–6. doi: 10.1016/j.anndiagpath.2012.05.001
31. Soares CD, Borges CF, Sena-Filho M, Almeida OP, Stelini RF, Cintra ML, et al. Prognostic Significance of Cyclooxygenase 2 and Phosphorylated Akt1 Overexpression in Primary Nonmetastatic and Metastatic Cutaneous Melanomas. Melanoma Res (2017) 27(5):448–56. doi: 10.1097/CMR.0000000000000368
32. Gambichler T, Breininger A, Rotterdam S, Altmeyer P, Stücker M, Kreuter A. Expression of Minichromosome Maintenance Proteins in Merkel Cell Carcinoma. J Eur Acad Dermatol Venereol (2009) 23(10):1184–8. doi: 10.1111/j.1468-3083.2009.03285.x
33. Neves H, Kwok HF. In Sickness and in Health: The Many Roles of the Minichromosome Maintenance Proteins. Biochim Biophys Acta Rev Cancer (2017) 1868(1):295–308. doi: 10.1016/j.bbcan.2017.06.001
34. Nodin B, Fridberg M, Jonsson L, Bergman J, Uhlén M, Jirström K. High MCM3 Expression Is an Independent Biomarker of Poor Prognosis and Correlates With Reduced RBM3 Expression in a Prospective Cohort of Malignant Melanoma. Diagn Pathol (2012) 7:1–10. doi: 10.1186/1746-1596-7-82
35. Söling A, Sackewitz M, Volkmar M, Schaarschmidt D, Jacob R, Holzhausen H-J, et al. Minichromosome Maintenance Protein 3 Elicits a Cancer-Restricted Immune Response in Patients With Brain Malignancies and Is a Strong Independent Predictor of Survival in Patients With Anaplastic Astrocytoma. Clin Cancer Res (2005) 11(1):249–58.
36. Liu K, Kang M, Liao X, Wang R. Genome-Wide Investigation of the Clinical Significance and Prospective Molecular Mechanism of Minichromosome Maintenance Protein Family Genes in Patients With Lung Adenocarcinoma. PLoS One (2019) 14(7):e0219467. doi: 10.1371/journal.pone.0219467
37. Ladstein RG, Bachmann IM, Straume O, Akslen LA. Ki-67 Expression Is Superior to Mitotic Count and Novel Proliferation Markers PHH3, MCM4 and Mitosin as a Prognostic Factor in Thick Cutaneous Melanoma. BMC Cancer (2010) 10:1–15. doi: 10.1186/1471-2407-10-140
38. Orange JS. Unraveling Human Natural Killer Cell Deficiency. J Clin Invest (2012) 122(3):798–801. doi: 10.1172/JCI62620
39. Li S, Jiang Z, Li Y, Xu Y. Prognostic Significance of Minichromosome Maintenance mRNA Expression in Human Lung Adenocarcinoma. Oncol Rep (2019) 42(6):2279–92. doi: 10.3892/or.2019.7330
40. Su Z, Zheng X, Zhang X, Wang Y, Zhu S, Lu F, et al. Sox10 Regulates Skin Melanocyte Proliferation by Activating the DNA Replication Licensing Factor MCM5. J Dermatol Sci (2017) 85(3):216–25. doi: 10.1016/j.jdermsci.2016.12.002
41. Liu Z, Li J, Chen J, Shan Q, Dai H, Xie H, et al. MCM Family in HCC: MCM6 Indicates Adverse Tumor Features and Poor Outcomes and Promotes S/G2 Cell Cycle Progression. BMC Cancer (2018) 18(1):200. doi: 10.1186/s12885-018-4056-8
42. Boyd AS, Shakhtour B, Shyr Y. Minichromosome Maintenance Protein Expression in Benign Nevi, Dysplastic Nevi, Melanoma, and Cutaneous Melanoma Metastases. J Am Acad Dermatol (2008) 58(5):750–4. doi: 10.1016/j.jaad.2007.12.026
43. Yang Y, Ma S, Ye Z, Zhou X. MCM7 Silencing Promotes Cutaneous Melanoma Cell Autophagy and Apoptosis by Inactivating the AKT1/mTOR Signaling Pathway. J Cell Biochem (2019) 121(2):1283–94. doi: 10.1002/jcb.29361
44. Fujioka S, Shomori K, Nishihara K, Yamaga K, Nosaka K, Araki K, et al. Expression of Minichromosome Maintenance 7 (MCM7) in Small Lung Adenocarcinomas (Pt1): Prognostic Implication. Lung Cancer (2009) 65(2):223–9. doi: 10.1016/j.lungcan.2008.11.007
45. Zhang YX, He WB, Xiao WJ, Meng LL, Tan C, Du J, et al. Novel Loss-of-Function Mutation in MCM8 Causes Premature Ovarian Insufficiency. Mol Genet Genomic Med (2020) 8(4):e1165. doi: 10.1002/mgg3.1165
46. Luo Y, Schimenti JC. MCM9 Deficiency Delays Primordial Germ Cell Proliferation Independent of the ATM Pathway. Genesis (2015) 53(11):678–84. doi: 10.1002/dvg.22901
47. Guo T, Zheng Y, Li G, Zhao S, Ma J, Qin Y. Novel Pathogenic Mutations in Minichromosome Maintenance Complex Component 9 (MCM9) Responsible for Premature Ovarian Insufficiency. Fertility Sterility (2020) 113(4):845–52. doi: 10.1016/j.fertnstert.2019.11.015
48. Kang P, Han Z, Liao Z, Zhang H, Jia W, Tian Y. Knockdown of MCM10 Gene Impairs Glioblastoma Cell Proliferation, Migration and Invasion and the Implications for the Regulation of Tumorigenesis. J Mol Neurosci (2020) 70(5):759–68. doi: 10.1007/s12031-020-01486-y
49. Hao S, Zhao J, Zhou J, Zhao S, Hu Y, Hou Y. Modulation of 17beta-Estradiol on the Number and Cytotoxicity of NK Cells In Vivo Related to MCM and Activating Receptors. Int Immunopharmacol (2007) 7(13):1765–75. doi: 10.1016/j.intimp.2007.09.017
Keywords: melanoma, minichromosome maintenance, prognosis, TCGA, bioinformatics
Citation: Han W, Wu Y-Z, Zhao X-Y, Gong Z-H and Shen G-L (2021) Integrative Analysis of Minichromosome Maintenance Proteins and Their Prognostic Significance in Melanoma. Front. Oncol. 11:715173. doi: 10.3389/fonc.2021.715173
Received: 26 May 2021; Accepted: 29 July 2021;
Published: 19 August 2021.
Edited by:
Nihal Ahmad, University of Wisconsin-Madison, United StatesReviewed by:
Jasmine George, Medical College of Wisconsin, United StatesSandhya Annamaneni, Osmania University, India
Copyright © 2021 Han, Wu, Zhao, Gong and Shen. This is an open-access article distributed under the terms of the Creative Commons Attribution License (CC BY). The use, distribution or reproduction in other forums is permitted, provided the original author(s) and the copyright owner(s) are credited and that the original publication in this journal is cited, in accordance with accepted academic practice. No use, distribution or reproduction is permitted which does not comply with these terms.
*Correspondence: Guo-Liang Shen, sdfyysgl@163.com; Zhen-Hua Gong, gzhua@ntu.edu.cn; Xiao-Yu Zhao, 13776125762@163.com
†These authors have contributed equally to this work