 Feiya Zhu
 Tianru Yang1,2,3
- 1Department of Prosthodontics, Center of Stomatology, Xiangya Hospital, Central South University, Changsha, China
- 2Research Center of Oral and Maxillofacial Tumor, Xiangya Hospital, Central South University, Changsha, China
- 3Institute of Oral Cancer and Precancerous Lesions, Central South University, Changsha, China
N6-methyladenosine (m6A) modification is the most prevalent modification on eukaryotic RNA, and the m6A modification regulators were involved in the progression of various cancers. However, the functions of m6A regulators in oral squamous cell carcinoma (OSCC) remain poorly understood. In this study, we demonstrated that 13 of 19 m6A-related genes in OSCC tissues are dysregulated, and HNRNPA2B1 was the most prognostically important locus of the 19 m6A regulatory genes in OSCC. Moreover, HNRNPA2B1 expression is elevated in OSCC, and a high level of HNRNPA2B1 is significantly associated with poor overall survival in OSCC patients. Functional studies, combined with further analysis of the correlation between the expression of HNRNPA2B1 and the EMT-related markers from the TCGA database, reveal that silencing HNRNPA2B1 suppresses the proliferation, migration, and invasion of OSCC via EMT. Collectively, our work shows that HNRNPA2B1 may have the potential to promote carcinogenesis of OSCC by targeting EMT via the LINE-1/TGF-β1/Smad2/Slug signaling pathway and provide insight into the critical roles of HNRNPA2B1 in OSCC.
Introduction
Oral squamous cell carcinoma (OSCC) is a major type of oral cancer which caused an estimated 177,384 deaths in 2018 (1). The incidence of OSCC has increased in recent years, especially in young adults (<40 years old) (2). Despite the great progress of therapy in the last three decades, the survival of patients with OSCC has not changed significantly (3, 4), encouraging clinicians and researchers to look for promising molecular targets or factors that might modify the disease outcome.
Recent studies have shown that chemical modifications on RNA contribute to gene expression control that is linked to human cancers (5). N6-Methyladenosine (m6A) is one of the most abundant modifications in eukaryotic messenger RNAs (mRNAs) (6). More than 10,000 m6A peaks have been identified on over 25% of transcripts, with an average of one to three modifications per transcript (6–8). The m6A modification is dynamic and reversible in mammalian cells, which could be installed by methyltransferases (writers) consisting of METTL3 (methyltransferase-like 3), METTL14, WTAP (Wilms tumor 1-associated protein), KIAA1429, RBM15 (RNA-binding motif protein 15), and its paralog (RBM15B), whereas its removal is regulated by demethylases (erasers) such as FTO (fat mass and obesity-associated) and ALKBH5 (ALKB homolog 5). In addition, the specific RNA-binding proteins (readers), including the YT521-B homology (YTH) domain family and certain members of the heterogeneous nuclear ribonucleoprotein (HNRNP) family, could recognize and bind to the m6A motif, regulating RNA metabolism including RNA stability, degradation, pre-mRNA splicing, transport, nuclear export, localization, translation, and other processes (9, 10). Abnormal m6A modifications regulate the expression of target genes acting as proto-oncogene or tumor suppressor in the initiation and progression of a wide range of tumors (9, 11), including acute myeloid leukemia (AML) (12, 13), lung squamous cell carcinoma (LSCC) (14, 15), glioblastoma stem-like cell (GSC) (16, 17), human hepatocellular carcinoma (HHC) (18–20), breast cancer (BC) (21, 22), and ovarian cancer (OC) (23, 24). Accumulating evidence has shown that the m6A components METTL3 and ALKBH5 are closely related with OSCC tumorigenesis, metastasis (25, 26), and cisplatin resistance (27) in the last few years. Heterogeneous nuclear ribonucleoproteins A2B1 (HNRNPA2B1), one of the members of the HNRNP family, is a pre-mRNA-binding protein that participates in mRNA subcellular localization, stability, and translation (28). Additionally, elevated HNRNPA2B1 level was reported in various tumors (29–31). It is said that HNRNPA2B1 promotes the progression of esophageal cancer by upregulating ACLY and ACC1 (30). However, whether HNRNPA2B1 could promote the development of OSCC is not yet clear.
In this study, we systematically analyzed the expression of 19 m6A-related genes using The Cancer Genome Atlas (TCGA) dataset, as well as the prognostic role of m6A regulators in OSCC through univariate Cox regression analysis and LASSO Cox regression model. The results show that a four-gene prognostic signature including METTL3, YTHDF3, HNRNPC, and HNRNPA2B1 could predict overall survival of OSCC patients. After a comprehensive analysis, we found that HNRNPA2AB1 is an independent prognostic risk factor for OSCC. Combining with the clinical data from our hospital and in vitro functional studies, we found that HNRNPA2B1 may act as an oncogenic role in OSCC progression. Our previous study reported that LINE-1 might regulate the OSCC proliferation, migration, and invasion through epithelial and mesenchymal transition (EMT). Here, in the current study, we found that HNRNPA2B1 may mediate the EMT process by regulating LINE-1 expression, thereby promoting the proliferation and metastasis of OSCC cells, indicating that HNRNPA2B1 may be a novel factor with the potential to regulate the proliferation and migration of OSCC cells by targeting EMT via the LINE-1/TGF-β1/Smad2/Slug signaling pathway.
Materials and Methods
Patient Tumor Sections
The tumor samples (primary OSCC tissue specimens and adjacent matched normal mucosa tissues) were obtained from 38 OSCC patients with or without lymph node metastasis who underwent surgery at the Department of Oral and Maxillofacial Surgery of the Second Xiangya Hospital. These patients underwent surgery between April 2011 and July 2013, and the follow-up period used for survival analyses ended in May 2018. No patients involved in this investigation received chemotherapy before surgery. Tumor histology and grading were classified according to the WHO guidelines. The details of the patients used in this study are present in Table 1.
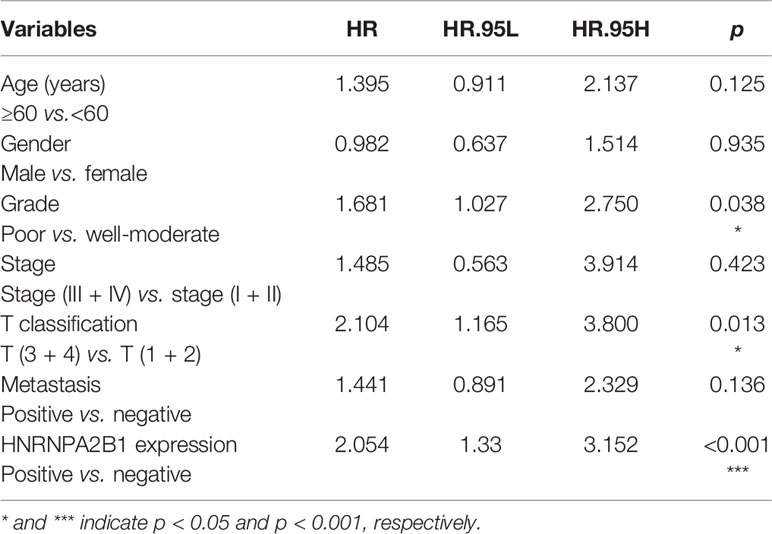
Table 1 Statistical analyses of factors associated with survival in OSCC patients with the multivariate Cox proportional hazards models.
Immunohistochemical Staining and Analysis
Immunohistochemistry (IHC) was performed to evaluate HNRNPA2B1 and LINE-1 expression using the standard protocol. The tissue sections were dewaxed with xylenes, hydrated with graded alcohols. Endogenous peroxidase was inhibited with 3% hydrogen peroxide. Antigen retrieval was performed using citrate buffer (pH 6.0) in a microwave oven. Anti-rabbit HNRNPA2B1 (1:50, ProteinTech, USA) and anti-mouse ORF1p (1:500, Sigma-Aldrich, Germany) primary antibodies were used to the sections overnight at 4°C, then incubated with a secondary antibody for an hour at room temperature. Signals were visualized by using a 3,30-diaminobenzidine (DAB) detection kit (DakoCytomation, Denmark). Sections were counterstained with hematoxylin, dehydrated, and mounted. The expressions of HNRNPA2B1 and ORF-1p are scored by two researchers. For each specimen, one score was assigned according to the percentage of positive cells: <25%: one point; 26%–50%: two points: 51%–75%, three points; and 76%–100%: four points. A second score was assigned according to the intensity of the staining, with negative staining equaling 0, weak staining equaling one point, moderate staining equaling two points, and strong staining equaling three points. IHC score was then calculated by multiplying the two scores described above. If the expression score was ≥5, the tissue was considered as positive expression.
m6A Component Transcriptome Profiling Obtaining and Differential Analysis
The transcriptome profiles of 330 OSCC and 32 normal cases were downloaded from TCGA (https://tcga-data.nci.nih.gov/tcga/). TCGA is a publicly available dataset. No ethics approval was needed. Based on previous literatures, we have identified 19 m6A-related genes, including METTL3, METTL14, METTL16, WTAP, KIAA1429, RBM15, FTO, ALKBH5, ZC3H13, YTHDF1, YTHDF2, YTHDF3, YTHDC1, YTHDC2, HNRNPC, HNRNPA2B1, LRPPRC, IGF2BP1, and FMR1. Differential expression analysis was performed in R software, with the cutoff value of |log2(fold change [FC]|>2 and p <0.05. The heatmap and boxplot were constructed using the ggplot2 package in R software.
Cluster Analysis and Principal Component Analysis
Cluster analysis was performed according to the m6A-related gene transcriptome profiles. Meanwhile, the result of cluster analysis was used to make a principal component analysis (PCA). The patient’s clinical data of survival time and survival status were extracted from 330 OSCC samples. The correlation analysis between clinical features and clustering results was performed through R. Finally, heatmaps were constructed through “pheatmap,” survival, and “survminer” packages.
Survival Analysis
In this study, we performed three survival analyses. For the first analysis, we divided all OSCC patients from the TCGA database into cluster 1 and cluster 2 based on the results of cluster analysis. For the second analysis, we divided OSCC patients into high-risk groups and low-risk groups according to the Cox regression model. For the third analysis, we divided the OSCC patient samples from the department or TCGA database into positive expression and negative expression, or high expression (with counts higher than the median) and low expression (with counts lower than the median). Then, we used the Kaplan–Meier method to analyze the candidate genes of significant prognostic value with p < 0.05.
Cox Risk Regression Establishment
First, the original expression profile data of m6A-related genes were normalized by log2(x + 1), and prognosis-associated factors were selected by univariate Cox regression. Next, we performed Cox regression analysis combined with LASSO regression to establish a risk regression and the penalty regularization parameter lambda (λ) was chosen through the cross-validation routine with an n-fold equal to 10 by using R package “glmnet” (32). Meanwhile, “lambda.min” was identified to pick out the variables. Finally, HNRNPA2B1, METTL3, YTHDF3, and HNRNPC were enrolled in risk Cox regression and survival analysis. Moreover, univariate and multivariate Cox regressions are performed through survival and “forestplot” packages to identify the independent prognostic factor of OSCC. Moreover, we evaluate the reliability of the risk regression through “survivalROC” package in R software.
Machine Learning
To identify the key gene of m6A, we used the caret package to construct three different machine learning models to investigate features of importance involving 19 m6A-related genes. Neural network (nn), random forest (rf), and gradient boosting machine (gbm) were used to rank the 19 genes by their expression levels in two disease states (tumor and normal). The most important feature of the three models was selected as the key gene; results were visualized by ggplot2 package.
EMT Scores and Gene Set Enrichment Analysis
To provide a quantitative estimate of EMT, we constructed a model by multinominal logistic regression; each sample is given EMT scores, which range from 0 (pure epithelial) to 2 (pure mesenchymal), with a score of 1 indicating a maximal hybrid epithelial/mesenchymal (E/M) phenotype (33). The transcriptome profiles of OSCC used for GSEA were downloaded from TCGA (https://tcga-data.nci.nih.gov/tcga/) and GEO data (https://www.ncbi.nlm.nih.gov/geo/query/acc.cgi?acc=GSE138206). GSEA (34, 35) was performed with KEGG gene set (c2) or oncogenic signature gene set (c6) collections of the Molecular Signature Database v7.0(http://www.gsea-msigdb.org/gsea/downloads.jsp).
Cell Culture, Antibodies, and Reagent
CAL27 and SCC4 cells were cultured in Dulbecco’s modified Eagle medium (DMEM) supplemented with 10% fetal bovine serum (Invitrogen, Germany), 2 mM L-glutamine (Invitrogen, Germany), and antibiotics (50 μg/ml penicillin–streptomycin, Invitrogen, Germany). Mouse anti-α-tubulin, rabbit anti-E-cadherin (24E10), and anti-N-cadherin (D4R1H) were from Cell Signaling Technology (Beverly, MA). Rabbit anti-Snail and anti-TGF-β1 were from Abcam (Cambridge, MA). Rabbit anti-HNRNPA2B1 was from ProteinTech (Rosemont, IL, USA), and mouse anti-ORF1p was purchased from Sigma-Aldrich (clone 4H1, Germany).
RNA Interference
Commercial shRNA plasmid vectors (U6–MCS–Ubiquitin–Cherry–IRES–puromycin) carrying target-specific ENAuences against human HNRNPA2B1 and non-target scrambled control were purchased from GeneChem (Shanghai, China). Lentiviral particles were produced in HEK293T packaging cells with shRNA, psPAX2 (#12260, Addgene), and pMD2.G (#12259, Addgene) plasmids. Then, CAL27 and SCC4 cells were infected with 0.45-μm-pore filtered viral supernatants. Infected cells of CAL27 and SCC4 were selected for 2 weeks using 1 μg/ml puromycin. The expression of HNRNPA2B1 was confirmed by RT-PCR and Western blot. Oligonucleotide sequences for shRNAs are the following: HNRNPA2B1 shRNA#1 and shRNA#2 are 5′-TGACAACTATGGAGGAGGAAA-3′ and 5′-AGAAGCTGTTTGTTGGCGGAA-3′, respectively. The sequence of scrambled shRNA is 5′-TTCTCCGAACGTGTCACGT-3′.
HNRNPA2B1 Overexpression
The HNRNPA2B1 overexpression lentiviral vector-plasmid (GV208, Ubi-MCS-HNRNPA2B1-EGFP) was purchased from GeneChem (Shanghai, China) and used to transfect the HEK293T packaging cells. CAL27 and SCC4 cells were transfected with lentivirus containing HNRNPA2B1 cDNA for subsequent analysis.
Quantitative Real-Time Polymerase Chain Reaction
Total RNA was isolated using TRIzol Reagent (Invitrogen, Thermo Fisher Scientific, USA) and reserved transcribed with TaqMan Reverse Transcription Reagents Kit (Applied Biosystems, Foster City CA). The resulting cDNAs (5 μl) were used as templates for qRT-PCR with specific primers including HNRNPA2B1 (forward: 5′-TAGTACTACAGGTTGCTGCC-3′, reverse: 5′-CTGTGAGGCTAGACTAGTAGT-3′) and GAPDH (forward: 5′-ACAACTTTGGTATCGTGGAAGG-3′, reverse: 5′-GCCATCACGCCACAGTTTC-3). qRT-PCR was carried out with Power SYBR Green PCR Master Mix. The qRT-PCR cycling conditions were as follows: 95°C for 10 s; 40 cycles of 95°C for 5 s, 60°C for 20 s, 95°C for 60 s, 55°C for 30 s, and 95°C for 30 s. Fold changes were determined by comparing the ΔCT value of each product normalized to GAPDH as an internal control.
Western Blot Analysis
The whole-cell lysates were prepared using RIPA lysis buffer according to the standard protocol. For Western blot, 15 μg protein for each group was resolved by SDS-PAGE and transferred onto polyvinyldinefluoride (PVDF) membranes (Millipore, Billerica, MA). The membranes were blocked with appropriate primary antibodies indicated above. After incubating with secondary antibody, the membranes were visualized with enhanced chemiluminescence and the bands were analyzed with ImageJ software.
Cell Proliferation Assay
Cell proliferation was measured using Cell Counting Kit-8 (CCK8, Bimake, Houston, TX, USA) assay. CAL27 and SCC4 cells were seeded in 96-well plates, three wells for each group, with each well containing 2*103 cells. At 24, 48, 72, 96, and 120 h, 10 μl of CCK8 reagent was added to each well and the cells were incubated for 1 h at 37°C. Then the absorbance at 450 nm was measured using the microplate reader.
Wound Healing Assay
CAL27 and SCC4 shRNA stable cells were plated in six-well plates at a density of 2.5 × 10⁶ cells/well. After the cells reached 100% confluency, straight wounds were made by using 200-μl tips and the cells were incubated in medium with 1% FBS. The healing of the gap was captured at 0, 24, 48, and 72 h. Experiments were repeated at least three times.
Cell Invasion Assay
Cell invasion assays were performed in 24-well plates using chambers with 8-μm pores (Corning Incorporated, Kennebunk, ME, USA) coated with an indicator layer of growth factor reduced Matrigel. 5 × 10⁴ CAL27 and SCC4 stable cells were seeded in the upper chamber under serum-free conditions, and DMEM with 10% FBS was placed in the lower chamber. After 24 h, cells on the upper chamber were scraped and washed away; cells on the lower chambers were fixed in 4% formaldehyde and stained with 0.5% crystal violet for 20 min. Next, the invasion cell numbers of each field were counted via microscope.
m6A RNA Methylation Assay
TRIzol (Thermo Fisher Scientific, Waltham, MA, USA) was used to extract total RNA from OSCC patients’ tissue samples. m6A methylation was quantified according to the guideline of m6A RNA Methylation Assay Kit (ab185912, Abcam, Cambridge, MA).
RNA Immunoprecipitation Assay
RIP was performed with Magna RIP RNA-binding protein immunoprecipitation kits (Millipore, Billerica, MA). Antibodies against HNRNPA2B1 were used. Total RNA from cells was extracted and depleted of ribosomal RNA. The RNA protein complexes were washed and mixed with 900 μl RIP Immunoprecipitation Buffer. Next, RNA was purified with 150 μl proteinase K buffer. Finally, RNAs were extracted and evaluated by qRT-PCR, which was normalized to input and IgG.
The primers of LINE-1 are forward: 5′-GGGCTGCACCTGTCAAGATA-3′, reverse: 5′-ACCTTGCCATCTTTTCCCGT-3′.
Statistical Analysis
All analyses were performed with the SPSS 25.0 software (SPSS Inc., USA), R software (Version 4.0.3), and GraphPad Prism software version 7.0 (GraphPad Software, Inc., La Jolla, CA, USA). If there are no special instructions, all bioinformatics analysis and visualization in this study are performed using R software. Statistical significance was determined by Student’s t-test. The analysis of overall survival and progression-free survival time was calculated using the Kaplan–Meier method, and the differences in survival between the groups were compared using a log-rank test. The effect of clinicopathological factors on survival was determined with univariate and multivariate Cox proportional hazard models. Correlations between HNRNPA2B1 and EMT marker expression levels were computed using Pearson correlation analysis. Data from three independent experiments were presented as mean ± SD. A p-value of <0.05 was considered statistically significant. *, **, *** and **** indicated p < 0.05, p < 0.01, p < 0.001 and p < 0.001, respectively.
Results
m6A Level and m6A Regulatory Genes Were Abnormally Expressed in OSCC
More and more evidence showed that m6A RNA methylation promotes tumor initiation and progression. However, there are fewer studies to explore the role of m6A in OSCC. To study the role of m6A regulatory genes in OSCC, we detect the m6A level in OSCC and normal adjacent tissues. The result showed that the m6A level upregulated in tumor tissues compared with normal adjacent tissues (Figure 1B). Further, we evaluated all 19 m6A-related genes in 330 OSCC samples and 32 normal samples from the TCGA database, including METTL3, METTL14, METTL16, WTAP, KIAA1429, RBM15, FTO, ALKBH5, ZC3H13, YTHDF1, YTHDF2, YTHDF3, YTHDC1, YTHDC2, HNRNPC, HNRNPA2B1, LRPPRC, IGF2BP1, and FMR1. The expression profiles of these genes were extracted from the transcriptome data, and it was found that 13 genes were abnormally expressed in tumor tissues compared with control (Figures 1A, C).
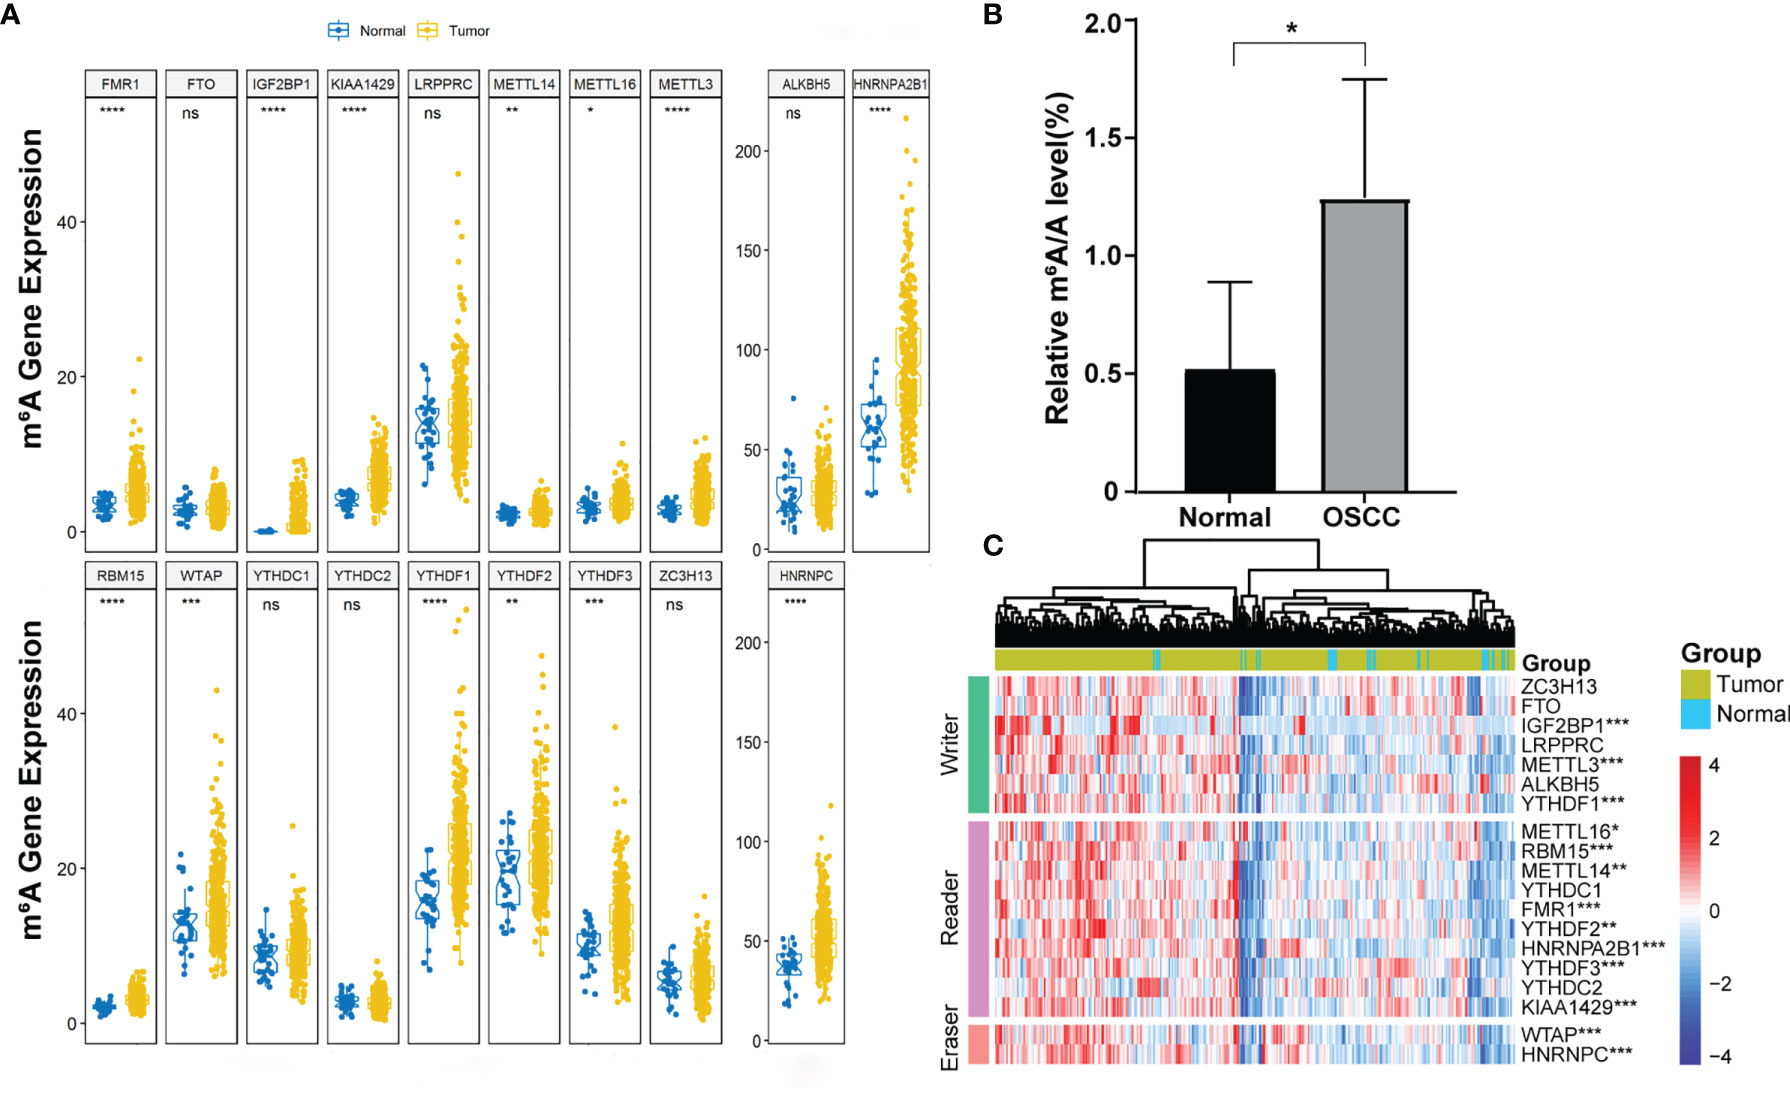
Figure 1 The expression of 19 m6A-related genes in OSCC. (A) Boxplot visualizing the expression of m6A-related genes in 330 OSCC samples and 32 normal samples. (B) m6A level was detected in six pairs of OSCC tissues and adjacent normal tissues (p < 0.05). (C) The expression levels of 19 m6A-related genes in OSCC were displayed via a heatmap. The ascending normalized expression level in the heatmaps is colored from blue to red. *, **, *** and **** indicated p<0.05, p<0.01, p<0.001 and p<0.0001, respectively. “ns” indicates no significance.
Consensus Clustering of m6A-Related Genes Identified Two Clusters of OSCC With Different Clinical Outcomes
Cluster analysis was performed to analyze the 330 OSCC samples from the TCGA database. Based on the expression similarity of m6A-related genes, k = 2 was demonstrated to be the most appropriated selection to divide the OSCC patient cohort into two clusters, namely, cluster 1 and cluster 2 (Figures 2A, B). Subsequently, the overall survival rate of the two clusters estimated by Kaplan–Meier was significantly different (Figure 2C). On the basis of correlation analysis of clinical characteristics, an obvious difference was found between cluster 1 and cluster 2 for the metastasis, stage, and T classification, while no significant difference was observed for other parameters such as age, gender, and grade (Figure 2D).
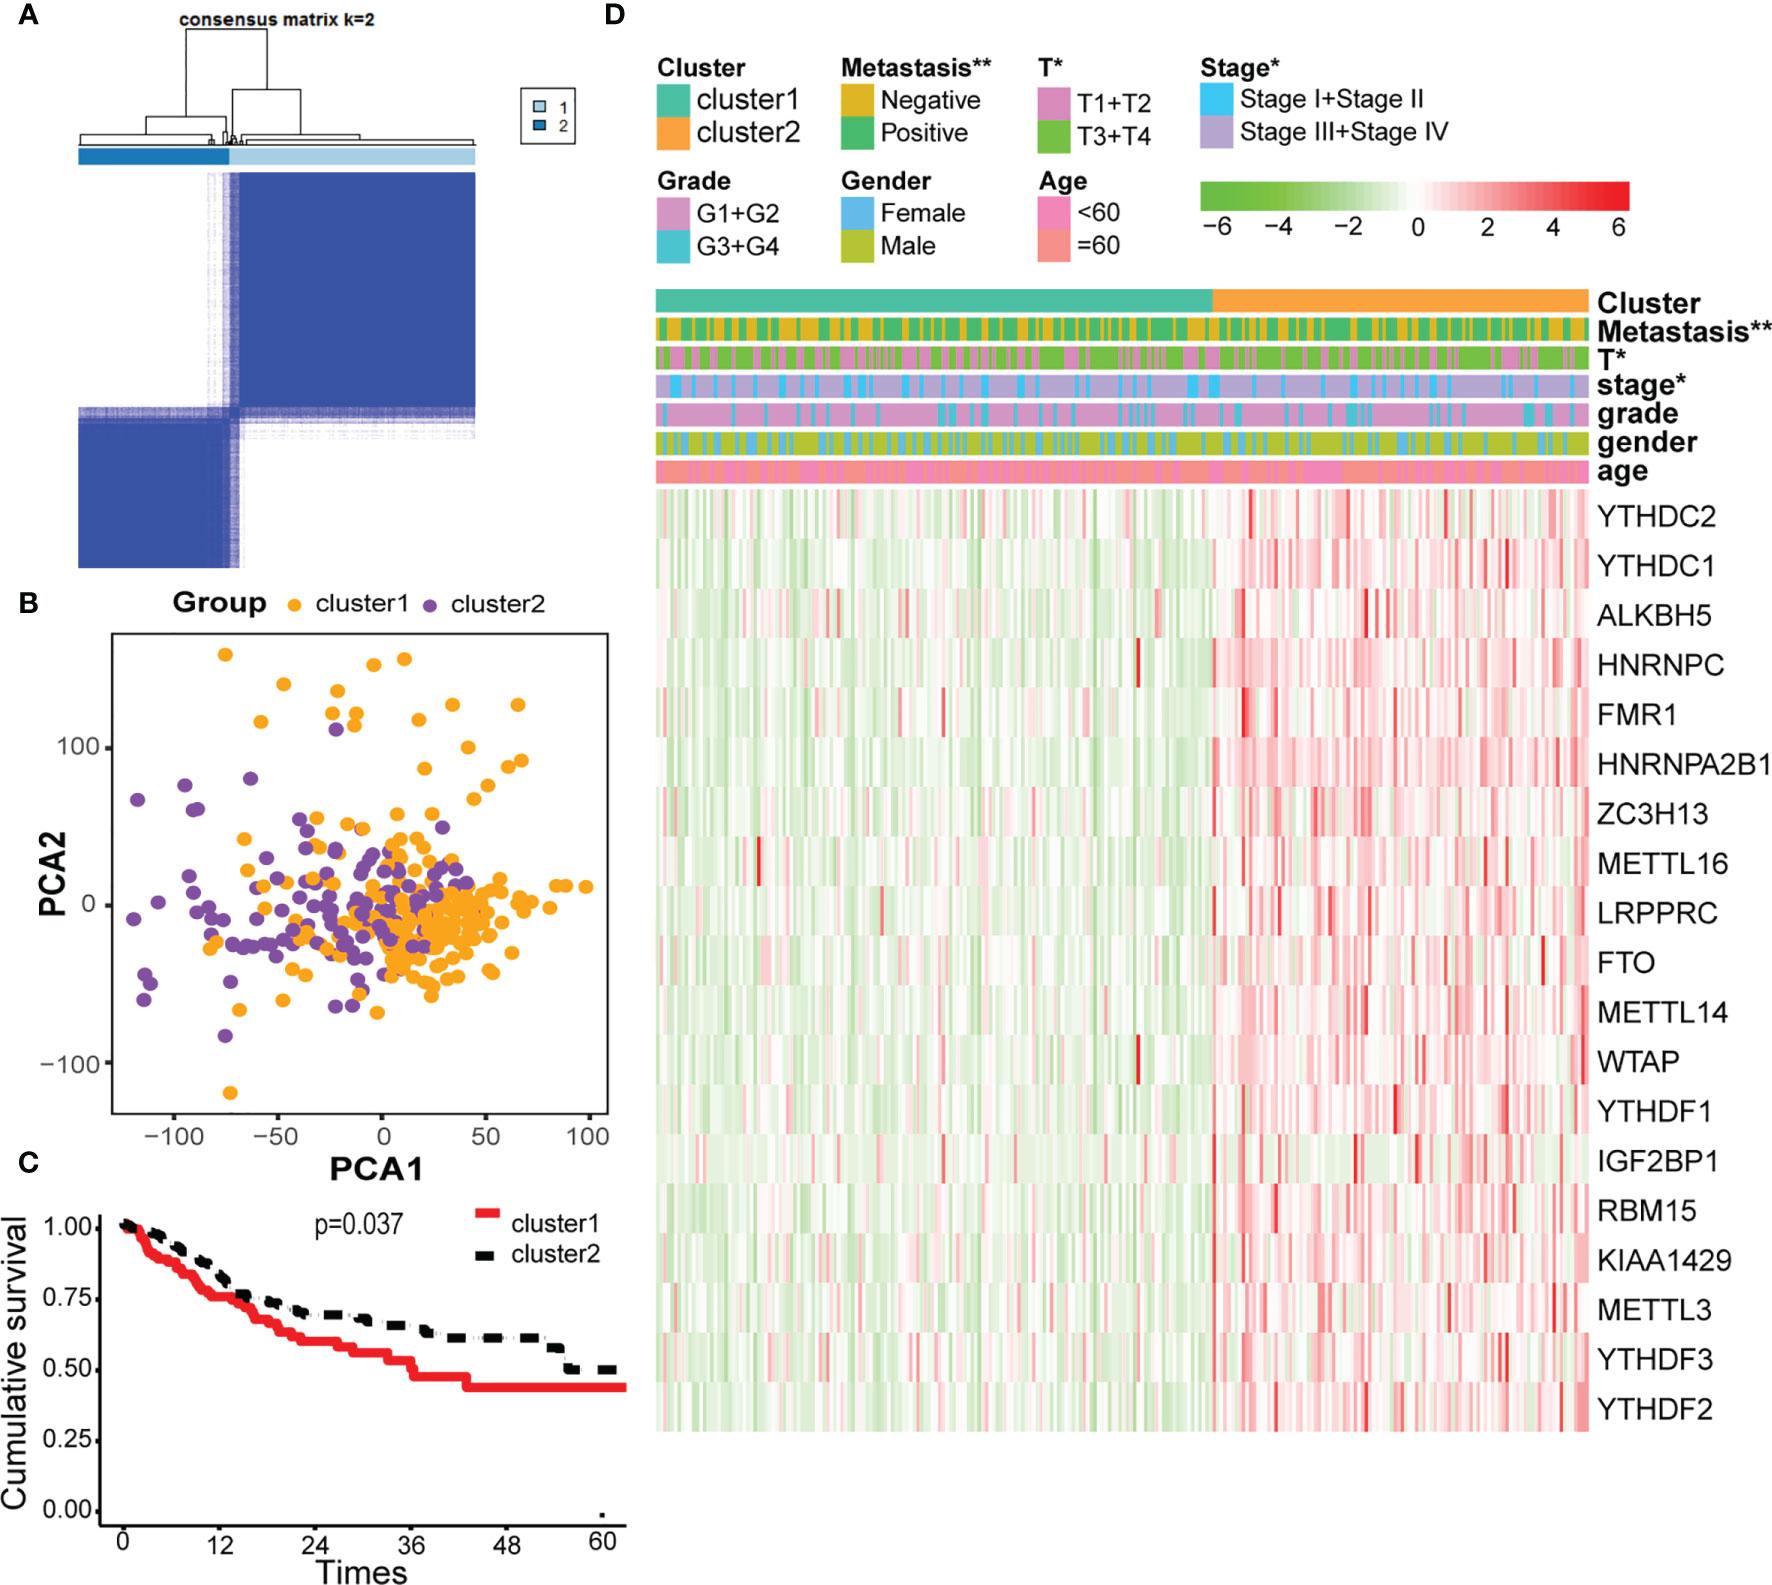
Figure 2 Cluster analysis based on m6A-related genes. (A) Consensus matrix for the two groups from the TCGA database. (B) Principal component analysis (PCA) score plot of the two clusters has few overlaps. (C) Overall survival analysis between cluster 1 and cluster 2. (D) Heatmap of the 19 m6A-related genes, showing distinct expression profiles for correlation of cluster analysis and clinical characteristics. * and ** indicated p<0.05 and p<0.01, respectively.
The Prognostic Signature-Based Risk Score Was an Independent Prognostic Factor in the TCGA OSCC Cohort
Univariate and multivariate Cox regression analyses were used to identify the m6A-related genes that are associated with OS in the TCGA OSCC cohort. The results show that METTL3, YTHDF3, HNRNPC, and HNRNPA2B1 might be independent biomarkers in OSCC (Figures 3A, B). Furthermore, LASSO Cox regression was performed to determine variables (Figures 3C, D). Finally, four variables including METTL3, YTHDF3, HNRNPC, and HNRNPA2B1 were selected in Cox regression. The risk score for each patient was calculated with the following formula: risk scores = (0.1378*HNRNPA2B1) + (0.0036*METTL3) + (0.0021*YTHDF3) + (0.0095*HNRNPC). Then, all patients were grouped into the high-risk group and low-risk group, respectively. The survival analysis showed that the OSCC patients in the high-risk group had a significantly shorter overall survival than those in the low-risk group (Figure 3F). The prognostic signature model showed good prediction efficiency with the area under the ROC curve (AUC) value equal to 0.632 (Figure 3E). There were significant differences between the high-risk and low-risk groups with respect to the metastasis and T classification (Figure 3I). Here, we found that risk score may be an independent prognostic risk factor for OSCC (Figures 3G, H).
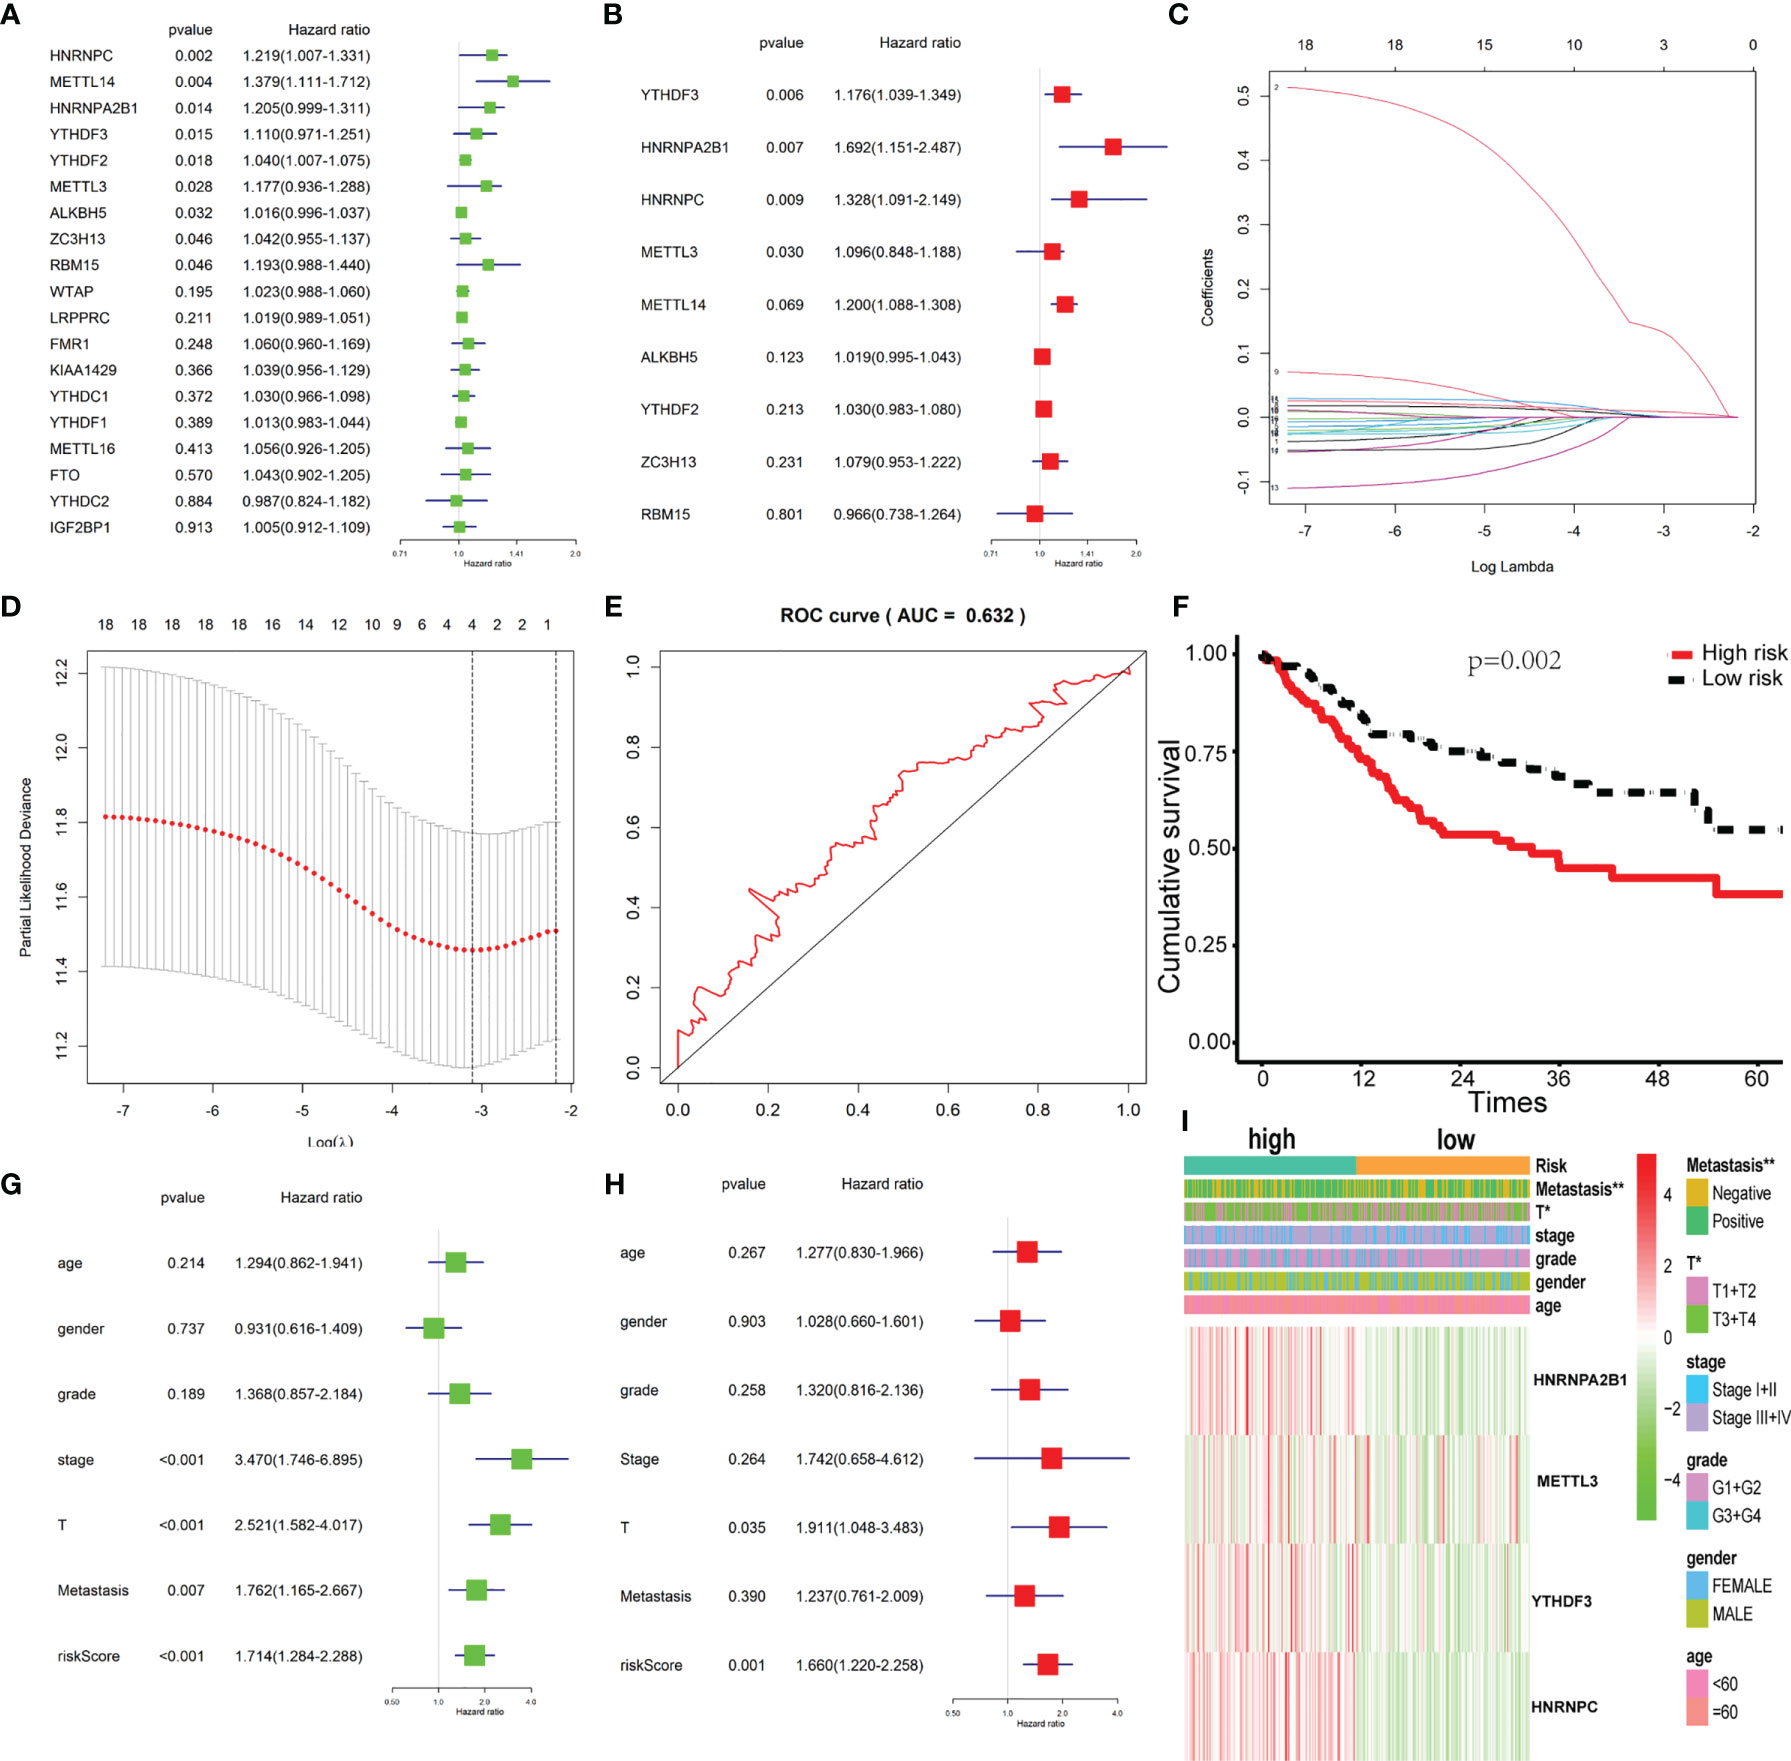
Figure 3 Construction of the Cox regression model and validation of the prognostic signature. (A, B) Univariate and multivariate cox regression based on 19 m6A-related genes. (C) LASSO coefficient profiles of 19 m6A-related genes associated with the overall survival of OSCC; each curve represents a gene. (D) Partial likelihood deviance is shown against log (lambda). The vertical dotted line indicated the lambda value with the minimum error and the largest lambda value, where the deviance is within one SE of the minimum. (E) The prognostic signature model showed good prediction efficiency with the area under the ROC curve (AUC = 0.632). (F) Survival analysis based on risk score. (G, H) Univariate cox regression and multivariate cox regression according to risk score and clinical characteristics. (I) The heatmap of risk score level and clinical characteristics. * and ** indicated p<0.05 and p<0.01, respectively.
HNRNPA2B1 Expression Is Upregulated in OSCC
To evaluate the important characteristics of the 19 m6A-related genes, we used the neural network (nn), random forest (rf), and gradient boosting machine (gbm) to build predictive models, respectively (Figures 4A–C). We found that the HNRNPA2B1 gene was consistently ranked the highest among the 19 genes in the three models, and it was selected as the most prognostically important locus of the 19 m6A regulatory genes in OSCC. Combining with the results of the previous univariate and multivariate Cox regression analyses, HNRNPA2B1 was selected to conduct further research. After analyzing the relationship between HNRNPA2B1 and each clinical parameter from the TCGA database, we found that HNRNPA2B1 was overexpressed in tumors (Figure 4D) and HNRNPA2B1 expression was significantly correlated with tumor stage, T-class, and metastasis (Figures 4E–G) but without grade (Figure 4H). Moreover, the mRNA expression of HNRNPA2B1 was examined in eight patients’ fresh cervical lymph nodes samples (four lymph node metastasis and four non-lymph node metastasis) by real-time PCR. The results showed that HNRNPA2B1 mRNA levels in lymph node metastasis patients were generally much higher than those in non-lymph node metastasis patients (the mean CT values of tumor samples with or without lymph node metastasis were 15.2572 and 16.5325, respectively. The mean ΔCT values were -0.675 and 0.1675, respectively, and the mean fold changes were 1.794 and 0.829, respectively) (Figure 4I). Moreover, to evaluate the expression of HNRNPA2B1 in OSCC, we examined HNRNPA2B1 expression of 38 OSCC patient tissues from our department by immunohistochemistry (IHC) staining. The expression status of HNRNPA2B1 was observed mainly in the nucleus of cells. After the IHC was scored, the results indicated lower HNRNPA2B1 expression in normal cases and higher expression in tumor tissues and metastatic lymph node (Figures 4J, K). These results were consistent with the HNRNPA2B1 mRNA expression results from the TCGA database (Figure 4D). Fold changes were determined by comparing the ΔCT value of each product normalized to GAPDH as an internal control.
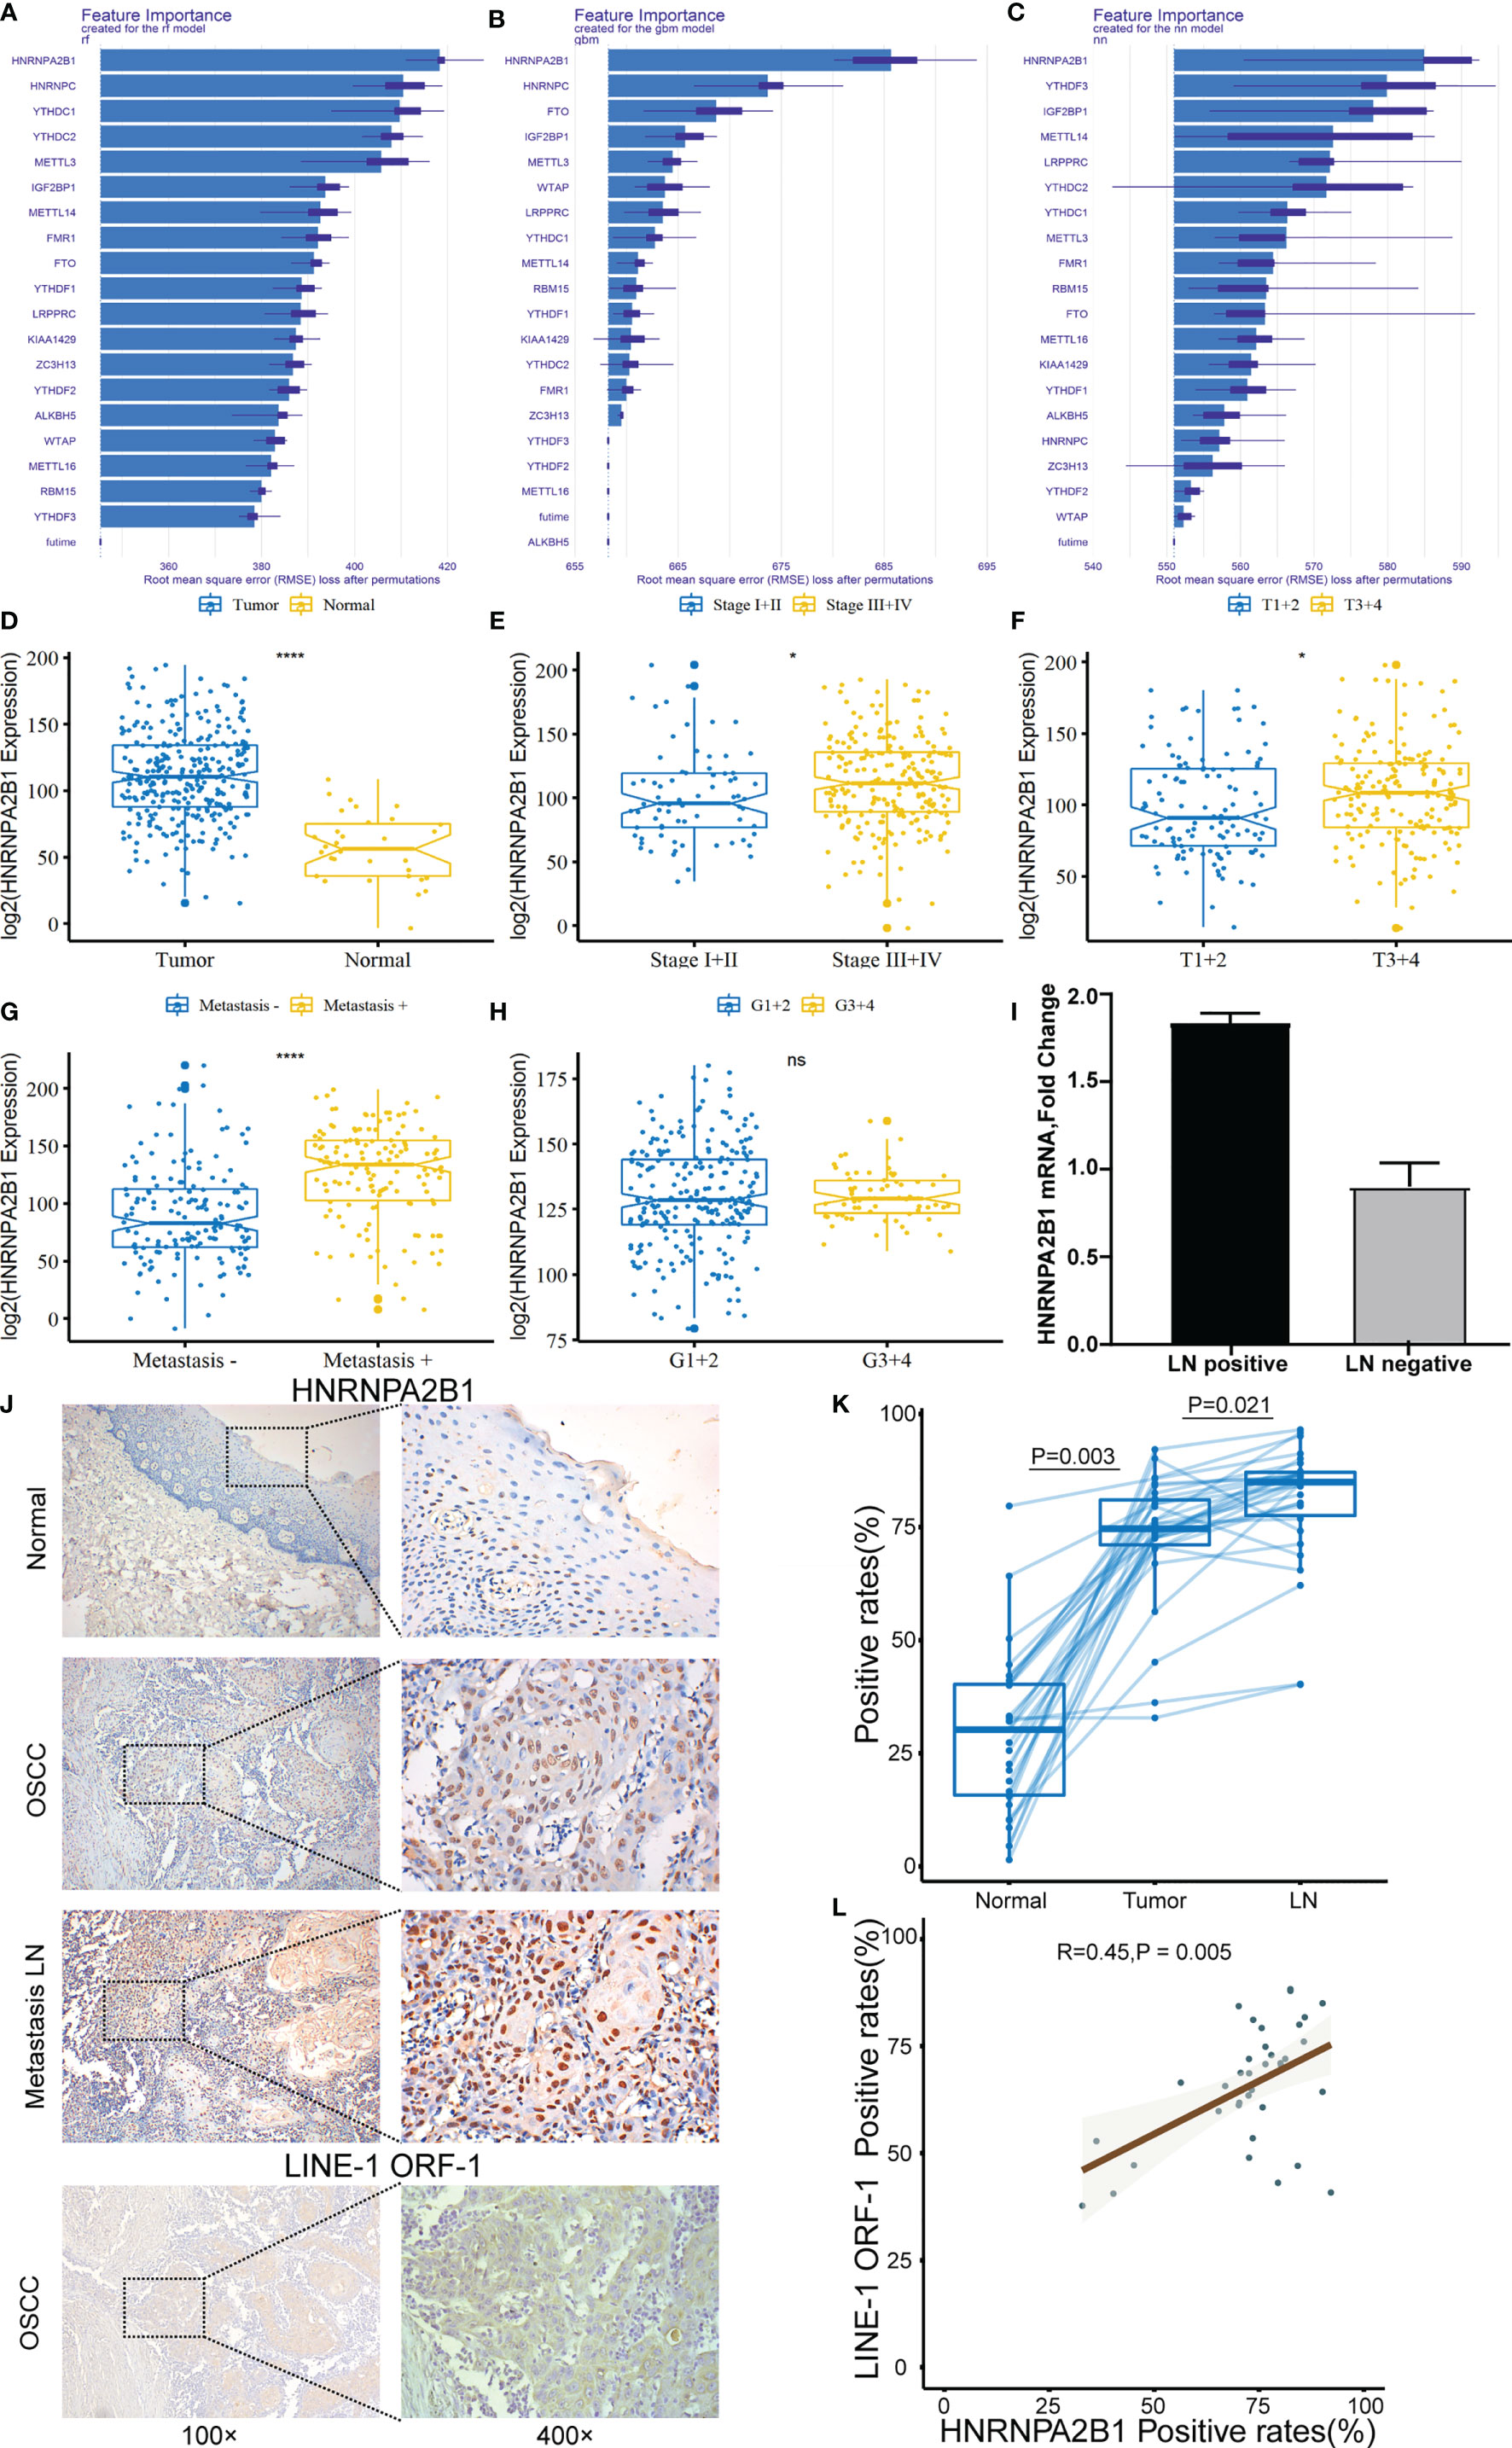
Figure 4 The correlation between HNRNPA2B1 and clinicopathologic parameters of OSCC. (A–C) Rank chart for the 19 m6A regulatory genes by neural network, random forest (rf), and gradient boosting machine (gbm). (D) HNRNPA2B1 expression is higher in tumor tissues compared with normal tissues. High HNRNPA2B1 expression was significantly associated with (E) tumor stage, (F) T categories, and (G) metastasis. (H) HNRNPA2B1 expression was not associated with histological grade (p > 0.05). (I) The mRNA expression of HNRNPA2B1 in patients with or without lymph node metastasis was detected by RT-PCR. (J) Representative images of immunohistochemical staining and (K) quantification of HNRNPA2B1 in human normal mucosa, OSCC tissue, and metastasis LN. Metastasis means at least one lymph node metastasis, local or distant metastasis. (L) LINE-1 expression is positively correlated with HNRNPA2B1 expression according to the analysis results of the IHC score. * and **** indicated p<0.05 and p<0.0001, respectively. “ns” indicates no significance.
Increased HNRNPA2B1 Expression Is Associated With OSCC Progression
According to the follow-up data of the 38 OSCC patients from our department, we found that patients with high HNRNPA2B1 expression had a significantly poor 5-year OS compared with those with low expression of HNRNPA2B1 (p < 0.05, Figure 5A). The survival analysis from TCGA further validated this result (p < 0.05, Figure 5B). The univariate and multivariate Cox proportional hazards regression analyses revealed that HNRNPA2B1 expression was an independent prognostic factor for poor OS (p < 0.001, Table 1). Interestingly, the relationship between HNRNPA2B1 expression and the clinicopathological characteristics was statistically analyzed, and the results showed a direct association between HNRNPA2B1 expression and histological grade and metastasis (Table 2). Here, the definition of smoking is as follows: participants who smoked more than 100 cigarettes were classified as smokers (36). The definition of drinking is as follows: the participant had drunk alcohol regularly (i.e., drank at least once a week on a regular basis) during the past 12 months, otherwise were considered non-drinkers (37).
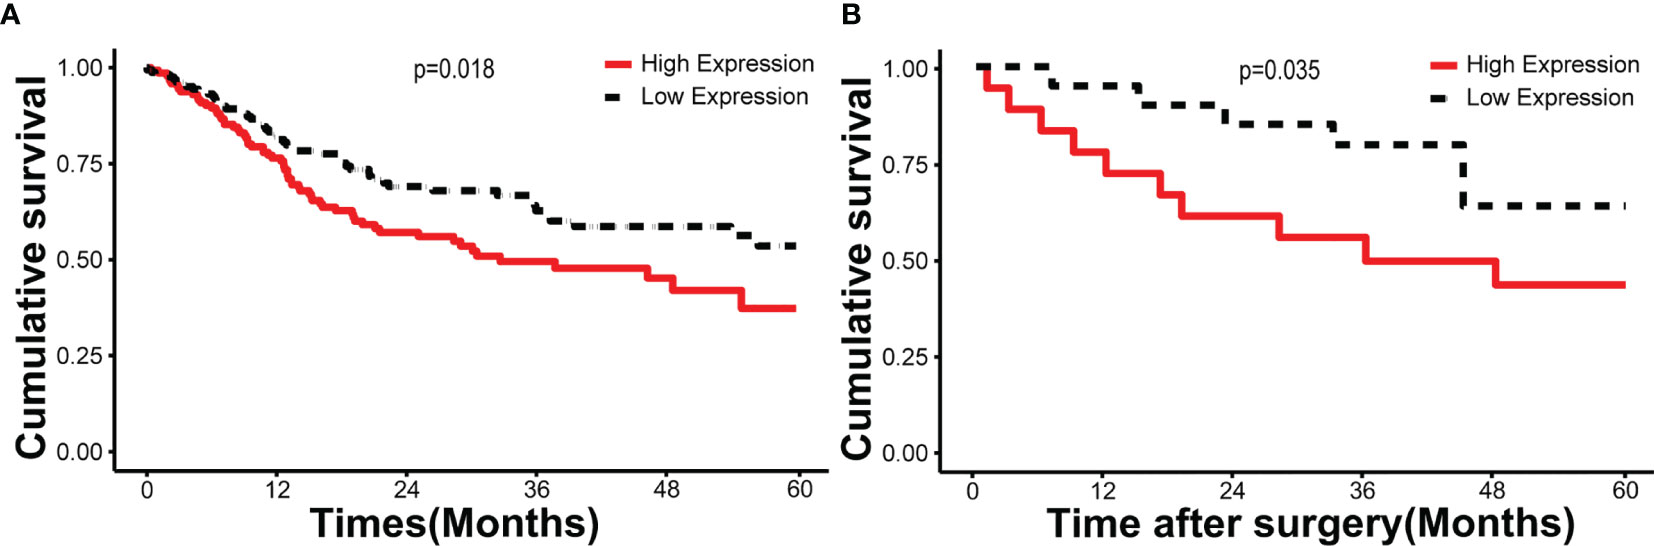
Figure 5 HNRNPA2B1 is associated with prognosis in patients with OSCC. Kaplan–Meier survival of (A) 330 cases from the TCGA database and (B) 38 patients from our department.
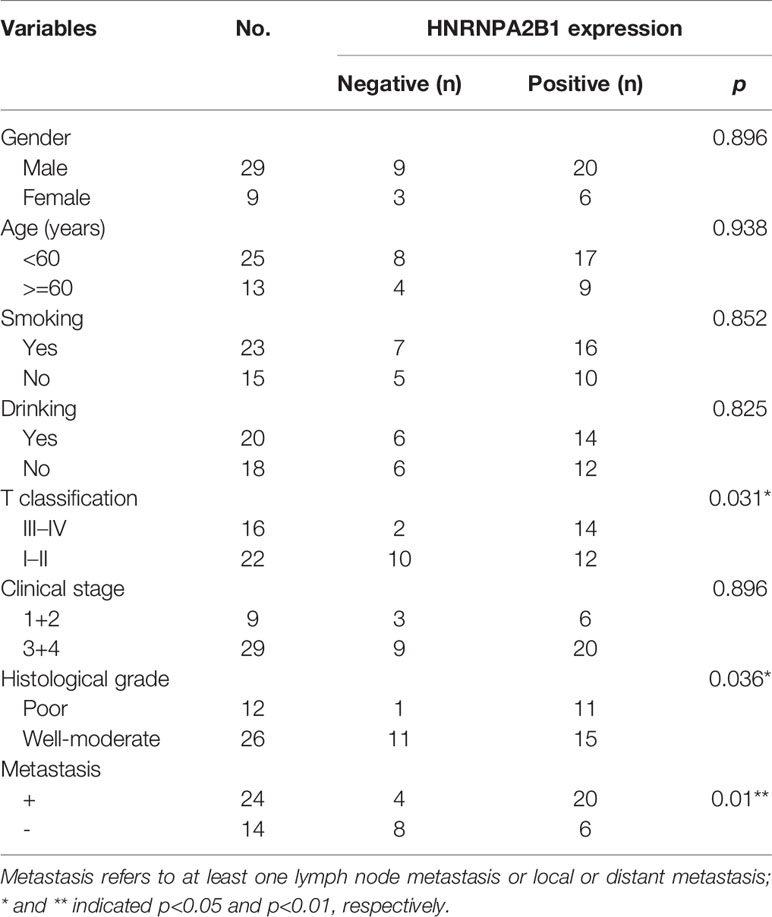
Table 2 Association between the clinicopathological characteristics and HNRNPA2B1 expression in 38 OSCC patients.
HNRNPA2B1 Expression Was Positively Related With the Proliferation, Migration, and Invasion of OSCC Cells In Vitro
CAL27 cell and SCC4 cell were selected to establish HNRNPA2B1 knockdown and overexpress stable cell lines by lentiviral vectors. Western blot was used to measure the knockdown efficacy (Figure 6A).
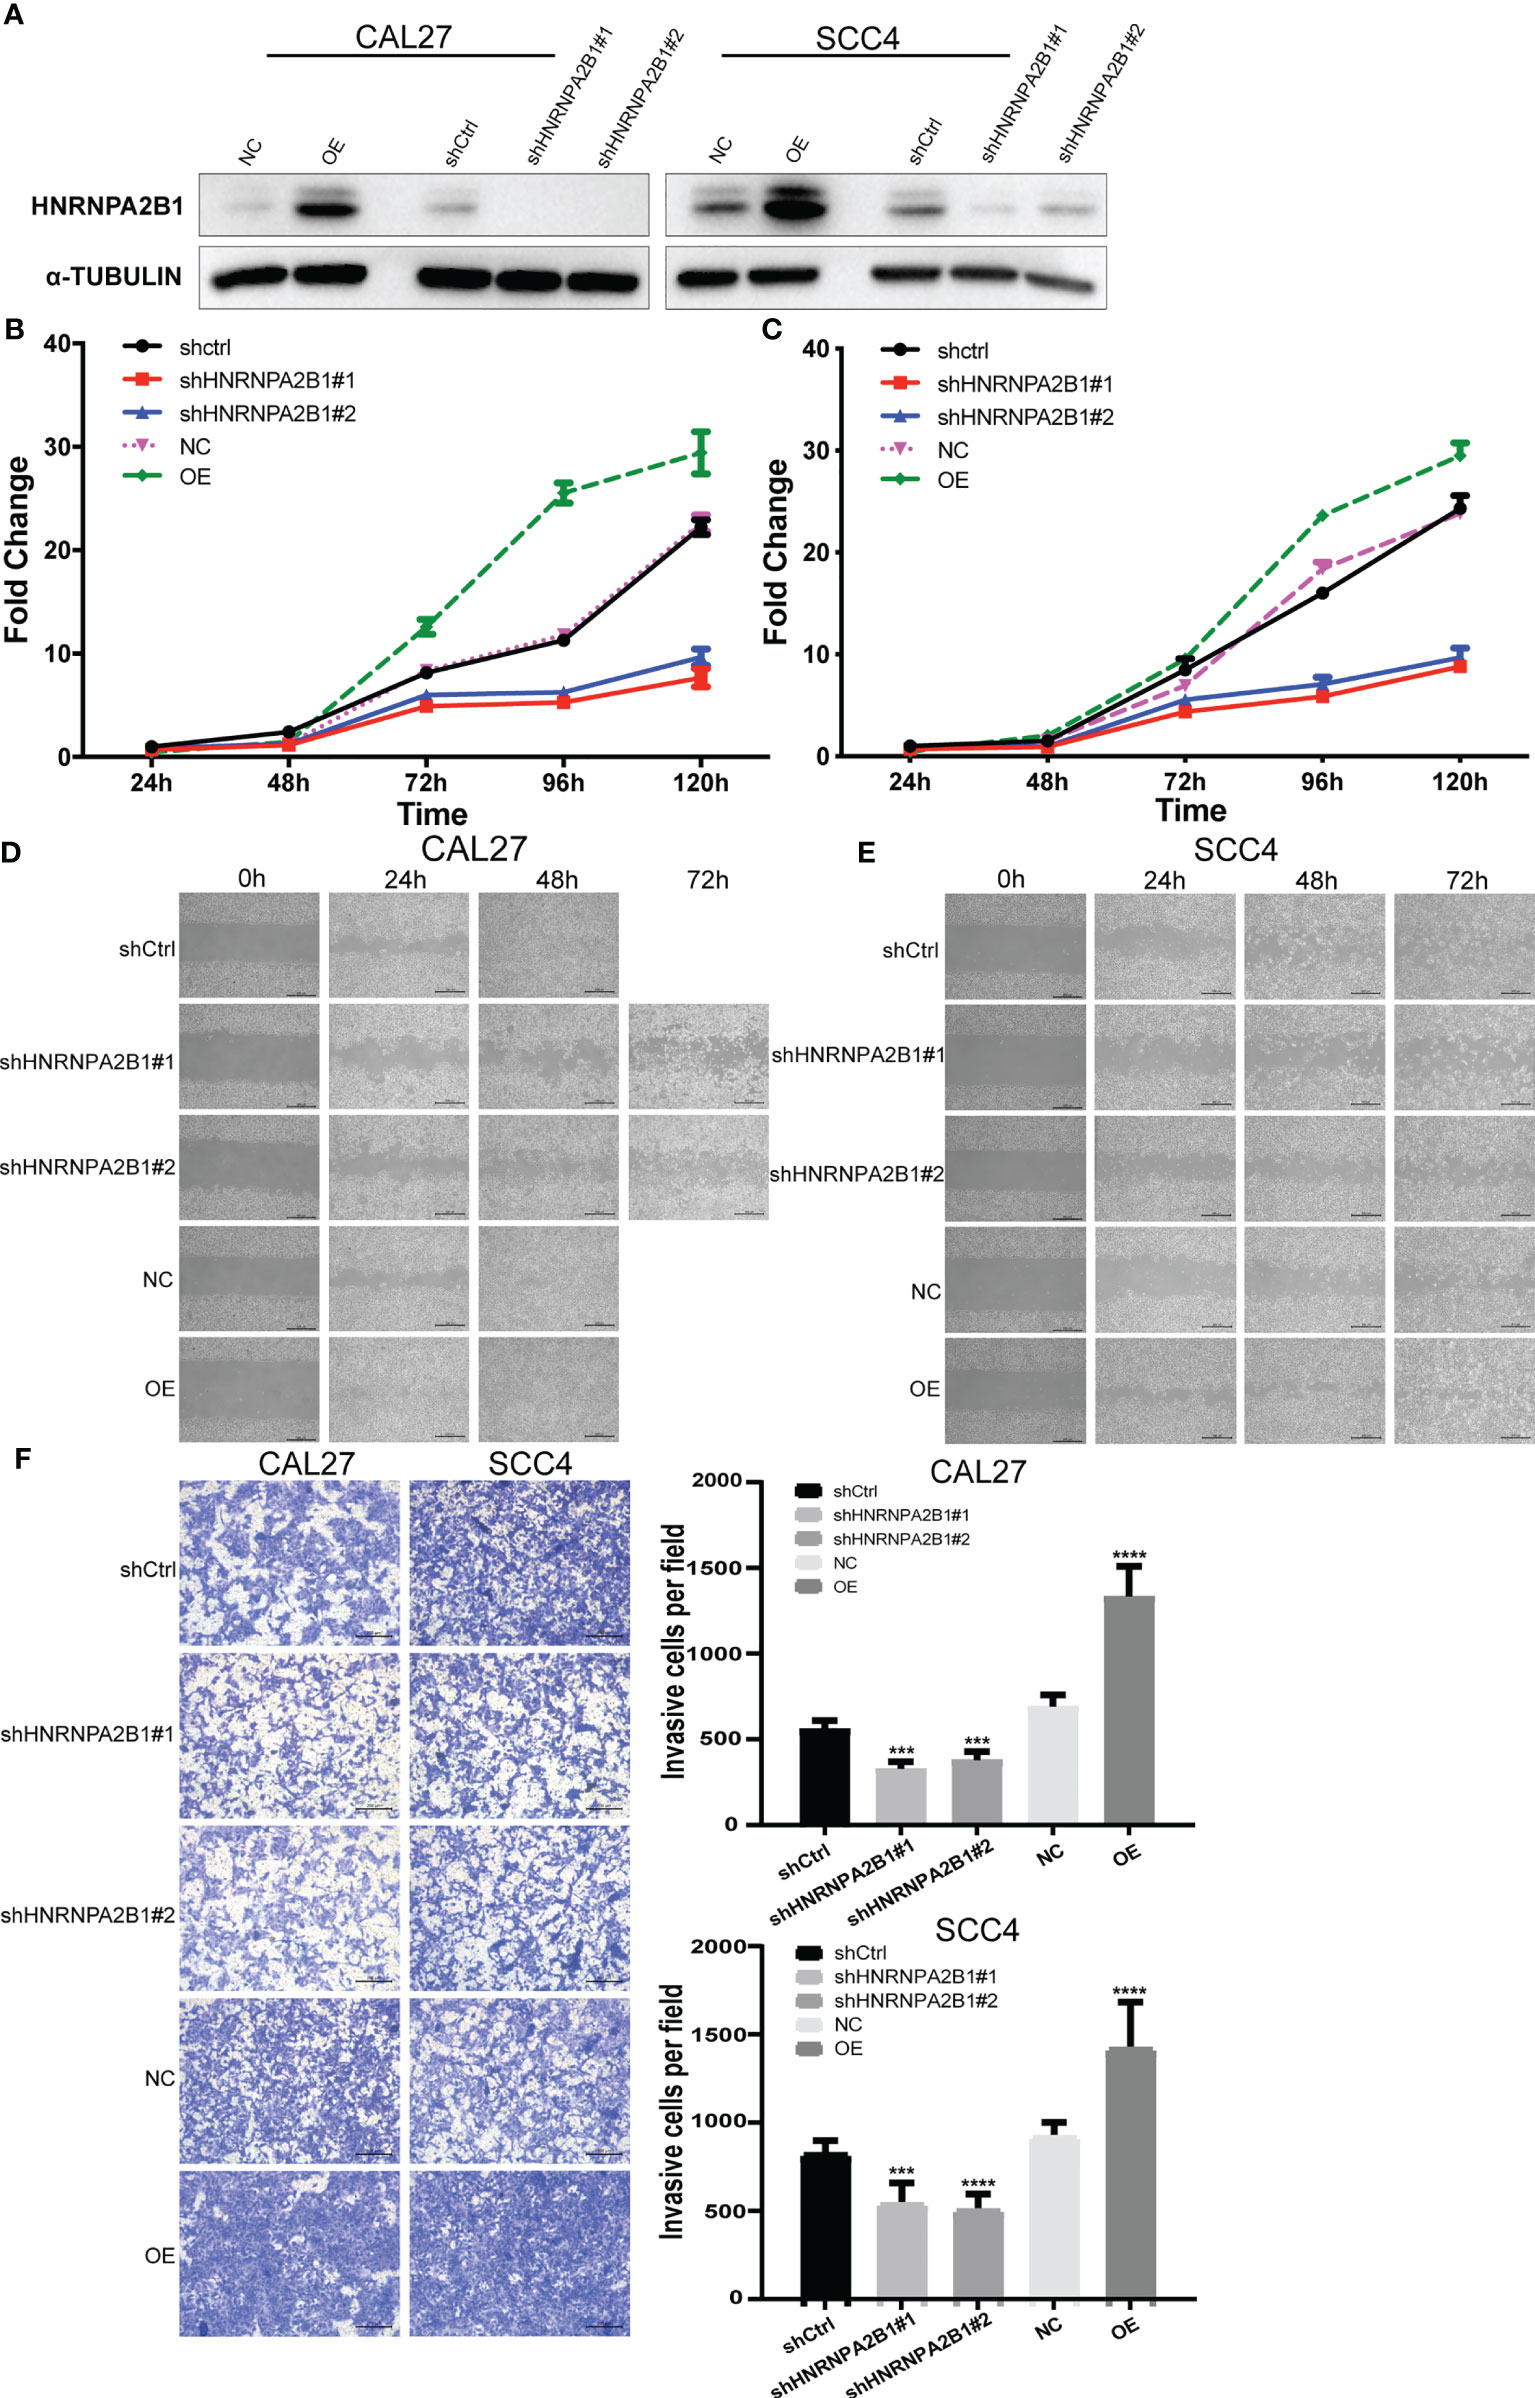
Figure 6 The expression of HNRNPA2B1 significantly affected the proliferation, migration, and invasion in OSCC cell lines. (A) Western blot was used to detect the protein expression after stable knockdown or overexpress HNRNPA2B1 in CAL27 and SCC4 cell lines. (B, C) Knockdown of HNRNPA2B1 inhibited cell proliferation as indicated by CCK-8 assay in CAL27 and SCC4 cells. On the contrary, overexpression of HNRNPA2B1 could enhance its proliferation. (D, E) Wound healing assay showed that downregulation of HNRNPA2B1 inhibits cell migration while HNRNPA2B1 overexpression could increase cell migration in CAL27 and SCC4. (F) Trans-well assay showed that the invasion abilities of CAL27 and SCC4 cells were impaired after knocking down HNRNPA2B1 and were increased after overexpression of HNRNPA2B1 compared with those of the control group. The left panel shows the representative images. The right panel shows the statistic data of the left panel. The data are presented as the mean of three independent experiments. *** and **** indicated p<0.001 and p<0.0001, respectively.
The CCK8 assay indicated that downregulation of HNRNPA2B1 significantly inhibited cell growth compared with the control (**p < 0.01) (Figures 6B, C). Wound healing assay was performed to determine the role of HNRNPA2B1 in regulating OSCC cell migration. After knocking down HNRNPA2B1#1 and HNRNPA2B1#2, the cell migration ability was remarkably suppressed (Figures 6D, E). In addition, Transwell assay showed a significant decrease in the HNRNPA2B1 knockdown group (Figure 6F). We also found that overexpression of HNRNPA2B1 could enhance the proliferation, migration, and invasion ability of OSCC cells (Figures 6B–F). Together, we found that HNRNPA2B1 was positively correlated with OSCC progression.
Altered Expression of HNRNPA2B1 Induces Epithelial and Mesenchymal Transition Changes
As a tumor-related gene, HNRNPA2B1 is associated with tumor progression (30). To investigate the mechanisms, we divided the OSCC patients into two groups (HNRNPA2B1 low expression group and HNRNPA2B1 high expression group). Through GSEA, we found that the top upregulated gene sets in the HNRNPA2B1 high expression group were related to EMT, such as tight junction, focal adhesion, adherens junction, and TGF-β signaling pathway (Figures 7B, C). Moreover, the HNRNPA2B1 high expression group had a higher EMT score (Figure 7A) and multiple EMT markers were differential expression in the HNRNPA2B1 high and low expression group (Figures 7D–G). Epithelial–mesenchymal transition (EMT) is always observed at invasive OSCC and is significantly correlated with metastasis in tumor progression (38). In this study, we showed that reduced expression of HNRNPA2B1 in OSCC cells leads to decreased proliferation, migration, and invasion. These results illuminate that HNRNPA2B1 may promote OSCC progression by regulates EMT.
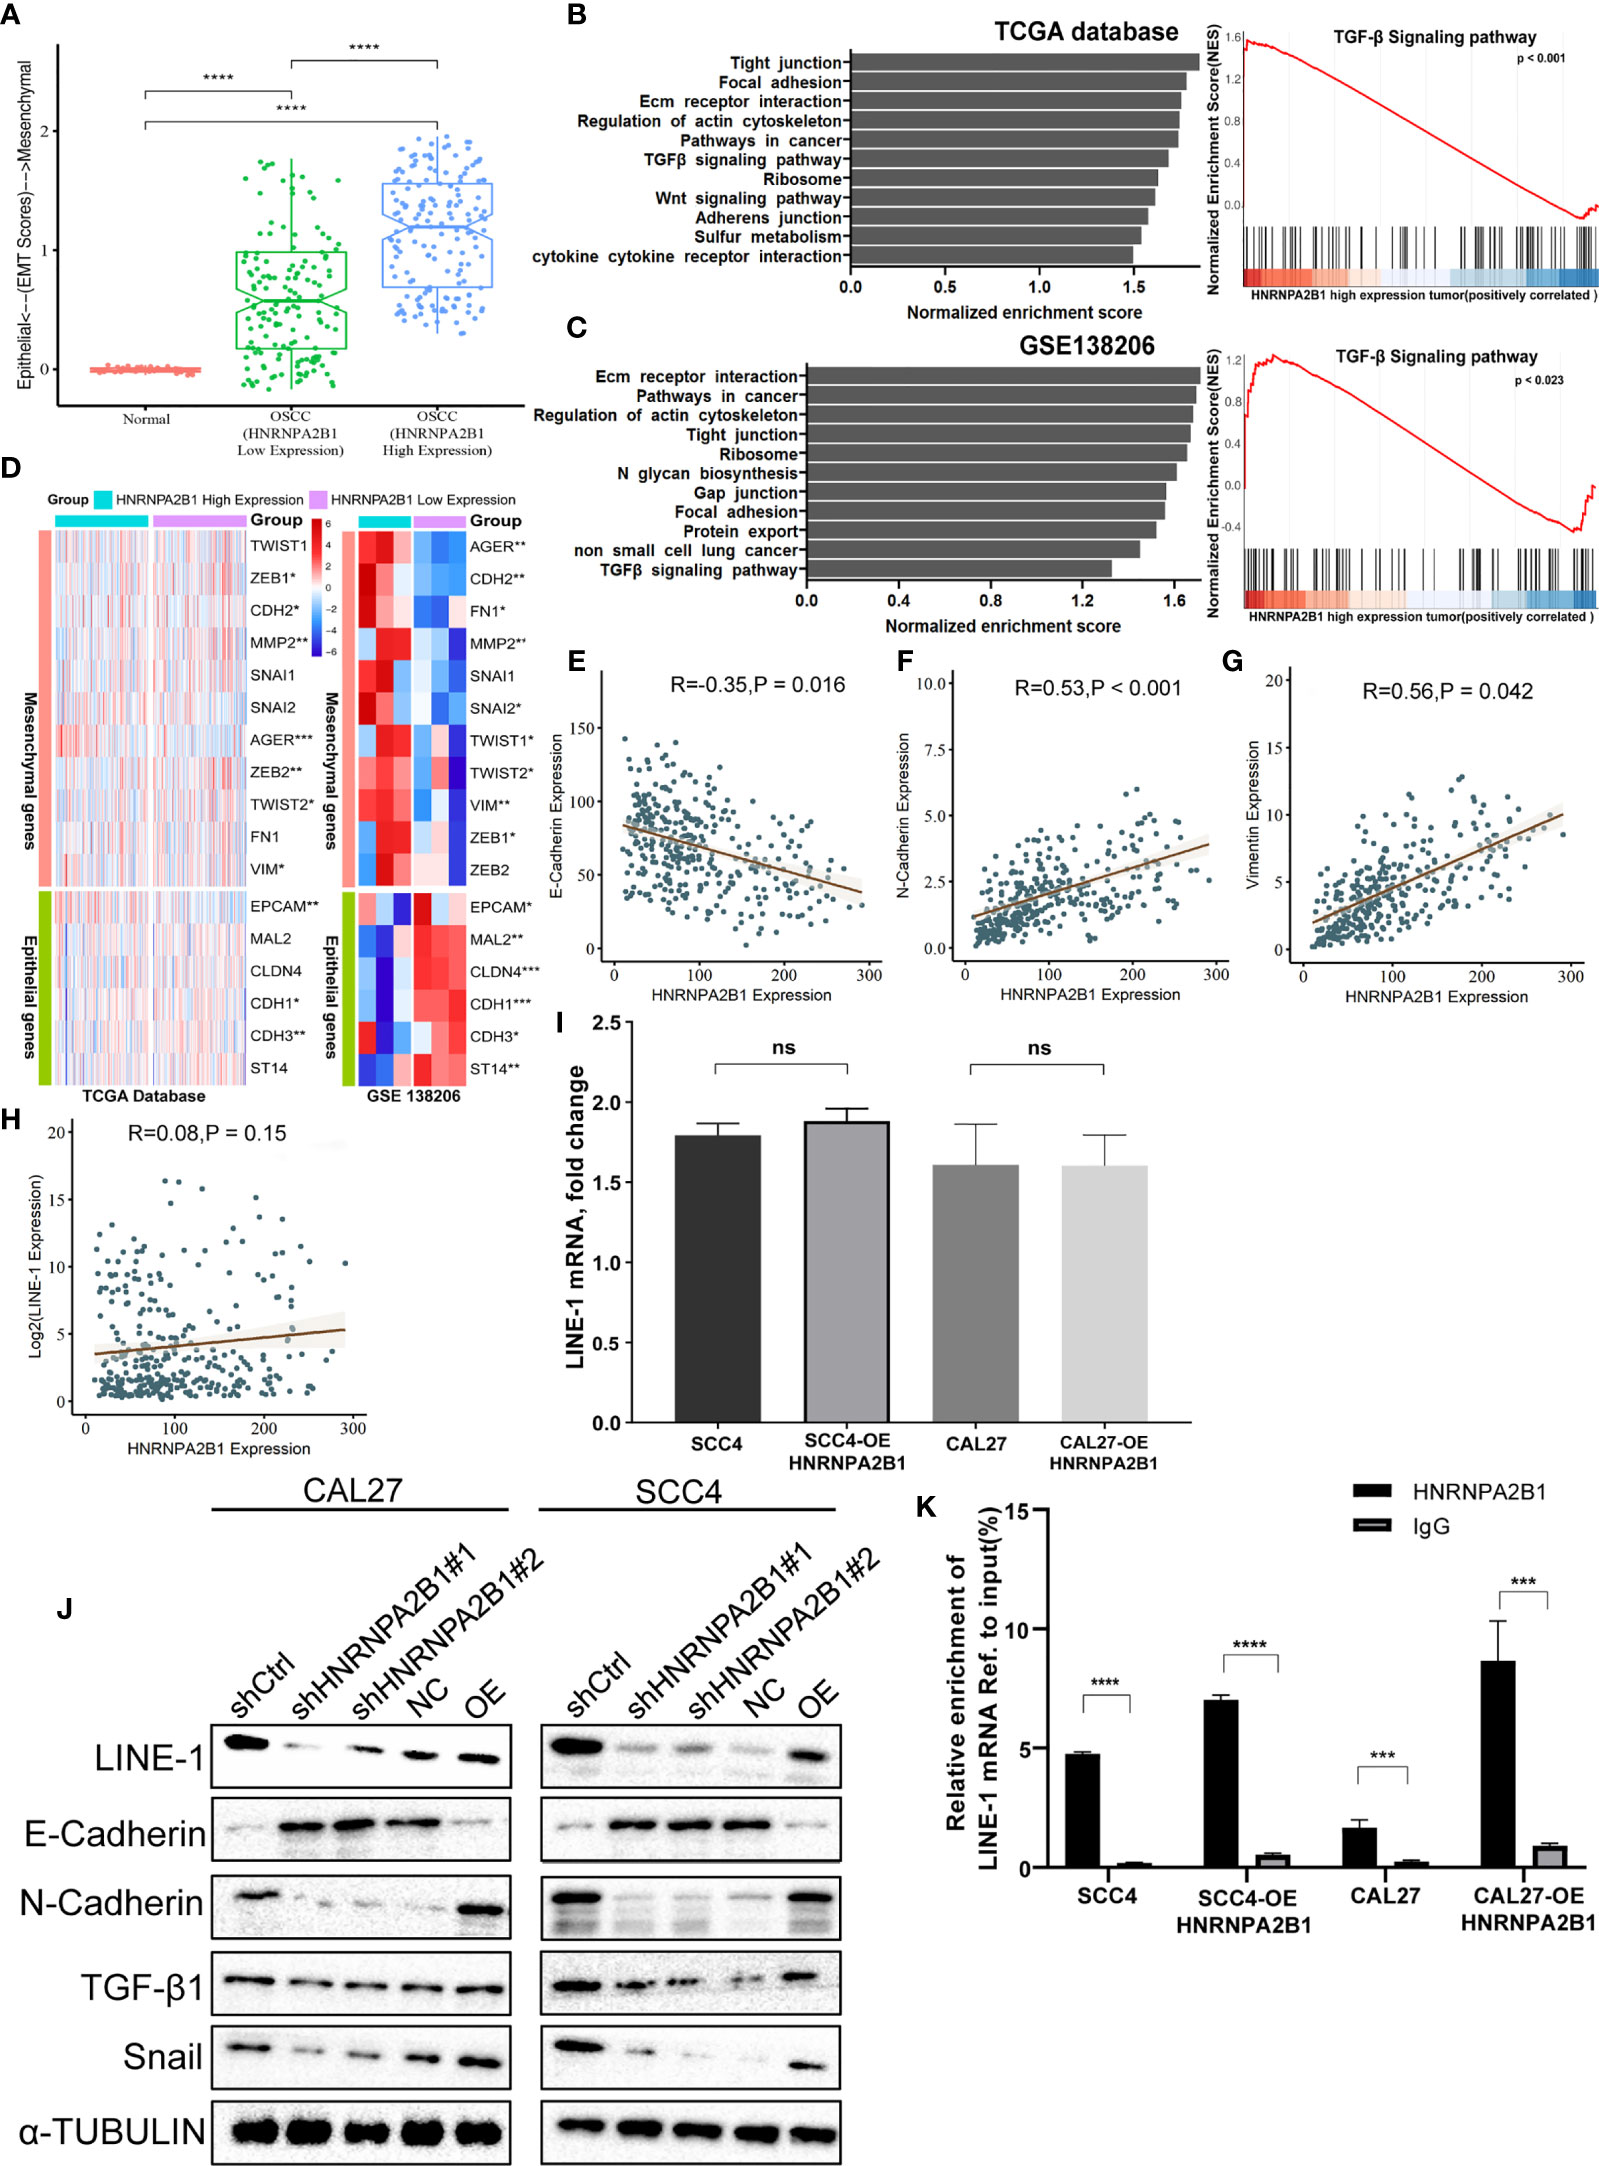
Figure 7 HNRNPA2B1 is correlated with the EMT process in OSCC. (A) EMT scores in normal and OSCC tissues. (B, C) Gene set enrichment analyses show the upregulated genes for HNRNA2B1 high-expression patients compared to low-expression patients. (D) GSE data (GSE138206) and TCGA data show that HNRNPA2B1 is correlated with multiple EMT markers. (E–H) HNRNPA2B1 expression is negatively correlated with E-cadherin (R = -0.35, p < 0.05) expression and positively correlated with N-cadherin (R = 0.53, p < 0.05) and vimentin (R = 0.56, p < 0.05), but was not correlated with the LINE-1 mRNA expression (R = 0.08, p = 0.15). (I) LINE-1 mRNA expression was not correlated with the HNRNPA2B1 expression in OSCC cell lines. (J) Western blot analysis of EMT markers related with LINE-1/TGF-β1/Snail signaling pathway. Protein levels of N-cadherin, E-cadherin, TGF-β1, Snail, and LINE-1 ORF1 of CAL27 and SCC4 cells were detected by Western blot after HNRNPA2B1 was knocked down or overexpressed. (K) Relative enrichment of LINE-1 mRNA associated with HNRNPA2B1 protein was identified by RIP assays using anti-IgG and anti-HNRNPA2B1 antibodies. The IgG group was a negative control to preclude nonspecific binding. The Y-axis represents the percent of input for each IP sample according to the formula: %Input =1/10*2Ct [IP]-Ct [input]. *, **, *** and **** indicated p<0.05, p<0.01, p<0.001 and p<0.0001, respectively. “ns” indicates no significance.
HNRNPA2B1 May Regulate the Proliferation, Migration, and Invasion of OSCC Cells by Targeting EMT via the LINE-1/TGF-β1/Snail Signaling Pathway
The TGF-β signaling pathway is a classic pathway that promotes EMT (39), GSEA indicated that the TGF-β signaling pathway in the HNRNPA2B1 high expression group was stimulated (Figures 7B, C). Our previous research demonstrated that LINE-1 may mediate the EMT process through the TGF-β1/Smad2/Snail signaling pathway in OSCC. HNRNPA2B1, as an RNA-binding protein, participates in the translation of many proteins (40–42). To explore whether HNRNPA2B1 plays a role in LINE-1 expression and whether HNRNPA2B1 mediates the EMT process by regulating the expression of LINE-1, we initially analyzed the transcription and translation of LINE-1 and HNRNPA2B1. The mRNA expression profile data of HNRNPA2B1 and LINE-1 from the TCGA database and show that their mRNA expression levels were not correlated (Figure 7H). Through the immunohistochemistry results of patient tumor tissues of 38 OSCC patients, we found that the protein levels of HNRNPA2B1 and LINE-1 are significantly positively correlated (Figure 4L).
Then, we examined the transcription and translation of LINE-1 upon HNRNPA2B1 loss. As expected, HNRNPA2B1 overexpression increased the protein abundance of LINE-1 but did not affect its RNA level in both CAL27 and SCC4 cells (Figures 7I, J). Furthermore, we detected the EMT-related markers as indicated by Western blot after downregulating and upregulating the expression of HNRNPA2B1 in CAL27 and SCC4 cells (Figure 7J). The results were consistent with the results from TCGA.
To find out the precise mechanisms underpinning the observed HNRNPA2B1-dependent phenotypes, we conducted RIP assay using the HNRNPA2B1 antibody in OSCC cells to identify HNRNPA2B1 as m6A “reader” to combine with LINE-1 mRNA and promote the translation of LINE-1. We found that HNRNPA2B1 could enrich LINE-1 mRNA, implying that LINE-1 may be regulated in protein level upon interaction with HNRNPA2B1 (Figure 7K).
These results explain that HNRNPA2B1 may, as an m6A “reader,” regulate the proliferation, migration, and invasion of OSCC cells by targeting EMT via the LINE-1/TGF-β1/Sail signaling pathway.
Discussion
m6A modification plays important roles in the eukaryotic RNA metabolism which is closely related to the initiation and progression of many types of tumors (43). However, at present, the role of m6A modification in the occurrence and development of OSCC is unclear. In this study, we demonstrated that m6A modifications dysregulated in OSCC tissues. HNRNPA2B1, as an m6A component, is overexpressed in OSCC and is a promising independent prognostic risk factor for OSCC. Furthermore, functional studies suggested that HNRNPA2B1 may promote the proliferation, migration, and invasion of OSCC cells by targeting EMT via the LINE-1/TGF-β1/Snail signaling pathway.
In recent years, more and more m6A components have been identified. In this study, we found that the m6A level in OSCC was upregulated, and 13 m6A genes were differentially expressed (shown in Figure 1). In addition, according to m6A-related gene expression, we divided the patients into cluster 1 and cluster 2 groups. The results showed that there was a significant difference in OS between the two groups (shown in Figure 2), which indicates that m6A dysregulation may contribute to the occurrence and development of OSCC. Based on univariate and multivariate Cox regression analyses, we found that METTL3, HNRNPA2B1, YTHDF3, and HNRNPC are four independent prognostic risk factors for OSCC. Subsequently, we established a Cox regression model; the patients were divided into high-risk and low-risk groups. The results show that in the high-risk group, the OS was poor, and the risk score may be related to the T classification and metastasis, but not related to other clinical parameters (shown in Figure 3). However, a similar study on head and neck squamous cell carcinoma (HNSCC) showed that HNRNPC and YTHDC2 are independent prognostic factors for HNSCC, and the risk score is related to age, gender, stage, and grade (44). Another similar study for OSCC indicated that HNRNPC, METTL14, YTHDF2, and ALKBH5 are independent prognostic factors for OSCC (45). The different results may be due to the inconsistent tumor locations and inclusion of more m6A genes in our study. Our present study indicates that HNRNPA2B1 may be a “key gene” involved in the process of m6A regulation disorder, leading to the occurrence and development of OSCC (shown in Figures 4A–C).
HNRNPA2B1 is a pre-mRNA-binding protein that participates in mRNA subcellular localization, stability, and translation (28). The latest research shows that it is the m6A “reader” that recognizes specific m6A motifs on mRNA, then combines it and regulates its expression (43). As early as 1999, scholars studied the tissue samples of seven OSCC patients through IHC and found that HNRNPA2B1 is highly expressed in OSCC tissues (46). Unfortunately, so far, the molecular mechanism of HNRNPA2B1 in OSCC is still unclear. In this study, we found that HNRNPA2B1 expression was correlated with patient survival, clinical stage, T classification, and lymph node metastasis (shown in Figures 4D–K and Tables 1, 2). The correlation between HNRNPA2B1 and lymph node metastasis was further confirmed by the RT-PCR analysis of eight patients’ fresh cervical lymph nodes samples (shown in Figure 5C). It is said that more than 50% of OSCC patients have detectable lymph node metastasis, and patients with lymph node metastasis have a markedly worse prognosis than patients without metastasis (47). All above findings indicated that HNRNPA2B1 may have prognostic relevance with OSCC. Interestingly, regarding the relationship between HNRNPA2B1 and histological type, the result from TCGA (p > 0.05) was not consistent with our clinical result (p = 0.021*). This difference may be due to our insufficient patient samples. Hence, in the present study, besides the data from the TCGA database, we focused on the expression of HNRNPA2B1 in tissues or cell lines. The results showed that HNRNPA2B1 expression was higher in OSCC patient tissues than control (shown in Figures 4J, K).
To examine whether HNRNPA2B1 is causatively involved in OSCC development, we downregulated the expression of HNRNPA2B1. We found that knockdown of HNRNPA2B1 in CAL27 and SCC4 cells inhibited their proliferation, migration, and invasion (shown in Figures 6B–F). Moreover, upregulation of HNRNPA2B1 was found to enhance the proliferation, migration, and invasion ability of OSCC cells (Figures 6B–F). These data suggest that HNRNPA2B1 is an important factor participating in the progression of OSCC. GSEA results show that the top upregulated gene sets in the HNRNPA2B1 high expression group were related to EMT, such as tight junction, focal adhesion, adherens junction, and TGF-β signaling pathway (Figures 7B, C). Moreover, the HNRNPA2B1 high expression group had higher EMT scores (Figure 7A) and multiple EMT markers were differentially expressed in the HNRNPA2B1 high and low expression group (Figures 7D–G). These results were consistent with previous studies that HNRNPA2B1 promotes tumor progress through regulating EMT in colorectal cancer (CRC) (42), breast cancer (48), and pancreatic cancer (49). The role of EMT in regulating cancer processes such as initiation, proliferation, migration, and metastasis has been extensively investigated (50) in almost all cancers with sophisticated mechanisms. EMT status can be determined by the expression of specific markers. CDH1 (E-cadherin) expressions always served as tumor suppressors during carcinoma EMT (51), while the hallmarks of EMT are the upregulation of CDH2 (N-cadherin) and vimentin (52). Our previous study indicated that LINE-1 is correlated with EMT progression in OSCC (not shown). Here, in the present study, we found that LINE-1 expression was decreased, and E-cadherin and N-cadherin were abnormally expressed after depletion of HNRNPA2B1 (Figure 7G). However, after upregulating the expression of HNRNPA2B1, we got the opposite result (Figure 7G), which might explain the cell growth inhibition and lower relative invasiveness after HNRNPA2B1 was reduced. Our previous research indicates that LINE-1 regulates the proliferation and migration of OSCC cells by targeting EMT via the TGF-β1/Smad2/Snail signaling pathway. We found that Snail and TGF-β1 expression was suppressed after silencing of HNRNPA2B1 (Figure 7G). In this study, we also found that overexpression of HNRNPA2B1 increased the protein abundance of LINE-1 but did not affect its RNA level in OSCC cells. Further, through RIP assay we found that HNRNPA2B1 could enrich LINE-1 mRNA, implying that LINE-1 may be regulated in protein level upon interaction with HNRNPA2B1. The results were consistent with previous studies that HNRNPA2B1 acts as an m6A reader, binding and affecting m6A methylated transcripts, and then regulating the translation initiation, splicing, exportation, and other processes of the target gene to perform its functions (53–57). These results suggested that HNRNPA2B1 as an m6A reader may regulate the development of OSCC by targeting EMT via the LINE-1/TGF-β1/Snail signaling pathway. However, more work is needed for further studies, such as whether HNRNPA2B1 recognizes the m6A motif in LINE-1 mRNA and regulates its translation to mediate the EMT process.
Taken together, HNRNPA2B1, as an m6A reader, is critical in OSCC development. Its expression is significantly associated with the prognosis of OSCC. Moreover, m6A may act as a proto-oncogene that promotes the OSCC proliferation, migration, and invasion through the EMT progression via the LINE-1/TGF-β1/Snail signaling pathway. These findings may provide a new strategy for OSCC therapy.
Data Availability Statement
The original contributions presented in the study are included in the article/supplementary material. Further inquiries can be directed to the corresponding author.
Ethics Statement
The studies involving human participants were reviewed and approved by the Ethics Committee of the Second Xiangya Hospital of Central South University, Changsha, China. The patients/participants provided their written informed consent to participate in this study.
Author Contributions
CF and FZ designed the experiments. TY, TS, MY, and FZ performed the experiments and analyzed the data. FZ and TY wrote the article. CF and FZ modified the manuscript. All authors contributed to the article and approved the submitted version.
Conflict of Interest
The authors declare that the research was conducted in the absence of any commercial or financial relationships that could be construed as a potential conflict of interest.
Publisher’s Note
All claims expressed in this article are solely those of the authors and do not necessarily represent those of their affiliated organizations, or those of the publisher, the editors and the reviewers. Any product that may be evaluated in this article, or claim that may be made by its manufacturer, is not guaranteed or endorsed by the publisher.
Abbreviations
m6A, N6-methyladenosine; OSCC, oral squamous cell carcinoma; EMT, epithelial and mesenchymal transition; mRNA, messenger RNA; HNRNPA2B1, heterogeneous nuclear ribonucleoproteins A2B1; LINE-1, long interspersed nucleotide element 1; TCGA, The Cancer Genome Atlas; AUC, area under the ROC curve; IHC, immunohistochemistry.
References
1. Bray F, Ferlay J, Soerjomataram I, Siegel RL, Torre LA, Jemal A. Global Cancer Statistics 2018: GLOBOCAN Estimates of Incidence and Mortality Worldwide for 36 Cancers in 185 Countries. CA: Cancer J Clin (2018) 68:394–424. doi: 10.3322/caac.21492
2. Conway D, Stockton D, Warnakulasuriya K, Ogden G, Macpherson L. Incidence of Oral and Oropharyngeal Cancer in United Kingdom (1990–1999)—Recent Trends and Regional Variation. Oral Oncol (2006) 42:586–92. doi: 10.1016/j.oraloncology.2005.10.018
3. Li L, Li C, Wang S, Wang Z, Jiang J, Wang W, et al. Exosomes Derived From Hypoxic Oral Squamous Cell Carcinoma Cells Deliver miR-21 to Normoxic Cells to Elicit a Prometastatic Phenotype. Cancer Res (2016) 76:1770–80. doi: 10.1158/0008-5472.CAN-15-1625
4. Neville BW, Day TA. Oral Cancer and Precancerous Lesions. CA: Cancer J Clin (2002) 52:195–215. doi: 10.3322/canjclin.52.4.195
5. Dunin-Horkawicz S, Czerwoniec A, Gajda MJ, Feder M, Grosjean H, Bujnicki JM. MODOMICS: A Database of RNA Modification Pathways. Nucleic Acids Res (2006) 34(Database issue):D145–9. doi: 10.1093/nar/gkj084
6. Meyer KD, Jaffrey SR. Rethinking M(6)A Readers, Writers, and Erasers. Annu Rev Cell Dev Biol (2017) 33:319–42. doi: 10.1146/annurev-cellbio-100616-060758
7. Nachtergaele S, He C. Chemical Modifications in the Life of an mRNA Transcript. Annu Rev Genet (2018) 52:349–72. doi: 10.1146/annurev-genet-120417-031522
8. Livneh I, Moshitch-Moshkovitz S, Amariglio N, Rechavi G, Dominissini D. The M(6)A Epitranscriptome: Transcriptome Plasticity in Brain Development and Function. Nat Rev Neurosci (2020) 21:36–51. doi: 10.1038/s41583-019-0244-z
9. He L, Li H, Wu A, Peng Y, Shu G, Yin G. Functions of N6-Methyladenosine and its Role in Cancer. Mol Cancer (2019) 18:176. doi: 10.1186/s12943-019-1109-9
10. Sun T, Wu R, Ming L. The Role of M6a RNA Methylation in Cancer. Biomed Pharmacother (2019) 112:108613. doi: 10.1016/j.biopha.2019.108613
11. Roundtree IA, Evans ME, Pan T, He C. Dynamic RNA Modifications in Gene Expression Regulation. Cell (2017) 169:1187–200. doi: 10.1016/j.cell.2017.05.045
12. Vu LP, Pickering BF, Cheng Y, Zaccara S, Nguyen D, Minuesa G, et al. The N(6)-Methyladenosine (M(6)A)-Forming Enzyme METTL3 Controls Myeloid Differentiation of Normal Hematopoietic and Leukemia Cells. Nat Med (2017) 23:1369–76. doi: 10.1038/nm.4416
13. Weng H, Huang H, Wu H, Qin X, Zhao BS, Dong L, et al. METTL14 Inhibits Hematopoietic Stem/Progenitor Differentiation and Promotes Leukemogenesis via mRNA M(6)A Modification. Cell Stem Cell (2018) 22:191–205.e9. doi: 10.1016/j.stem.2017.11.016
14. Liu J, Ren D, Du Z, Wang H, Zhang H, Jin Y. M(6)A Demethylase FTO Facilitates Tumor Progression in Lung Squamous Cell Carcinoma by Regulating MZF1 Expression. Biochem Biophys Res Commun (2018) 502:456–64. doi: 10.1016/j.bbrc.2018.05.175
15. Lin S, Choe J, Du P, Triboulet R, Gregory RI. The M(6)A Methyltransferase METTL3 Promotes Translation in Human Cancer Cells. Mol Cell (2016) 62:335–45. doi: 10.1016/j.molcel.2016.03.021
16. Zhang S, Zhao BS, Zhou A, Lin K, Zheng S, Lu Z, et al. M(6)A Demethylase ALKBH5 Maintains Tumorigenicity of Glioblastoma Stem-Like Cells by Sustaining FOXM1 Expression and Cell Proliferation Program. Cancer Cell (2017) 31:591–606.e6. doi: 10.1016/j.ccell.2017.02.013
17. Visvanathan A, Patil V, Arora A, Hegde AS, Arivazhagan A, Santosh V, et al. Essential Role of METTL3-Mediated M(6)A Modification in Glioma Stem-Like Cells Maintenance and Radioresistance. Oncogene (2018) 37:522–33. doi: 10.1038/onc.2017.351
18. Chen M, Wei L, Law CT, Tsang FH, Shen J, Cheng CL, et al. RNA N6-Methyladenosine Methyltransferase-Like 3 Promotes Liver Cancer Progression Through YTHDF2-Dependent Posttranscriptional Silencing of SOCS2. Hepatology (2018) 67:2254–70. doi: 10.1002/hep.29683
19. Zhong L, Liao D, Zhang M, Zeng C, Li X, Zhang R, et al. YTHDF2 Suppresses Cell Proliferation and Growth via Destabilizing the EGFR mRNA in Hepatocellular Carcinoma. Cancer Lett (2019) 442:252–61. doi: 10.1016/j.canlet.2018.11.006
20. Chen Y, Peng C, Chen J, Chen D, Yang B, He B, et al. WTAP Facilitates Progression of Hepatocellular Carcinoma via M6a-HuR-Dependent Epigenetic Silencing of ETS1. Mol Cancer (2019) 18:127. doi: 10.1186/s12943-019-1053-8
21. Zhang C, Samanta D, Lu H, Bullen JW, Zhang H, Chen I, et al. Hypoxia Induces the Breast Cancer Stem Cell Phenotype by HIF-Dependent and ALKBH5-Mediated M(6)A-Demethylation of NANOG mRNA. Proc Natl Acad Sci USA (2016) 113:E2047–56. doi: 10.1073/pnas.1602883113
22. Niu Y, Lin Z, Wan A, Chen H, Liang H, Sun L, et al. RNA N6-Methyladenosine Demethylase FTO Promotes Breast Tumor Progression Through Inhibiting BNIP3. Mol Cancer (2019) 18:46. doi: 10.1186/s12943-019-1004-4
23. Muller S, Bley N, Glass M, Busch B, Rousseau V, Misiak D, et al. IGF2BP1 Enhances an Aggressive Tumor Cell Phenotype by Impairing miRNA-Directed Downregulation of Oncogenic Factors. Nucleic Acids Res (2018) 46:6285–303. doi: 10.1093/nar/gky229
24. Busch B, Bley N, Muller S, Glass M, Misiak D, Lederer M, et al. The Oncogenic Triangle of HMGA2, LIN28B and IGF2BP1 Antagonizes Tumor-Suppressive Actions of the Let-7 Family. Nucleic Acids Res (2016) 44:3845–64. doi: 10.1093/nar/gkw099
25. Liu L, Wu Y, Li Q, Liang J, He Q, Zhao L, et al. METTL3 Promotes Tumorigenesis and Metastasis Through BMI1 M(6)A Methylation in Oral Squamous Cell Carcinoma. Mol Ther (2020) 28:2177–90. doi: 10.1016/j.ymthe.2020.06.024
26. Zhao W, Cui Y, Liu L, Ma X, Qi X, Wang Y, et al. METTL3 Facilitates Oral Squamous Cell Carcinoma Tumorigenesis by Enhancing C-Myc Stability via YTHDF1-Mediated M(6)A Modification. Mol Ther Nucleic Acids (2020) 20:1–12. doi: 10.1016/j.omtn.2020.01.033
27. Shriwas O, Priyadarshini M, Samal SK, Rath R, Panda S, Das Majumdar SK, et al. DDX3 Modulates Cisplatin Resistance in OSCC Through ALKBH5-Mediated M(6)A-Demethylation of FOXM1 and NANOG. Apoptosis (2020) 25:233–46. doi: 10.1007/s10495-020-01591-8
28. Dreyfuss G, Kim VN, Kataoka N. Messenger-RNA-Binding Proteins and the Messages They Carry. Nat Rev Mol Cell Biol (2002) 3:195. doi: 10.1038/nrm760
29. Dowling P, Pollard D, Larkin A, Henry M, Meleady P, Gately K, et al. Abnormal Levels of Heterogeneous Nuclear Ribonucleoprotein A2B1 (Hnrnpa2b1) in Tumour Tissue and Blood Samples From Patients Diagnosed With Lung Cancer. Mol Biosyst (2015) 11:743–52. doi: 10.1039/C4MB00384E
30. Guo H, Wang B, Xu K, Nie L, Fu Y, Wang Z, et al. M6a Reader HNRNPA2B1 Promotes Esophageal Cancer Progression via Up-Regulation of ACLY and ACC1. Front Oncol (2020) 10:1842. doi: 10.3389/fonc.2020.553045
31. Yang Y, Wei Q, Tang Y, Wang Y, Luo Q, Zhao H, et al. Loss of Hnrnpa2b1 Inhibits Malignant Capability and Promotes Apoptosis via Down-Regulating Lin28B Expression in Ovarian Cancer. Cancer Lett (2020) 475:43–52. doi: 10.1016/j.canlet.2020.01.029
32. Huang GZ, Wu QQ, Zheng ZN, Shao TR, Lv XZ. Identification of Candidate Biomarkers and Analysis of Prognostic Values in Oral Squamous Cell Carcinoma. Front Oncol (2019) 9:1054. doi: 10.3389/fonc.2019.01054
33. George JT, Jolly MK, Xu S, Somarelli JA, Levine H. Survival Outcomes in Cancer Patients Predicted by a Partial EMT Gene Expression Scoring Metric. Cancer Res (2017) 77:6415–28. doi: 10.1158/0008-5472.CAN-16-3521
34. Mootha VK, Lindgren CM, Eriksson KF, Subramanian A, Sihag S, Lehar J, et al. PGC-1alpha-Responsive Genes Involved in Oxidative Phosphorylation are Coordinately Downregulated in Human Diabetes. Nat Genet (2003) 34:267–73. doi: 10.1038/ng1180
35. Subramanian A, Tamayo P, Mootha VK, Mukherjee S, Ebert BL, Gillette MA, et al. Gene Set Enrichment Analysis: A Knowledge-Based Approach for Interpreting Genome-Wide Expression Profiles. Proc Natl Acad Sci USA (2005) 102:15545–50. doi: 10.1073/pnas.0506580102
36. Charatcharoenwitthaya P, Karaketklang K, Aekplakorn W. Cigarette Smoking Increased Risk of Overall Mortality in Patients With Non-Alcoholic Fatty Liver Disease: A Nationwide Population-Based Cohort Study. Front Med (Lausanne) (2020) 7:604919. doi: 10.3389/fmed.2020.604919
37. Yang L, Zhou M, Sherliker P, Cai Y, Peto R, Wang L, et al. Alcohol Drinking and Overall and Cause-Specific Mortality in China: Nationally Representative Prospective Study of 220 000 Men With 15 Years of Follow-Up. Int J Epidemiol (2012) 41:1101–13. doi: 10.1093/ije/dys075
38. Ling Z, Cheng B, Tao X. Epithelial-To-Mesenchymal Transition in Oral Squamous Cell Carcinoma: Challenges and Opportunities. Int J Cancer (2021) 148:1548–61. doi: 10.1002/ijc.33352
39. Huber MA, Kraut N, Beug H. Molecular Requirements for Epithelial-Mesenchymal Transition During Tumor Progression. Curr Opin Cell Biol (2005) 17:548–58. doi: 10.1016/j.ceb.2005.08.001
40. Li X, Johansson C, Glahder J, Mossberg AK, Schwartz S. Suppression of HPV-16 Late L1 5′-Splice Site SD3632 by Binding of hnRNP D Proteins and hnRNP A2/B1 to Upstream AUAGUA RNA Motifs. Nucleic Acids Res (2013) 41(22):10488–508. doi: 10.1093/nar/gkt803
41. Lan X, Yan J, Ren J. A Novel Long Noncoding RNA Lnc-HC Binds Hnrnpa2b1 to Regulate Expressions of Cyp7a1 and Abca1 in Hepatocytic Cholesterol Metabolism. Hepatology (2016) 64(1):58–72. doi: 10.1002/hep.28391
42. Zhang Y, Huang W, Yuan Y, Li J, Wu J, Yu J. Long Non-Coding RNA H19 Promotes Colorectal Cancer Metastasis via Binding to hnRNPA2B1. J Exp Clin Cancer Res (2020) 39(1):141. doi: 10.1186/s13046-020-01619-6
43. Chen XY, Zhang J, Zhu JS. The Role of M(6)A RNA Methylation in Human Cancer. Mol Cancer (2019) 18:103. doi: 10.1186/s12943-019-1033-z
44. Zhao X, Cui L. Development and Validation of a M(6)A RNA Methylation Regulators-Based Signature for Predicting the Prognosis of Head and Neck Squamous Cell Carcinoma. Am J Cancer Res (2019) 9(10):2156–69.
45. Jing FY, Zhou LM, Ning YJ, Wang XJ, Zhu YM. The Biological Function, Mechanism, and Clinical Significance of m6A RNA Modifications in Head and Neck Carcinoma: A Systematic Review. Front Cell Dev Biol (2021) 9:683254. doi: 10.3389/fcell.2021.683254
46. Goto Y, Sueoka E, Chiba H, Fujiki H. Significance of Heterogeneous Nuclear Ribonucleoprotein B1 as a New Early Detection Marker for Oral Squamous Cell Carcinoma. Jpn J Cancer Res (1999) 90:1358–63. doi: 10.1111/j.1349-7006.1999.tb00720.x
47. O’Donnell RK, Kupferman M, Wei SJ, Singhal S, Weber R, O’Malley B, et al. Gene Expression Signature Predicts Lymphatic Metastasis in Squamous Cell Carcinoma of the Oral Cavity. Oncogene (2005) 24:1244–51. doi: 10.1038/sj.onc.1208285
48. Alarcón CR, Goodarzi H, Lee H, Liu X, Tavazoie S, Tavazoie SF. HNRNPA2B1 Is a Mediator of m(6)A-Dependent Nuclear RNA Processing Events. Cell (2015) 162(6):1299–308. doi: 10.1016/j.cell.2015.08.011
49. Dai S, Zhang J, Huang S, Lou B, Fang B, Ye T, et al. HNRNPA2B1 Regulates the Epithelial–Mesenchymal Transition in Pancreatic Cancer Cells Through the ERK/Snail Signalling Pathway. Cancer Cell Int (2017) 17:12. doi: 10.1186/s12935-016-0368-4
50. Puisieux A, Brabletz T, Caramel J. Oncogenic Roles of EMT-Inducing Transcription Factors. Nat Cell Biol (2014) 16:488–94. doi: 10.1038/ncb2976
51. Hay ED, Zuk A. Transformations Between Epithelium and Mesenchyme: Normal, Pathological, and Experimentally Induced. Am J Kidney Dis (1995) 26:678–90. doi: 10.1016/0272-6386(95)90610-X
52. Hulit J, Suyama K, Chung S, Keren R, Agiostratidou G, Shan W, et al. N-Cadherin Signaling Potentiates Mammary Tumor Metastasis via Enhanced Extracellular Signal-Regulated Kinase Activation. Cancer Res (2007) 67:3106–16. doi: 10.1158/0008-5472.CAN-06-3401
53. Chen J, Yu K, Zhong G, Shen W. Identification of a M(6)A RNA Methylation Regulators-Based Signature for Predicting the Prognosis of Clear Cell Renal Carcinoma. Cancer Cell Int (2020) 20:157. doi: 10.1186/s12935-020-01238-3
54. Fang Q, Chen H. The Significance of M6a RNA Methylation Regulators in Predicting the Prognosis and Clinical Course of HBV-Related Hepatocellular Carcinoma. Mol Med (2020) 26:60. doi: 10.1186/s10020-020-00185-z
55. Li J, Rao B, Yang J, Liu L, Huang M, Liu X, et al. Dysregulated M6a-Related Regulators Are Associated With Tumor Metastasis and Poor Prognosis in Osteosarcoma. Front Oncol (2020) 10:769. doi: 10.3389/fonc.2020.00769
56. Li T, Gu M, Deng A, Qian C. Increased Expression of YTHDF1 and HNRNPA2B1 as Potent Biomarkers for Melanoma: A Systematic Analysis. Cancer Cell Int (2020) 20:239. doi: 10.1186/s12935-020-01309-5
Keywords: Oral squamous cell carcinoma, HNRNPA2B1, N6-methyladenosine, EMT, Metastasis
Citation: Zhu F, Yang T, Yao M, Shen T and Fang C (2021) HNRNPA2B1, as a m6A Reader, Promotes Tumorigenesis and Metastasis of Oral Squamous Cell Carcinoma. Front. Oncol. 11:716921. doi: 10.3389/fonc.2021.716921
Received: 09 June 2021; Accepted: 02 September 2021;
Published: 23 September 2021.
Edited by:
Yury O. Nunez Lopez, AdventHealth, United StatesReviewed by:
Daniela Elena Costea, University of Bergen, NorwayMojgan Alaeddini, Tehran University of Medical Sciences, Iran
Keqian Zhi, The Affiliated Hospital of Qingdao University, China
Copyright © 2021 Zhu, Yang, Yao, Shen and Fang. This is an open-access article distributed under the terms of the Creative Commons Attribution License (CC BY). The use, distribution or reproduction in other forums is permitted, provided the original author(s) and the copyright owner(s) are credited and that the original publication in this journal is cited, in accordance with accepted academic practice. No use, distribution or reproduction is permitted which does not comply with these terms.
*Correspondence: Changyun Fang, fangcy@csu.edu.cn