 Xiaolian Gu1*
 Philip Coates2
 Lixiao Wang1Baris Erdogan3Amir Salehi1Nicola Sgaramella1Katarina Zborayova3Karin Nylander1
- 1Department of Medical Biosciences, Umeå University, Umeå, Sweden
- 2Research Centre for Applied Molecular Oncology, Masaryk Memorial Cancer Institute, Brno, Czechia
- 3Department of Clinical Sciences, Umeå University, Umeå, Sweden
As early detection is crucial for improvement of cancer prognosis, we searched for biomarkers in plasma from individuals who later developed squamous cell carcinoma of the oral tongue (SCCOT) as well as in patients with an already established SCCOT. Levels of 261 proteins related to inflammation and/or tumor processes were measured using the proximity extension assay (PEA) in 179 plasma samples (42 collected before diagnosis of SCCOT with 81 matched controls; 28 collected at diagnosis of SCCOT with 28 matched controls). Statistical modeling tools principal component analysis (PCA) and orthogonal partial least square - discriminant analysis (OPLS-DA) were applied to provide insights into separations between groups. PCA models failed to achieve group separation of SCCOT patients from controls based on protein levels in samples taken prior to diagnosis or at the time of diagnosis. For pre-diagnostic samples and their controls, no significant OPLS-DA model was identified. Potentials for separating pre-diagnostic samples collected up to five years before diagnosis (n = 15) from matched controls (n = 28) were seen in four proteins. For diagnostic samples and controls, the OPLS-DA model indicated that 21 proteins were important for group separation. TNF receptor associated factor 2 (TRAF2), decreased in pre-diagnostic plasma (< 5 years) but increased at diagnosis, was the only protein showing altered levels before and at diagnosis of SCCOT (p-value < 0.05). Taken together, changes in plasma protein profiles at diagnosis were evident, but not reliably detectable in pre-diagnostic samples taken before clinical signs of tumor development. Variation in protein levels during cancer development poses a challenge for the identification of biomarkers that could predict SCCOT development.
Introduction
Proteins found in blood plasma can be informative of health status and disease risk (1). Proteins can enter plasma through purposeful secretion or leakage from damaged and dead cells (1). In the search for cancer biomarkers, plasma proteins have long been considered an attractive resource (2, 3). A number of FDA (US Food and Drug Administration)-approved plasma protein biomarkers for cancer are currently used in clinical practice, such as prostate-specific antigen (PSA) for prostate cancer, alpha-fetoprotein (AFP) for testicular cancer, cancer antigen 125 (CA-125) for ovarian cancer, CA 15-3 for breast cancer and CA 19-9 for pancreatic cancer (3, 4). Despite their approved application, insufficient specificity for cancer diagnosis or management is well recognized (2, 3).
Oral cancer is a common disease worldwide, representing approximately 2% of all new global cancer cases in 2018 (5). According to The Swedish Head and Neck Cancer Register (SweHNCR), the number of cases increased slightly during the years 2008 to 2017, with about 400 new cases each year in Sweden (6). Squamous cell carcinoma of the oral tongue (SCCOT) is the main sub-group of oral cancer. For this sub-group of patients, the relative five-year survival is 88% for patients with stage I tumors, 73% for stage II, 46% for stage III and 33% for stage IV [data from SweHNCR (6)]. Cancer-specific changes that can be detected at an early phase of cancer development are of great value for increasing the chances of successful treatment and better prognosis (7).
In a previous study, we found that plasma proteins are promising diagnostic markers for SCCOT, more promising than circulating miRNAs for this purpose (8), but no clinically approved biomarker exists as yet for oral cancer (4, 9). Based on comparison of blood samples taken from patients with oral SCC at diagnosis with samples from healthy controls Liu et al. reported that plasma-derived inflammatory proteins could be useful, but no pre-diagnostic samples were investigated to assess the potential of the proteins in early diagnosis (10). In our recent study that focused on interleukin 1 receptor antagonist (IL-1Ra), a commonly suggested cancer biomarker, we found that IL-1Ra levels in pre-diagnostic samples has low potential as a predictive biomarker for SCCHN (11). As protein profiles prior to diagnosis remain relatively unexplored it is unclear whether markers of an existing carcinoma are altered prior to development of the visible tumor.
To address this issue, we analyzed a total of 261 proteins known to be involved in inflammation and/or tumor processes in plasma samples taken before and at diagnosis of SCCOT. The pre-diagnostic samples available from patients who subsequently developed clinical SCCOT had been collected from 6 months up to 22 years before diagnosis. By investigating if any proteins had altered levels before diagnosis, and comparing patterns of changes between pre-diagnostic and diagnostic plasma samples we searched for predictive biomarkers.
Materials and Methods
Pre-Diagnostic SCCOT Samples and Matched Controls
Plasma samples from the Västerbotten Intervention Programme (VIP) and the Northern Sweden Monica Project (MONICA) collected in Biobank Norr, Umeå, were used. These are large ongoing population-based cohorts established in the late 1980’s (12). As summarized in Figure 1, 44 plasma samples from subjects that developed SCCOT six months or longer after sample collection were selected. The cases were matched with two age- (± 12 months), sex- and sampling dates- (± 12 months) matched healthy controls that had not developed any kind of cancer, in total 88 controls. After at least 8 hours of fasting, according to a standardized protocol, all samples were collected in EDTA tubes in the morning. Samples were aliquoted and frozen within 1 h of collection, either directly at −80°C or first at −20°C for up to one week before being transferred to a central storage facility.
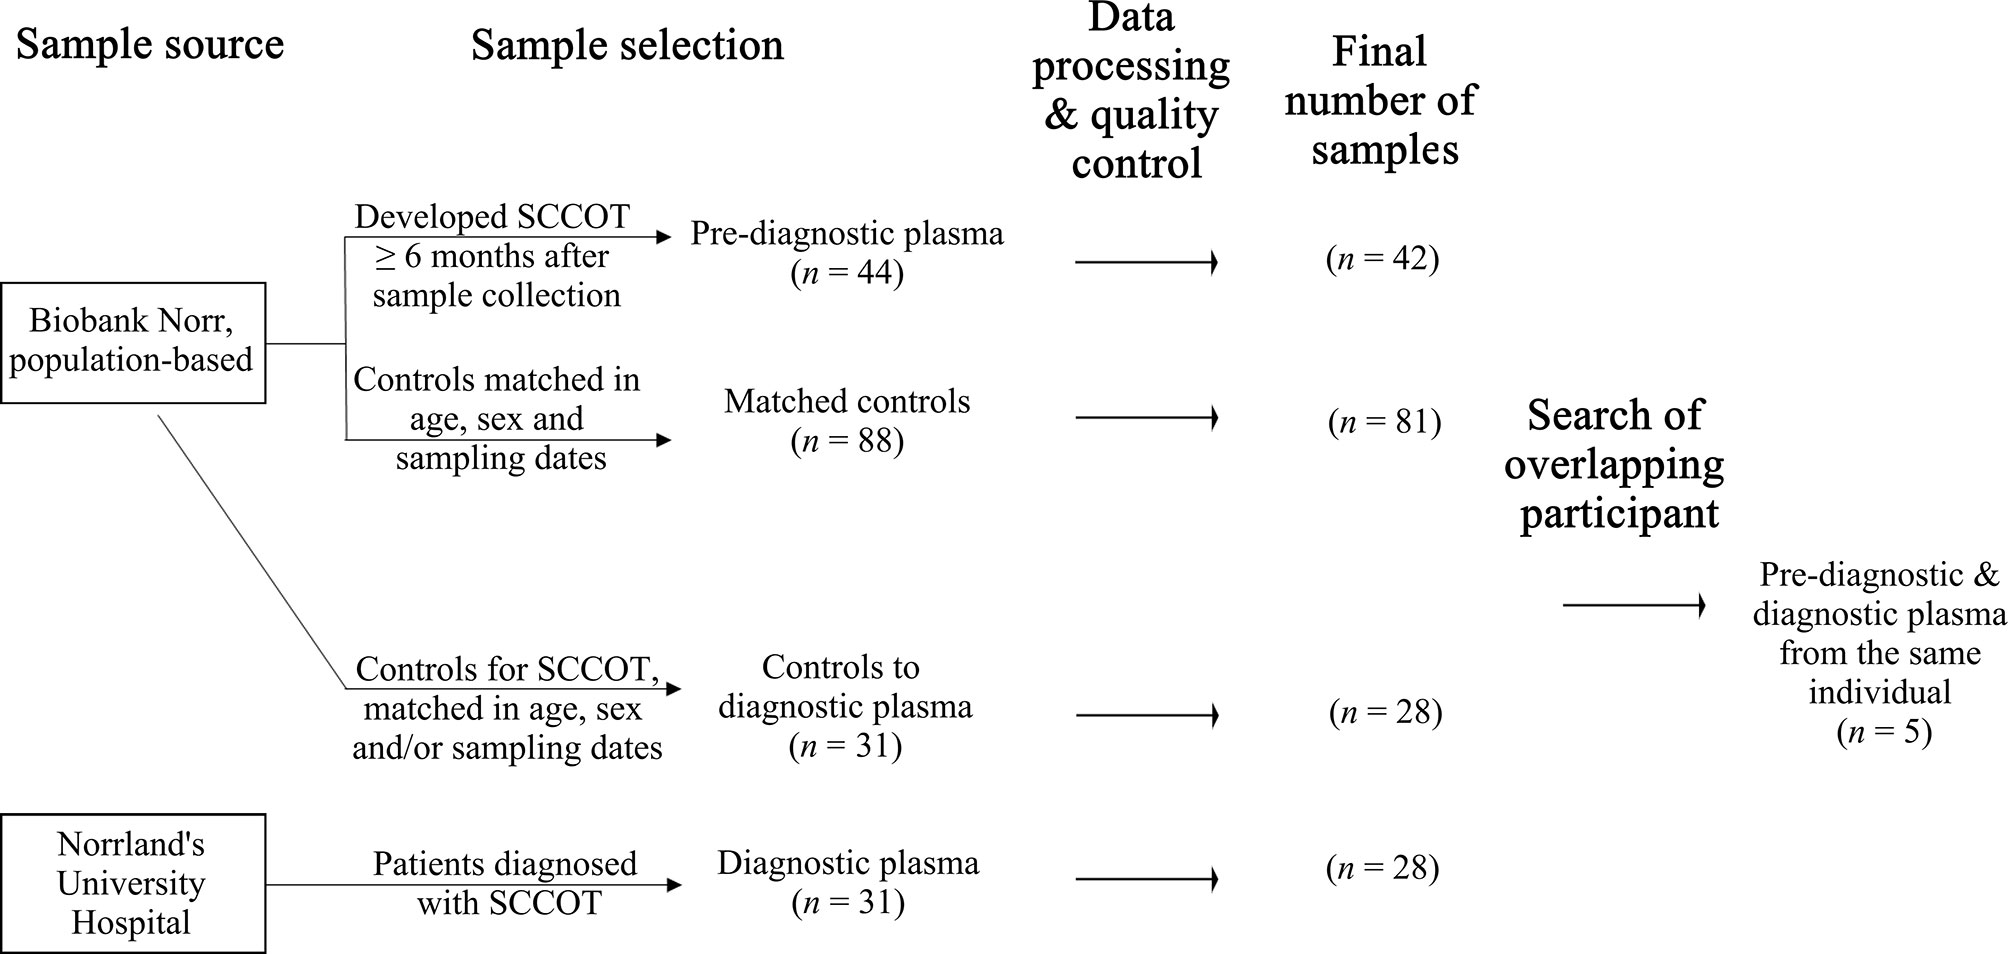
Figure 1 Sample selection and the final sample set with qualified data.
SCCOT Samples and Controls
After informed consent, plasma from 31 primary SCCOT patients was collected in EDTA tubes at Norrland’s University Hospital in Umeå, Sweden. Pre-diagnostic plasma samples were available for five of these patients (Figure 1). Samples were collected before start of treatment. All but 8 patients were fasting at least 8 hours before sample collection. Plasma was aliquoted and stored frozen at −80°C until further analysis. Age- (± 5 years), sex- and/or sampling date- (± 5 years) matched healthy controls were chosen from Biobank Norr. Ethical permission for the study had been granted (Dnr 08-003M) and the project was performed according to the principles of the Declaration of Helsinki.
Plasma Sample Analysis and Data Processing
Plasma samples were analyzed with three different Olink Multiplex panels (Olink Proteomics, Uppsala, Sweden), each containing 92 proteins representing cell regulation, immune response and immune oncology. With 15 proteins being present on two of the panels, the total number of proteins investigated was 261. A list of the assays can be seen in Table S1. All samples were sent to the Clinical biomarker facility, Science for Life Laboratory (Uppsala, Sweden) for analysis. The technique for the multiplex system is proximity extension assay (PEA), which is based on pairs of antibodies linked to oligonucleotides that are brought in proximity when they bind to their target protein. The oligonucleotide is extended by DNA polymerase and analyzed with qPCR. The copy numbers formed are proportional to the concentration of the antigen in the sample. Results are presented as normalized protein expression (NPX), which is an arbitrary unit on a log2 scale. Internal and external controls were included in each run. Information about quality control of the data can be found online: https://www.olink.com/faq/how-is-quality-control-of-the-data-performed/. The limit of detection (LOD) is calculated separately for each Olink assay and sample plate. Values below LOD were classified as LOD.
For the dataset comprising pre-diagnostic samples and matched controls, two pre-diagnostic samples did not pass quality control and were thus excluded, together with their matched controls. Three controls for pre-diagnostic samples were also excluded due to low quality. For the dataset comprising diagnostic samples and the corresponding controls, three diagnostic and three controls did not pass quality control and were excluded, resulting in 18 pairs of age-, sex- and sampling date-matched samples and 10 pairs of partially matched samples (Table S2). Finally, plasma protein data were available from 42 pre-diagnostic cases with 81 matched controls, and from 28 patients at diagnosis with 28 partially matched controls. Clinical information for patients is shown in Table 1.
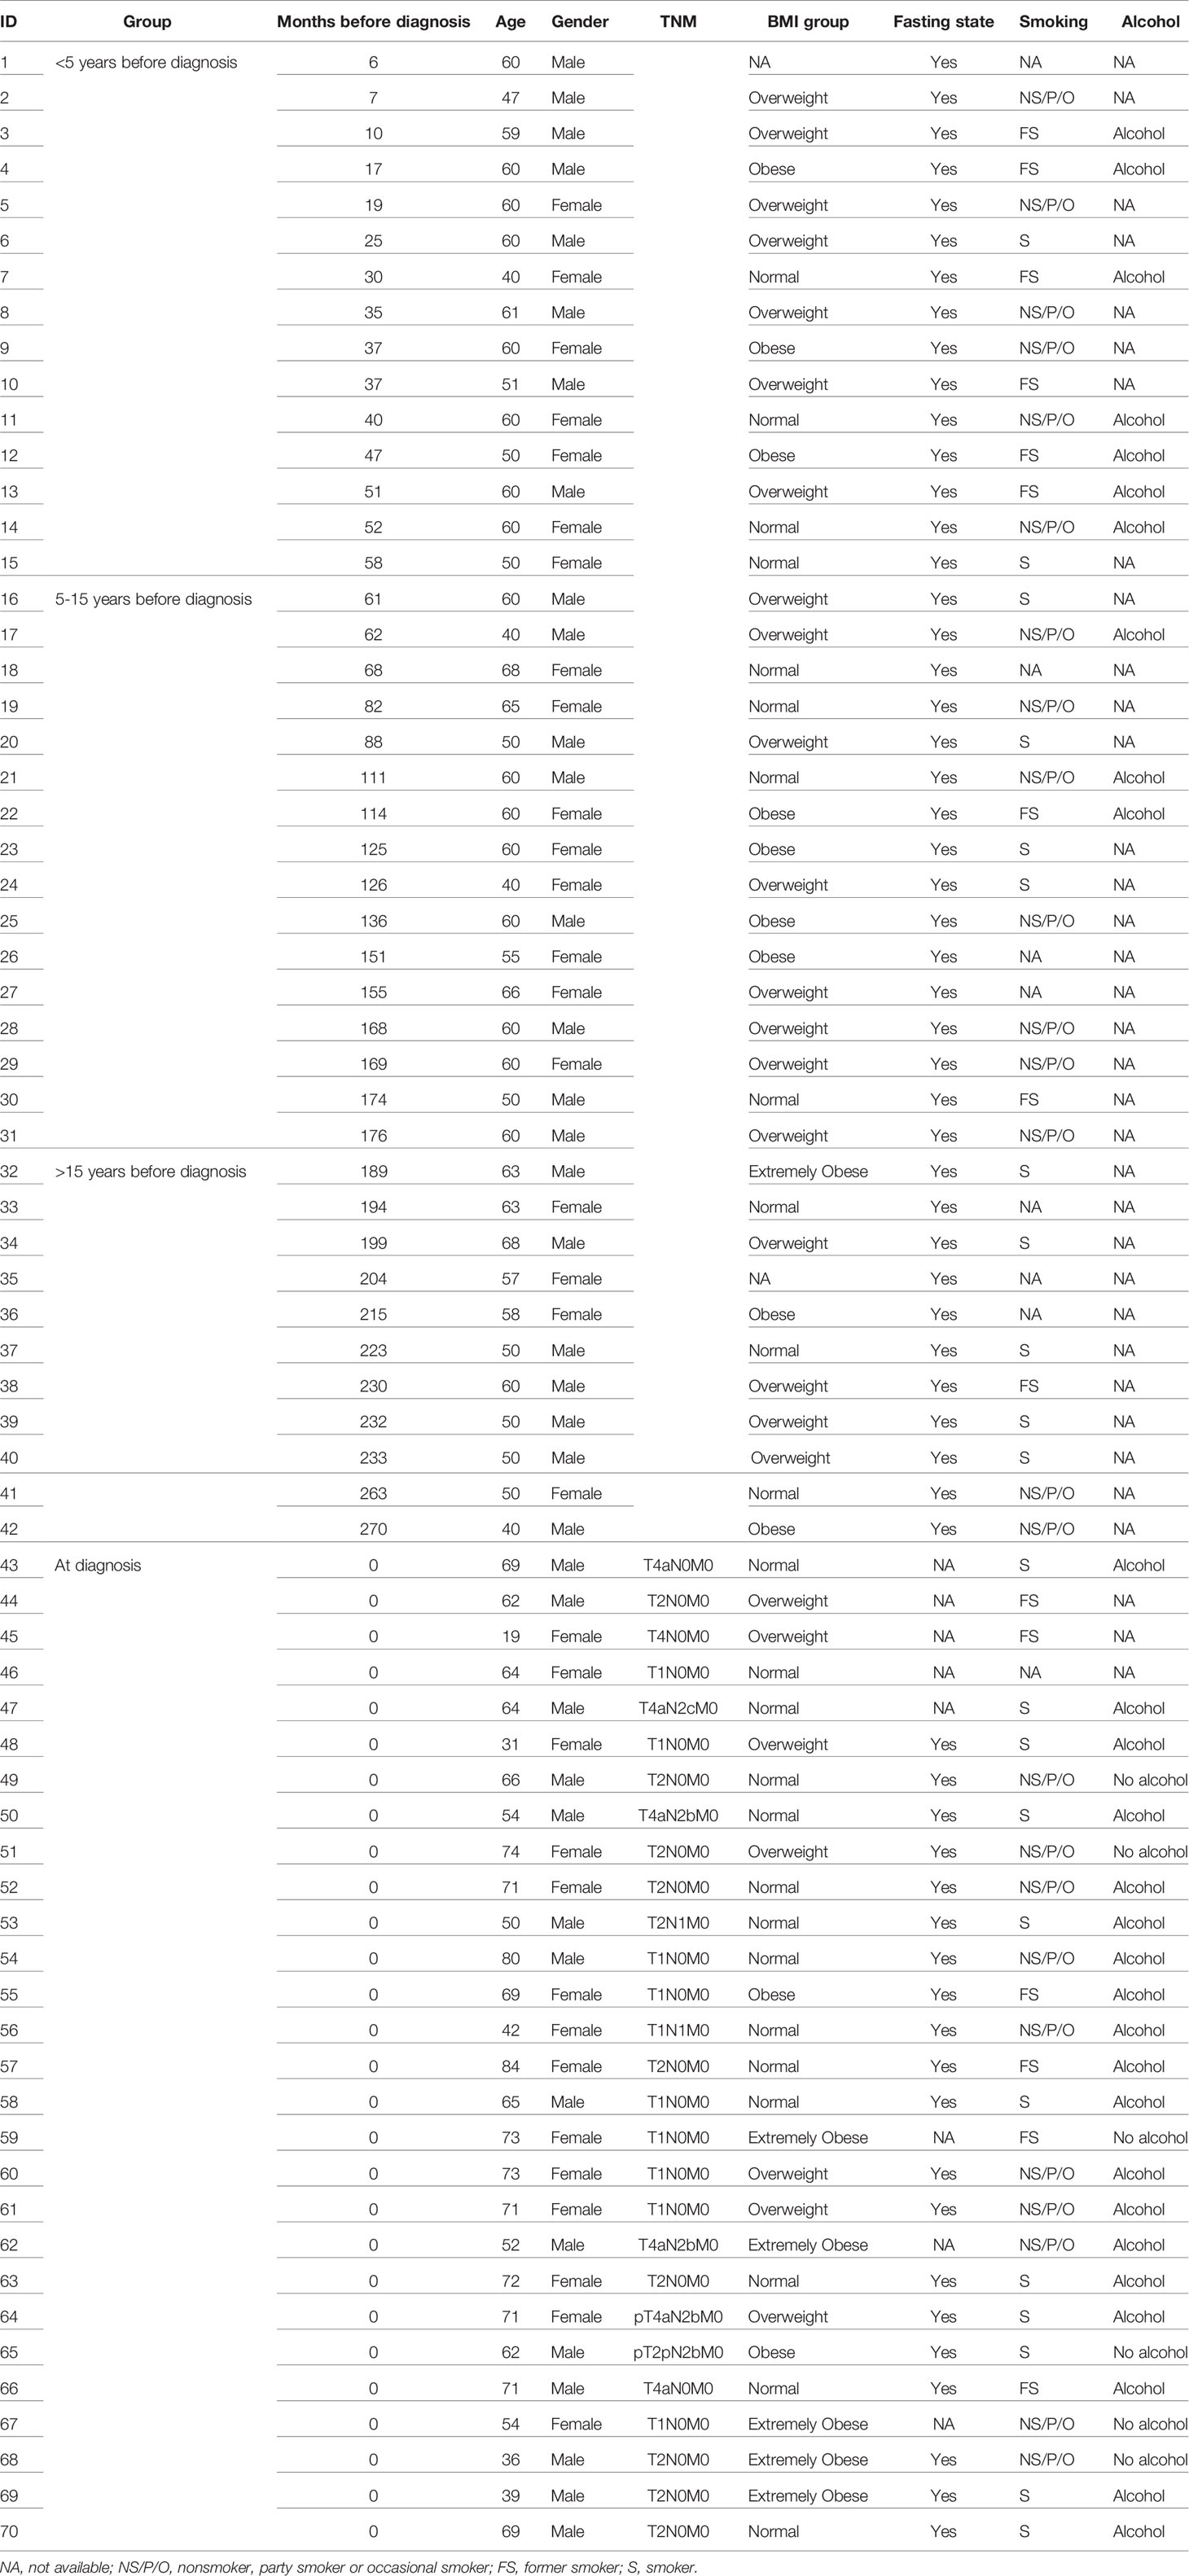
Table 1 Clinical information for patients with pre-diagnostic or diagnostic plasma samples.
Data Analysis
For multivariate data analysis we used Simca 16 (MKS Data analytics Solutions, Umea, Sweden) (13). Unsupervised principal component analysis (PCA) was performed to overview sample distributions based on three panels of protein levels. Orthogonal partial least square - discriminant analysis (OPLS-DA) was conducted to identify proteins that were important for group differences (cases vs. controls). For each OPLS-DA model, analysis of variance of cross-validated predictive residuals (CV-ANOVA) was performed to assess model reliability. A model with CV-ANOVA p-value < 0.05 was considered significant. Proteins with variable influence of projection (VIP) value higher than 1, as well as absolute correlation coefficient between the model and original data |p(corr)| > 0.4 were regarded important for group discrimination (13).
Univariate statistical methods were applied to compare levels of the top discriminatory proteins between groups in order to visualize the changes in single factors. The analysis was conducted in IBM SPSS Statistics 25 (IBM Corp., Armonk, NY, USA). For comparison between two groups of continuous variables, Mann-Whitney U test for non-paired samples were used, as controls were not perfectly matched. A two-sided p-value < 0.05 was considered significant. Distribution of individual data was shown in bean plots generated by BoxplotR (14). Discrimination ability of single potential protein biomarkers was assessed via receiver operating characteristic (ROC) curve and area under the curve (AUC) value. Sensitivity and specificity at cutoff levels were also calculated.
Results
Protein Profiles in Pre-Diagnostic and Diagnostic SCCOT
Three different multiplex panels consisting of 92 different proteins each were used for analysis of plasma taken between six months up to 22 years before SCCOT diagnosis (pre-diagnostic plasma), plasma collected at diagnosis from patients with SCCOT (diagnostic plasma) and from matched controls without any history of cancer. PCA, an unsupervised multivariate statistical analysis method, showed that pre-diagnostic samples exhibited similar protein profiles to their age- and sex-matched controls (Figure 2A), and protein profiles were similar also between diagnostic plasma and their controls (Figure 2B). Pre-diagnostic samples were further divided into three subgroups according to the interval from collection date to cancer diagnosis date: < 5 years before diagnosis, 5 to 15 years before diagnosis and > 15 years before diagnosis, showing no separation among the three subgroups based on time to tumor detection (data not shown).
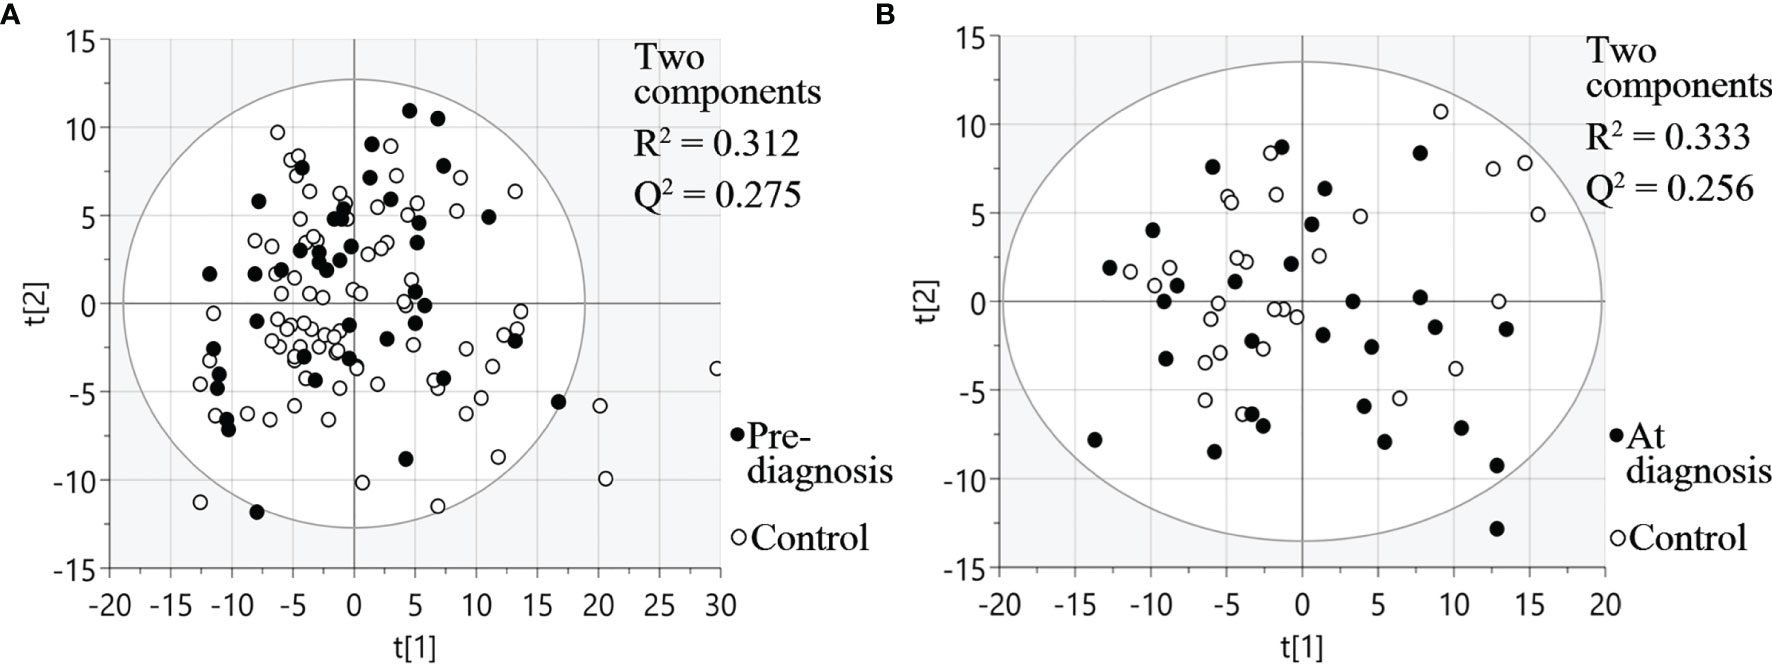
Figure 2 PCA plots visualizing protein expression profiles in different samples. (A) Pre-diagnostic plasma samples and matched controls. (B) Diagnostic plasma and controls. t[1] and t[2] are scores of the first two principal components.
For diagnostic samples, the associations between clinicopathological features and protein profiles were also evaluated by PCA plots (Figure S1). No obvious sample groupings according to TNM stage, T stage, node status or alcohol consumption were found.
Identification of Discriminant Factors Using OPLS-DA
Using OPLS-DA modelling, we tried to identify proteins that could contribute to group separation. For pre-diagnostic samples and controls, no significant OPLS-DA models were identified (CV-ANOVA p-value = 1). Nevertheless, we considered proteins with |p(corr)| > 0.4 and VIP > 1 as potential discriminant factors. As shown in Table 2, when we compared all pre-diagnostic samples to their matched controls, IL8 was the only protein that showed potential for group separation. When comparing samples collected < 15 years before diagnosis to their matched controls, two potential discriminant proteins were identified (IL8 and MCP-3). For samples collected < 5 years before diagnosis, a different set of potential discriminant proteins was identified (NFATC3, IL10, TRAF2 and KLK12) (Figure 3A and Table 2). Next, we compared diagnostic plasma to the corresponding controls. The OPLS-DA model (three components, R2 = 0.864, Q2 = 0.613, CV-ANOVA p-value < 0.001) indicated that 21 proteins (measured by 22 assays) were important for group separation (Figure 3B and Table 2).
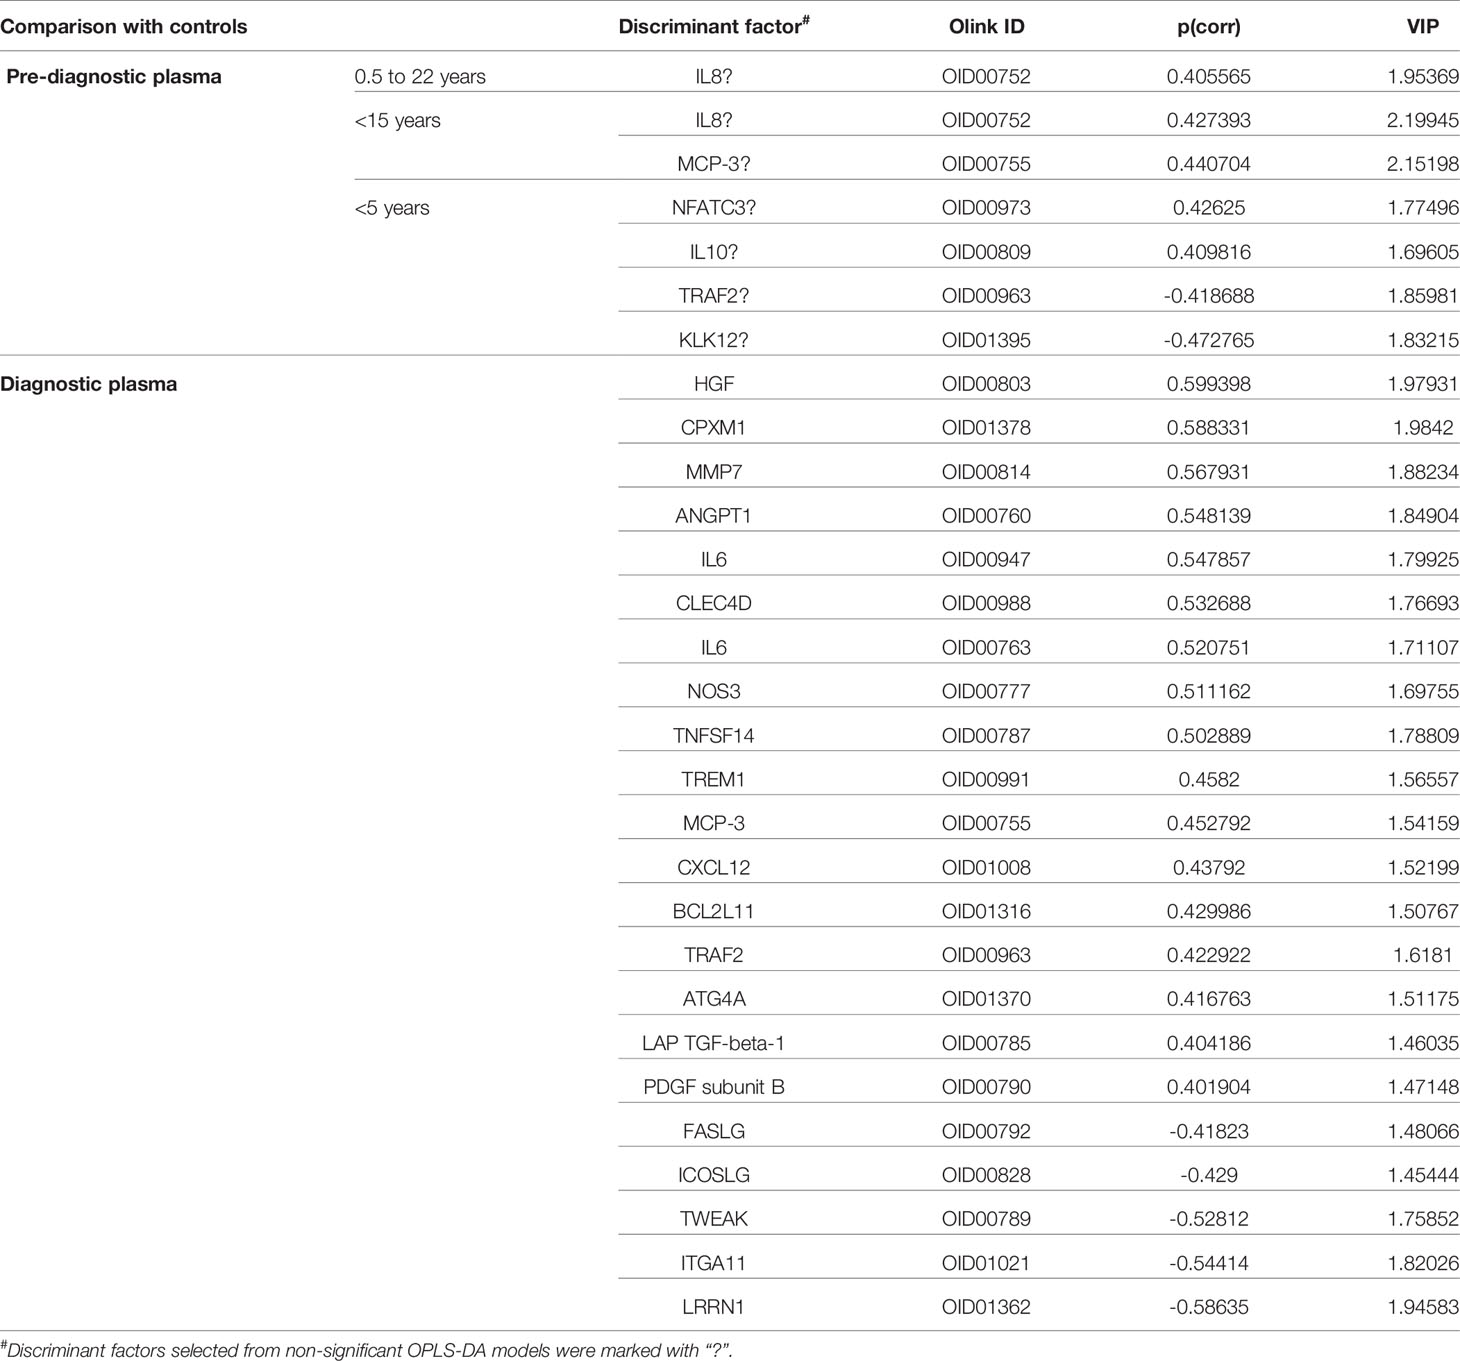
Table 2 List of discriminant factors identified from comparisons between different groups of samples.
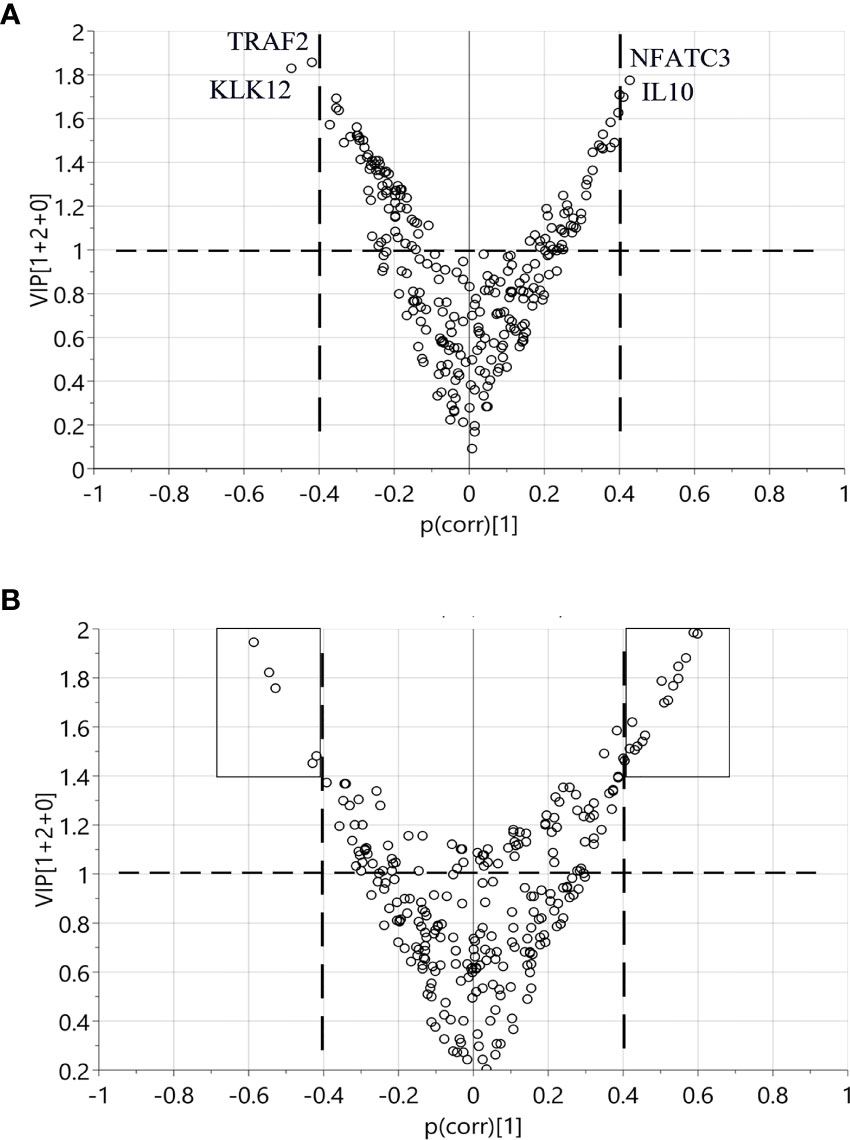
Figure 3 Identification of discriminant factors between two groups of samples according to OPLS-DA. Variables with |p(corr)| > 0.4 and VIP > 1 were selected. (A) Comparison between < 5 years pre-diagnostic samples and the matched controls. Four proteins selected as potential discriminant factors were shown. (B) Comparison between plasma at diagnosis and the matched controls. The black boxes indicate the 21 proteins as discriminating variables.
Longitudinal Trend of Change in Plasma Proteins
To investigate the longitudinal trend of change in protein levels long before diagnosis to diagnosis of cancer, levels of the top discriminatory proteins in diagnostic plasma, < 5 years before diagnosis, 5 - 15 years before diagnosis, > 15 years before diagnosis were compared to their respective controls. According to the p(corr) value (correlation coefficient between the model and the original data), HGF (Hepatocyte Growth Factor), CPXM1 (Carboxypeptidase X, M14 Family Member 1) and MMP7 (Matrix Metallopeptidase 7) are the top three positively correlated factors (Table 2) and each protein showed statistically different levels (p < 0.01) in diagnostic samples and controls (Figures 4A–C). However, no differences were detected in pre-diagnostic samples compared to their matched controls, regardless of interval to diagnosis (p > 0.05). The top three negatively correlated proteins were LRRN1 (Leucine Rich Repeat Neuronal 1), ITGA11 (Integrin Subunit Alpha 11) and TWEAK (TNF Superfamily Member 12) (Table 2) and (Figures 4D–F). Of these, LRRN1 was the only downregulated protein in a subgroup of pre-diagnostic samples (5-15 years before diagnosis) compared to the corresponding controls (Figure 4D).
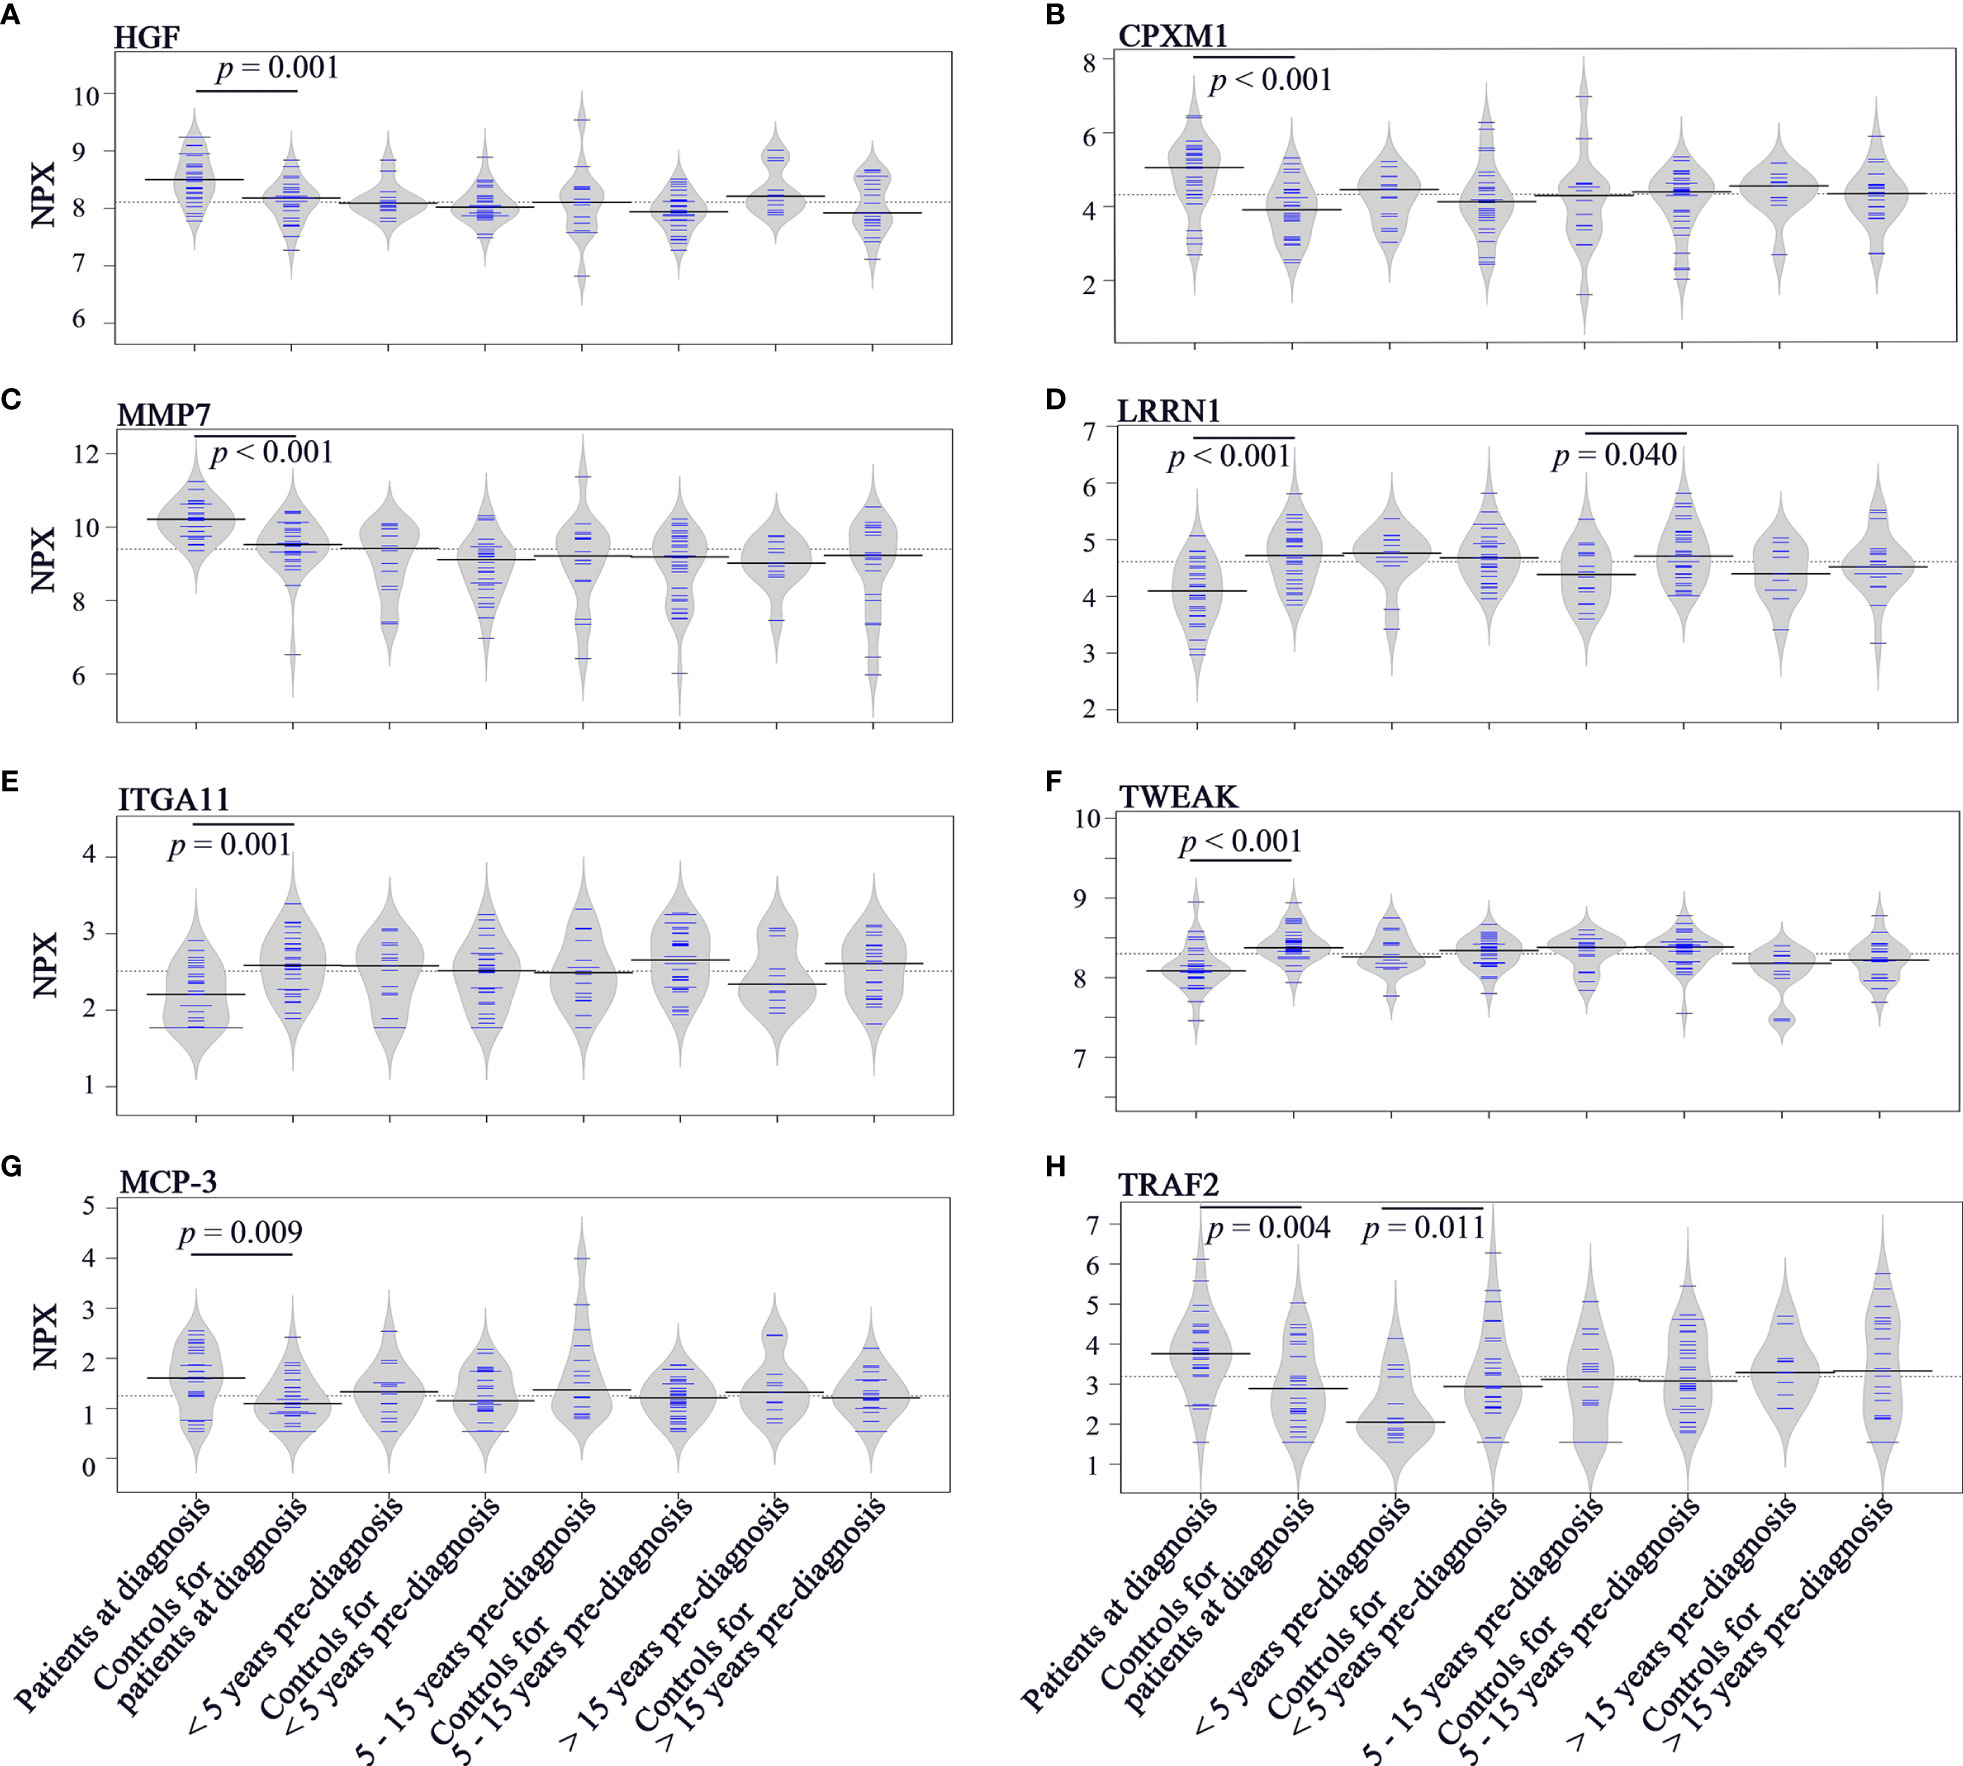
Figure 4 Bean plots showing protein levels in different groups of plasma samples. (A) HGF. (B) CPXM1. (C) MMP7. (D) LRRN1. (E) ITGA11. (F) TWEAK. (G) MCP-3. (H) TRAF2. The grey area shows the estimated density of distribution. The horizontal lines within the grey area show individual observations, while the black line is the median.
Longitudinal trends of change in MCP-3 (C-C Motif Chemokine Ligand 7) and TRAF2 (TNF Receptor Associated Factor 2), the two proteins showing discriminatory potential in analysis of both diagnostic and pre-diagnostic plasma, were also investigated. As shown in Figure 4G, levels of MCP-3 were upregulated in diagnostic samples compared to matched controls (p = 0.009). However, no significant differences in MCP-3 levels were identified for the three subgroups of pre-diagnostic samples compared to their controls (p > 0.05). TRAF2 was downregulated in < 5 years pre-diagnostic samples (p = 0.011) but upregulated in diagnostic samples (p = 0.004) (Figure 4H).
ROC curve for < 5 years pre-diagnostic plasma and their controls revealed that TRAF2 had acceptable discrimination ability for the prediction of SCCOT (AUC = 0.736, p = 0.012). At cutoff value of 2.5 NPX, the specificity was 0.733 and the sensitivity was 0.714.
Performance of potential diagnostic markers are shown in Table S3. MMP7, TWEAK and LRRN1 showed good discrimination ability (0.8 ≤ AUC < 0.9), whereas other proteins only showed acceptable discrimination ability (0.7 ≤ AUC < 0.8).
Samples From the Same Patient Before and at Diagnosis of SCCOT
Longitudinal trends in changes in protein levels can be investigated by following the same patient over time, and a pre-diagnostic sample was available for five of our patients, ranging from 2 to 21 years before diagnosis (Figure 5). An increase in diagnostic plasma compared to pre-diagnostic plasma was seen for cases 1-3, with plasma samples taken 2, 4 and 9 years respectively before diagnosis. For the other two cases with pre-diagnostic samples collected 19 and 21 years before diagnosis, TRAF2 levels at diagnosis were slightly lower or similar to the pre-diagnostic samples.
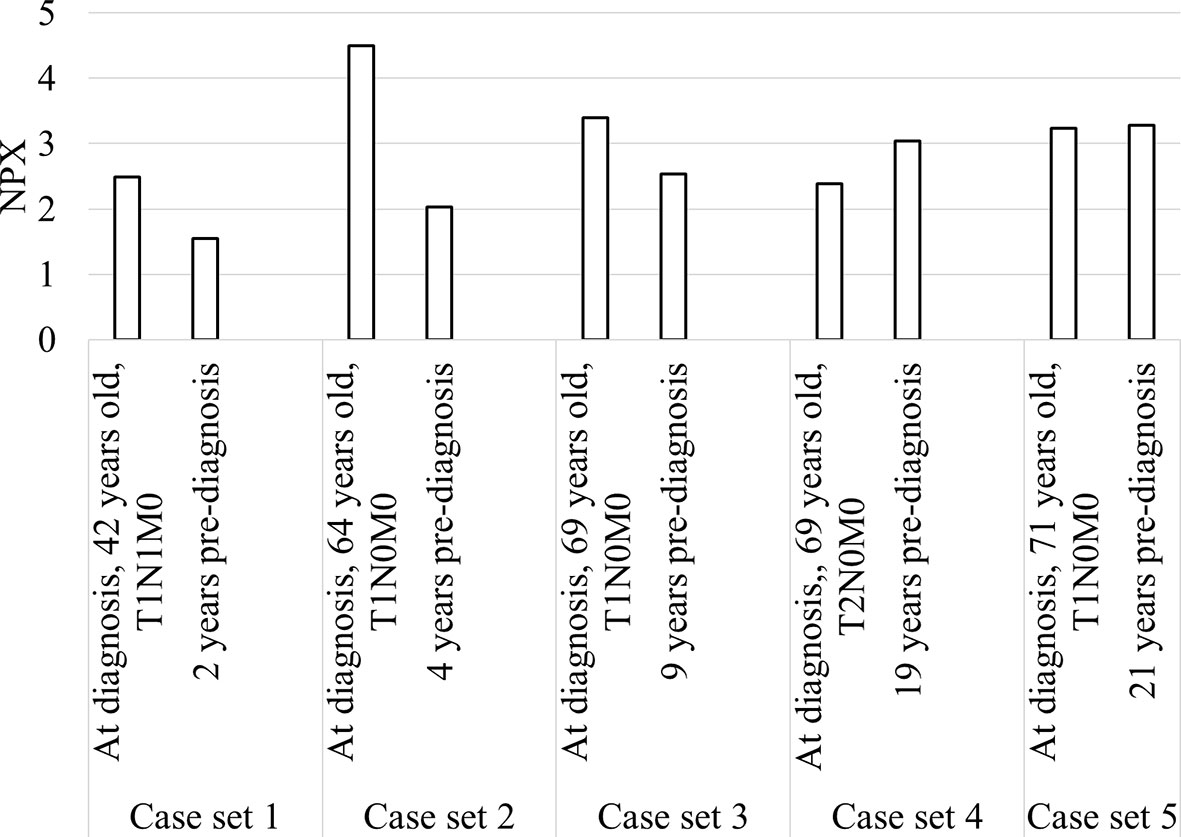
Figure 5 Bar chart showing TRAF2 levels in the five patients with diagnostic and pre-diagnostic plasma.
TRAF2 Levels and Clinical Features
Clinical information such as age, sex, smoking, alcohol, body mass index (BMI), fasting state, tumor stage and node status was available for the majority of diagnostic samples, and the impact of these clinical factors on TRAF2 levels were studied. As shown in Figure 6, no significant difference in TRAF2 levels was demonstrated except for alcohol consumption (p = 0.031). Considering TRAF2 levels in the controls matched to diagnostic plasma, no significant difference regarding alcohol consumption was seen (Figure S2). Due to insufficient data on alcohol consumption status for pre-diagnostic plasma and their matched controls (Table S4), the impact of alcohol consumption on TRAF2 level could not be further assessed.
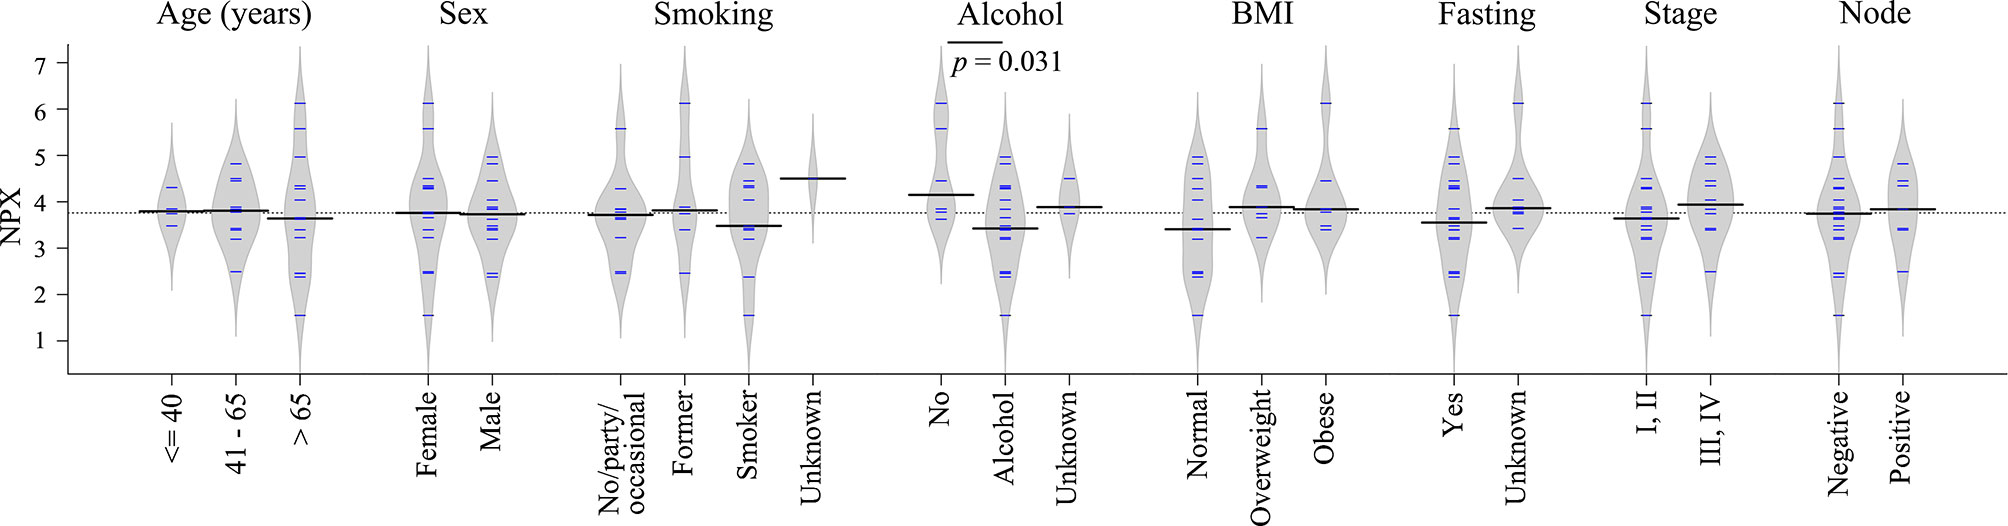
Figure 6 Bean plots showing TRAF2 levels in patients with different clinical features. The grey area shows the estimated density of distribution. The horizontal lines within the grey area show individual observations, while the black line is the median.
Discussion
Blood samples are one of the most commonly used liquid biopsies. Within these samples promising biomarkers such as proteins, miRNAs, exosomes, metabolites, circulating tumor cells and circulating tumor DNA can be found (15). We have previously reported that circulating proteins are more promising than circulating miRNAs to detect SCCOT (8). In the present study, we expanded our investigations by measuring additional circulating proteins and including pre-diagnostic samples from individuals who subsequently developed SCCOT. A total of 261 unique proteins related to inflammation and/or cancer were evaluated in patient samples and matched controls without any history of cancer.
As indicated by PCA, protein profiles in plasma samples were similar between cases and controls. According to OPLS-DA, 21 proteins were identified as discriminant factors that separate diagnostic plasma from matched controls. However, only a handful of proteins were suggested as discriminatory in pre-diagnostic plasma. These pre-diagnostic samples had been collected within a broad time-span prior to the clinical diagnosis of SCCOT, and it was evident that the closer the time to diagnosis, the higher the degree of change in plasma proteins. TRAF2 was the only protein identified in both < 5 years pre-diagnostic and diagnostic samples. AUC values indicated the potential of TRAF2 in prediction and diagnosis of SCCOT. Notably, TRAF2 levels decreased in pre-diagnostic plasma, whereas they increased at diagnosis, indicating varying levels during cancer development.
Tumor necrosis factor (TNF) is a major inflammatory cytokine having both positive and negative effects on cancer (16). By activation of two receptors (TNFR1 which is ubiquitously expressed and TNFR2 which shows restricted expression) and subsequent recruitment of adaptor proteins, TNF can activate multiple signal transduction pathways involved in inflammation, cell survival or cell death, depending on the cellular context (16). TRAF2 can be recruited to both receptors and is a key player in dictating the outcome of TNF stimulation when both receptors are expressed on the same cell (17). Stimulation of TNFR1 and TNFR2 recruits TRAF2 and leads to canonical NF-κB and JNK kinase signaling to drive inflammation and cell survival. However, prolonged TNF stimulation of TNFR2 causes TRAF2 degradation and subsequent activation of the non-canonical NF-κB pathway. Degradation and release of TRAF2 from TNFR1 can in turn induce caspase-8 dependent apoptosis (17). It has been shown that TRAF2 is a frequently amplified oncogene in human epithelial cancers (18). With cancer development being a highly complex process and TRAF2 having varying roles under different cellular states, it is interesting to see the variation of TRAF2 levels in the plasma samples studied here.
It is worth noting that TRAF2 levels were significantly downregulated in patients with alcohol consumption compared to non-alcohol patients. Excessive alcohol consumption is a well-known risk factor for cancer development, including head and neck cancer (19). Prolonged alcohol exposure activates monocytes and macrophages, resulting in an increased production of pro-inflammatory cytokines such as TNF, which could contribute to tumor initiation and progression (20). The lower TRAF2 levels in patients with alcohol consumption could thus indicate degradation of TRAF2 in response to prolonged TNF stimulation. The potential role of alcohol consumption on TRAF2 levels can, however, not be clarified based on the present data.
To identify biomarkers for early detection of cancer, it is vital to perform longitudinal studies comprising asymptomatic individuals who are diagnosed with cancer at a later date. However, the majority of biomarker studies only analyze samples from patients at diagnosis compared to healthy controls. In a recent large scale retrospective longitudinal study, it was shown that cancer can be non-invasively detected up to four years before conventional diagnosis using a DNA methylation-based blood test (21). In another study using pre-diagnostic plasma samples from gastric cancer patients, increased HGF levels associated with cancer risk 6 years or longer prior to diagnosis (22). However, in our study, no increase in HGF levels were seen before diagnosis of SCCOT. Recently, using samples from the same biobank as in our study, Harlid et al. reported that it is challenging to develop effective biomarkers for early detection of colorectal cancer from plasma protein profiles in pre-diagnostic samples (23).
Ideally included more samples, especially pre-diagnostic plasma collected up to 5 years before diagnosis, should have been included in the analysis. Plasma samples collected from the same individual over time should also be investigated in order to adjust the effect of non-cancer-specific factors, such as aging and changes in lifestyles. Dynamic changes in protein levels and degree of variation should also be clarified.
In summary, we demonstrated that plasma protein profiles were altered in patients diagnosed with SCCOT and that only some of the alterations were detectable in circulation before a tumor was visible. Variation in protein levels during cancer development is important to map for the identification of predictive biomarkers. Furthermore, the potential impact of alcohol on TRAF2 levels needs further investigation.
Data Availability Statement
The raw data supporting the conclusions of this article will be made available by the authors, without undue reservation.
Ethics Statement
The studies involving human participants were reviewed and approved by Regional Ethics Committee, Sweden. The patients/participants provided their written informed consent to participate in this study.
Author Contributions
Conceptualization, XG and KN. Data curation, XG. Formal analysis, XG and LW. Funding acquisition, KN and PC. Methodology, XG and KN. Project administration, KN. Supervision, KN. Writing - original draft, XG and KN. Writing - review & editing, XG, PC, BE, AS, NS, KZ, and KN. All authors contributed to the article and approved the submitted version.
Funding
This study was supported by Lion’s Cancer Research Foundation, Umeå University; The Swedish Cancer Society (contract number 20 0754 PjF 01H); Umeå University; Region Västerbotten; Ministry of Health Czech Republic, conceptual development of research organization (MMCI, 00209805).
Conflict of Interest
The authors declare that the research was conducted in the absence of any commercial or financial relationships that could be construed as a potential conflict of interest.
Publisher’s Note
All claims expressed in this article are solely those of the authors and do not necessarily represent those of their affiliated organizations, or those of the publisher, the editors and the reviewers. Any product that may be evaluated in this article, or claim that may be made by its manufacturer, is not guaranteed or endorsed by the publisher.
Acknowledgments
We thank the Biobank Research Unit at Umeå University, Västerbotten Intervention Programme, the Northern Sweden MONICA study and the County Council of Västerbotten for providing data and samples and acknowledge the contribution from Biobank Sweden. Biobank Sweden is supported by the Swedish Research Council (VR 2017-00650).
Supplementary Material
The Supplementary Material for this article can be found online at: https://www.frontiersin.org/articles/10.3389/fonc.2021.753699/full#supplementary-material
References
1. Williams SA, Kivimaki M, Langenberg C, Hingorani AD, Casas JP, Bouchard C, et al. Plasma Protein Patterns as Comprehensive Indicators of Health. Nat Med (2019) 25(12):1851–7. doi: 10.1038/s41591-019-0665-2
2. Landegren U, Hammond M. Cancer Diagnostics Based on Plasma Protein Biomarkers: Hard Times But Great Expectations. Mol Oncol (2020) 15(6):1715–26. doi: 10.1002/1878-0261.12809
3. Suhre K, McCarthy MI, Schwenk JM. Genetics Meets Proteomics: Perspectives for Large Population-Based Studies. Nat Rev Genet (2021) 22(1):19–37. doi: 10.1038/s41576-020-0268-2
4. Fuzery AK, Levin J, Chan MM, Chan DW. Translation of Proteomic Biomarkers Into FDA Approved Cancer Diagnostics: Issues and Challenges. Clin Proteomics (2013) 10(1):13. doi: 10.1186/1559-0275-10-13
5. Bray F, Ferlay J, Soerjomataram I, Siegel RL, Torre LA, Jemal A. Global Cancer Statistics 2018: GLOBOCAN Estimates of Incidence and Mortality Worldwide for 36 Cancers in 185 Countries. CA Cancer J Clin (2018) 68(6):394–424. doi: 10.3322/caac.21492
6. SweHNCR. The Swedish Head and Neck Cancer Register. (2020). Available at: https://cancercentrum.se/globalassets/cancerdiagnoser/huvud-och-hals/kvalitetsregister/presentation-in-english-swehncr.pdf
8. Boldrup L, Troiano G, Gu X, Coates P, Fahraeus R, Wilms T, et al. Evidence That Circulating Proteins are More Promising Than miRNAs for Identification of Patients With Squamous Cell Carcinoma of the Tongue. Oncotarget (2017) 8(61):103437–48. doi: 10.18632/oncotarget.21402
9. Hussein AA, Forouzanfar T, Bloemena E, de Visscher J, Brakenhoff RH, Leemans CR, et al. A Review of the Most Promising Biomarkers for Early Diagnosis and Prognosis Prediction of Tongue Squamous Cell Carcinoma. Br J Cancer (2018) 119(6):724–36. doi: 10.1038/s41416-018-0233-4
10. Liu KYP, Lu XJD, Zhu YS, Le N, Kim H, Poh CF. Plasma-Derived Inflammatory Proteins Predict Oral Squamous Cell Carcinoma. Front Oncol (2018) 8:585. doi: 10.3389/fonc.2018.00585
11. Boldrup L, Coates P, Gu X, Wang L, Fahraeus R, Wilms T, et al. Low Potential of Circulating Interleukin 1 Receptor Antagonist as a Prediction Marker for Squamous Cell Carcinoma of the Head and Neck. J Oral Pathol Med (2021) 50(8):785–94. doi: 10.1111/jop.13187
12. Norberg M, Wall S, Boman K, Weinehall L. The Vasterbotten Intervention Programme: Background, Design and Implications. Glob Health Action (2010) 3:4643. doi: 10.3402/gha.v3i0.4643
13. Wheelock AM, Wheelock CE. Trials and Tribulations of 'Omics Data Analysis: Assessing Quality of SIMCA-Based Multivariate Models Using Examples From Pulmonary Medicine. Mol Biosyst (2013) 9(11):2589–96. doi: 10.1039/c3mb70194h
14. Spitzer M, Wildenhain J, Rappsilber J, Tyers M. BoxPlotR: A Web Tool for Generation of Box Plots. Nat Methods (2014) 11(2):121–2. doi: 10.1038/nmeth.2811
15. Kong L, Birkeland AC. Liquid Biopsies in Head and Neck Cancer: Current State and Future Challenges. Cancers (Basel) (2021) 13(8). doi: 10.3390/cancers13081874
16. Balkwill F. Tumour Necrosis Factor and Cancer. Nat Rev Cancer (2009) 9(5):361–71. doi: 10.1038/nrc2628
17. Borghi A, Verstrepen L, Beyaert R. TRAF2 Multitasking in TNF Receptor-Induced Signaling to NF-Kappab, MAP Kinases and Cell Death. Biochem Pharmacol (2016) 116:1–10. doi: 10.1016/j.bcp.2016.03.009
18. Shen RR, Zhou AY, Kim E, O'Connell JT, Hagerstrand D, Beroukhim R, et al. TRAF2 is an NF-kappaB-Activating Oncogene in Epithelial Cancers. Oncogene (2015) 34(2):209–16. doi: 10.1038/onc.2013.543
19. Johnson DE, Burtness B, Leemans CR, Lui VWY, Bauman JE, Grandis JR. Head and Neck Squamous Cell Carcinoma. Nat Rev Dis Primers (2020) 6(1):92. doi: 10.1038/s41572-020-00224-3
20. Ratna A, Mandrekar P. Alcohol and Cancer: Mechanisms and Therapies. Biomolecules (2017) 7(3). doi: 10.3390/biom7030061
21. Chen X, Gole J, Gore A, He Q, Lu M, Min J, et al. Non-Invasive Early Detection of Cancer Four Years Before Conventional Diagnosis Using a Blood Test. Nat Commun (2020) 11(1):3475. doi: 10.1038/s41467-020-17316-z
22. Jang J, Ma SH, Ko KP, Choi BY, Yoo KY, Park SK. Hepatocyte Growth Factor in Blood and Gastric Cancer Risk: A Nested Case-Control Study. Cancer Epidemiol Biomarkers Prev (2020) 29(2):470–6. doi: 10.1158/1055-9965.EPI-19-0436
Keywords: TRAF2, plasma protein, tongue cancer, prediction, biomarker
Citation: Gu X, Coates P, Wang L, Erdogan B, Salehi A, Sgaramella N, Zborayova K and Nylander K (2021) Variation in Plasma Levels of TRAF2 Protein During Development of Squamous Cell Carcinoma of the Oral Tongue. Front. Oncol. 11:753699. doi: 10.3389/fonc.2021.753699
Received: 05 August 2021; Accepted: 01 November 2021;
Published: 23 November 2021.
Edited by:
Sabrina Wurzba, McGill University, CanadaReviewed by:
Mariana Maschietto, Centro Infantil Boldrini, BrazilGiuseppe Troiano, University of Foggia, Italy
Copyright © 2021 Gu, Coates, Wang, Erdogan, Salehi, Sgaramella, Zborayova and Nylander. This is an open-access article distributed under the terms of the Creative Commons Attribution License (CC BY). The use, distribution or reproduction in other forums is permitted, provided the original author(s) and the copyright owner(s) are credited and that the original publication in this journal is cited, in accordance with accepted academic practice. No use, distribution or reproduction is permitted which does not comply with these terms.
*Correspondence: Xiaolian Gu, Xiaolian.gu@umu.se