 Hiroyuki Kagawa1
 Keisuke Miki1*
 Seigo Kitada1Mari Miki1Kenji Yoshimura1Yohei Oshitani1Kohei Nishida1Nobuhiko Sawa1Kazuyuki Tsujino1Ryoji Maekura1,2
- 1Department of Respiratory Medicine, National Hospital Organization Toneyama National Hospital, Toyonaka, Japan
- 2Graduate School of Health Care Sciences, Jikei Institute, Osaka, Japan
Background: Patients with chronic obstructive pulmonary disease (COPD) show varying mechanisms of exertional dyspnea with different exercise capacities.
Methods: To investigate the pathophysiologic conditions related to exertional dyspnea, 294 COPD patients were evaluated using cardiopulmonary exercise testing (CPET) with arterial blood analyses, with the patients classified into two groups according to their exercise limitation: the leg fatigue group (n = 58) and the dyspnea group (n = 215). The dyspnea group was further subdivided into four groups based on peak oxygen uptake (V°O2 in mL/min/kg): group A (< 11), group B (11 to < 15), group C (15 to < 21), and group D (≥21).
Results: In the dyspnea group, group A (n = 28) showed the following findings: (i) the forced expiratory volume in 1 s was not correlated with the peak V°O2 (p = 0.288), (ii) the arterial oxygen tension (PaO2) slope (peak minus resting PaO2/ΔV°O2) was the steepest (p < 0.0001) among all subgroups, (iii) reduced tidal volume (VT) was negatively correlated with respiratory frequency at peak exercise (p < 0.0001), and (iv) a break point in exertional VT curve was determined in 17 (61%) patients in group A. In these patients, there was a significant negative correlation between bicarbonate ion (HCO3-) levels at peak exercise and VT level when the VT-break point occurred (p = 0.032). In group D (n = 46), HCO3- levels were negatively correlated with plasma lactate levels (p < 0.0001). In all subgroups, the HCO3- level was negatively correlated with minute ventilation. The dyspnea subgroups showed no significant differences in the overall mean pH [7.363 (SD 0.039)] and Borg scale scores [7.4 (SD, 2.3)] at peak exercise.
Conclusions: During exercise, ventilation is stimulated to avoid arterial blood acidosis and hypoxemia, but ventilatory stimulation is restricted in the setting of reduced respiratory system ability. These conditions provoke the exertional dyspnea in COPD. Although symptom levels were similar, the exertional pathophysiologic conditions differed according to residual exercise performance; moreover, COPD patients showed great inter-individual variability. An adequate understanding of individual pathophysiologic conditions using CPET is essential for proper management of COPD patients.
Introduction
Exertional dyspnea is a major symptom that limits exercise ability in patients with chronic obstructive pulmonary disease (COPD), especially in the advanced stages of the disease (O'Donnell et al., 2009; Parshall et al., 2012). The factors causing exertional dyspnea include single or combined ventilatory disorders secondary to reduced ventilatory capacity, increased ventilatory requirement, and gas exchange abnormalities, including functional skeletal muscle disorder and cardiac dysfunction (Palange et al., 2007). Consequently, exertional dyspnea due to COPD might influence the entire body and make daily living laborious (Laveneziana and Palange, 2012). Therefore, an adequate understanding of an individual patient's condition via evaluation of exercise intolerance and cardiopulmonary function is vital for development of a personalized treatment strategy based on pathophysiology. Using cardiopulmonary exercise testing (CPET), previous studies have reported that (i) COPD patients with severely reduced exercise tolerance develop exercise-induced hypoxemia, sympathetic overactivity, and progressive exertional acidosis at low-intensity exercise (Maekura et al., 2014); (ii) such life-threatening factors are predictors of mortality (Yoshimura et al., 2014); and (iii) screening and avoiding such factors and a pulmonary rehabilitation program with exercise training and occupational therapy can improve the prognosis of patients with severe COPD (Maekura et al., 2015).
Although the disease severity of COPD is based on the degree of airflow limitation, as defined by forced expiratory volume in 1 s (FEV1), a few interesting studies have attempted evaluation of COPD severity on the basis of exercise tolerance (Oga et al., 2005; Maekura et al., 2014). Therefore, after grouping patients according to the exercise tolerance determined using CPET and combining those with a similar degree of airflow limitation (FEV1), we investigated the pathophysiologic conditions related to exertional dyspnea in a broader spectrum of COPD patients. First, we compared the pathologic conditions between two groups classified according to the reason for exercise limitation during CPET: the dyspnea group and the leg fatigue group. Second, focusing on the dyspnea group, we aimed to investigate (i) whether exercise intolerance was correlated with the degree of air flow limitation and breathing pattern during exercise; (ii) how exercise-induced hypoxemia was influenced by other pathophysiologic variables during exercise; and (iii) the underlying mechanism of exercise-induced acidosis, which often occurs at the end stage of CPET. Considering these aspects, we performed a detailed re-evaluation of the variability of pathophysiological conditions in patients with COPD. We addressed the necessity and usefulness of CPET with arterial blood analysis for evaluation of pathophysiological conditions and management in patients with COPD.
Materials and Methods
Patients
CPET with arterial blood analyses was consecutively performed in 2,831 patients with exertional dyspnea, based on a modified Medical Research Council score (American Thoracic Society, 1995a; Pauwels et al., 2001; Global Initiative for Chronic Obstructive Lung Disease. GOLD, 2017) of 1 or higher, during clinical practice at our institution between May 1999 and January 2011. We excluded patients who had absolute contraindications to clinical exercise testing (Clinical exercise testing with reference to lung diseases: indications, standardization and interpretation strategies, 1997), who showed COPD exacerbation (respiratory infection) within the past 2 months, and who were participating in a pulmonary rehabilitation program. We selected potential study participants who had been prescribed an appropriate medication for 2 months and underwent CPET for assessment of their pathophysiological conditions before introduction of the pulmonary rehabilitation program. The diagnosis of COPD was confirmed on the basis of the Global Initiative for Chronic Obstructive Lung Disease definition and classification (American Thoracic Society, 1995a; Pauwels et al., 2001). We excluded patients with comorbidities (e.g., severe cardiovascular disease, active tuberculosis, definite sequelae of tuberculosis, asthma, pulmonary fibrosis, or neuromuscular disease) that could contribute to dyspnea and exercise limitation. Thus, we included 294 patients with stable COPD in the study. Although CPET is covered by the Japanese healthcare insurance system, the protocols were fully explained to the participating patients by the attending physicians. All patients provided written informed consent to undergo the protocols before CPET. The protocol of the retrospective study was approved by the institutional review board of the National Hospital Organization Toneyama National Hospital (approval number: 2007-0711) and was in accordance with the Declaration of Helsinki for experiments involving human subjects.
Cardiopulmonary Exercise Testing
CPET was performed on a treadmill (Marquette CASE series T 2001; GE Healthcare, Tokyo, Japan). Symptom-limited exercise tests were conducted using the Sheffield protocol or one of the two modified Sheffield protocols after Allen's test, as described previously (Maekura et al., 2014). The exercise protocol was selected on the basis of the patient's daily activities and pulmonary function test results. Progressive incremental exercise testing was discontinued when the subject experienced breathlessness and/or leg fatigue, reached the predicted maximum heart rate (HR), or showed notable electrocardiographic changes, such as an ST segment depression of >2 mm or a short run of premature ventricular contractions. To obtain reliable data, CPET was performed without encouragement, especially during exercise. Pre-exercise resting measurements were obtained during the steady-state period after at least 3 min of breathing through a mask. Data for the expired gas were measured using the Aero monitor AE310S (Minato Medical Science Co., Ltd, Osaka, Japan). Ventilatory values were measured on a breath-by-breath basis and were presented as 30-s averages at rest, at 1- and 3-min intervals during exercise, and at the end of exercise. Dyspnea was measured with the Borg scale (Borg, 1982). Before testing, the Borg scale was explained to the patients and its endpoints were ranked from 0 for “no difficulty in breathing” to 10 for “the most severe difficulty in breathing,” based on the subject's previous experience or perception. The subjects rated their dyspnea at rest, every minute during exercise, and at peak exercise. Immediately after exercise cessation and completion of mechanical measurements, the subjects were asked for their reason(s) for exercise termination (i.e., dyspnea, leg fatigue, both, or others). Arterial blood samples for blood gas analyses and plasma lactate and plasma norepinephrine assessments were collected at rest, during the last 15 s of each exercise stage, and at the end of exercise, as previously described (Maekura et al., 2014). Blood gas analyses were performed using ABL800 FLEX (Radiometer, Copenhagen, Denmark). Indirect maximum voluntary ventilation (MVV) was calculated as FEV1 × 35 (Johnson et al., 1999). The dyspnea index was calculated as peak minute ventilation ()/indirect MVV (Hallstrand et al., 2000). Breathing reserve was calculated as indirect MVV– at peak exercise (Wasserman et al., 2005). Predicted maximum HR was calculated as 220–age in years (Wasserman et al., 2005). The percentage of HR reserve was calculated as HR at peak exercise/predicted maximum HR. The change in arterial carbon dioxide tension (ΔPaCO2) was calculated as peak PaCO2-resting PaCO2. The change in oxygen uptake (Δ) was calculated as peak -resting As a measure of the severity of exercise-induced hypoxemia, arterial oxygen tension (PaO2)-slope was calculated as (peak PaO2-resting PaO2)/Δ (Hiraga et al., 2003). The break points in VT, dyspnea (Borg scale), and plasma lactate level during exercise were determined for each subject using the intersection of two lines on individual plots of each parameter's curve (Miki et al., 2009).
Pulmonary Function Testing
Post-bronchodilator spirometry (CHESTAC 8800; CHEST M.I. Inc., Tokyo, Japan) was performed. The highest measurements were used for subsequent analyses, as previously described (American Thoracic Society, 1995b; Borrill et al., 2005).
Data Analysis
To confirm the distribution of FEV1 at different exercise tolerance levels, all patients were grouped into seven groups according to peak increments of 2 mL·min−1·kg−1 and into four groups according to similarities in the mean FEV1 level (Figure 1). Next, all patients (n = 294) were divided into three groups: the dyspnea group (n = 215) consisted of patients whose exercise limitation during CPET was primarily due to exertional dyspnea, which was defined as breathing discomfort alone or in conjunction with leg fatigue; the leg fatigue group (n = 58) consisted of patients whose exercise limitation was primarily due to leg fatigue; and the other exercise limitations (EL) group (n = 21) consisted of patients whose exercise limitation was due to electrocardiogram (ECG) changes, achievement of the predicted maximum HR, chest pain, and thirst (Figure 2).
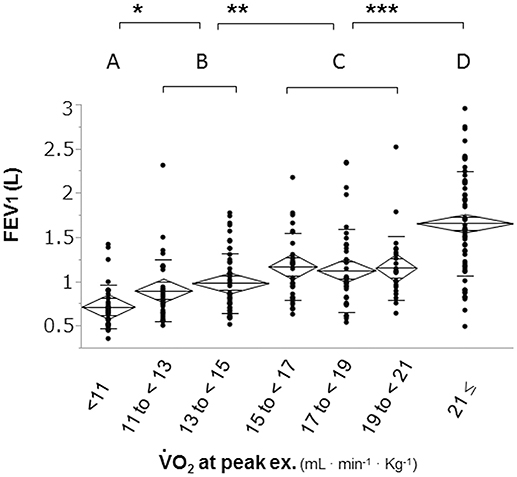
Figure 1. Distribution of FEV1 based on exercise tolerance. Patients were divided into seven groups according to increments of 2 mL·min−1·kg−1 in peak to confirm the distribution of FEV1 at different levels of exercise tolerance. The second subdivision of the patients was into four subgroups: group A (< 11 ml·min−1·kg−1); group B (11 to < 15 mL·min−1·kg−1); group C (15 to < 21 mL·min−1·kg−1), and group D (≥21 mL·min−1·kg−1). FEV1: forced expiratory volume in one second; : oxygen uptake; *p < 0.05, **p < 0.01 ***p < 0.0001 using Tukey–Kramer honestly significant test.
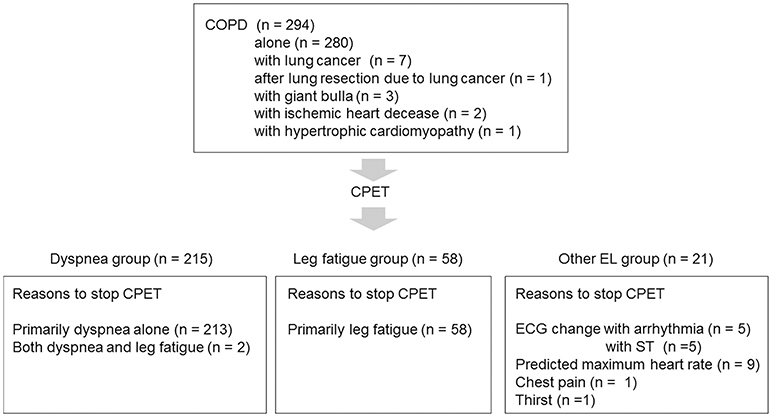
Figure 2. Patient selection flowchart COPD, chronic obstructive pulmonary disease; CPET, cardiopulmonary exercise testing; ECG, electrocardiogram; EL, exercise limitation.
Statistical analyses were performed using the JMP 11 (SAS Institute Inc., Cary, NY, USA). The reported values were consistently expressed as mean ± standard deviation. Differences between the dyspnea and leg fatigue groups were analyzed using the Student's t-test and chi-squared test. A parametric one-way analysis of variance for normally distributed variables was used, and a non-parametric Kruskal–Wallis test for non-normally distributed variables was used to determine the differences in physiologic parameters among the four subgroups in the dyspnea group. Differences between pairs of groups among the dyspnea groups were analyzed using the Tukey–Kramer honestly significant difference test. The relationships between the values obtained by the pulmonary function test and CPET were assessed using the Pearson's correlation coefficient and linear regression analysis. Differences between the groups were considered statistically significant when p values were less than 0.05.
Results
This study included a total of 294 patients (273 men) with stable COPD; the other characteristics are shown in Table 1.
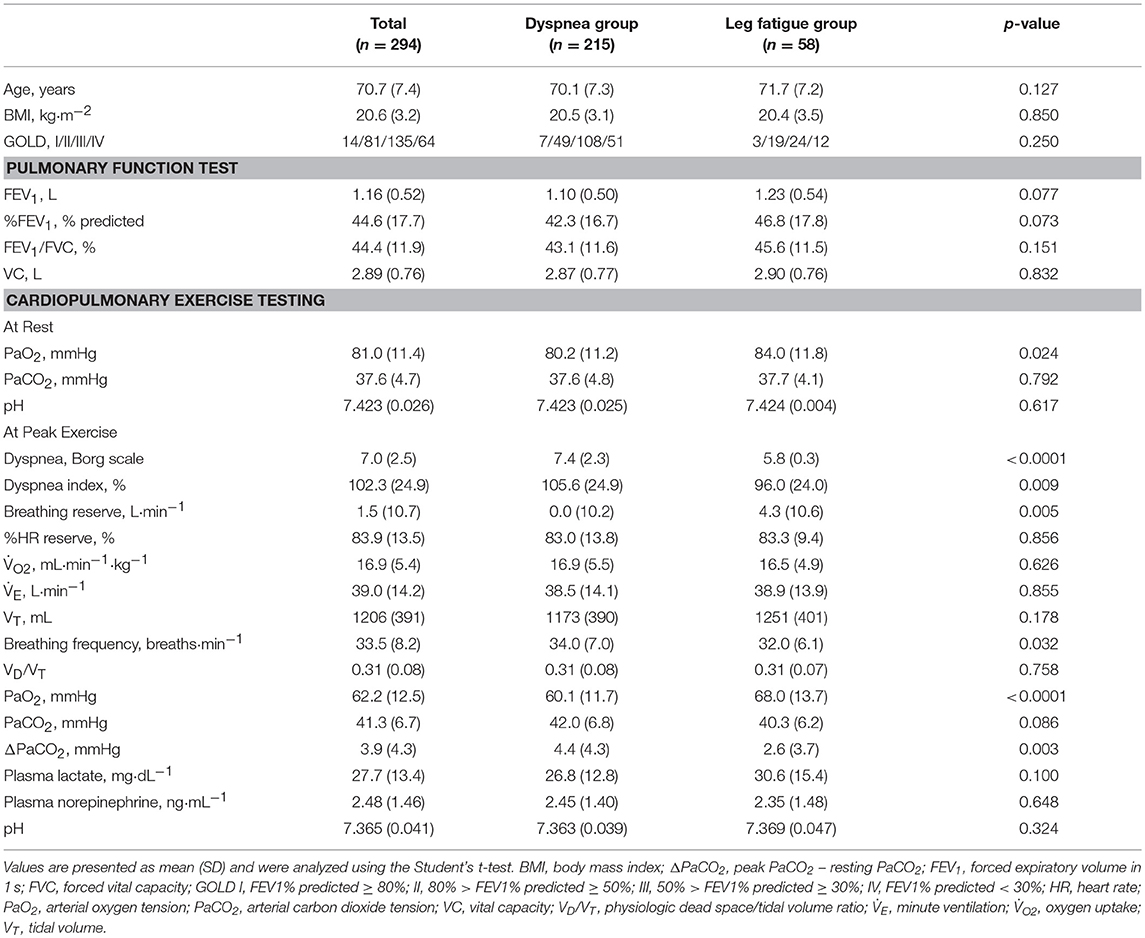
Table 1. Baseline characteristics of the study population.
Comparison Between the Dyspnea and Leg Fatigue Groups
In comparison with the dyspnea group, the leg fatigue group showed a significantly lower severity of dyspnea (Borg scale) and breathing frequency at peak exercise and ΔPaCO2; significantly higher values of PaO2 at peak exercise and breathing reserve; and no significant differences in % predicted FEV1, body mass index, VD/VT, and at peak exercise (Table 1). Three patients with histories of ischemic heart disease or hypertrophic cardiomyopathy stopped CPET due to leg fatigue.
In the Dyspnea Group
Relationships Among Exercise Intolerance, Airflow Limitation, and Breathing Pattern
The overall peak correlated with the FEV1 (r2 = 0.33, p < 0.0001), but the correlation between peak and FEV1 in each subgroup was almost negligible (A: r2 = 0.04, p = 0.288; B: r2 = 0.03, p = 0.200; C: r2 = 0.00, p = 0.802; D: r2 = 0.09, p = 0.049).
Overall, in the dyspnea subgroups, the FEV1 showed good correlations with the (r2 = 0.63, p < 0.0001) and VT (r2 = 0.62, p < 0.0001) at peak exercise. Likewise, the FEV1 was strongly correlated with the and VT at peak exercise in each subgroup, except with the VT in group A (r2 = 0.08) (Figures 3i,ii). Although the breathing reserve was similar among the groups (Table 2), the proportion of patients with ventilatory reserve (more than 10 L/min of breathing reserve) slightly differed among the groups: 2/28 (7%) in group A, 5/64 (8%) in group B, 9/77 (12%) in group C, and 9/46 (20%) in group D. Compared with group D, group A showed significantly lower , VT, PaO2, and plasma lactate level, and significantly higher dead space/tidal volume (VD/VT) ratio, /, PaCO2, and bicarbonate ion () level at peak exercise (Table 2). Among all groups, group A showed the lowest and VT and the highest VD/VT ratio at peak exercise. Compared with the results in the other subgroups, the VT at peak exercise in group A was less correlated with the Δ (the peak minus resting ) (Figure 3iii) and the (Figure 3iv), was negatively correlated with the respiratory frequency (Figure 3v), and was not correlated with the VD/VT ratio (Figure 3vi).
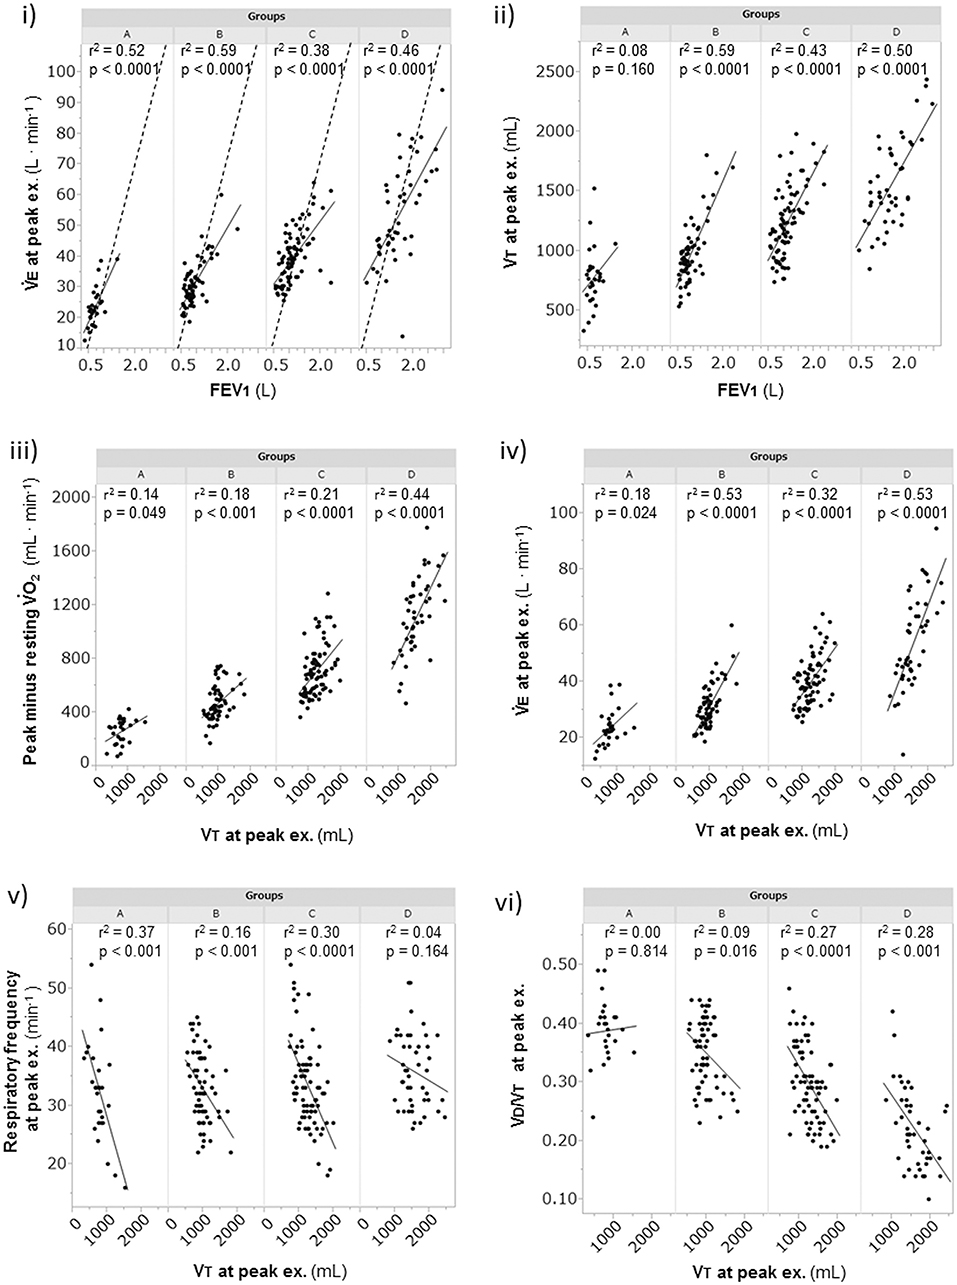
Figure 3. The relationships of the FEV1 and the VT at peak exercise during cardiopulmonary exercise testing. (i) relationship of to FEV1, (ii) relationship of VT to FEV1, (iii) relationship of obtained to VT, (iv) relationship of to VT, (v) relationship of respiratory frequency to VT, and (vi) relationship of VD/VT to VT. Group A (< 11 mL·min−1·kg−1); group B (11 to < 15 mL·min−1·kg−1); group C (15 to < 21 mL·min−1·kg−1); and group D (≥21 mL·min−1·kg−1). The dotted lines represent indirect MVV, which was calculated as FEV1 × 35. EX., exercise; FEV1, forced expiratory volume in 1 s; MVV, maximum voluntary ventilation; VD/VT, physiologic dead space/tidal volume ratio; , minute ventilation; , oxygen uptake; VT, tidal volume.
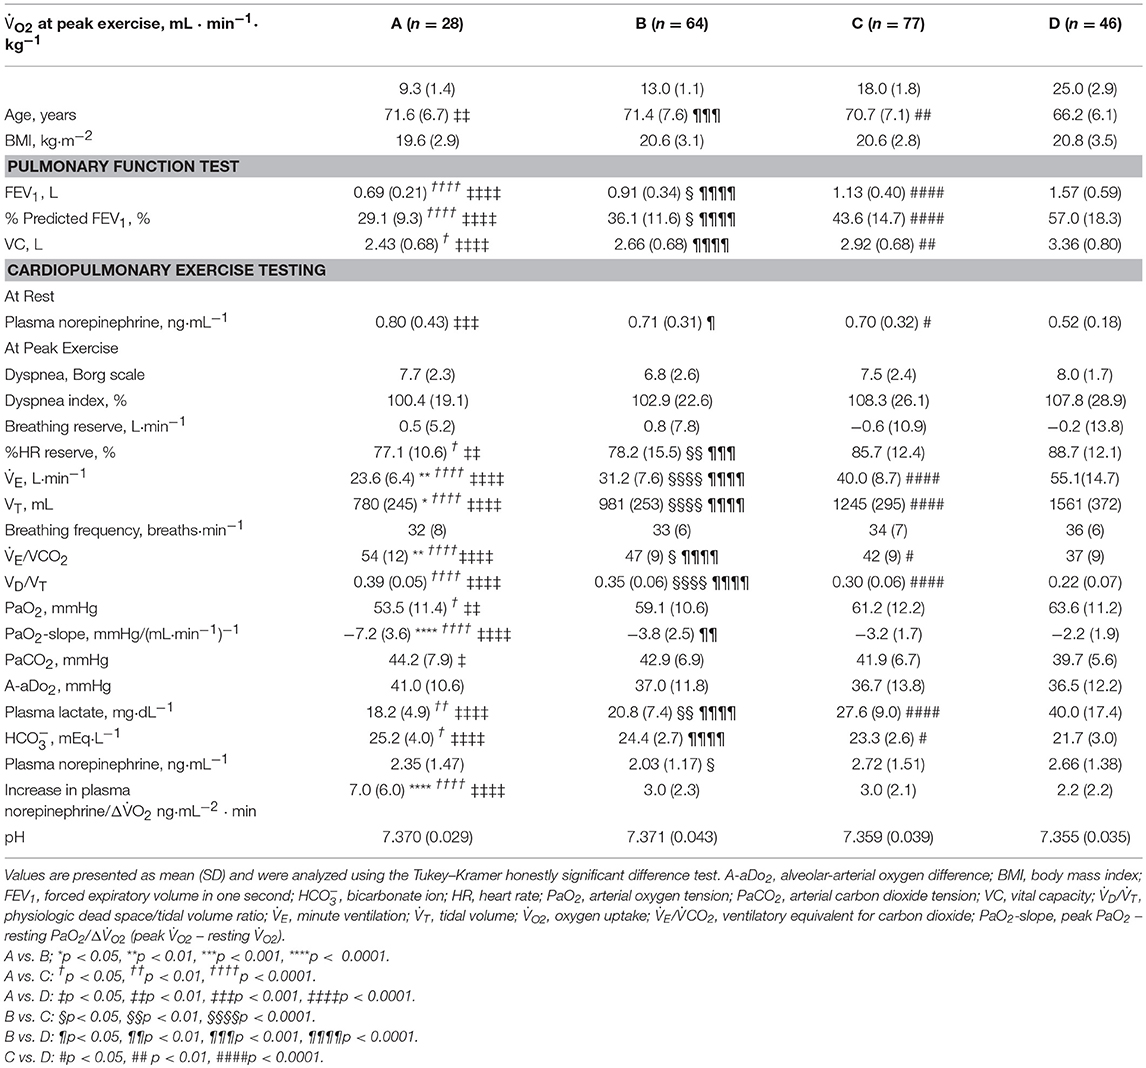
Table 2. Baseline characteristics and physiologic findings in the dyspnea group (N = 215).
Exercise-Induced Hypoxemia and Sympathetic Activity Level
A considerable number of patients showed exercise-induced hypoxemia (i.e., decrease in PaO2 to less than 60 mmHg during exercise) in all the groups: 21/28 (75%) in group A, 37/64 (58%) in group B, 40/77 (52%) in group C, and 21/46 (46%) in group D. In group A, PaO2 decreased in almost all patients, although some patients did not show progression to hypoxemia, and the PaO2-slope was the steepest among the PaO2-slopes in all the groups (A, −7.2 ± 3.6 mmHg·min·100 mL−1; B, −3.8 ± 2.5 mmHg·min·100 mL−1; C, −3.2 ± 1.7 mmHg·min·100 mL−1; D, −2.2 ± 1.9 mmHg·min·100 mL−1; p < 0.0001). In group A, the PaO2 at peak exercise did not correlate with the PaO2-slope (Figure 4), but it negatively correlated with the HCO3– level; this correlation was the strongest among all subgroups (Figure 5i). Compared with group D, each subgroup had significantly higher plasma norepinephrine levels at rest (Table 2). In group A, the increases in plasma norepinephrine concentrations during light workload exercise were similar to those in group D during heavy workload exercise.
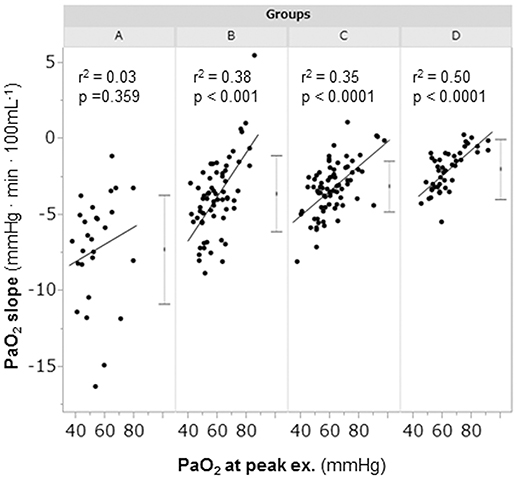
Figure 4. The relationships between the PaO2-slope and the PaO2 at peak exercise during cardiopulmonary exercise testing. Group A (< 11 mL·min−1·kg−1); group B (11 to < 15 mL·min−1·kg−1); group C (15 to < 21 mL·min−1·kg−1); and group D (≥21 mL·min−1·kg−1). The horizontal lines represent the standard deviation. The dots between the horizontal lines represent the mean. PaO2, arterial oxygen tension.
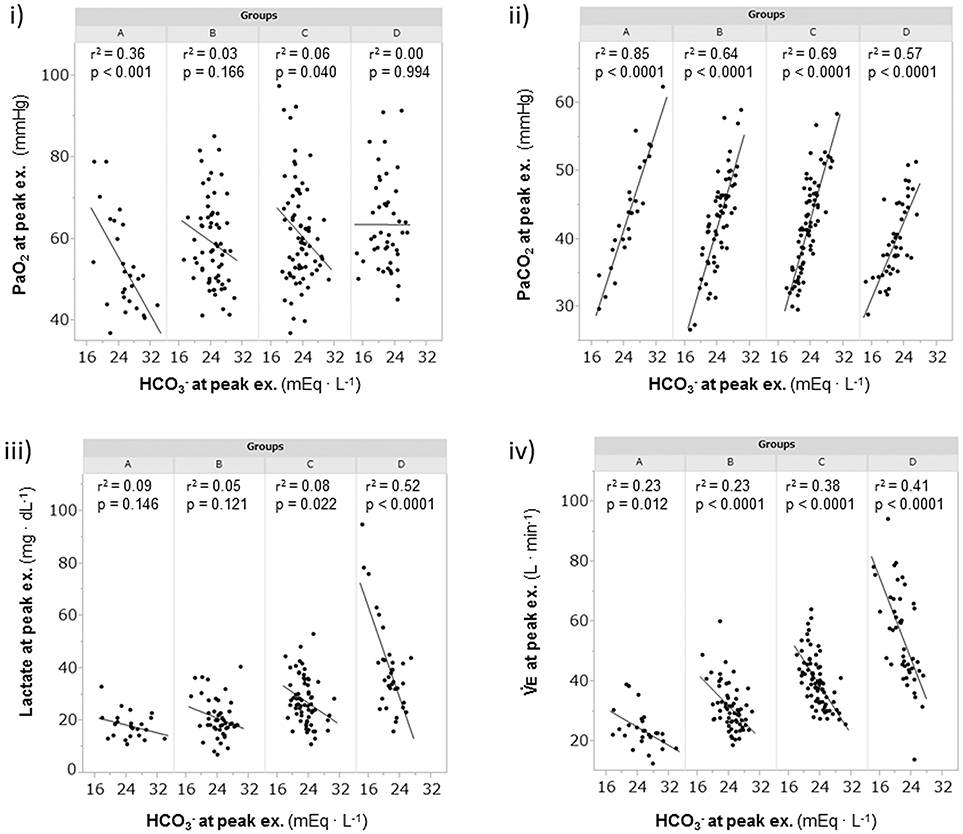
Figure 5. The relationships of the levels at peak exercise during cardiopulmonary exercise testin. (i) relationship between PaO2 and , (ii) relationship between PaCO2 and , (iii) relationship between lactate and , and (iv) relationship between and . Group A (< 11 mL·min−1·kg−1); group B (11 to < 15 mL·min−1·kg−1); group C (15 to < 21 mL·min−1·kg−1); and group D (≥21 mL·min−1·kg−1). , bicarbonate ion; PaCO2, arterial carbon dioxide tension; PaO2, arterial oxygen tension; , minute ventilation.
Mechanism of Exercise-Induced Acidosis
The relationships of levels with PaCO2, plasma lactate levels, and at peak exercise are shown in Figure 5. At peak exercise, the level was significantly correlated with the PaCO2 and in all groups, but it did not correlate with the plasma lactate level in groups A and B (Figures 5ii–iv). The VT-break points were determined in 17 of the 28 (61%) patients in group A. In the patients with VT-break points in group A, there was a significant negative correlation between the level at peak exercise and the VT level corresponding to the VT-break point (r = −0.52, p = 0.032). This suggested that when there was severe hyperinflation, respiratory acidosis, rather than lactic acidosis, primarily occurred. The proportion of patients who maintained an level of more than 24 mEq·L−1 at peak exercise was highest in group A (19/28, 68%), in comparison with group B (38/64, 59%), group C (24/77, 31%), and group D (12/46, 26%). However, there were no significant differences in the pH levels and Borg scales at peak exercise among the subgroups (Table 2, Figure 6). Although the plasma lactate level and at peak exercise showed lower values in the group with decreased exercise tolerance (Table 2, Figure 6), the PaO2 and PaCO2 values at peak exercise varied widely among the individual patients in all groups.
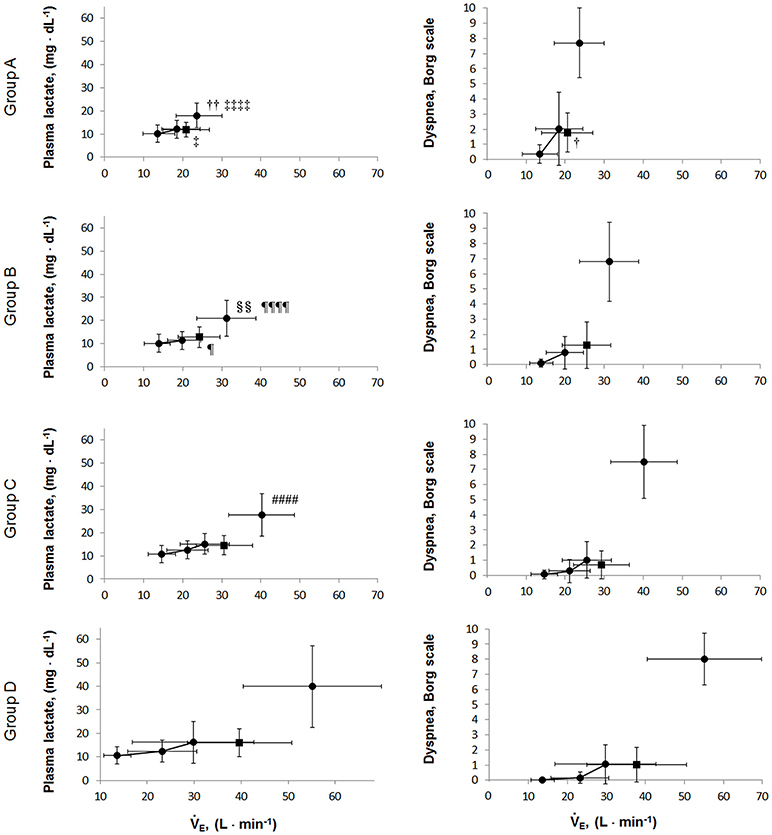
Figure 6. The relationships of the plasma lactate levels and dyspnea borg scales during exercise. Values are presented as mean (SD) and were analyzed using the Tukey-Kramer honestly significant difference test. Circular symbols show exertional variables at rest, during exercise, and at peak exercise. Square symbols show plasma lactate and dyspnea borg scale break points. Plasma lactate borg scale break points were determined in 15/28 in group A, 43/64 in group B, 55/77 in group C, and 42/46 group D. Dyspnea borg scale break points were determined in 14/28 in group A, 46/64 in group B, 62/77 in group C, and 40/46 group D. A vs. B; †p < 0.05, ††p < 0.01, A vs. D: ‡p < 0.05, ‡‡‡‡p < 0.0001; B vs. C: §§p < 0.01, B vs. D: ¶p < 0.05, ¶¶¶¶p < 0.0001; C vs. D: ####p < 0.0001.
In the Other EL Group
Ten (3.6%) of 280 COPD patients who had no comorbidities stopped exercise due to ECG changes (Figure 2).
Discussion
This study evaluated the pathophysiologic conditions related to exertional dyspnea among COPD patients using CPET with arterial blood analysis in clinical practice. The exertional conditions during exercise differed according to the residual exercise performance. Moreover, the COPD patients also showed great inter-individual variability. The appropriate expansion of ventilation caused by an increased ventilatory drive due to the arterial blood acidosis (metabolic and/or respiratory acidosis) and hypoxemia is constricted in the setting of reduced respiratory system ability (reduced ventilatory capacity). These conditions provoke exertional dyspnea.
Pathophysiologic Conditions in the Leg Fatigue Group
Compared with the dyspnea group, the leg fatigue group demonstrated a lower severity of dyspnea and PaCO2 retention and a higher PaO2 level at peak exercise with similar peak . The breathing reserve has been considered to influence breathing discomfort and alveolar gas exchange. Given that the present study showed that the cardinal symptoms for exercise intolerance were dyspnea and/or fatigue, which may result from one or a combination of limitations, such as ventilatory constraints, pulmonary gas exchange abnormalities, peripheral muscle dysfunction, and cardiac dysfunction, evaluation of the exercise-limiting factor in each case is fundamental for developing treatment strategies for COPD (Laveneziana et al., 2007; Cote et al., 2008; Watz et al., 2014). In the present study, 20% (n = 58) of the patients who stopped CPET due to leg fatigue showed better functional ventilatory capacity than the dyspnea group. One recent report suggested that COPD patients who developed leg fatigue during exercise training had greater functional exercise tolerance than those who do not (Burtin et al., 2012). These results implied that pulmonary rehabilitation (exercise training) should be indicated for COPD patients whose exercise intolerance is related to leg fatigue.
Relationship of Exercise Intolerance With Airflow Limitation and Breathing Pattern
Exercise tolerance, which can be measured by the peak , depends on the intensity and duration of exercise (Neder et al., 2000; Oga et al., 2005). Similar to other reports (Cahalin et al., 1995; Bauerle et al., 1998; Foglio et al., 2000; Agusti et al., 2010), the present study showed that prediction of exercise tolerance using the peak level based on the FEV1 was a challenge in all groups, except in group D of the dyspnea group, which showed the highest exercise tolerance, although the FEV1 has been indispensable for COPD diagnosis and might be a parameter useful for assessment of the effects of inhaled medications. In other words, increasing the FEV1 alone might not help increase exercise tolerance in COPD patients. Oga et al. (2005) reported that evaluation of the peak , rather than the FEV1, over time was more helpful in understanding the changes in a patient's condition. Macklem (2010) reported that tachypnea in a COPD patient decreases dynamic lung compliance and that rapid shallow breathing is generally considered to cause difficulty in breathing. In group A, based on the negligible correlation of the Δ with a reduced VT, which has a negative correlation with respiratory frequency at peak exercise (Figures 3iii,v), and the absence of correlation between VT and the VD/VT ratio, there were basically two breathing patterns during exercise, i.e., a relatively stable increase of VT with low respiratory frequency (slow exhalation breathing) and a reduced increase of VT with high respiratory frequency (rapid shallow breathing). Of note, regardless of the two breathing patterns, group A showed a low exercise tolerance due to wasted ventilation. These imply that care for patients with low exercise tolerance should be especially individualized.
Relationship Between Exercise-Induced Hypoxemia and Sympathetic Activity Level
In COPD, evaluation of the degree of exercise-induced hypoxemia (PaO2-slope) along with assessment of exercise tolerance is important for predicting survival and understanding the varying pathophysiologic conditions among individual patients (Hiraga et al., 2003; Maekura et al., 2014, 2015; Yoshimura et al., 2014). Recently, the members of the Long-Term Oxygen Treatment Trial Research Group reported that long-term supplemental oxygen therapy had no significant effect on mortality among stable COPD patients with either resting or exercise-induced moderate hypoxemia, as measured by pulse oximetry, during a 6-min walk distance test (Albert et al., 2016). However, in that study, the oxygen saturation (SpO2) measurements were obtained in individuals with different workloads. The severity of pulmonary gas exchange abnormalities should be evaluated by a decrease in PaO2 over a fixed workload or by an increase in oxygen uptake (PaO2-slope). Moreover, the use of SpO2 during a 6-min walk test to evaluate the severity of exercise-induced hypoxemia will produce inaccurate results. In the present study, the findings clearly showed that PaO2 decreased to less than 60 mmHg in half of the patients, even in group C and D patients with exercise tolerance. Furthermore, 25% of the patients in group A did not show hypoxemia at peak exercise. However, the PaO2 slope became steep with decreasing exercise tolerance, especially in group A, in which the PaO2-slope did not correlate with the PaO2 at peak exercise; that is, the PaO2-slope had a greater impact on exercise intolerance (reduced Δ) in group A than in the other subgroups (Figure 4). In addition, at peak exercise, the PaO2 most negatively correlated with the level in group A (Figure 5i); that is, a severe degree of exercise-induced hypoxemia occurred with reduced exercise tolerance to reach respiratory acidosis. This might explain the elevated sympathetic activity, which manifested as a 2-fold increase in the plasma norepinephrine level in group A already from the resting condition (Maekura et al., 2014; Yoshimura et al., 2014). Their findings might affect the heterogeneity of the pathophysiologic conditions underlying COPD during exercise. A prolonged increase in sympathetic activity can cause weight loss, anxiety, and other stress-related body changes, including hypoxemia and exertional acidosis. For example, reduced digestive activity results from a generally inhibitory effect of norepinephrine on the enteric nervous system by decreasing gastrointestinal motility, blood flow, and secretion of digestive substances (Konturek et al., 2004). Furthermore, the PaO2-slope, rather than the PaO2 or SpO2 value at the end of exercise, was the factor that affected the prognosis of COPD (Hiraga et al., 2003; Maekura et al., 2014; Yoshimura et al., 2014). Therefore, the focus should be on the PaO2-slope for individualized patient care, in order to improve or avoid severe and life-threatening exercise-induced hypoxemia (Maekura et al., 2015).
Mechanism of Exercise-Induced Acidosis
The varying ventilation to compensate for exercise-induced acidosis in COPD might be related with dynamic hyperinflation (O'Donnell et al., 2009; Wasserman et al., 2014), which is considered a key contributor to dyspnea. In group A, the main cause of exercise intolerance might be the wasted ventilation from varying breathing patterns, including slow exhalation breathing and rapid shallow breathing, as shown in Figure 3v. In the present study, exertional acidosis was caused by both metabolic and respiratory factors to stop exercise in each group (Figure 5). Furthermore, in subgroup A of the dyspnea group, in which dynamic hyperinflation was especially confirmed using VT-break points, exercise was stopped primarily because of respiratory acidosis, that is, these patients did not develop ventilatory compensation in response to respiratory acidosis; therefore, the level was high at peak exercise (Table 2). Evaluating could further the understanding of the pathophysiologic conditions, by elucidating the state of acidosis conditions when inadequate ventilatory compensation including hyperinflation occurs during exercise. On the other hand, compared with group A patients, group D patients in the dyspnea group had a lower VD/VT ratio and were able to maintain ventilation capacity; moreover, in that group, there was a negative correlation of the level with ventilatory capacity and plasma lactate levels (Table 2, Figure 5). In addition, the proportion of patients who maintained an level greater than 24 mEq · L−1 at peak exercise was lower in group D (26%) than in group A (68%). Taken together, the group D patients with higher ventilatory capacity stopped exercise primarily because of lactic acidosis (Figure 6). It is interesting to note that in this study, we assumed that cessation of exercise in these patients was due to their inability to compensate for the exertional acidosis and that there were no significant differences in the pH levels and Borg scales at peak exercise in all subgroups in the dyspnea group (Table 2, Figure 6). Based on our previous CPET evaluations using two kinds of inhaled oxygen concentrations in patients with COPD and even idiopathic pulmonary fibrosis, exercise limitation often depended on limitations in ventilatory compensation for exertional acidosis, rather than hypoxemia during exercise (Miki et al., 2012, 2013). These findings suggest that although the degree of exertional hypoxemia and the breathing pattern vary in COPD patients, pH homeostasis during exercise might be regulated by ventilation, which might be related to dynamic hyperinflation.
This study had some limitations. First, all patients in this study were grouped according to peak increments obtained by CPET and combined with those showing a similar degree of FEV1. The relationship between FEV1 and peak might vary among the studies, given that the severity of airflow limitation differs with respect to each study population. Although COPD is characterized by airflow limitation due to airway and/or alveolar abnormality, the chief complaint is exercise intolerance due to breathlessness. The peak in incremental exercise is also the gold standard of exercise capacity.
Second, the patients were asked to make their maximal efforts before the CPET, which was performed until patient exhaustion. Certainly, the level of exhaustion to stop exercise might have varied among patients and affected the results. However, arterial blood parameters, including the PaO2-slope, are completely objective valuables. Moreover, the applicability of our results to the entire spectrum of COPD patients remains to be investigated.
Conclusion
Our findings demonstrated the heterogeneity of the pathophysiologic conditions underlying COPD during exercise, even when the dyspnea level was similar. Ventilation is stimulated to avoid exertional acidosis and hypoxemia; however, the responses are limited by the ventilatory impairment in COPD patients. This ventilatory decompensation might be one of the common mechanisms contributing exertional dyspnea. The resting variables (FEV1) could not accurately predict exercise tolerance and pathophysiology during exercise in COPD patients. Therefore, CPET should be implemented before initiating interventions such as pulmonary rehabilitation in these patients. Understanding the individual exercise limitations of COPD patients could provide helpful information on a suitable management strategy for the patients.
Data Availability Statement
This study does not include any clinical dataset to be shared. The datasets used and/or analyzed during the current study are available from the corresponding author on reasonable request.
Author Contributions
All authors contributed to the conceptualization and design of the study. HK, KM, and RM contributed to data abstraction and analysis. HK drafted the initial manuscript. All authors contributed to manuscript writing and approved the submission of the final manuscript. KM and RM are the guarantors of this work.
Conflict of Interest Statement
The authors declare that the research was conducted in the absence of any commercial or financial relationships that could be construed as a potential conflict of interest.
Acknowledgments
The authors received no specific funding for this study. The authors would like to thank Ms. S. Ito and Ms. S. Sakaguchi for their help with the CPET measurements.
Abbreviations
COPD, chronic obstructive pulmonary disease; CPET, cardiopulmonary exercise testing; ECG, electrocardiogram; EL, exercise limitations; FEV1, forced expiratory volume in one second; , bicarbonate ion; HR, heart rate; NE, plasma norepinephrine level; PaCO2, arterial carbon dioxide tension; PaO2, arterial oxygen tension; , carbon dioxide output; VD/VT, physiologic dead space/tidal volume ratio; , minute ventilation; , oxygen uptake; VT, tidal volume.
References
Agusti, A., Calverley, P. M., Celli, B., Coxson, H. O., Edwards, L. D., Lomas, D. A., et al. (2010). Characterisation of COPD heterogeneity in the ECLIPSE cohort. Resp. Res. 11:122. doi: 10.1186/1465-9921-11-122
Albert, R. K., Au, D. H., Blackford, A. L., Casaburi, R., Cooper, J. A. Jr., Criner, G. J., et al. (2016). A randomized trial of long-term oxygen for COPD with moderate desaturation. N. Engl. J. Med. 375, 1617–1627. doi: 10.1056/NEJMoa1604344
American Thoracic Society (1995a). Standards for the diagnosis and care of patients with chronic obstructive pulmonary disease. Am. J. Respir. Crit. Care Med. 152, S77–S121.
American Thoracic Society (1995b). Standardization of spirometry, 1994 update. Am. J. Respir. Crit. Care Med. 152, 1107–1136. doi: 10.1164/ajrccm.152.3.7663792
Bauerle, O., Chrusch, C. A., and Younes, M. (1998). Mechanisms by which COPD affects exercise tolerance. Am. J. Resp. Crit. Care Med. 157, 57–68. doi: 10.1164/ajrccm.157.1.9609126
Borg, G. A. (1982). Psychophysical bases of perceived exertion. Med. Sci. Sports Exerc. 14, 377–381. doi: 10.1249/00005768-198205000-00012
Borrill, Z. L., Houghton, C. M., Woodcock, A. A., Vestbo, J., and Singh, D. (2005). Measuring bronchodilation in COPD clinical trials. Br. J. Clin. Pharmacol. 59, 379–384. doi: 10.1111/j.1365-2125.2004.02261.x
Burtin, C., Saey, D., Saglam, M., Langer, D., Gosselink, R., Janssens, W., et al. (2012). Effectiveness of exercise training in patients with COPD: the role of muscle fatigue. Eur. Resp. J. 40, 338–344. doi: 10.1183/09031936.00111811
Cahalin, L., Pappagianopoulos, P., Prevost, S., Wain, J., and Ginns, L. (1995). The relationship of the 6-min walk test to maximal oxygen consumption in transplant candidates with end-stage lung disease. Chest 108, 452–459. doi: 10.1378/chest.108.2.452
Clinical exercise testing with reference to lung diseases: indications standardization and interpretation strategies. (1997). ERS task force on standardization of clinical exercise testing. European respiratory society. Eur. Resp. J. 10, 2662–2689. doi: 10.1183/09031936.97.10112662
Cote, C. G., Pinto-Plata, V. M., Marin, J. M., Nekach, H., Dordelly, L. J., and Celli, B. R. (2008). The modified BODE index: validation with mortality in COPD. Eur. Resp. J. 32, 1269–1274. doi: 10.1183/09031936.00138507
Foglio, K., Carone, M., Pagani, M., Bianchi, L., Jones, P. W., and Ambrosino, N. (2000). Physiological and symptom determinants of exercise performance in patients with chronic airway obstruction. Resp. Med. 94, 256–263. doi: 10.1053/rmed.1999.0734
Global Initiative for Chronic Obstructive Lung Disease. GOLD (2017). Global Strategy for the Diagnosis, Management and Prevention of COPD. Available online at: http://goldcopd.org/gold-2017-global-strategy-diagnosis-management-prevention-copd/. (Accessed May 12, 2017).
Hallstrand, T. S., Bates, P. W., and Schoene, R. B. (2000). Aerobic conditioning in mild asthma decreases the hyperpnea of exercise and improves exercise and ventilatory capacity. Chest 118, 1460–1469. doi: 10.1378/chest.118.5.1460
Hiraga, T., Maekura, R., Okuda, Y., Okamoto, T., Hirotani, A., Kitada, S., et al. (2003). Prognostic predictors for survival in patients with COPD using cardiopulmonary exercise testing. Clin. Physiol. Funct. Imaging 23, 324–331. doi: 10.1046/j.1475-0961.2003.00514.x
Johnson, B. D., Weisman, I. M., Zeballos, R. J., and Beck, K. C. (1999). Emerging concepts in the evaluation of ventilatory limitation during exercise: the exercise tidal flow-volume loop. Chest 116, 488–503. doi: 10.1378/chest.116.2.488
Konturek, S. J., Konturek, J. W., Pawlik, T., and Brzozowski, T. (2004). Brain-gut axis and its role in the control of food intake. J. Physiol. Pharmacol. 55, 137–54.
Laveneziana, P., and Palange, P. (2012). Physical activity, nutritional status and systemic inflammation in COPD. Eur Resp. J. 40, 522–529. doi: 10.1183/09031936.00041212
Laveneziana, P., Parker, C. M., and O'Donnell, D. E. (2007). Ventilatory constraints and dyspnea during exercise in chronic obstructive pulmonary disease. App. Physiol. Nutr Metab. 32, 1225–1238. doi: 10.1139/H07-119
Macklem, P. T. (2010). Therapeutic implications of the pathophysiology of COPD. Eur. Resp. J. 35, 676–80. doi: 10.1183/09031936.00120609
Maekura, R., Hiraga, T., Miki, K., Kitada, S., Miki, M., Yoshimura, K., et al. (2015). Personalized pulmonary rehabilitation and occupational therapy based on cardiopulmonary exercise testing for patients with advanced chronic obstructive pulmonary disease. Int. J. Chron. Obstruct. Pulmon Dis. 10, 1787–1800. doi: 10.2147/COPD.S86455
Maekura, R., Hiraga, T., Miki, K., Kitada, S., Yoshimura, K., Miki, M., et al. (2014). Differences in physiological response to exercise in patients with different COPD severity. Respir. Care 59, 252–262. doi: 10.4187/respcare.02201
Miki, K., Maekura, R., Hiraga, T., Hashimoto, H., Kitada, S., Miki, M., et al. (2009). Acidosis and raised norepinephrine levels are associated with exercise dyspnoea in idiopathic pulmonary fibrosis. Respirology 14, 1020–1026. doi: 10.1111/j.1440-1843.2009.01607.x
Miki, K., Maekura, R., Hiraga, T., Kitada, S., Miki, M., Yoshimura, K., et al. (2012). Effects of oxygen on exertional dyspnoea and exercise performance in patients with chronic obstructive pulmonary disease. Respirology 17, 149–154. doi: 10.1111/j.1440-1843.2011.02086.x
Miki, K., Maekura, R., Miki, M., Kitada, S., Yoshimura, K., Tateishi, Y., et al. (2013). Exertional acidotic responses in idiopathic pulmonary fibrosis: the mechanisms of exertional dyspnea. Resp. Physiol. Neurobiol. 185, 653–658. doi: 10.1016/j.resp.2012.11.008
Neder, J. A., Jones, P. W., Nery, L. E., and Whipp, B. J. (2000). Determinants of the exercise endurance capacity in patients with chronic obstructive pulmonary disease. the power-duration relationship. Am. J. Resp. Crit. Care Med. 162, 497–504. doi: 10.1164/ajrccm.162.2.9907122
O'Donnell, D. E., Ora, J., Webb, K. A., Laveneziana, P., and Jensen, D. (2009). Mechanisms of activity-related dyspnea in pulmonary diseases. Resp. Physiol. Neurobiol. 167, 116–132. doi: 10.1016/j.resp.2009.01.010
Oga, T., Nishimura, K., Tsukino, M., Sato, S., Hajiro, T., and Mishima, M. (2005). Exercise capacity deterioration in patients with COPD: longitudinal evaluation over 5 years. Chest 128, 62–69. doi: 10.1378/chest.128.1.62
Palange, P., Ward, S. A., Carlsen, K. H., Casaburi, R., Gallagher, C. G., Gosselink, R., et al. (2007). Recommendations on the use of exercise testing in clinical practice. Eur. Resp. J. 29, 185–209. doi: 10.1183/09031936.00046906
Parshall, M. B., Schwartzstein, R. M., Adams, L., Banzett, R. B., Manning, H. L., Bourbeau, J., et al. (2012). An official American Thoracic Society statement: update on the mechanisms, assessment, and management of dyspnea. Am. J. Resp. Crit. Care Med. 185, 435–452. doi: 10.1164/rccm.201111-2042ST
Pauwels, R. A., Buist, A. S., Calverley, P. M., Jenkins, C. R., and Hurd, S. S. (2001). Global strategy for the diagnosis, management, and prevention of chronic obstructive pulmonary disease: NHLBI/WHO Global Initiative for Chronic Obstructive Lung Disease (GOLD) workshop summary. Am. J. Respir. Crit. Care Med. 163, 1256–1212. doi: 10.1164/ajrccm.163.5.2101039
Wasserman, K., Cox, T. A., and Sietsema, K. E. (2014). Ventilatory regulation of arterial H(+) (pH) during exercise. Resp. Physiol. Neurobiol. 190, 142–148. doi: 10.1016/j.resp.2013.10.009
Wasserman, K. H. J., Sue, D. Y., Stringer, W. W., and Whipp, B. J. (2005). Principles of Exercise Testing and Interpretation. 4th Edn. Philadelphia, PA: Lippincott Williams and Wilkins.
Watz, H., Pitta, F., Rochester, C. L., Garcia-Aymerich, J., ZuWallack, R., Troosters, T., et al. (2014). An official European Respiratory Society statement on physical activity in COPD. Eur. Resp. J. 44, 1521–1537. doi: 10.1183/09031936.00046814
Keywords: dyspnea, exercise tolerance, hypoxemia, acidosis, norepinephrine, COPD, cardiopulmonary exercise testing
Citation: Kagawa H, Miki K, Kitada S, Miki M, Yoshimura K, Oshitani Y, Nishida K, Sawa N, Tsujino K and Maekura R (2018) Dyspnea and the Varying Pathophysiologic Manifestations of Chronic Obstructive Pulmonary Disease Evaluated by Cardiopulmonary Exercise Testing With Arterial Blood Analysis. Front. Physiol. 9:1293. doi: 10.3389/fphys.2018.01293
Received: 24 May 2018; Accepted: 27 August 2018;
Published: 02 October 2018.
Edited by:
Gregory D. Funk, University of Alberta, CanadaReviewed by:
Andrew T. Lovering, University of Oregon, United StatesNorihiro Shinozuka, Chibaken Saiseikai Narashino Hospital, Japan
Copyright © 2018 Kagawa, Miki, Kitada, Miki, Yoshimura, Oshitani, Nishida, Sawa, Tsujino and Maekura. This is an open-access article distributed under the terms of the Creative Commons Attribution License (CC BY). The use, distribution or reproduction in other forums is permitted, provided the original author(s) and the copyright owner(s) are credited and that the original publication in this journal is cited, in accordance with accepted academic practice. No use, distribution or reproduction is permitted which does not comply with these terms.
*Correspondence: Keisuke Miki, mikisuke@toneyama.go.jp