 J. Trezise
 A. J. Blazevich
- School of Medical and Health Sciences, Centre for Exercise and Sports Science Research (CESSR), Edith Cowan University, Joondalup, WA, Australia
This study examined whether changes in strength following a moderate-duration strength training program were associated with changes in specific combinations of anatomical and neuromuscular variables. 36 men (18–40 y) completed 10 weeks of lower-limb heavy resistance (6-RM) strength training. Measurements included cross-sectional area (CSA), fascicle length (lf) and fascicle angle (θf) from proximal, middle and distal regions of the four quadriceps components; agonist (EMG:M), antagonist (EMG) muscle activities and percent voluntary quadriceps activation (%VA; interpolated twitch technique); patellar tendon moment arm distance; and maximal isometric, concentric and eccentric (60° s–1) torque. Multiple regression models were developed to quantify the relationship between the change in maximum torque and the changes in combinations of anatomical and neuromuscular variables. The best model for each contraction mode was determined using Akaike’s Information Criterion (AICc), an information-theoretic approach for model selection. Strength increased significantly following training (mean range = 12.5–17.2%), and moderate relationships were observed between modeled data (using best-fit prediction models) and the change in torque for each contraction mode. The change in isometric torque was best (although weakly) predicted by the linear combination of the change in proximal-region vastus lateralis (VL) CSA and fascicle angle (R2 = 0.27, p < 0.05; AICcwi = 0.52, i.e., the probability the model would be selected as the “best model”). The models best predicting the change in concentric and eccentric torque both included the combination of the change in quadriceps (i.e., mean of all muscles) EMG:M and the change in vastus intermedius fascicle angle combined with either a change in proximal-region VL (R2 = 0.40, p < 0.001; AICcwi = 0.15) or whole quadriceps (R2 = 0.41, p < 0.001; AICcwi = 0.30) CSA (concentric and eccentric, respectively). Models incorporating the change in proximal CSA typically received substantial support (AICC < 2) for concentric torque prediction models, and the change in % VA and pre-training moment arm distance had substantial support for use in eccentric torque prediction models. In conclusion, adaptations varied between individuals, however strength training programs targeted to improve a group of variables that particularly includes agonist muscle activation might yield the greatest improvements in concentric and eccentric knee extension strength, whereas proximal muscle size and fascicle angle appear most important for isometric torque improvements.
Introduction
Strength training, especially in previously untrained individuals, elicits substantial functional and structural adaptations leading to increases in muscular strength. However, these neuromuscular (Maughan et al., 1983; Higbie et al., 1996; Hubal et al., 2005; Erskine et al., 2010) and strength (Hubal et al., 2005; Blazevich et al., 2008; Erskine et al., 2010) adaptations vary markedly between individuals. Muscle size, for example, is considered an important factor influencing strength expression and can account for ∼60% of the inter-individual variability in strength in non-strength trained adults (Maughan et al., 1983; Fukunaga et al., 2001; Blazevich et al., 2009; Trezise et al., 2016) yet gains in muscle size have been found to be less strongly related to training-induced strength improvements (Jones and Rutherford, 1987; Erskine et al., 2010; Ahtiainen et al., 2016). Strength training also elicits adaptations in muscle architecture (Kawakami et al., 1995; Aagaard et al., 2001; Blazevich et al., 2007; Seynnes et al., 2007) and activation (Häkkinen et al., 1985a; Narici et al., 1989; Aagaard et al., 2000b; Del Balso and Cafarelli, 2007) so changes in these neuromuscular variables may confound the relationship between muscle size and strength, and potentially explain the larger inter-individual variability in strength improvements following training. Thus, the combined effects of clusters of variables may be more important to study than the influence of single variables. To date, however, this speculation has received relatively little scientific scrutiny so the relative importance of different neuromuscular variables (or clusters of neuromuscular variables) to the training-induced strength increase is not known. Additionally, with the large heterogeneity in individuals’ adaptations to training (Ahtiainen et al., 2016) the relationships between the changes in neuromuscular variables also need to be explored. Given this, and despite a wealth of research detailing the neuromuscular responses to training, specific neuromuscular targets have not been identified in which large changes might lead to the greatest improvement in muscular strength.
Knee extensor torque production in particular is required for the successful completion of many activities of daily living (e.g., locomotion, chair sitting and rising, stair climbing) and athletic tasks, so it is an important muscle group for study. In our previous study (Trezise et al., 2016), quadriceps muscle size and activation [both the amplitude of agonist muscle EMG activity and percent voluntary activation assessed using interpolated twitch technique (ITT)] and vastus lateralis fascicle angle were identified as the best predictors of maximum isometric and eccentric knee extension torque, while muscle size, fascicle angle and patella tendon moment arm distance collectively were the best predictors of maximal concentric torque. However, it is possible that the variables most predictive of maximum strength within a population (i.e., in a cross-sectional analysis) have a different impact on the strength changes elicited by a training intervention (i.e., in a longitudinal analysis) since time-dependent (within-participant) changes may be considerably less than the between-subject variation. Thus, longitudinal studies are required in order to identify the neuromuscular factors most associated with longer-term strength change. The identification of the neuromuscular variables that most influence strength change would allow for the targeting of these variables with specific exercise training regimes, and the provision of individualized training programs based on a person’s structural and/or functional characteristics.
Given the above, the present study was designed to determine whether changes in strength (isometric, concentric and eccentric) following moderate-duration (10 weeks) high-resistance (6-repetition maximum [6-RM]; ∼85–90% maximum load) strength training were associated with changes in specific, or clusters of, neuromuscular variables. Determination of the strongest relationships between changes in strength and changes in the anatomical and neuromuscular variables can provide insight as to the most relevant mechanisms influencing strength change. As anatomical and neuromuscular adaptations to strength training are known to be load, volume and velocity dependent (Häkkinen et al., 1985b; Blazevich et al., 2003; Bloomquist et al., 2013) it is important to emphasize that the present research explored the effects of heavy, and thus slow-speed, lower-limb strength training. Also, as many activities of daily living and athletic tasks require the performance of isometric and dynamic contractions, it was considered important to determine the relationships between the measures of anatomical structure and neuromuscular function versus isometric, concentric and eccentric strength. Finally, as the mechanisms influencing strength change likely alter as training progresses, we specifically chose to study adaptations in the first weeks of training (10 weeks) since the magnitude of strength change in previously untrained individuals in this period is likely to influence their likelihood of continuing the training in the longer term.
Materials and Methods
Participants and Experimental Protocol
Thirty-six healthy untrained men (29.0 ± 5.1 y; 1.78 ± 0.05 m; and 78.9 ± 8.2 kg) between the ages of 19 and 40 years volunteered to participate in, and subsequently completed, this study. Four additional volunteers who began the study were not included in the final analysis: two dropped out due to work commitments, and two were excluded based on personal circumstances obstructing their training during the last 2 weeks. The participants were classified as untrained based on their response to a metabolic work rate questionnaire (Ainsworth et al., 2000). All participants had an average weekly metabolic energy equivalent score (MET) of <30/day and had not performed any regular lower-limb strength training in the past 4 years. Participants were excluded if they suffered from cardiovascular or inflammatory disease, a lower-limb injury within the last 3 months, or any other condition that could affect performance during the testing and training protocols. Prior to participation, they were provided written informed consent. The experimental procedure was approved by the Institutes’ Human Research Ethics Committee and the study was conducted in accordance with the Declaration of Helsinki.
The participants performed six testing sessions across a 2-week period to measure muscle size and architecture, maximal isometric voluntary torque and muscle activation capacity, maximal voluntary isokinetic torque and activation capacity, and patellar tendon moment arm distance. Each session was separated by at least 48 h. They then attended one pre-training gym session to determine their maximum load for 6 repetitions of each exercise and to familiarize themselves with the training exercises. Post-training testing began 4–5 days after their final training session to allow recovery of strength and for fluid shifts to stabilize, and all testing was then completed over a 5-day period. Each participant completed all test sessions at the same time of day (± 2 h) (Pearson and Onambele, 2006).
Training Program
The participants completed two training sessions per week for 10 weeks (20 sessions). All training sessions were supervised and the participants were required to complete at least 18 training sessions. The exercise protocol consisted of incline (45°) leg press, knee extension and leg curl exercises against a heavy load on commercial fitness machines (Cybex International Inc., Medway, MA, United States). The participants performed 3 sets of 6 repetitions per exercise (6-RM). The load was progressively increased across the 10 weeks. During each set, if the participant managed 6 repetitions, depending on the ease with which the set was completed, the load was either maintained or increased by ∼5% for the subsequent set. If the participant managed only 5 repetitions, then they were assisted (spotted) to reach the 6th repetition and the load was decreased ∼5% for the next set. These loads and volumes were chosen as they have previously been shown to stimulate substantial strength and hypertrophic adaptations (Kraemer and Ratamess, 2004). The first session was completed at 60% 6-RM to both accustom the participants to the training exercises and minimize muscle soreness, and all subsequent sessions were completed at 100% 6-RM. Two minutes of passive rest was given between sets and 3 min was allowed between exercises; rest periods were strictly enforced by the training supervisor. To control the range of motion, participants were required to cover the range of 10–90° for knee extension, and 5–90° for the leg press. This was controlled by the use of individualized markers taped to the exercise equipment for the participants to aim for. The participants were verbally encouraged throughout each session to give their maximal effort. The warm-up for each session consisted of 5 min of low-intensity, self-paced stationary cycling and 2 warm-up sets of 6 repetitions of each exercise at approximately 50 and 70% of the day’s load. The warm-down consisted of 5 min of cycling and 5 min of static stretching. As post-exercise ingestion of protein assists in eliciting an optimum training response (Phillips, 2004) and individual variations in post-exercise nutrition might increase training adaptation variation, all participants consumed a protein shake immediately post-training (Redbak Whey Protein, International Health Investments Pty Ltd., Helensvale Queensland). This contained between 20 and 40 g (0.4 g protein per kg body mass) of whey protein isolate powder comprised of 86% protein and 8% of both carbohydrates and fats. Participants were also instructed as to the need to have an adequate energy intake (including proteins, carbohydrates and fats) during the 10-week training period.
Testing Procedures
The testing protocol has been explained in detail elsewhere (Trezise et al., 2016) but will be briefly described below.
Isometric Torque and Neuromuscular Measurements
To measure maximal voluntary and electrically elicited isometric knee extension torques the participants performed maximal voluntary isometric contractions (MVCs) whilst sitting in a custom-built isometric dynamometer. As maximum isometric torque varies with joint angle, the angle of maximum torque production was found for each individual by performing MVCs at a range of 5–7 sequential angles with 5° increments (0° = full knee extension). Based on an estimated location of each participant’s peak torque angle from their familiarization sessions, participants began their MVC efforts at either 45°, 55° or 65°. To avoid the greater fatigue associated with performing a maximal efforts at longer muscle lengths (Desbrosses et al., 2006), the contractions progressed from an extended (i.e., short muscle length) to a flexed (i.e., long muscle length) position. The maximum isometric torque for each participant was taken as the maximum torque (TISO) at any angle during the 500 ms prior to the superimposed twitch (explained below).
Each MVC was held for 3 s and a single (Behm et al., 1996) supramaximal electrical stimulus (140% Mmax current intensity) was applied to the femoral nerve 2 s before contraction onset, during the torque plateau and 2-s after each MVC (see electrical stimulation protocol below). Two MVCs were performed at each angle, but if the peak torque values differed by >5 N⋅m a third MVC was completed. Participants had a 1-min rest between MVCs at the same angle, and 2-min rest between joint angles. To ensure the MVCs were not influenced by fatigue, the first joint angle was retested to confirm that fatigue was not induced throughout the testing (identified as >5% decrease in MVC from the initial trial). Strong verbal encouragement was provided during each MVC and a computer screen displaying real-time visual feedback of the torque data was displayed in front of the participants. The greatest torque at each angle was used for TISO analysis, while the peak unpotentiated (i.e., pre-MVC) twitch torque (TUn–TW) and peak potentiated (i.e., post-MVC) twitch torque (TPot–TW) variables were defined as the mean obtained during the two strongest contractions. Intra-session reliability testing of the electrically induced and voluntary torques for eight participants produced coefficients of variation [CV (mean ± SD)] of 1.2 ± 0.9%, 3.6 ± 1.2% and 1.5 ± 1.4%, for TISO, TUn–TW and TPot–TW, respectively.
Electrical Stimulation Protocol
Percent voluntary activation, unpotentiated and potentiated muscle twitch torques, and the maximum muscle compound action potential (M-wave) amplitude were determined using a single supramaximal (140% Mmax current intensity) electrical stimulus to the femoral nerve. This intensity ranged from 98 to 560 mA across the participants, with the majority between 180 to 280 mA. The single 2-ms (400 V) rectangular pulses were delivered via a high-voltage constant-current stimulator (Digitimer, model DS7AH, Welwyn Garden City, United Kingdom). The femoral nerve was located via ultrasonography while the participant sat in the custom built chair with a knee joint angle of 70°. The cathode was placed 0.5 cm medial and inferior to the femoral nerve, and the anode 2 cm lateral and superior to this position; to produce the greatest M-wave response at submaximal intensity the cathode position was altered slightly if required.
Concentric and Eccentric Torque Measurements
Maximum concentric and eccentric knee extension contractions were performed at an angular velocity of 60°⋅s–1 on an isokinetic dynamometer (Biodex System 3, Biodex Medical Systems, Shirley, New York, NY, United States). This angular velocity provided a 1.5-s concentric phase, which was similar to that used during training exercises and ensured that slow-speed, high-force muscle strength was tested. Range of motion (ROM) for both concentric and eccentric contractions was 100° to 15° (0° = full extension), and torque signals were corrected for gravity. Following a warm up, one set of three repetitions of concentric and eccentric knee extensor contractions were completed. A second set was completed if the two peak torque values differed by >5 N⋅m. A 3-s rest was imposed between repetitions (30°⋅s–1 lever arm return speed) and a 2-min rest was allowed between sets. The maximum torque values (TCON and TECC) were used for analysis. Strong verbal encouragement was provided during each contraction and a computer screen displaying real-time visual feedback of the torque data was displayed in front of the participants. Intra-day and inter-day reliability testing (1-wk interval) for the three maximal concentric and eccentric knee extension contractions in 10 participants yielded CVs of 2.5 and 3.4% (intra-day) and 4.1 and 1.4% (inter-day), respectively.
Muscle Activation
Electromyogram signals (EMG) were obtained using bipolar silver/silver chloride surface electrodes (10 mm diameter; Kendall Healthcare, Medi-TraceTM 200 Series, United States) from rectus femoris (RF), vastus lateralis (VL) and vastus medialis (VM) and the long head of biceps femoris (BF) during the isometric and isokinetic contractions. The electrodes were positioned according to SENIAM guidelines (Hermens et al., 2000), and the reference electrode was placed on the proximal shaft of the tibia. The EMG signals were collected at an analog-digital conversion rate of 1 kHz and filtered using a fourth-order, zero-lag band pass (10–500 Hz) Butterworth filter.
Maximal isometric EMG was measured as the root mean square (RMS) 500 ms before superimposed stimulation (Maffiuletti and Lepers, 2003; Millet et al., 2003). Isokinetic RMS EMG was measured over a 30° range (covering 500 ms) around the peak torque angle. All agonist muscle contractions were then normalized to the unpotentiated M-wave amplitude (EMG:M-wave ratio). For both the isometric and concentric MVCs, antagonist EMG was normalized to maximal EMG amplitude measured during eccentric knee flexion MVC [as described previously (Trezise et al., 2016)]. For the eccentric MVCs, antagonist EMG was normalized to the concentric knee flexion MVC.
The interpolated twitch method was used to estimate percent voluntary activation during the isometric MVCs (Millet et al., 2003) using the equation: %VA = (1−superimposed twitch/potentiated twitch) × 100.
Muscle Size and Architecture
Muscle anatomical cross-sectional area (CSA), muscle fascicle length (lf) and muscle fascicle angle (θf) were obtained using two-dimensional B-mode ultrasonography (Aloka SSD-α10, software number 6.1.0, Aloka Co., Ltd., Tokyo, Japan) with a 10 MHz 60-mm linear-array transducer. Extended-field-of-view mode was used for all images (see Figure 1) (Noorkoiv et al., 2010a,b). Anatomical CSA was used to represent muscle size as it has both the benefit of enabling the analysis of region-specific differences in an individual, and being a good predictor of both isometric and isokinetic muscle force (Ahtiainen et al., 2003; Ikegawa et al., 2008; Blazevich et al., 2009). During measurements, participants lay relaxed with their legs fully extended in the supine position. To remove compression of the muscles a rolled towel was positioned behind the knee joint.
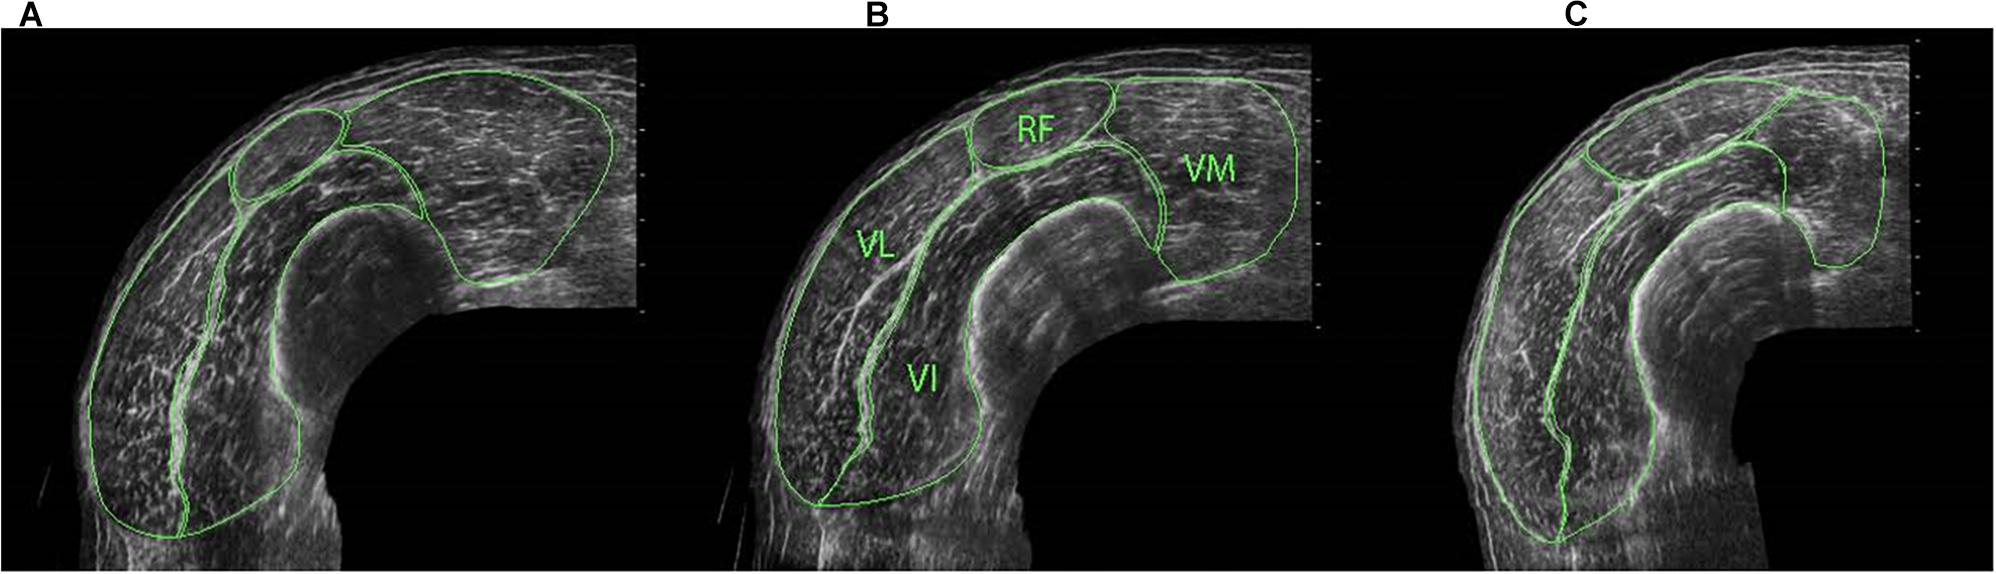
Figure 1. ACSA of individual quadriceps components at distal (A), middle (B) and proximal (C) regions of the thigh, identifying rectus femoris (RF), vastus medialis (VM) vastus lateralis (VL) and vastus intermedius (VI).
Cross-sectional area measurements were obtained at proximal (50%), middle (40%) and distal (30%) regions of the thigh [centre of the patella to the medial aspect of the anterior superior iliac spine (Noorkoiv et al., 2010a)] for the whole quadriceps and for each quadriceps component separately (i.e., RF, VL, VI, and VM) (Figure 1) to allow for between- and within-muscle variability in hypertrophy to be examined (Narici et al., 1996; Ahtiainen et al., 2003; Ema et al., 2013). When the separation of vastii muscles was not clear in the proximal images due to a lack of observable inter-muscular septum, a line was drawn from the end of the visible septum to a landmark on the muscle’s circumference that had been observable on the mid-muscle region images (Blazevich et al., 2007). For both CSA and fascicle measurements (see below), three scans were obtained at each location and the median value was used in the analysis. All ultrasound images were manually traced using ImageJ software (1.41o, National Institute of Health, United States). For these CSA measures, CVs ranged 2.9 ± 1.6 (distal) to 4.2 ± 3.0% (proximal) for RF, 2.1 ± 1.5 (mid) to 2.6 ± 1.4% (proximal) for VL, 1.3 ± 0.9 (mid) to 2.4 ± 1.4% (proximal) for VI, and 2.1 ± 1.5 (proximal) to 3.7 ± 2.8% (distal) for VM.
Fascicle length and angle measurements were also obtained from all four quadriceps components to account for the heterogeneity between and within the muscles (Blazevich et al., 2006). From the distance between the lateral border of the patella and greater trochanter, three sites were acquired along VL (33, 50 and 67% providing distal, middle and proximal regions), and one on VI (mid-region; lateral view). Images for VM were obtained from the 25% CSA site, and images for RF from the 50% CSA site mentioned above. Each measurement site was marked by 4-mm wide adhesive tape strip which provided a shadow in the ultrasound image. Fascicle length was defined as the distance between the superficial and deep aponeurosis of the fascicle that crossed the mid-point of the shadow and fascicle angle measurements were then obtained from the same fascicle. As the fascicles have slightly greater curvature at the deep aponeurosis insertion point, fascicle angle measurements were obtained from 3-mm above the deep aponeurosis to a line drawn 50% along the length of the fascicle (Blazevich et al., 2006). Due to the significant curvature of VM fascicles, VM fascicle length was measured from the fascicle that crossed 1/3 the distance between the superficial and deep aponeuroses, and VM fascicle angle measured from the deep aponeurosis for 2 cm along the length of the fascicle. CVs for FL ranged 1.7 ± 1.0 to 3.7 ± 2.1%, with the smallest obtained in VI and the largest in VLDIST, whilst CVs for FA ranged 1.7 ± 1.0 to 3.8 ± 2.5%, with the smallest obtained in VM and the largest in RF.
Moment Arm Distance
The patellar tendon moment arm distance (MA) was obtained using seven sagittal-plane, low-radiation x-ray scans of the knee joint (Siemens Multi-MT 1384 model number 4803404). Participants lay supine with their knees flexed and their feet against a custom-built wooden frame. The seven knee joint angles (40, 50, 60, … 100°) were set using a hand-held goniometer. Due to a difference in moment arm measurements between relaxed and contracted states (Tsaopoulos et al., 2006), all scans were obtained with the participants performing isometric knee extension contractions against the foot plate at approximately 60% of MVC, which gave MA measurements similar to MVC (e.g., see Trezise et al., 2016).
The patellar tendon moment arm distance was measured as the perpendicular distance from the line of action of the tendon to the instantaneous centre of rotation (ICR) (Tsaopoulos et al., 2009). The ICR was located using the Reuleaux graphical analysis method (Maganaris et al., 1998; Tsaopoulos et al., 2009) with Photoshop software (Adobe Photoshop CS5, United States). To provide an estimate of the moment arm distance over the entire joint angle range, a third-order polynomial (41) (R2 > 0.90) was fitted to five measured moment arm distances from 50 to 90°. The inter-day reliability analysis (six participants over 3-sessions) across all five joint angles yielded a CV of 3.1 ± 2.0% (∼1.4°).
Data Analysis
Five separate repeated measures multivariate analyses of variance (MANOVA), with time as the within-participant variable, were conducted to assess post-training changes in (1) isometric, concentric and eccentric peak knee extensor torque, and unpotentiated and potentiated twitch torques; (2) muscle activation (normalized EMG amplitudes); (3) M-wave amplitude measured during an isometric contraction; (4) quadriceps and individual muscle CSAs; and (5) fascicle angles and fascicle lengths in each muscle. When significant time effects were observed, additional ANOVAs or univariate analyses were performed as appropriate to determine the location of the change. Changes in percent voluntary activation and moment arm (moment arm at the angle of peak torque was considered changeable with training) were analyzed using paired t-tests. Normality of data distribution was confirmed using the Shapiro-Wilk test. Data that were not normally distributed (i.e., percent voluntary activation (%VA) and VM M-wave amplitude) were log transformed prior to statistical analysis. Multicollinearity was checked by computing correlations between input variables, with r < 0.8 being taken as a cut-off value. Analyses were performed using SPSS (version 20.0.0 IBM Corp., New York, NY, United States). Descriptive data are displayed as mean ± standard deviation in the text and tables, and as mean ± standard error of the mean (SE) in the figures. Significance was accepted at p ≤ 0.05. Although no overall correction was applied for the number of ANOVAs used, type I error rate inflation should be considered when interpreting data from the current analysis.
A set of multiple regression models were developed a priori to examine the relationships between the change in maximum torque (ΔT) and the changes in anatomical and neuromuscular variables (ΔVAR). The relative quality of the models was subsequently tested using Akaike’s Information Criterion (AIC), as described below. The predictor variables included in each model were considered to theoretically influence maximum torque production (Narici et al., 1996; Blazevich et al., 2009). Individual %VA data obtained during the isometric contractions were also included in the concentric and eccentric candidate model sets to allow an inference of maximal activation capacity. When assessing the change scores, an absolute change was considered a more important indicator of change than percentage change, as a similar relative change would require large improvements by stronger, and only small improvements by weaker, individuals. Muscle activation, however, was quantified as the percent change in order to minimize the influence of individual variability in EMG resulting from anatomical differences (e.g., adipose tissue thickness). Additionally, as a significant change in moment arm following training would only result from a change in the knee joint angle at which maximum torque is produced, and total moment arm distance is important for the amplification of muscle force production, moment arm distance measured before training was included in the models.
To examine the effect of specific clusters of variables, a multi-step approach was taken. First, scatter plots were constructed to identify the relationships between ΔVAR and ΔT for each contraction mode. When the relationship between ΔVAR (or pre-training moment arm) and ΔT appeared to be non-linear the nature of the relationship was identified using polynomial curve fitting, with curve order being increased until the change in R2 was less than 2% (Waugh et al., 2012). These variables were added as non-linear data in the models (combined with the linear variables). The distributions of the dependent variables were checked for normality and both the changes in isometric (ΔTISO) and eccentric (ΔTECC) torque were transformed using the natural log due to non-normal distributions. Correlations were then computed to assess the isolated relationships between the changes in the anatomical and neuromuscular variables and the change in maximal torque for each contraction mode. Where the strength of the correlation has been interpreted, Cohen’s standards have been used.
The best model for each contraction mode was selected based on Akaike’s Information Criterion (AIC) (Burnham and Anderson, 2002; Arnold, 2010), as noted previously (Trezise et al., 2016). The models contained within the candidate model set for each contraction mode were all considered a priori to be theoretically influential to maximal torque production. To rank the models, the AIC adjusted for small sample size (AICC) was used (Burnham and Anderson, 2002). The model with the lowest AICC value was considered the best fit for that strength measure, and all models with ΔAICC ≤ 2 were considered to have substantial support (Burnham and Anderson, 2002). The Akaike Weights (wi) sum to one, and classify the probability of each model being the best-ft model within that candidate model set, with those with a higher likelihood having a greater weight (Wagenmakers and Farrell, 2004). Between 22 and 25 models were developed for each contraction mode, with combinations of variables determined by both their theoretical likelihood of influencing the change in torque and on the strength of their individual correlations with the changes in torque. Adjusted R2 values were used in combination with the AICC rankings to identify the percentage of torque that could be explained by the models.
To determine whether the neuromuscular variables previously identified as the best predictors from cross-sectional analysis were the same variables deemed to influence the change in torque following training, the predictors from the ‘best-fit’ model for each contraction mode from our previous cross-sectional study (Trezise et al., 2016) were also correlated with ΔT. All regression models were analyzed using R version 3.0.0 (R Core Team, 2013).
Results
All participants increased in strength following the 10-week training period (see Table 1). Maximal isometric, concentric, eccentric torques increased by 17.2 ± 12.6%, 12.5 ± 8.0% and 16.2 ± 14.4%, respectively (p < 0.01 for all; Table 1). These changes were less than the 46.6 ± 21.0% increase in 6-RM knee extension strength across the training period (data not shown). Strong correlations (r = 0.73–0.78) were observed between their final maximum leg extension load and maximum torque for each contraction mode following training, however, weak or no correlations (r = 0.07–0.25) were observed between the change in maximum leg extension load and the change in maximum torque for each contraction mode. Changes were observed in a number of variables relating to muscle activation, but not co-activation or moment arm at the angle of peak torque after training (Table 1). Statistically significant increases were also observed for all CSA, fascicle angle and fascicle length measurements, as shown in Table 2. Participants who produced greater torque at pre-training were equally likely to increase absolute strength as the weaker participants, as demonstrated by strong correlations between pre- and post-training torque values (r = 0.93, 0.97 and 0.90, all p ≤ 0.001, for isometric, concentric and eccentric torque, respectively).
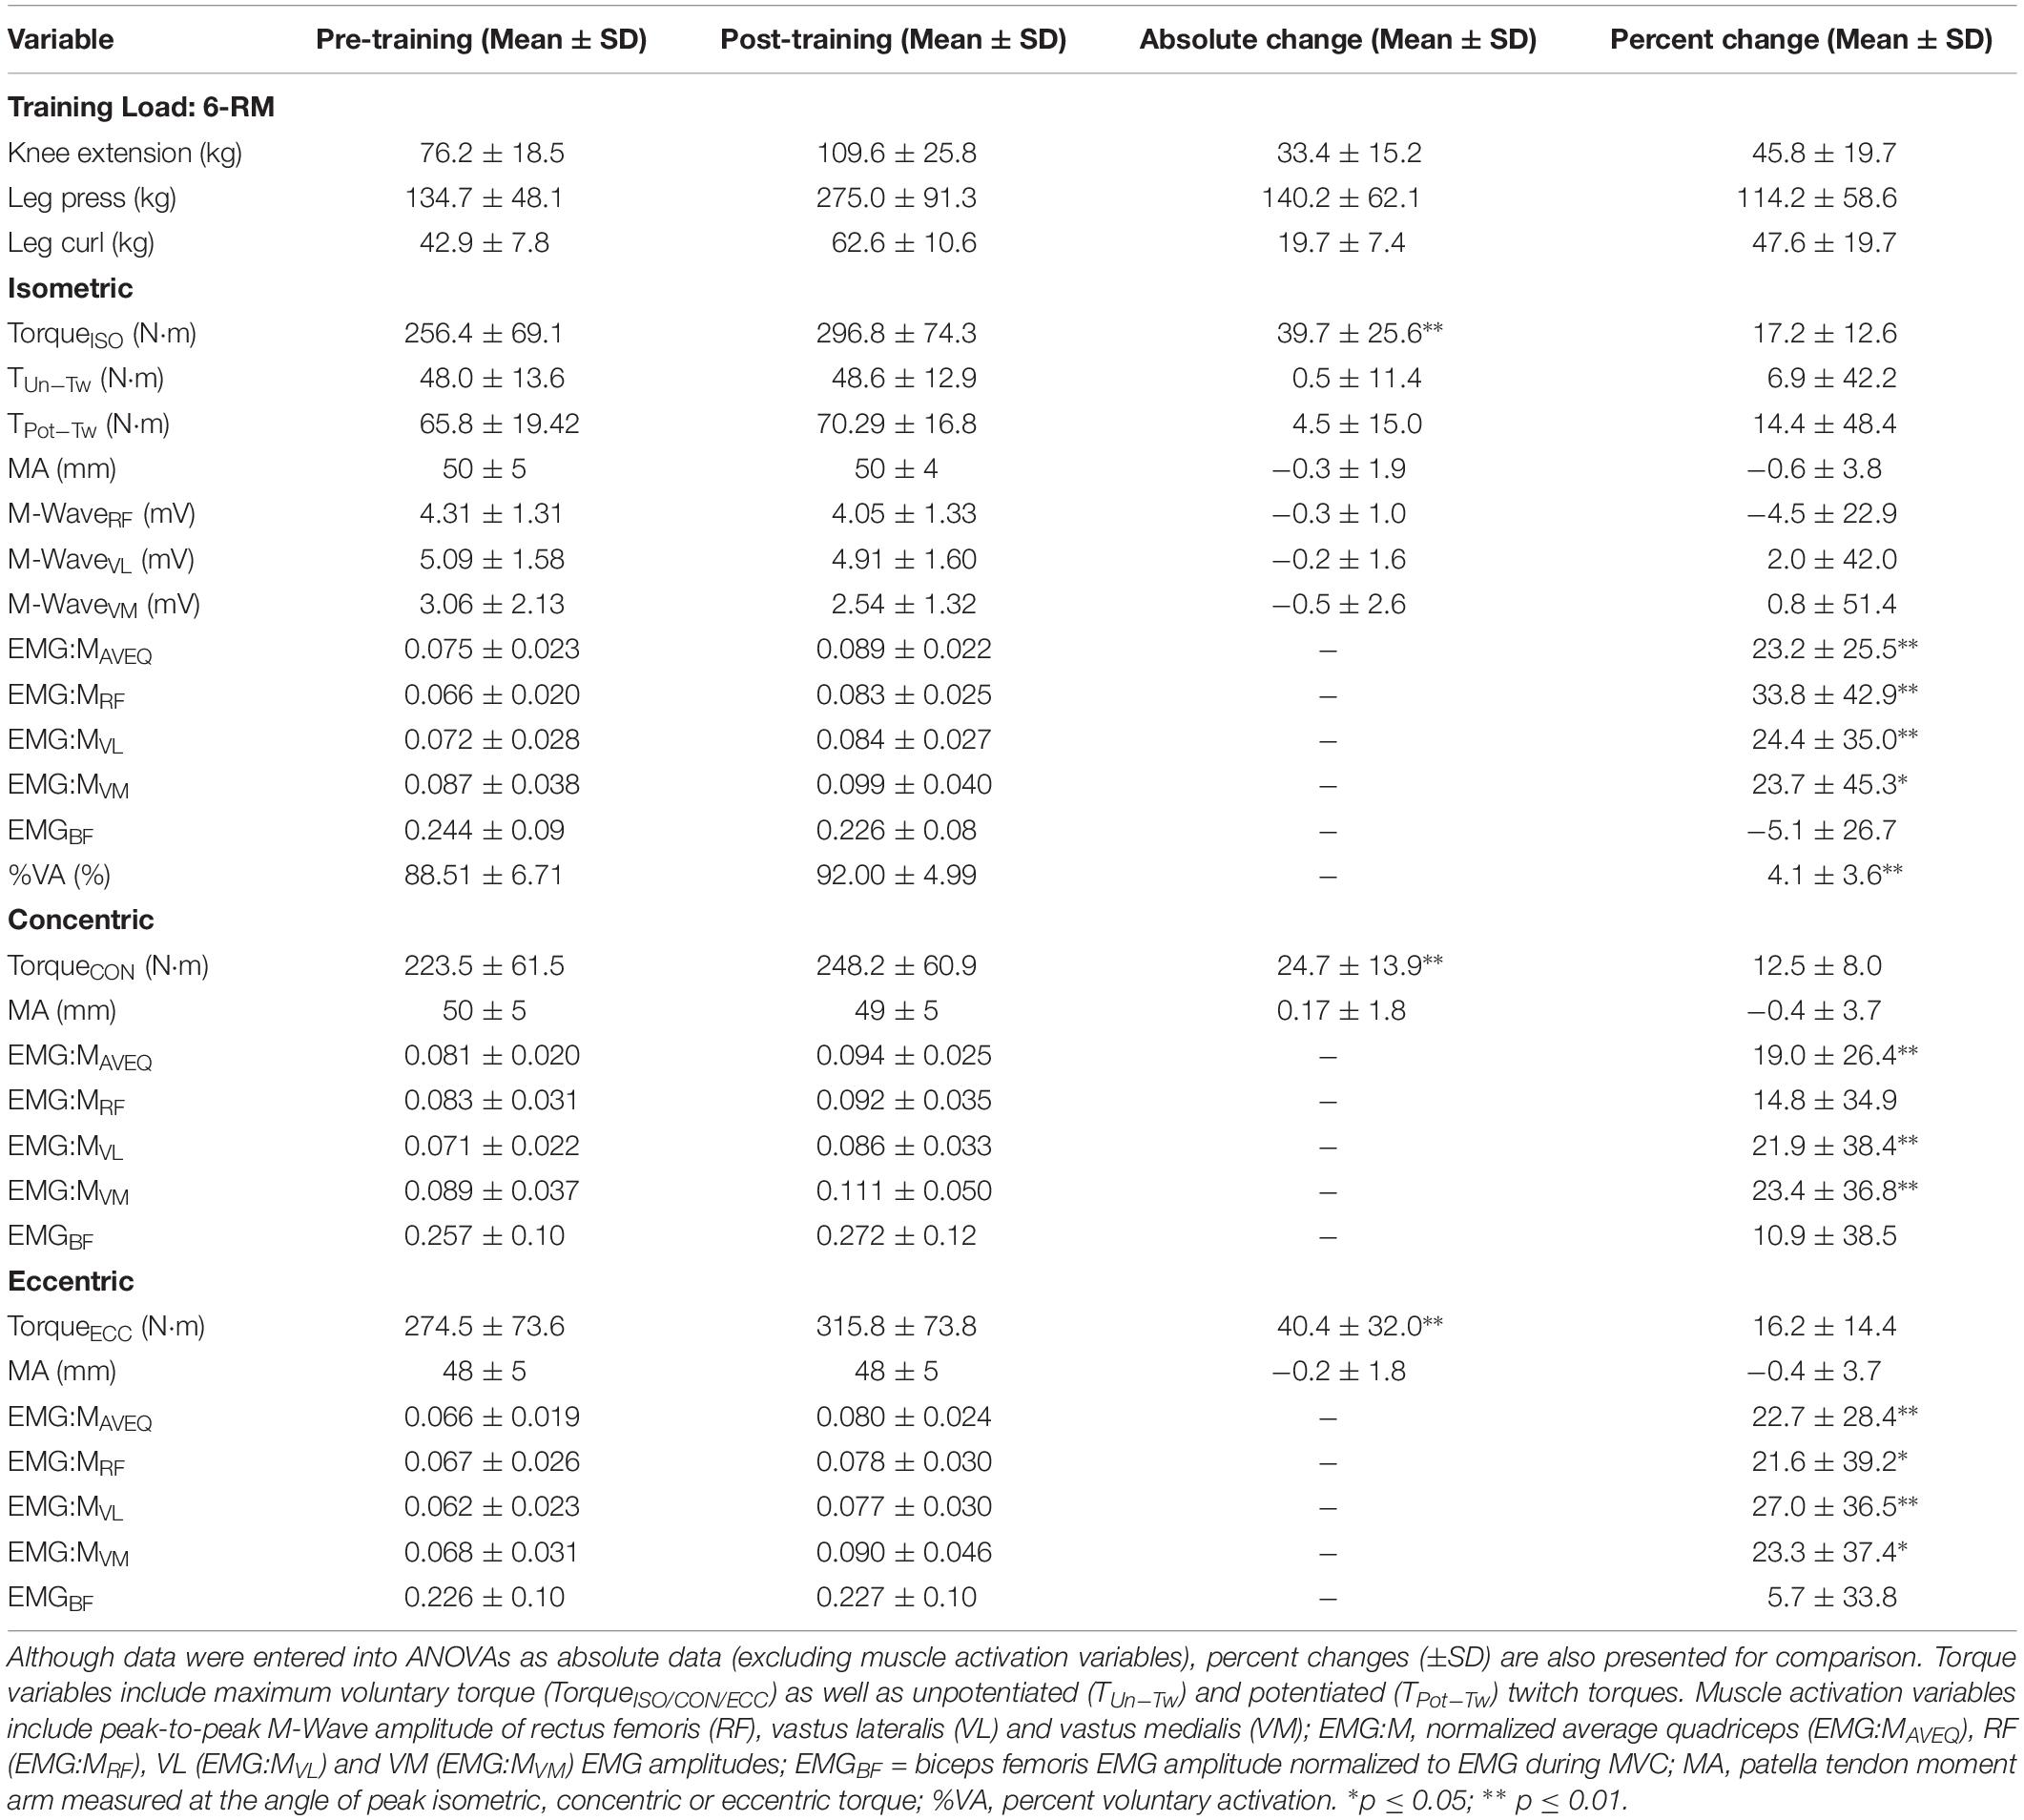
Table 1. Training loads, and torque, moment arm, and muscle activity and activation variables obtained before and after training during maximal isometric, and isokinetic concentric and eccentric contractions.

Table 2. Muscle size, fascicle angle, and fascicle length obtained before and after training.
Regression Models
Change in Torque Versus the Change in Anatomical and Neuromuscular Variables
Moderate relationships were observed between the best-fit models and the changes in torque for all contraction modes (Table 3). The best-fit model for the change in isometric torque was ‘ΔCSA,VLPROX + ΔθfVLPROX’ (R2 = 0.27, AICcwi = 0.52) while the best-fit models for the change in concentric and eccentric torques were ‘ΔEMG:MAVEQ + ΔCSA,VLPROX + ΔθfVI’ (R2 = 0.40, AICcwi = 0.15) and ‘ΔEMG:MRF + ΔCSA,QPROX + ΔθfVI’ (R2 = 0.41, AICcwi = 0.31), respectively (Table 3). Models incorporating the change in mid-region vastus lateralis fascicle length (lfVLMID) or angle (θfVLMID) also had substantial support for inclusion in the concentric torque prediction models, and the change in percent voluntary activation (%VA) and pre-training moment arm distance had substantial support (AICC < 2) for use in the eccentric models (Table 4). Based on the best-fit models for each contraction mode, the mean (± SE) absolute errors in the prediction of the change in torque were 16.1 ± 3.1% (isometric), 59.8 ± 12.9% (concentric) and 17.6 ± 2.3% (eccentric) (see Figure 2).
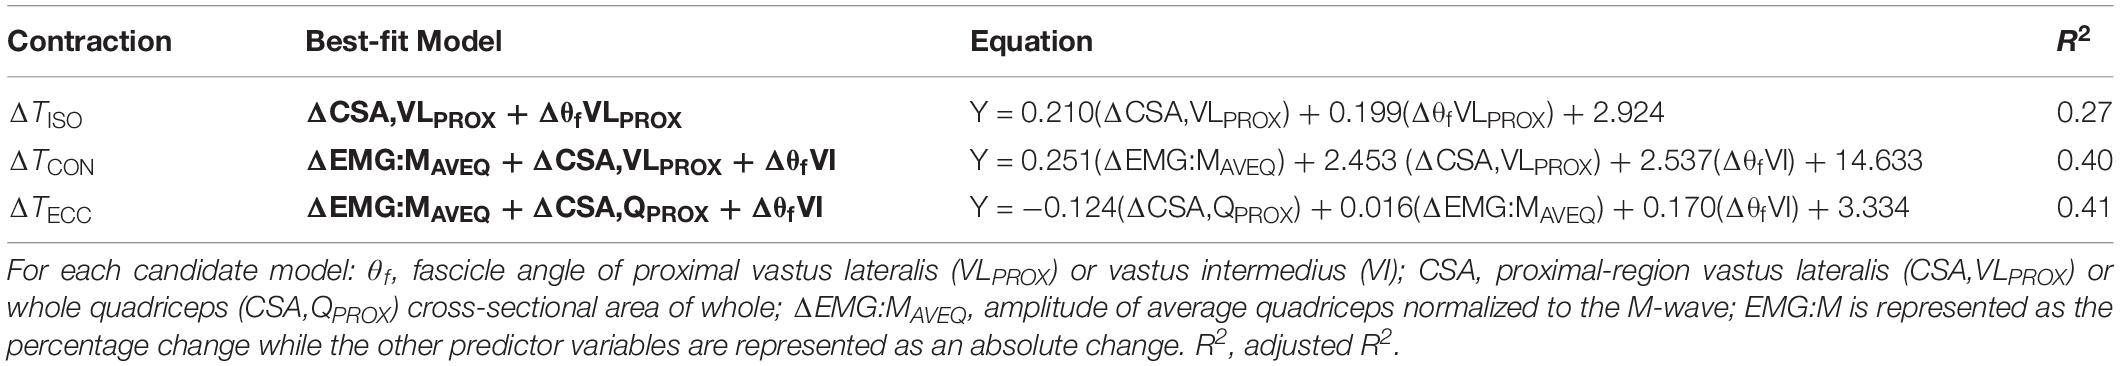
Table 3. The best-fit model for predicting changes in maximum isometric and isokinetic concentric and eccentric torque (ΔT) from the changes in predictor variables (ΔVAR).
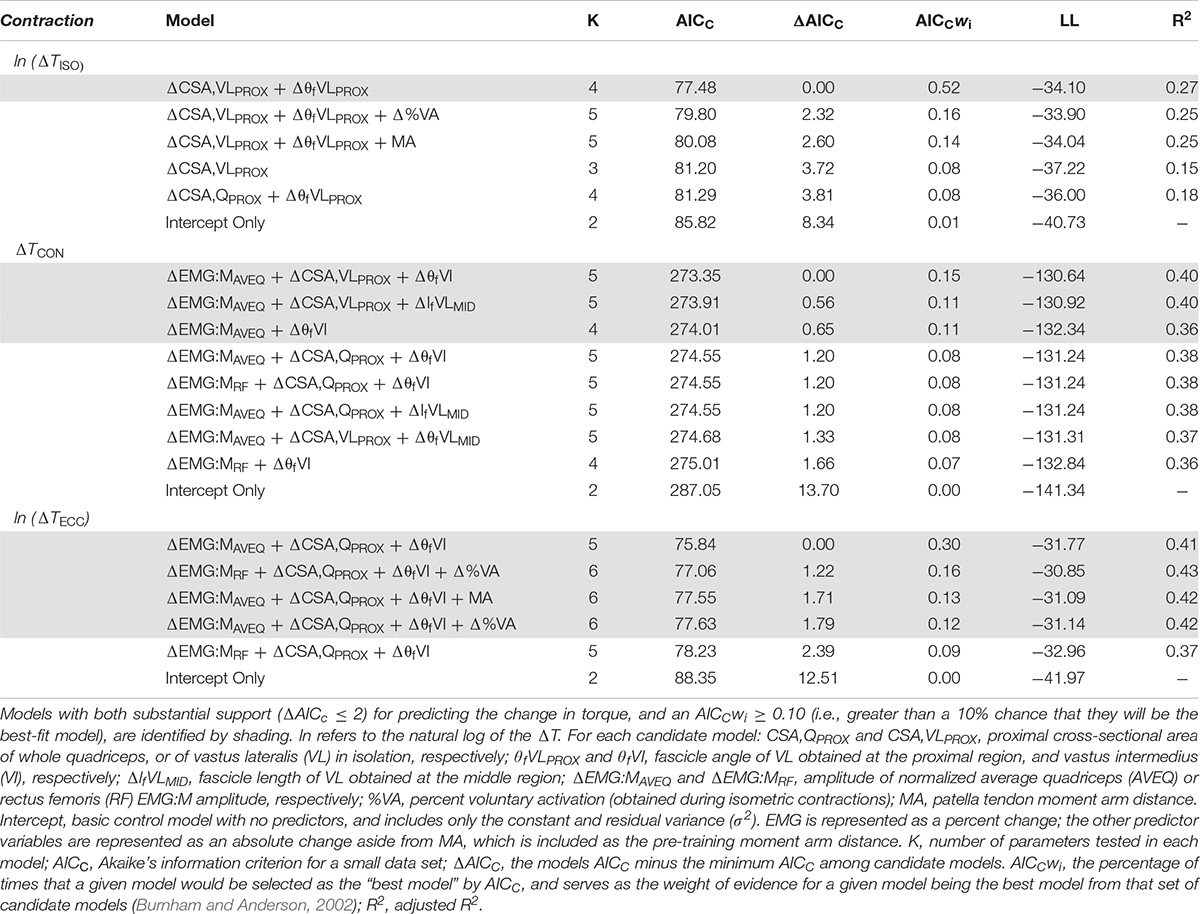
Table 4. Akaikes’ Information Criterion (AIC) of model parameters for predicting the change in isometric, concentric and eccentric torque (ΔT) based on changes in the predictor variables (Δ).
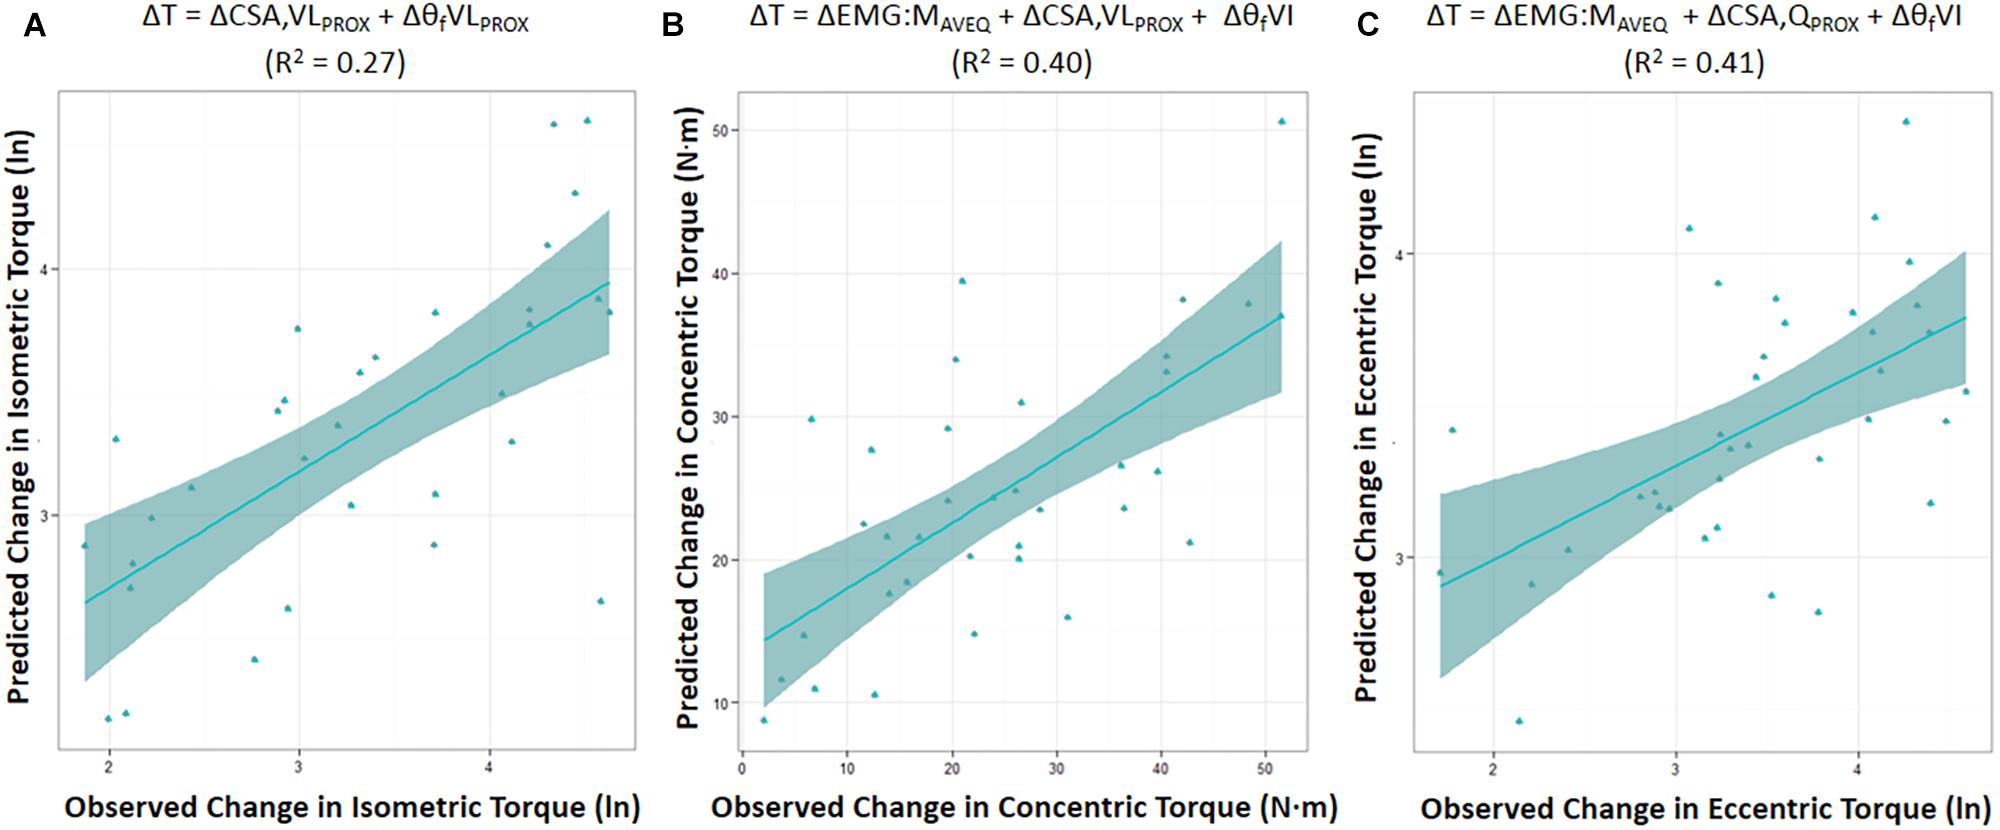
Figure 2. Predicted change in torque (ΔT) was modeled based on the AICC rankings using the best-fit model for the change in maximal isometric (A), and isokinetic concentric (B) and eccentric (C) torque prediction. Figures show the mean (± SE) for each model. (ln) = the natural log of the change in torque. CSA,QPROX and CSA,VLPROX = proximal cross-sectional area of whole quadriceps, or of vastus lateralis (VL) in isolation, respectively; EMG:MAVEQ = normalized average quadriceps (AVEQ) amplitude; θfVLPROX and θfVI = fascicle angle of VL obtained at proximal region, and vastus intermedius (VI), respectively; R2 = adjusted R2.
While fascicle angle was present in all best-fit models, ΔθfVLPROX appeared in the isometric torque prediction models whereas ΔθfVI appeared in the concentric and eccentric torque models. Similarly, the change in VL CSA was included in the best-fit isometric and concentric torque models (ΔCSA,VLPROX), while whole quadriceps CSA measured proximally (ΔCSA,QPROX) was included in the eccentric torque prediction models. There was also substantial support for models incorporating the percent changes for both the average quadriceps (ΔEMG:MAVEQ) and rectus femoris (ΔEMG:MRF) muscle activation variables for both concentric and eccentric torque production. Models incorporating the change in antagonist EMG (EMGBF) and unpotentiated twitch torque did not have enough support to be included in the final candidate model set for any contraction mode.
Change in Torque Verses the Change in the “Best-Fit” Parameters Identified From Cross-Sectional Analysis
In a previous study (Trezise et al., 2016) we determined the combination of neuromuscular variables that best explained an individual’s maximum strength using a cross-sectional study design. The specific variables in those models were also tested in the present study to examine whether the models that could explain the greatest variance in maximum torque production on a cross-sectional basis could also explain a significant proportion of the variance in the change in torque over a period of training, however, no relationship was observed for any contraction mode (R2 = 0.00 to 0.07; Table 5).
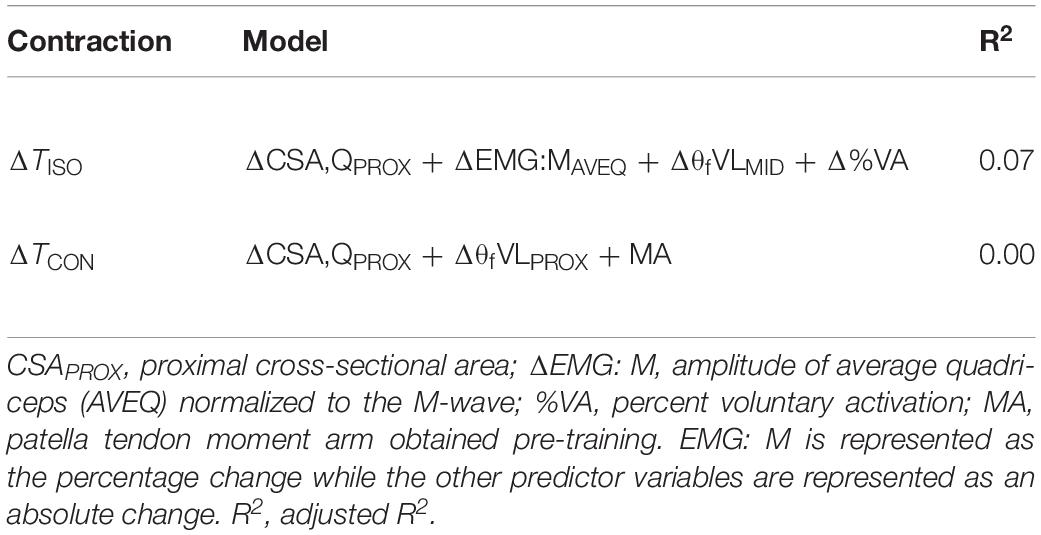
Table 5. Regression models using the previously identified “best-fit” model parameters for predicting maximal torque in a cross-sectional analysis (Trezise et al., 2016) to determine whether adaptations in these variables were associated with changes in strength following training.
Correlations
Correlations Between Changes in Torque and Changes in Muscle Activation Variables
While the percent changes in agonist muscle activation variables were not correlated with the change in isometric torque, ΔEMG:MAVEQ and ΔEMG:MRF were moderately correlated with the change in both concentric (r = 0.52, p < 0.01; r = 0.56, p < 0.001) and eccentric (r = 0.56, p < 0.001; r = 0.51, p < 0.01) torques, as shown in Table 6. ΔEMG:MVM was also weakly correlated with the change in both concentric (r = 0.35, p < 0.05) and eccentric (r = 0.48, p < 0.01) torque.
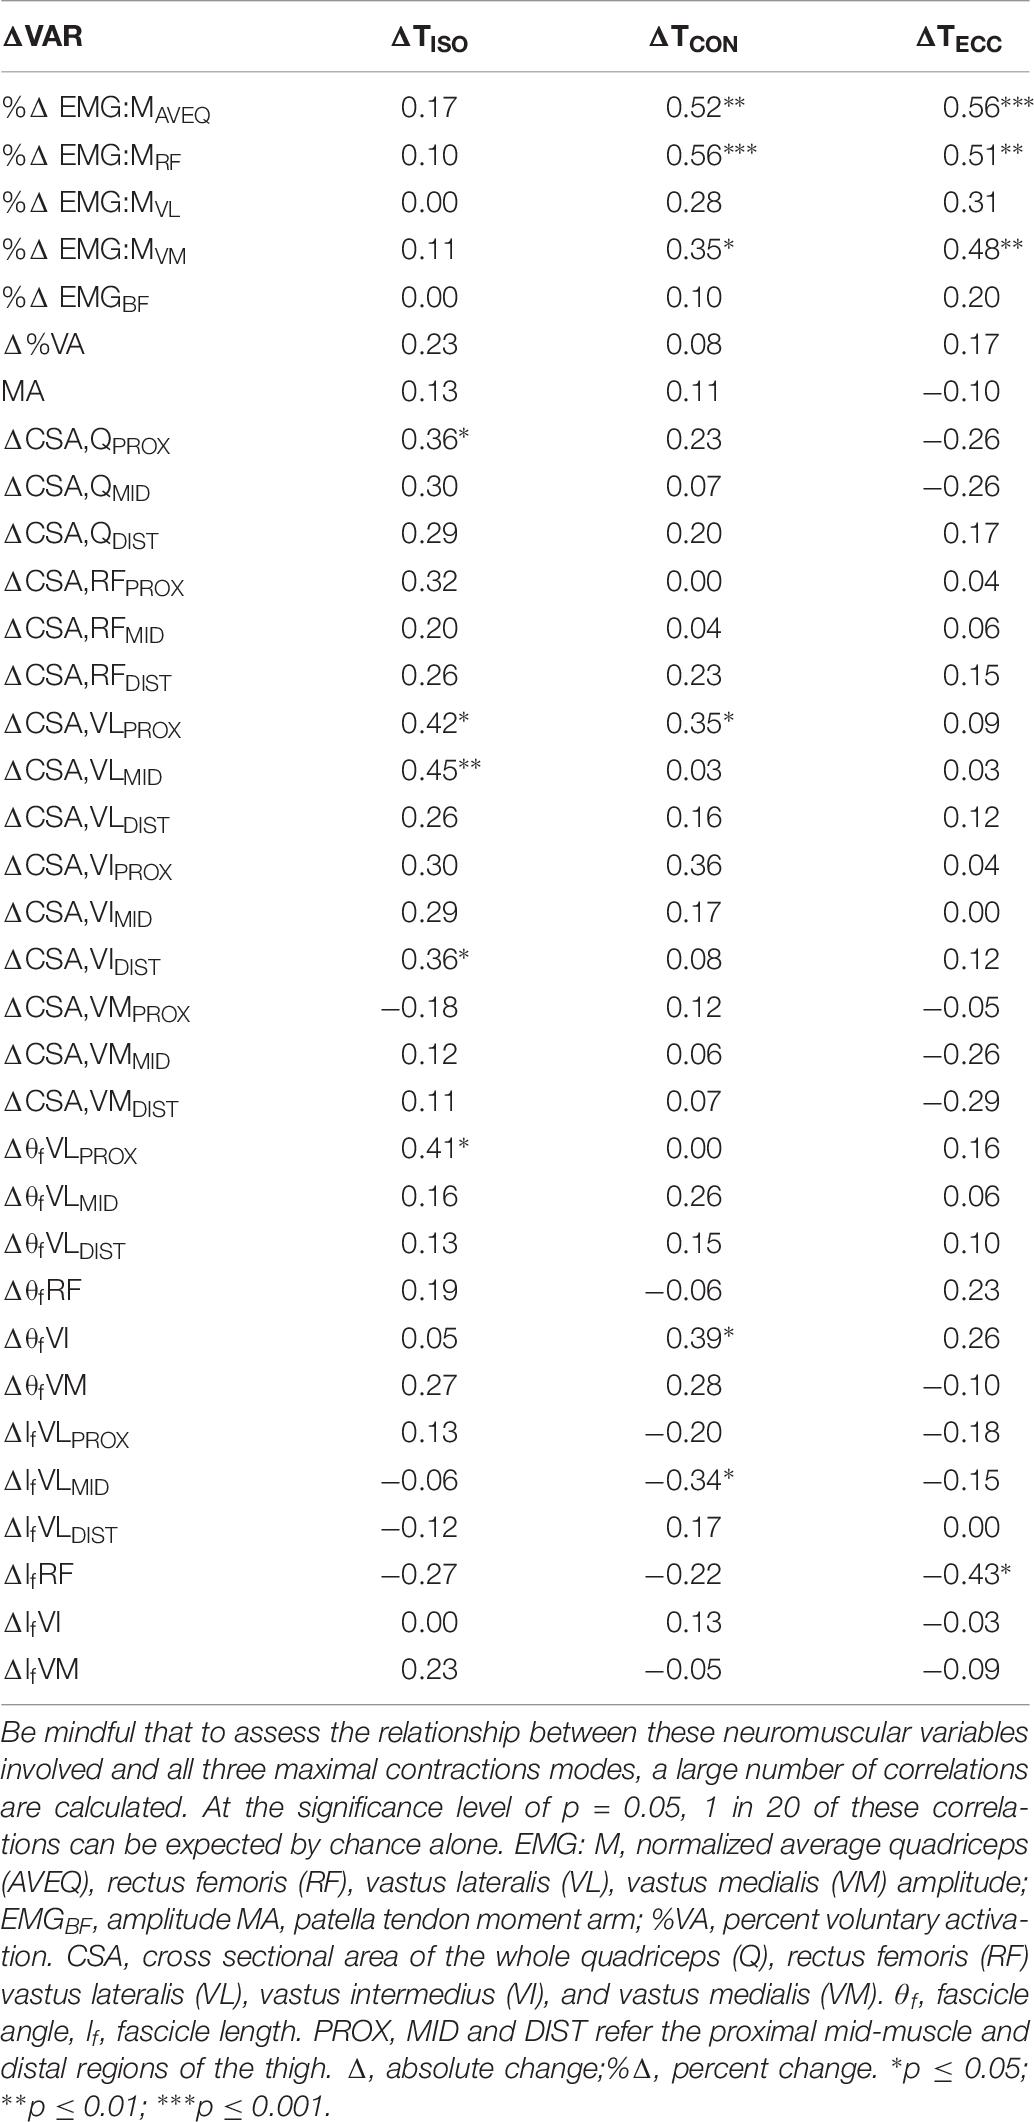
Table 6. Correlations (r) between the change in isometric (ΔTISO), and isokinetic concentric (ΔTCON) and eccentric (ΔTECC) torque and changes in neuromuscular variables (ΔVAR).
Correlations Between Changes in Torque and Changes in Muscle Size and Architecture
Changes in muscle size were more strongly correlated with the change in isometric torque than either concentric or eccentric torque. The change in proximal whole quadriceps CSA (ΔCSA,QPROX) and the change in proximal (ΔCSA,VLPROX) and mid-region (ΔCSA,VLMID) VL CSA were weakly correlated with the change in isometric torque (r = 0.36 and 0.42, p < 0.05) and (r = 0.45, p < 0.01), respectively; see Table 6. ΔCSA,VLPROX was also weakly correlated with the change in concentric torque (r = 0.35, p < 0.05). The change in eccentric torque was not correlated with changes in any muscle size variable.
The change in proximal region VL FA (ΔθfVLPROX) was moderately correlated with the change in isometric torque (r = 0.41, p < 0.05) and the change in VI FA (ΔθfVI) was moderately correlated with the change in concentric torque (r = 0.41, p < 0.05); Table 6. The change in mid-region VL fascicle length was moderately correlated with the change in concentric (r = 0.35, p < 0.05), and the change in RF fascicle length was moderately correlated with the change in eccentric (r = 0.43, p < 0.05) torque. This change in fascicle length was the only muscle-based variable found to correlate with the change in eccentric torque following training.
Discussion
Whilst muscle size, activation and architecture are considered to be important variables influencing maximum muscular force production (Narici et al., 1996) there is surprisingly little information regarding the relationship between changes in these variables and changes in strength following training. The present study examines the relationship between changes in isometric, concentric and eccentric knee extension strength and changes in specific anatomical and neuromuscular variables (i.e., muscle size, activation and architecture) following chronic (10 weeks) heavy (6-RM) strength training. The main conclusions are that (1) the change in isometric strength was moderately associated with changes in muscle size and fascicle angle; (2) the change in agonist muscle activation was the strongest predictor of the changes in maximum concentric and eccentric torque production (r = 0.51–0.56), and this relationship was strengthened when muscle size and fascicle angle were added to the predictive models; (3) pre-training moment arm distance and the change in percent voluntary activation (%VA) also appeared to influence the change in eccentric torque as they were included in models that received substantial support; (4) the best models previously identified for predicting maximum torque within a population (i.e., ‘CSA,QPROX + EMG:MAVEQ + θfVLMID + %VA’ and ‘CSA,QPROX + θfVLPROX + MA’ for maximum isometric and concentric strength, respectively; (Trezise et al., 2016) were unable to predict the changes in torque with chronic training (r = 0.00–0.07); and (5) overall, 27–41% of the variance in the change in isometric, concentric and eccentric torques could be predicted by the changes in the anatomical and neuromuscular variables measured in the present study.
The four best candidate models for each contraction mode were ranked using Akaike’s information criterion (AICC), an information-theoretic approach for model selection that determines the best-fit model by accounting for the goodness-of-fit of a model (i.e., the difference between the expected and the observed data) in conjunction with its simplicity (i.e., the number of variables included) (Burnham and Anderson, 2002; Arnold, 2010). The models were designed to predict the absolute changes in strength rather than the relative change to ensure that the influence of stronger participants was not reduced if their relative changes were modest compared to the weaker participants. Post hoc, the data analysis was repeated using relative change scores and, interestingly, little difference in outcome was observed (data not shown) so the information presented herein appears equally applicable to relative changes in strength. The training elicited strength increases (12.5–17.2%, see Table 1) that were similar in magnitude to those reported previously following similar-duration heavy strength training interventions (Braith et al., 1989; Rutherford and Jones, 1986; Ahtiainen et al., 2003; Balshaw et al., 2017). Nonetheless, although strength changes in all contraction modes were substantial and statistically significant, they were also highly variable between individuals (see large SD in Table 1). The changes in strength were slightly less than the 33.9 ± 15.7 kg (46.6 ± 21.0%; p < 0.001) increase in 6-RM knee extension strength following training. This discrepancy may have resulted from the different contraction modes performed in the training (isoinertial) and testing (isometric and isokinetic). The neuromuscular adaptations were measured during isometric and isokinetic contractions, as isoinertial training exercises also require greater activation of the stabilizing and synergist muscles and thus maximum quadriceps force production may be limited by strength and activation of the stabilizer muscles (Rutherford and Jones, 1986).
The best-fit models were found to explain 27, 40, and 41% of the inter-individual variation in the change in maximal isometric, concentric, and eccentric torque, respectively (Table 3). Model use led to mean (± SE) absolute errors in the prediction of the change in torque of 16.1 ± 3.1% (isometric), 59.8 ± 12.9% (concentric) and 17.6 ± 2.3% (eccentric) (Figure 2). Therefore, while changes in the anatomical and neuromuscular variables assessed in the present study appeared to be moderately associated with the change in maximum knee extension torque production (i.e., strength) following the 10-wk strength training period, the change in concentric torque in particular was poorly predicted. Thus, whilst the isometric and eccentric models can provide a reasonable estimate of maximal joint torque, care should be taken when using the concentric torque prediction model. Also, whilst measurement errors will reduce the explained variance in such models, ensuring that the values (27, 40, and 41%) somewhat under-represent the true capacity to predict strength change, the results also indicate that (i) the mechanisms influencing strength change must differ between individuals and (ii) mechanisms additional to those measured in the present study must have influenced the strength changes (see discussion below).
Factors Associated With the Change in Isometric Torque
The best-fit model for the change in isometric torque included both the change in proximal VL CSA (vastus lateralis CSA) and the change in proximal VL fascicle angle. While the model explained only 27% of the change in isometric knee extension torque, it was the strongest model in the candidate set with an AICc weight (AICcwi) of 0.57, indicating that 57% of the time the candidate model would be the best-fit model amongst that set of candidate models. The inclusion of CSA in the models is not surprising given that muscle size is considered to be a significant variable influencing joint torque production (Maughan et al., 1983; Schantz et al., 1983; Castro et al., 1995; Moss et al., 1997; Blazevich et al., 2009), and cross-sectional analyses show moderate-to-strong correlations between maximal voluntary strength and measures of muscle size (Maughan et al., 1983; Fukunaga et al., 2001; Blazevich et al., 2009; Erskine et al., 2010; Trezise et al., 2016). However, the relationship between the change in joint torque and the change in muscle size is not as clear. Of the few studies to assess this relationship following dynamic training in the quadriceps, weak-moderate correlations (r = 0.46 and 0.52) have been observed between the change in muscle size and the changes in isometric (Erskine et al., 2010, 2014; Balshaw et al., 2017) and eccentric (Higbie et al., 1996) strength, and a moderate correlation (r = 0.70) was found with the change in concentric (Higbie et al., 1996) strength. Higbie et al. (Higbie et al., 1996) speculated that the weaker relationship between the changes in muscle size and strength is unsurprising given that whole muscle CSA does not reflect the activation of muscle fibers, or the velocity-dependent nature of this activation. Interestingly, when accounting for region-specific hypertrophy, strong relationships have been observed between the change in proximal VL and isometric force developed at short muscle lengths (r = 0.80–0.85) and between the change in mid-region VL CSA and isometric force at long muscle lengths (r = 0.79–0.95) (Noorkõiv et al., 2014) following isometric training. These results indicate that region-specific changes in CSA may underpin changes in the force-length relationship of muscle, suggesting a functional role of variable hypertrophy. It also appears that the strength of the relationship between the change in isometric torque and region-specific changes in muscle size may be task-dependent, and are stronger following isometric training.
Effect of Muscle Size
In the present study, the change in maximum isometric torque was most strongly associated with the change in muscle size (r = 0.36 to 0.45, p < 0.05, for proximal-region whole quadriceps (Q), and VL CSA, and mid-region VL CSA; Table 6). This finding is similar to other studies examining the influence of dynamic strength training (Erskine et al., 2010). While these data suggest a possible causative link between changes in CSA and changes in isometric torque production, a majority of the variance in torque production following training was left unexplained. Therefore, factors other than muscular hypertrophy must contribute significantly to changes in strength in many individuals, and changes in hypertrophy alone may not always be expected to result in notable changes in strength.
Effect of Fascicle Angle
The inclusion of fascicle angle in combination with CSA (both measured proximally) improved the predictive strength of the models, which emphasizes the potential importance of physiological CSA (PCSA) for maximizing changes in strength. Increases in fascicle angle allow more contractile tissue to attach to a given area of tendon or aponeurosis (Otten, 1988; Kawakami et al., 1993; Blazevich et al., 2006; Ikegawa et al., 2008) and should thus increase PCSA and, therefore, contractile force. An alternative explanation is that an increase in fascicle angle can increase fascicle rotation during contractions, which produces a gearing effect allowing fascicles to work at slower speeds and enhancing muscle force through the optimization of both the force-velocity and the force-length characteristics (Hill, 1938; Blazevich and Sharp, 2005; Brainerd and Azizi, 2005). However, only high-force (slow-speed) contractions were examined in this study so it is probable that fascicle rotation would be minor (Azizi et al., 2008) and this mechanism may not be of substantial influence. Therefore, it is more likely that the increased ability to pack contractile tissue onto the tendon and aponeurosis was the main benefit derived from the simultaneous increases in CSA and fascicle angle in the proximal region. It is not surprising that proximal VL CSA was most strongly correlated with isometric torque as VL is the largest quadriceps component (Narici et al., 1992). Its proximal CSA is slightly larger than its mid-region CSA (Table 2), and proximal CSA was observed to be strongly predictive of strength differences in a cross-sectional analysis (Trezise et al., 2016). It is not yet known if there is a specific functional importance of the proximal quadriceps muscle during knee extension, but the results of the present study suggest that CSA obtained at the proximal region may be more influential than the middle (or distal) region on individual variations in the change in isometric knee extension torque following training. The result emphasizes the need to examine changes in proximal quadriceps musculature rather than obtaining CSA from a single mid-muscle region or measuring whole muscle volume.
When considering single variable correlations rather than the models, it was of interest that the changes in proximal VL fascicle angle were moderately correlated with the change in isometric torque (r = 0.41, p < 0.05, Table 6) whilst fascicle angles measured at other locations were not significantly correlated. Significant increases in fascicle angle were elicited by the training at all measurement sites (Table 2), however, these changes were highly variable between individuals (see SD in Table 2). Considering the apparent influence of the proximal region on changes in isometric torque (described above), the possibility exists that the functional influence of other regions was minimal. One previous study also examined the relationship between the change in VL fascicle angle and the change in isometric torque following a similar training protocol to that used in the present study, with weak and non-significant correlations reported (r = −0.33, p = 0.21) (Erskine et al., 2010). Given these results it may be concluded that changes in fascicle angle, when considered in isolation, are relatively unrelated to changes in isometric strength, however, they are possibly important when changes in CSA also occur simultaneously.
Effect of Fascicle Length
Changes in fascicle length should, theoretically, be associated with increases in muscle shortening speed and force production during high speed or large range of movement activities (Sacks and Roy, 1982; Abe et al., 2000; Blazevich and Sharp, 2005). Given this, it was not surprising that fascicle length was not included in any of the best-fit models for the prediction of isometric torque. While Erskine et al. (Erskine et al., 2010) reported a weak correlation between VL fascicle length and isometric torque (r = −0.47, p = 0.06), Noorkoiv et al. (Noorkõiv et al., 2014) found no relationship between the change in VL fascicle length and the change in isometric torque. In the present study, there was also no correlation observed between the change in VL fascicle length and the change in isometric torque (Table 6). The lack of relationships observed between fascicle length and isometric torque indicate that fascicle length change may have little functional influence on isometric torque, at least when measured at the angle of peak torque. In future research, the impact of fascicle length on torque production at long versus short muscle lengths might be more explicitly examined.
Factors Associated With Changes in Concentric and Eccentric Torque
The best-fit models for predicting the changes in concentric (EMG:MAVEQ + CSA,VLPROX + θfVI) and eccentric (EMG:MAVEQ + CSA,QPROX + θfVI) torque displayed moderate relationships (R2 = 0.40 and 0.41, for concentric and eccentric torque, respectively). While the inclusion of changes in CSA and fascicle angle may again indicate the importance of an increase in contractile tissue within the muscles for strength change following training, the change in muscle activation was also included in all candidate models (Table 4) and was also the most strongly correlated with the change in torque of any neuromuscular variable (r = 0.51 to 0.56 for the change in a both average quadriceps (EMG:MAVEQ) and RF (EMG:MRF) muscle activity and the change in concentric and eccentric torque, respectively, Table 6). Muscle activity can, therefore, be considered the most important variable influencing concentric and eccentric torque production in the present study.
Effect of Agonist Muscle Activation
Whilst a greater agonist muscle activity is often considered to be an important factor influencing strength expression (Narici et al., 1989; Häkkinen et al., 1992; Aagaard et al., 2000b, 2002; Del Balso and Cafarelli, 2007), the relationship between the change in muscle activity and the change in torque has not been well studied. Researchers have commonly used EMG procedures to assess changes in muscle activity (Narici et al., 1996; Aagaard et al., 2000b), however, peripheral factors can strongly influence these measurements (Farina et al., 2004). To account for the potential influence of peripheral changes on EMG amplitudes in the present study, EMG signals were normalized to their respective M-wave amplitudes (elicited by supramaximal femoral nerve stimulation). M-wave-normalized EMG amplitudes (EMG:M) were considered to provide a clearer estimate of central drive because alterations at, and distal to, the neuromuscular junction, including changes to muscle membrane excitability and fascicle angulation, should be removed by the M-wave normalization process (Fuglevand et al., 1993). In fact, %VA (obtained using the interpolated twitch technique) and quadriceps EMG:M amplitudes measured during the isometric contractions were both found to increase over the training period in the present study, which is some support for the supposition.
Moderate correlations were observed between the change in both concentric and eccentric knee extension torque and the percent change in average quadriceps EMG amplitude (EMG:MAVEQ; r = 0.52, p < 0.01 and r = 0.56, p < 0.001, respectively; Table 6). Therefore, those individuals who displayed a greater increase in agonist EMG:M amplitude also displayed greater improvements in torque when measured during dynamic contractions. Among the quadriceps components, the percent change in RF EMG amplitude (EMG:MRF) was most strongly related to the changes in both concentric (r = 0.56, p < 0.001) and eccentric (r = 0.51, p < 0.01) torque, while the percent changes in VM and VL showed either weak or no relationship with the change in torque for either measure (Table 6). These results are similar to Higbie et al. (Higbie et al., 1996) (r = 0.48 and 0.68, p < 0.05, for eccentric and concentric contractions, respectively), who considered the strength of this correlation reasonable considering EMG is not reflective of all possible neural adaptations following training. Thus, models incorporating either the change in average quadriceps or rectus femoris amplitude both had substantial support for predicting the change in both concentric and eccentric torque following training.
Other muscle activity measures (i.e., voluntary activation and antagonist) were collected simultaneously with agonist EMG:M in the present study with the intention of strengthening evidence for the change in muscle activity in the regression models. In fact, the change in %VA was included along with ΔEMG:MRF in the models with strong support for predicting the change in eccentric torque (Table 5). The change in %VA obtained during isometric contraction (at the relevant angle of maximum isometric or eccentric torque) showed no relationship with the change in isometric torque (r = 0.23) despite it being shown to be an important predictor of maximum isometric and eccentric torque cross-sectionally (Trezise et al., 2016). This differs somewhat from the results observed by Erskine et al. (Erskine et al., 2010) (r = 0.47) in their untrained individuals following 9 weeks of strength training, and also to Stragier et al. (2016) who found a moderate correlation (r = 0.73) following 24 weeks of plantarflexor strength training in older adults. In the present study, the difference in correlations between the change in torque and the changes in EMG:M and %VA is understandable, for while %VA is accepted as a good indicator of activation capacity it may be influenced by other factors distal to the neuromuscular junction, including the efficiency of force transmission through the series elastic components (Taylor, 2009), and this may influence the correlations (Table 6). It was also measured during isometric contractions, and thus measurement obtained during dynamic contractions in future studies may yield different results. Regardless, as the eccentric models in which both EMG:M and %VA were included received substantial support (ΔAICc < 2) it is probably the case that both measurements provide unique (i.e., different) information with regard to muscular force production.
Effects of Antagonist Muscle Activation
Antagonist muscle activity may also influence maximal torque production by decreasing net joint torque (Narici et al., 1996; Kellis and Baltzopoulos, 1998; Aagaard et al., 2000a); however, no changes in biceps femoris EMG amplitudes (EMGBF) were observed after training in any contraction condition, which is consistent with the findings of Reeves et al. (Reeves et al., 2004). The large inter-individual variability in this change (see large SD; Table 1) should have made relationships more, rather than less, likely to be detected, however, despite being considered to influence maximum torque production (Trezise et al., 2016), no relationships were observed between the changes in torques and the change in antagonist activity. Therefore, changes in other functional and structural variables were more clearly associated with changes in dynamic torque production.
Effect of Fascicle Angle
Based on the influence of fascicle angle on isometric, concentric and eccentric torque, it might be speculated that changes in fascicle angle, when considered in isolation, are relatively unimportant for strength increases (in the present study, only VI fascicle angle was correlated with the change in concentric torque; Table 6). However, the present results show that the inclusion of fascicle angle simultaneous with CSA or muscle activity variables substantially increased model strength. The specific importance of VI fascicle angle in the models cannot be readily explained, especially given that VL fascicle angle appeared more important for the change in isometric torque production. Speculatively, VI may play a more functional role during dynamic contractions (i) than other quadriceps components and (ii) than in isometric contractions, as it is a large muscle that anchors proximally to a bony attachment at its endpoint [VL contacts the aponeurotic sheath of VI; (Ando et al., 2018)]. VI muscle activity was not measured in the present study and thus this hypothesis cannot be examined herein, although it may be done in the future (Akima and Saito, 2013; Watanabe and Akima, 2011). At his point, however, there is no information regarding potential improvements in VI activity following strength training. As the change in VI fascicle angle was smaller than in other quadriceps components, and also displayed a relatively small range of change (Table 2), statistical effects are unlikely to underpin its inclusions and this may indicate a particular functional importance. Speculatively, VI may have a greater influence on strength change when increases in muscle size and/or activation [or other changes that could not be examined in the present study, such as lateral force transmission efficiency (Huijing, 2003)] occur. Thus, while not predictive in isolation, the simultaneous changes in proximal quadriceps CSA, VI fascicle angle and quadriceps muscle activity appear to strongly influence the change in concentric and eccentric torque production following strength training.
Effect of Fascicle Length
Models incorporating the change in VL fascicle length measured mid-muscle received substantial support for inclusion in the concentric models. In isolation, this measure was also weakly correlated with the change in concentric torque (r = −0.34, p < 0.05), indicating that individuals who demonstrated the least increase (or a decrease) in fascicle length showed a greater increase in torque after training. Of interest, RF fascicle length changes were the most strongly correlated with the change in eccentric torque of all the muscular variables (r = −0.43, p < 0.05). Thus, while fascicle length is often considered to be associated with force production during higher-speed (lower-load) movements, the current relationships indicate that changes in fascicle length may have some influence on the change in slower-speed (higher-load) dynamic strength following heavy strength training.
Effect of (Pre-training) Moment Arm
A large moment arm is theoretically ideal for high torque production, whereas a small moment arm optimizes joint angular range and velocity (Lieber and Fridén, 2001; Smith et al., 2007), and moment arm distance may influence the magnitude of strength improvement after a period of strength training. In the present study, models incorporating moment arm distance also received substantial support (ΔAICc < 2) for inclusion in the eccentric models, and moderate support for consideration in both the isometric and concentric (data not shown) models (ΔAICc < 4). Therefore, while not incorporated within the best-fit models, moment arm distance does appear to influence the change in joint torque, with greater improvements in dynamic torque production observed in individuals with a greater moment arm distance.
Are Variables Associated With Strength in a Cross-Sectional Analysis Also Influential to Longitudinal Strength Change?
In our previous study (Trezise et al., 2016), several neuromuscular variables were identified as being strongly correlated with maximum isometric and concentric torque production in a group (n = 56) of healthy young men. Those results suggested that the targeting of these variables might allow for increases in muscular strength. However, the best-fit models identified in that study did not predict the changes in strength measured in this study (R2 ≤ 0.07; Table 5). For example, muscle activation was strongly related to maximum isometric torque cross-sectionally, but its change was not a strong predictor of the change in isometric torque following training. Similarly, joint moment arm distance was an important predictor of maximum concentric torque cross-sectionally, but was not found to be a predictor of the change in concentric torque with training. This clearly indicates that the results of cross-sectional and longitudinal studies may differ substantially and conclusions must be made specifically to the study design used. Thus, the functional importance of specific anatomical and neuromuscular variables for muscular strength appears to be contextual, for while strength variation within a population may be well explained by variations in muscle size, activity, architecture and moment arm, the changes in strength elicited by strength training of the duration used in the present study cannot be clearly linked with changes in these specific neuromuscular variables. Longer training periods eliciting greater strength changes may be required before clearer indications can be seen, or factors not measured in the present study [e.g., lateral force transfer; (Huijing, 2003)] might be influential with regards to strength change. Further research using longitudinal designs is required in order to provide the information necessary to allow for the specific targeting of neuromuscular factors that most clearly influence strength change.
Another factor influencing the strength of the relationship between the change in torque and the change in muscle size (and, in fact, the change in any of the neuromuscular variables) is the magnitude of change elicited by the training, which was far less than the inter-individual variation in these variables within a population. As an example, the ranges of isometric torque and CSAPROX measured at pre-training were 297.1 N⋅m and 63.4 cm2, respectively, whilst the ranges of the changes in these variables were only 92.6 N⋅m and 8.8 cm2 after training (i.e., 31 and 14% of the variation measured pre-training). Thus, statistically, the variables that demonstrate a greater range of change may display stronger associations with the change in strength following training. This also ensures that the chance of observing strong relationships (R2 > 0.50) between the prediction models and the change in torque is substantially reduced.
Summary
In the present study, models incorporating the changes in anatomical and neuromuscular variables explained up to 41% of the variance in the change in torque following 10 weeks (20 sessions) of heavy strength training. These data clearly show the benefit of a modeling approach, since some variables that were poorly correlated in isolation were incorporated into the best models. Thus the interactions between variables is particularly important, and looking at variables in isolation may not lead to correct conclusions. However, even when models were used a large portion of variance remained unexplained. This may be caused by (a) measurement errors, which ensure that the full variance can never be explained by a model, (b) relatively small changes in the magnitude of variables reducing the likelihood of finding strong relationships (i.e., between-subject variability in a population is much larger than within-subject changes with training), and (c) other factors that were not measured (e.g., force transfer efficiency or inter-muscular coordination changes) impacting the changes in strength. Nonetheless, the data might also indicate that the adaptations responsible for strength change vary considerably between individuals, so the effect of any single variable, or combination of variables, on strength change may only be moderate. Hence, the identification of the variables to most strongly target using physical training programs may not be possible at the population level. Instead, identification of anatomical and physiological targets for change might need to be made for each individual prior to the implementation of training programs; a goal of future research is to determine whether these individualized targets can be identified using pre-training testing.
It is noteworthy that the combination of variables found to most influence the change in torque in the present study differed from the combinations that best predicted maximum torque in a cross-sectional analysis (Trezise et al., 2016). This implies that the variables most influencing between-subject variations in muscular strength are not the same as those influencing the within-subject change in strength with training; i.e., results of cross-sectional analyses should not be used to infer likely outcomes of longitudinal analyses. Based on the present data, muscle CSA (especially at the proximal, rather than mid-thigh, region), fascicle angle and muscle activation appear to explain the majority of the inter-individual variances in the change in strength following training due to their incorporation in a majority of the best-fit models. As muscle activation was the strongest predictor of concentric and eccentric knee extensor strength, strength training programs targeting improved muscle activation might generally elicit the greatest improvements in concentric and eccentric knee extensor strength early in a strength training program.
The focus of the present study was the strength and neuromuscular adaptations arising from 10 weeks (20 sessions) of heavy lower-limb strength training, as early stage strength change is an important factor influencing the whole to continue and training program, and is important in a rehabilitation context. Additional studies assessing differing loads, volumes, movement speeds and durations will further our understanding of the interactions between all these variables. Additionally, the results of the study are only applicable to young, healthy men. Future studies assessing different sample groups (i.e., strength trained, elderly, or clinical populations) may also identify different neuromuscular adaptations, and hence relationships, between strength change and anatomical and neuromuscular changes.
Ethics Statement
Prior to performing in the study, all subjects provided written informed consent and the experimental procedure was approved by the Edith Cowan University Human Research Ethics Committee and confirmed to the Declaration of Helsinki.
Author Contributions
JT and AB designed the research, wrote the manuscript, and approved the final manuscript for publication. JT conducted the data collection and analysis.
Funding
JT was funded by the Edith Cowan University Post-graduate Research Support Scholarship programme.
Conflict of Interest Statement
The authors declare that the research was conducted in the absence of any commercial or financial relationships that could be construed as a potential conflict of interest.
Acknowledgments
This manuscript has previously appeared in the JT’s thesis (Trezise, 2014).
References
Aagaard, P., Andersen, J. L., Dyhre-Poulsen, P., Leffers, A. M., Wagner, A., Magnusson, S. P., et al. (2001). A mechanism for increased contractile strength of human pennate muscle in response to strength training: changes in muscle architecture. J. Physiol. 534, 613–623. doi: 10.1111/j.1469-7793.2001.t01-1-00613.x
Aagaard, P., Simonsen, E. B., Andersen, J. L., Magnusson, P., and Dyhre-Poulsen, P. (2002). Neural adaptation to resistance training: changes in evoked V-wave and H-reflex responses. J. Appl. Physiol. 92, 2309–2318. doi: 10.1152/japplphysiol.01185.2001
Aagaard, P., Simonsen, E. B., Andersen, J. L., Magnusson, S. P., Bojsen-Møller, F., and Dyhre-Poulsen, P. (2000a). Antagonist muscle coactivation during isokinetic knee extension. Scand. J. Med. Sci. Sports 10, 58–67. doi: 10.1034/j.1600-0838.2000.010002058.x
Aagaard, P., Simonsen, E. B., Andersen, J. L., Magnusson, S. P., Halkjaer-Kristensen, J., and Dyhre-Poulsen, P. (2000b). Neural inhibition during maximal eccentric and concentric quadriceps contraction: effects of resistance training. J. Appl. Physiol. 89, 2249–2257. doi: 10.1152/jappl.2000.89.6.2249
Abe, T., Kumagai, K., and Brechue, W. F. (2000). Fascicle length of leg muscles is greater in sprinters than distance runners. Med. Sci. Sports Exerc. 32, 1125–1129. doi: 10.1097/00005768-200006000-00014
Ahtiainen, J. P., Pakarinen, A., Alen, M., Kraemer, W. J., and Häkkinen, K. (2003). Muscle hypertrophy, hormonal adaptations and strength development during strength training in strength-trained and untrained men. Eur. J. Appl. Physiol. 89, 555–563. doi: 10.1007/s00421-003-0833-3
Ahtiainen, J. P., Walker, S., Peltonen, H., Holviala, J., Sillanpää, E., Karavirta, L., et al. (2016). Heterogeneity in resistance training-induced muscle strength and mass responses in men and women of different ages. Age 38:10. doi: 10.1007/s11357-015-9870-1
Ainsworth, B. E., Haskell, W. L., Whitt, M. C., Irwin, M. L., Swartz, A. M., Strath, S. J., et al. (2000). Compendium of physical activities: an update of activity codes and MET intensities. Med. Sci. Sports Exerc. 32, S498–S504.
Akima, H., and Saito, A. (2013). Inverse activation between the deeper vastus intermedius and superficial muscles in the quadriceps during dynamic knee extensions. Muscle Nerve 47, 682–690. doi: 10.1002/mus.23647
Ando, R., Nosaka, K., Tomita, A., Watanabe, K., Blazevich, A. J., and Akima, H. (2018). Vastus intermedius vs vastus lateralis fascicle behaviors during maximal concentric and eccentric contractions. Scand. J. Med. Sci. Sports 28, 1018–1026. doi: 10.1111/sms.13022
Arnold, T. W. (2010). Uninformative parameters, and model selection using akaike’s information criterion. J. Wildlife Manag. 74, 1175–1178. doi: 10.1111/j.1937-2817.2010.tb01236.x
Azizi, E., Brainerd, E. L., and Roberts, T. J. (2008). Variable gearing in pennate muscles. Proc. Natl. Acad. Sci. U. S. A. 105, 1745–1750. doi: 10.1073/pnas.0709212105
Balshaw, T. G., Massey, G. J., Maden-Wilkinson, T. M., Morales-Artacho, A. J., McKeown, A., Appleby, C. L., et al. (2017). Changes in agonist neural drive, hypertrophy and pre-training strength all contribute to the individual strength gains after resistance training. Eur. J. Appl. Physiol. 117, 631–640. doi: 10.1007/s00421-017-3560-x
Behm, D. G., St-Pierre, D. M., and Perez, D. (1996). Muscle inactivation: assessment of interpolated twitch technique. J. Appl. Physiol. 81, 2267–2273. doi: 10.1152/jappl.1996.81.5.2267
Blazevich, A. J., Cannavan, D., Coleman, D. R., and Horne, S. (2007). Influence of concentric and eccentric resistance training on architectural adaptation in human quadriceps muscles. J. Appl. Physiol. 103, 1565–1575. doi: 10.1152/japplphysiol.00578.2007
Blazevich, A. J., Coleman, D. R., Horne, S., and Cannavan, D. (2009). Anatomical predictors of maximum isometric and concentric knee extensor moment. Eur. J. Appl. Physiol. 105, 869–878. doi: 10.1007/s00421-008-0972-977
Blazevich, A. J., Gill, N. D., Bronks, R., and Newton, R. U. (2003). Training-specific muscle architecture adaptation after 5-wk training in athletes. Med. Sci. Sports Exerc. 35, 2013–2022. doi: 10.1249/01.MSS.0000099092.83611.20
Blazevich, A. J., Gill, N. D., and Zhou, S. (2006). Intra- and intermuscular variation in human quadriceps femoris architecture assessed in vivo. J. Anat. 209, 289–310. doi: 10.1111/j.1469-7580.2006.00619.x
Blazevich, A. J., Horne, S., Cannavan, D., Coleman, D. R., and Aagaard, P. (2008). Effect of contraction mode of slow-speed resistance training on the maximum rate of force development in the human quadriceps. Muscle Nerve 38, 1133–1146. doi: 10.1002/mus.21021
Blazevich, A. J., and Sharp, N. C. C. (2005). Understanding muscle architectural adaptation: macro- and micro-level research. Cells Tissues Organs 181, 1–10. doi: 10.1159/000089964
Bloomquist, K., Langberg, H., Karlsen, S., Madsgaard, S., Boesen, M., and Raastad, T. (2013). Effect of range of motion in heavy load squatting on muscle and tendon adaptations. Eur. J. Appl. Physiol. 113, 2133–2142. doi: 10.1007/s00421-013-2642-7
Brainerd, E. L., and Azizi, E. (2005). Muscle fiber angle, segment bulging and architectural gear ratio in segmented musculature. J. Exp. Biol. 208, 3249–3261. doi: 10.1242/jeb.01770
Braith, R. W., Graves, J. E., Pollock, M. L., Leggett, S. L., Carpenter, D. M., and Colvin, A. B. (1989). Comparison of 2 vs 3 days/week of variable resistance training during 10- and 18-week programs. Int. J. Sports Med. 10, 450–454. doi: 10.1055/s-2007-1024942
Burnham, K. P., and Anderson, D. R. (2002). Model Selection and Multimodel Inference: A Practical Information-Theoretic Approach, 2nd Edn. New York, YK: Springer-Verlag.
Castro, M. J., McCann, D. J., Shaffrath, J. D., and Adams, W. C. (1995). Peak torque per unit cross-sectional area differs between strength-trained and untrained young adults. Med. Sci. Sports Exerc. 27, 397–403.
Del Balso, C., and Cafarelli, E. (2007). Adaptations in the activation of human skeletal muscle induced by short-term isometric resistance training. J. Appl. Physiol. 103, 402–411. doi: 10.1152/japplphysiol.00477.2006
Desbrosses, K., Babault, N., Scaglioni, G., Meyer, J.-P., and Pousson, M. (2006). Neural activation after maximal isometric contractions at different muscle lengths. Med. Sci. Sports Exerc. 38, 937–944. doi: 10.1249/01.mss.0000218136.58899.46
Ema, R., Wakahara, T., Miyamoto, N., Kanehisa, H., and Kawakami, Y. (2013). Inhomogeneous architectural changes of the quadriceps femoris induced by resistance training. Eur. J. Appl. Physiol. 113, 2691–2703. doi: 10.1007/s00421-013-2700-1
Erskine, R. M., Fletcher, G., and Folland, J. P. (2014). The contribution of muscle hypertrophy to strength changes following resistance training. Eur. J. Appl. Physiol. 114, 1239–1249. doi: 10.1007/s00421-014-2855-4
Erskine, R. M., Jones, D. A., Williams, A. G., Stewart, C. E., and Degens, H. (2010). Inter-individual variability in the adaptation of human muscle specific tension to progressive resistance training. Eur. J. Appl. Physiol. 110, 1117–1125. doi: 10.1007/s00421-010-1601-9
Farina, D., Merletti, R., and Enoka, R. M. (2004). The extraction of neural strategies from the surface EMG. J. Appl. Physiol. 96, 1486–1495. doi: 10.1152/japplphysiol.01070.2003
Fuglevand, A. J., Zackowski, K. M., Huey, K. A., and Enoka, R. M. (1993). Impairment of neuromuscular propagation during human fatiguing contractions at submaximal forces. J. Physiol. 460, 549–572. doi: 10.1113/jphysiol.1993.sp019486
Fukunaga, T., Miyatani, M., Tachi, M., Kouzaki, M., Kawakami, Y., and Kanehisa, H. (2001). Muscle volume is a major determinant of joint torque in humans. Acta Physiol. Scand. 172, 249–255. doi: 10.1046/j.1365-201x.2001.00867.x
Häkkinen, K., Alén, M., and Komi, P. V. (1985a). Changes in isometric force- and relaxation-time, electromyographic and muscle fibre characteristics of human skeletal muscle during strength training and detraining. Acta Physiol. Scand. 125, 573–585. doi: 10.1111/j.1748-1716.1985.tb07760.x
Häkkinen, K., Komi, P. V., and Alén, M. (1985b). Effect of explosive type strength training on isometric force- and relaxation-time, electromyographic and muscle fibre characteristics of leg extensor muscles. Acta Physiol. Scand. 125, 587–600. doi: 10.1111/j.1748-1716.1985.tb07759.x
Häkkinen, K., Pakarinen, A., and Kallinen, M. (1992). Neuromuscular adaptations and serum hormones in women during short-term intensive strength training. Eur. J. Appl. Physiol. Occup. Physiol. 64, 106–111. doi: 10.1007/bf00717946
Hermens, H. J., Freriks, B., Disselhorst-Klug, C., and Rau, G. (2000). Development of recommendations for SEMG sensors and sensor placement procedures. J. Electromyogr. Kinesiol. 10, 361–374. doi: 10.1016/s1050-6411(00)00027-4
Higbie, E. J., Cureton, K. J., Warren, G. L., and Prior, B. M. (1996). Effects of concentric and eccentric training on muscle strength, cross-sectional area, and neural activation. J. Appl. Physiol. 81, 2173–2181. doi: 10.1152/jappl.1996.81.5.2173
Hill, A. V. (1938). The heat of shortening and the dynamic constants of muscle. Proc. R. Soc. Lond. B 126, 136–195. doi: 10.1098/rspb.1938.0050
Hubal, M. J., Gordish-Dressman, H., Thompson, P. D., Price, T. B., Hoffman, E. P., Angelopoulos, T. J., et al. (2005). Variability in muscle size and strength gain after unilateral resistance training. Med. Sci. Sports Exerc. 37, 964–972.
Huijing, P. A. (2003). Muscular force transmission necessitates a multilevel integrative approach to the analysis of function of skeletal muscle. Exerc. Sport Sci. Rev. 31, 167–175. doi: 10.1097/00003677-200310000-00003
Ikegawa, S., Funato, K., Tsunoda, N., Kanehisa, H., Fukunaga, T., and Kawakami, Y. (2008). Muscle force per cross-sectional area is inversely related with pennation angle in strength trained athletes. J. Strength Cond Res. 22, 128–131. doi: 10.1519/JSC.0b013e31815f2fd3
Jones, D. A., and Rutherford, O. M. (1987). Human muscle strength training: the effects of three different regimens and the nature of the resultant changes. J. Physiol. 391, 1–11. doi: 10.1113/jphysiol.1987.sp016721
Kawakami, Y., Abe, T., and Fukunaga, T. (1993). Muscle-fiber pennation angles are greater in hypertrophied than in normal muscles. J. Appl. Physiol. 74, 2740–2744. doi: 10.1152/jappl.1993.74.6.2740
Kawakami, Y., Abe, T., Kuno, S. Y., and Fukunaga, T. (1995). Training-induced changes in muscle architecture and specific tension. Eur. J. Appl. Physiol. Occup. Physiol. 72, 37–43. doi: 10.1007/bf00964112
Kellis, E., and Baltzopoulos, V. (1998). Muscle activation differences between eccentric and concentric isokinetic exercise. Med. Sci. Sports Exerc. 30, 1616–1623. doi: 10.1097/00005768-199811000-00010
Kraemer, W. J., and Ratamess, N. A. (2004). Fundamentals of resistance training: progression and exercise prescription. Med. Sci. Sports Exerc. 36, 674–688. doi: 10.1249/01.mss.0000121945.36635.61
Lieber, R. L., and Fridén, J. (2001). Clinical significance of skeletal muscle architecture. Clin. Orthop. Relat. Res. 383, 140–151. doi: 10.1097/00003086-200102000-00016
Maffiuletti, N. A., and Lepers, R. (2003). Quadriceps femoris torque and EMG activity in seated versus supine position. Med. Sci. Sports Exerc. 35, 1511–1516. doi: 10.1249/01.MSS.0000084426.03247.93
Maganaris, C. N., Baltzopoulos, V., and Sargeant, A. J. (1998). Changes in Achilles tendon moment arm from rest to maximum isometric plantarflexion: in vivo observations in man. J. Physiol. 510(Pt 3), 977–985. doi: 10.1111/j.1469-7793.1998.977bj.x
Maughan, R. J., Watson, J. S., and Weir, J. (1983). Strength and cross-sectional area of human skeletal muscle. J. Physiol. 338, 37–49. doi: 10.1113/jphysiol.1983.sp014658
Millet, G. Y., Martin, V., Lattier, G., and Ballay, Y. (2003). Mechanisms contributing to knee extensor strength loss after prolonged running exercise. J. Appl. Physiol. 94, 193–198. doi: 10.1152/japplphysiol.00600.2002
Moss, B. M., Refsnes, P. E., Abildgaard, A., Nicolaysen, K., and Jensen, J. (1997). Effects of maximal effort strength training with different loads on dynamic strength, cross-sectional area, load-power and load-velocity relationships. Eur. J. Appl. Physiol. Occup. Physiol. 75, 193–199. doi: 10.1007/s004210050147
Narici, M. V., Hoppeler, H., Kayser, B., Landoni, L., Claassen, H., Gavardi, C., et al. (1996). Human quadriceps cross-sectional area, torque and neural activation during 6 months strength training. Acta Physiol. Scand. 157, 175–186. doi: 10.1046/j.1365-201X.1996.483230000.x
Narici, M. V., Landoni, L., and Minetti, A. E. (1992). Assessment of human knee extensor muscles stress from in vivo physiological cross-sectional area and strength measurements. Eur. J. Appl. Physiol. Occup. Physiol. 65, 438–444. doi: 10.1007/bf00243511
Narici, M. V., Roi, G. S., Landoni, L., Minetti, A. E., and Cerretelli, P. (1989). Changes in force, cross-sectional area and neural activation during strength training and detraining of the human quadriceps. Eur. J. Appl. Physiol. Occup. Physiol. 59, 310–319. doi: 10.1007/bf02388334
Noorkoiv, M., Nosaka, K., and Blazevich, A. J. (2010a). Assessment of quadriceps muscle cross-sectional area by ultrasound extended-field-of-view imaging. Eur. J. Appl. Physiol. 109, 631–639. doi: 10.1007/s00421-010-1402-1
Noorkoiv, M., Stavnsbo, A., Aagaard, P., and Blazevich, A. J. (2010b). In vivo assessment of muscle fascicle length by extended field-of-view ultrasonography. J. Appl. Physiol. 109, 1974–1979. doi: 10.1152/japplphysiol.00657.2010
Noorkõiv, M., Nosaka, K., and Blazevich, A. J. (2014). Neuromuscular adaptations associated with knee joint angle-specific force change. Med. Sci. Sports Exerc. 46, 1525–1537. doi: 10.1249/MSS.0000000000000269
Otten, E. (1988). Concepts and models of functional architecture in skeletal muscle. Exerc. Sport Sci. Rev. 16, 89–137.
Pearson, S. J., and Onambele, G. N. L. (2006). Influence of time of day on tendon compliance and estimations of voluntary activation levels. Muscle Nerve 33, 792–800. doi: 10.1002/mus.20529
Phillips, S. M. (2004). Protein requirements and supplementation in strength sports. Nutrition 20, 689–695. doi: 10.1016/j.nut.2004.04.009
R Core Team (2013). R: A Language and Environment for Statistical Computing Vienna: R Foundation for Statistical Computing. Available at: http://www.R-project.org/
Reeves, N. D., Narici, M. V., and Maganaris, C. N. (2004). In vivo human muscle structure and function: adaptations to resistance training in old age. Exp. Physiol. 89, 675–689. doi: 10.1113/expphysiol.2004.027797
Rutherford, O. M., and Jones, D. A. (1986). The role of learning and coordination in strength training. Eur. J. Appl. Physiol. Occup. Physiol. 55, 100–105. doi: 10.1007/bf00422902
Sacks, R. D., and Roy, R. R. (1982). Architecture of the hind limb muscles of cats: functional significance. J. Morphol. 173, 185–195. doi: 10.1002/jmor.1051730206
Schantz, P., Randall-Fox, E., Hutchison, W., Tydén, A., and Astrand, P. O. (1983). Muscle fibre type distribution, muscle cross-sectional area and maximal voluntary strength in humans. Acta Physiol. Scand. 117, 219–226. doi: 10.1111/j.1748-1716.1983.tb07200.x
Seynnes, O. R., de Boer, M., and Narici, M. V. (2007). Early skeletal muscle hypertrophy and architectural changes in response to high-intensity resistance training. J. Appl. Physiol. 102, 368–373. doi: 10.1152/japplphysiol.00789.2006
Smith, N. C., Payne, R. C., Jespers, K. J., and Wilson, A. M. (2007). Muscle moment arms of pelvic limb muscles of the ostrich (Struthio camelus). J. Anat. 211, 313–324. doi: 10.1111/j.1469-7580.2007.00762.x
Stragier, S., Baudry, S., Poortmans, J., Duchateau, J., and Carpentier, A. (2016). Leucine-enriched protein supplementation does not influence neuromuscular adaptations in response to a 6-month strength training programme in older adults. Exp. Gerontol. 82, 58–66. doi: 10.1016/j.exger.2016.06.002
Taylor, J. L. (2009). Point: the interpolated twitch does/does not provide a valid measure of the voluntary activation of muscle. J. Appl. Physiol. 107, 354–355. doi: 10.1152/japplphysiol.91220.2008
Trezise, J. (2014). Relative Importance and Plasticity of Anatomical and Neuromuscular Factors Affecting Joint Torque Production. Doctorates and Masters Thesis, Perth, WA.
Trezise, J., Collier, N., and Blazevich, A. J. (2016). Anatomical and neuromuscular variables strongly predict maximum knee extension torque in healthy men. Eur. J. Appl. Physiol. 116, 1159–1177. doi: 10.1007/s00421-016-3352-8
Tsaopoulos, D. E., Baltzopoulos, V., and Maganaris, C. N. (2006). Human patellar tendon moment arm length: measurement considerations and clinical implications for joint loading assessment. Clin. Biomech. 21, 657–667. doi: 10.1016/j.clinbiomech.2006.02.009
Tsaopoulos, D. E., Baltzopoulos, V., Richards, P. J., and Maganaris, C. N. (2009). A comparison of different two-dimensional approaches for the determination of the patellar tendon moment arm length. Eur. J. Appl. Physiol. 105, 809–814. doi: 10.1007/s00421-008-0968-3
Wagenmakers, E.-J., and Farrell, S. (2004). AIC model selection using Akaike weights. Psychon. Bull. Rev. 11, 192–196. doi: 10.3758/BF03206482
Watanabe, K., and Akima, H. (2011). Validity of surface electromyography for vastus intermedius muscle assessed by needle electromyography. J. Neurosci. Methods 198, 332–335. doi: 10.1016/j.jneumeth.2011.03.014
Keywords: strength training, linear models, cross-sectional area, fascicle angle, muscle activity
Citation: Trezise J and Blazevich AJ (2019) Anatomical and Neuromuscular Determinants of Strength Change in Previously Untrained Men Following Heavy Strength Training. Front. Physiol. 10:1001. doi: 10.3389/fphys.2019.01001
Received: 22 November 2018; Accepted: 18 July 2019;
Published: 06 August 2019.
Edited by:
Marco Aurelio Vaz, Federal University of Rio Grande do Sul, BrazilReviewed by:
Jonathan Peter Farthing, University of Saskatchewan, CanadaBrad Schoenfeld, Lehman College, United States
Copyright © 2019 Trezise and Blazevich. This is an open-access article distributed under the terms of the Creative Commons Attribution License (CC BY). The use, distribution or reproduction in other forums is permitted, provided the original author(s) and the copyright owner(s) are credited and that the original publication in this journal is cited, in accordance with accepted academic practice. No use, distribution or reproduction is permitted which does not comply with these terms.
*Correspondence: J. Trezise, joanne@wingsappliedsportscience.com