 Zhe Zhang
 Xiaoran Li
 Hongzan Sun
- Department of Radiology, Shengjing Hospital of China Medical University, Shenyang, China
Objectives: We aimed to establish machine learning models based on texture analysis predicting pelvic lymph node metastasis (PLNM) and expression of cyclooxygenase-2 (COX-2) in cervical cancer with PET/CT negative pelvic lymph node (PLN).
Methods: Eight hundred and thirty-seven texture features were extracted from PET/CT images of 148 early-stage cervical cancer patients with negative PLN. The machine learning models were established by logistic regression from selected features and evaluated by the area under the curve (AUC). The correlation of selected PET/CT texture features predicting PLNM or COX-2 expression and the corresponding immunohistochemical (IHC) texture features was analyzed by the Spearman test.
Results: Fourteen texture features were reserved to calculate the Rad-score for PLNM and COX-2. The PLNM model predicting PLNM showed good prediction accuracy in the training and testing dataset (AUC = 0.817, p < 0.001; AUC = 0.786, p < 0.001, respectively). The COX-2 model also behaved well for predicting COX-2 expression levels in the training and testing dataset (AUC = 0.814, p < 0.001; AUC = 0.748, p = 0.001). The wavelet-LHH-GLCM ClusterShade of the PET image selected to predict PLNM was slightly correlated with the corresponding feature of the IHC image (r = −0.165, p < 0.05). There was a weak correlation of wavelet-LLL-GLRLM LongRunEmphasis of the PET image selected to predict COX-2 correlated with the corresponding feature of the IHC image (r = 0.238, p < 0.05). The correlation between PET image selected to predict COX-2 and the corresponding feature of the IHC image based on wavelet-LLL-GLRLM LongRunEmphasis is considered weak positive (r = 0.238, p=<0.05).
Conclusion: This study underlined the significant application of the machine learning models based on PET/CT texture analysis for predicting PLNM and COX-2 expression, which could be a novel tool to assist the clinical management of cervical cancer with negative PLN on PET/CT images.
Introduction
Cervical cancer is the fourth most prevalent cancer and the fourth leading cause of female cancer, with more than 6,00,000 incidences and 3,00,000 death cases reported in 2020 (Sung et al., 2021). The most commonly used clinical treatments are radical hysterectomy with pelvic lymph node dissection. However, the prognosis of post-operative patients varied significantly due to tumor heterogeneity (Bhatla et al., 2021). Several studies have indicated the most relevant prognostic factor in early cervical cancer is pelvic lymph node metastasis (PLNM) (Rudtanasudjatum et al., 2011; Horn et al., 2014; Zyla et al., 2020; Federico et al., 2022; Wenzel et al., 2022). Kulisara et al. have proved that patients with lymph node metastasis (LNM) had poorer 5-year overall survival than the patients without LNM (p < 0.05) (Nanthamongkolkul and Hanprasertpong, 2018). In addition, lymphadenectomy may increase the probability of some complications including lower limb lymphedema, ileus, and chylous ascites (Yost et al., 2014; Kuroda et al., 2017; Nica et al., 2020; Umbreit et al., 2020). The accuracy of predicting LNM in cervical cancer patients is crucial for treatment decision-making.
Previous studies have indicated that PET/CT could be used for the evaluation of LNM as a preoperative imaging test, which is of vital importance for clinical strategies and individualized treatment (Sironi et al., 2006; Lv et al., 2014; Fasmer et al., 2020). Nevertheless, these studies usually used lymph node metabolism and diameter to assess LNM. Few studies have evaluated the metastasis of PLN with slightly higher FDG metabolism and diameter less than 1 cm on PET images which has limitations in detecting micrometastasis. Radiomics is rapidly gaining momentum and this technique is characterized by quantifying tumor heterogeneity through extraction of computational features using advanced computational algorithms. Texture parameters of radiomics features of PET images and IHC pathomic features could potentially be adopted to predict the PLNM for strategy choice of cervical cancer patients.
Substantial evidence suggests that cyclooxygenase-2 (COX-2), a key protein in prostaglandin metabolism, has a critical role in PLNM in cervical cancer (Ryu et al., 2000; Hoellen et al., 2016). Previous studies have indicated elevated COX-2 was strongly related to LNM in stage IB cervical cancer (Kang et al., 2006), the high COX expression has been revealed positive correlation with malignancy in the parametrial tumor tissue or LNM (Ryu et al., 2000). Other studies also found that high-level expression of COX-2 was correlated with a poorer prognosis, recurrence, low sensitivity of nedaplatin, and radiosensitivity (Kim et al., 2003; Chen et al., 2005; Ishikawa et al., 2006; Manchana et al., 2006; Jo et al., 2007; Huang et al., 2013; Stasinopoulos et al., 2013; Kato et al., 2015). In neoplasia, COX-2 stimulates cell proliferation which promotes angiogenesis through pathways involving an increase in VEGF production (Huang et al., 2013; Xu et al., 2014). It has been suggested that COX-2 expression may enhance LNM after the onset of lymphovascular space invasion (Khunamornpong et al., 2009; Hoellen et al., 2016). The heterogenic 18F-FDG uptake was strongly related to the histopathological appearance in the tumor region. 18F-FDG heterogenic uptake within the tumor was correlated with the heterogeneity of tumor histopathological tissues (Zhao et al., 2005; Henriksson et al., 2007). IHC assay demonstrated that tumor angiogenesis and cancer cell proliferation were significantly related to the enhancement of tumor heterogeneity. Therefore, the high expression of COX-2 played a connecting role between the increase of tumor heterogeneity and PLNM (Liu et al., 2011).
Based on texture parameters of radiomics features of PET images, the global and local-regional heterogeneities of 18F-FDG distribution could be potentially assessed. Moreover, some mathematical methods were obtained to describe the relationships between their position in PET images and the gray-level intensity of pixels or voxels (Chicklore et al., 2013; O’Connor, 2017). In this study, we hypothesized that the overexpression of COX-2 promoted the increase of tumor heterogeneity and then caused the change of texture features of radiomics derived from IHC and PET/CT imaging. The texture features of the primary tumor lesion may be correlated with PLNM in patients with early-stage cervical cancer. Therefore, we aimed to establish machine learning models of texture analysis that could predict PLNM and COX-2 expression based on PET/CT imaging to assist the clinical management of PLNM therapy in cervical cancer with PET/CT negative PLN.
Materials and methods
Radiomics workflow
The study flowchart and radiomics workflow are shown in Figure 1 and includes the collection and exclusion of patients, image acquisition, ROI segmentation, feature extraction and selection, establishment and evaluation of machine learning models, and correlation analysis between PET and IHC images with the same texture features.
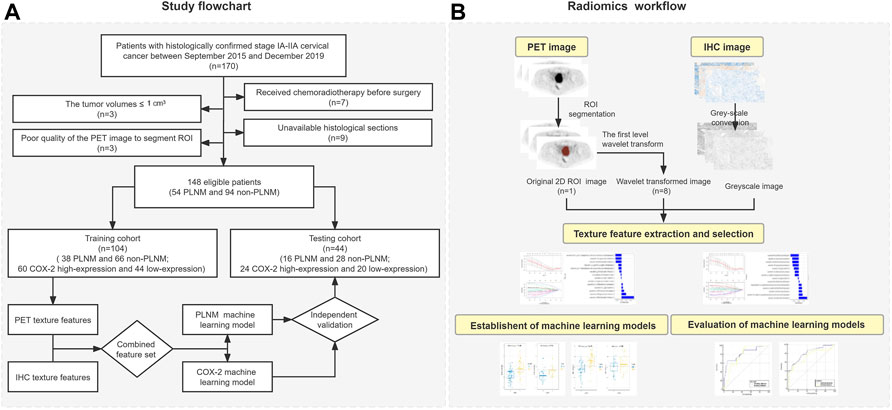
FIGURE 1. Study flowchart and radiomics workflow. (A) Study flowchart. (B) Radiomics workflow.
Patients
This retrospective study consisted of 170 patients with histologically confirmed stage IA-IIA cervical cancer who underwent radical hysterectomy with pelvic node dissection between September 2015 and December 2019 in Shengjing Hospital of China Medical University. All patients underwent 18F-FDG PET/CT scan within 1 week before treatment. The Hospital Institutional Review Board approved this study and informed consents were nor required due to retrospective nature. Inclusion criteria for cases: (Sung et al., 2021) Cervical squamous cell carcinoma confirmed by pathology and lymph node dissection performed in the patient; (Bhatla et al., 2021) Ia-IIa stage identified by 2021 Federation of Gynecology and Obstetrics (FIGO) staging (Bhatla et al., 2021); (Horn et al., 2014) The SUVmax of PLNM was less than 2.5 and the diameter was less than 1 cm; (Zyla et al., 2020) Normal serum glucose level before PET/CT scanning; (Rudtanasudjatum et al., 2011) No other tumor or metabolic disease. A total of twenty-two patients were excluded from the sample. Seven of them were excluded because they had received chemoradiotherapy before surgery. Nine histological sections could not be obtained. The tumor volumes of three patients were less than 1 cm3 to be unable to extract texture parameters. The PET image quality of the three cases was too bad to segment regions of interest (ROI). Eventually, 148 cases (54 PLNM and 94 non-PLNM) were enrolled in the study and randomly divided into a training dataset and a testing dataset according to the 7:3 ratio.
18F-FDG PET/CT technique
The patients were all performed with the PET-CT (Discovery PET/CT 690; GE Healthcare, Chicago, Illinois, United States) and received an injection of 3.7 MBq/kg 18F-FDG intravenous. The CT parameters were 3.27 mm slice thickness, 120 kV tube voltage, and 30–210 Ma. Then, with a three-dimensional acquisition mode and a matrix size of 192 × 192, PET data were captured at a speed of 1.5 min/bed (total of seven to eight beds). Using an iterative reconstruction algorithm of order subset expectation maximization, the PET image was reconstructed with twice iteration, 24 subsets and 6.4 mm Gaussian filter. In the AW4.5 workstation (GE Healthcare), and all PET images were transferred. The conventional metabolic parameters of tumors in 18F-FDG PET images for all patients consisted of total pathological glycolysis (TLG), the metabolic tumor volume (MTV), SUVmax, SUVpeak, and SUVmean. SUV corrected for body weight and was measured automatically using a threshold of 42% SUVmax from the ROIs.
Immunohistochemical analysis
Department of Pathology in our hospital prepared all paraffin sections for cervical cancer. IHC staining was performed by Leica BOND MAX™ (Leica Biosystems). Goat anti-human COX-2 (1:400 dilution) polyclonal primary antibodies (Abcam) were used to incubate these sections, following species-appropriate secondary antibodies and the standard procedures were performed as in the previous report (Li et al., 2021a). Tumor sections were scanned using the Pannoramic MIDI slice scanner (3DHISTECH Ltd.) forming a digital image (×400) and analyzed by QuantCenter software with the Pannoramic viewer. The whole images were scanned by the DensitoQuant software and the analysis procedure was performed as in previous reports (Yeo et al., 2015; Li et al., 2021b). The immunoreactive scoring system (IRS) was utilized to assess the expression level of COX-2 (Kim et al., 2008). The IRS was derived from the addition of staining intensity (scored on a 0–3 scale: 0, negative; 1, weakly positive; 2, moderately positive; and 3, strongly positive) and staining extent (scored on a 0–4 scale: 0, no staining; 1, 1%–25% positive 2, 26%–50% positive; 3, 51%–75% positive; and 4, 76%–100% positive tumor cells). The level of COX-2 expression was classified as a dichotomous variable for high (IRS, 4–7) or low (IRS, 0–3) expression.
Extracting texture features of PET and immunohistochemical images
All PET images were loaded to 3D slicer (https://www.slicer.org) software 4.10.2 version. Two nuclear medicine physicians manually segmented independently the largest slice of all tumors in PET images to form 2D ROI, blinded to patient clinical information. Then, the texture features of ROI in PET images were extracted by the pyradiomics package (van Griethuysen JJMFedorov et al., 2017). The resampled voxel size was set to 1 mm × 1 mm × 1 mm to be isotropic of the image. The discretization of the grayscale was set to 25 bin width. The PET original images were transformed into eight images by the first level wavelet transform. Then the texture features were extracted from ROI based on PET original images and wavelet transformed images.
A pathologist randomly captured the cancer tissue area of the cervix on the digital IHC image (×20). The captured images that were native red/green/blue (RGB) images were converted to greyscale before computing the texture features (Kather et al., 2016). Then the same texture features as PET images were extracted with 3D slicer.
Dimensionality reduction of texture features
All texture feature parameters were standardized using the Z-score method. In the training dataset, with 10-fold cross-validation, the least absolute shrinkage and selection operator (LASSO) algorithm was used to filter clinical features, the conventional metabolic parameters, and texture features derived from PET images that could be used to predict PLNM and COX-2 expression. A classical metabolic parameter was generated using a linear combination of selected texture features of PET images of non-zero coefficient after dimensionality reduction. Afterward, both of them were weighted by their respective coefficients to establish the radiomics score (Rad-score) (Huang et al., 2016). The Rad-score was utilized to construct machine learning models to prognosticate PLNM and COX-2 expression.
Establishing and testing machine learning model
The Rad-score (PLNM) in the training dataset was utilized to establish the PLNM model for predicting PLNM with logistic regression algorithm. And the Rad-score (COX-2) was the parameter for establishing the COX-2 model. The PLNM and COX-2 models in the testing dataset were tested independently.
Statistical analysis
The Mann-Whitney U test (continuous variables) or the Pearson chi-square test (rank variables) was used to evaluate the distribution of the clinical feature between the training and testing dataset. The correlation of selected PET texture features and the corresponding IHC texture images was analyzed with the Spearman correlation method. The differences in Rad-score (PLNM) between the PLNM group and non-PLNM group in all datasets and Rad-score (COX-2) between the COX-2 high expression group and COX-2 low expression group were analyzed with the Wilcoxon test. To evaluate the results of PLNM and COX-2 models, the ROC curve was used. All data processing, establishing machine learning models, and statistical analysis were performed with R software version 3.5.1 or SPSS software version 25.0 (IBM Corp., Armonk, NY, United States). A two-tailed p < 0.05 was considered statistically significant in all statistical analysis.
Results
The distribution of clinical characteristics of patients
The basic clinical characteristics of patients were summarized in Table 1. With a median age of 51 years, 104 patients were randomly assigned to the training dataset, containing 38 patients with PLNM. COX-2 was highly expressed in 60 patients in the training dataset. There were 44 patients with a median age of 53 years old in the testing dataset. Sixteen of them were PLNM positive. In the testing dataset, there were 24 patients with COX-2 high expression. Statistical analysis showed that there was no statistically significant difference in the distribution of all clinical features between the training and the testing dataset (p > 0.05).
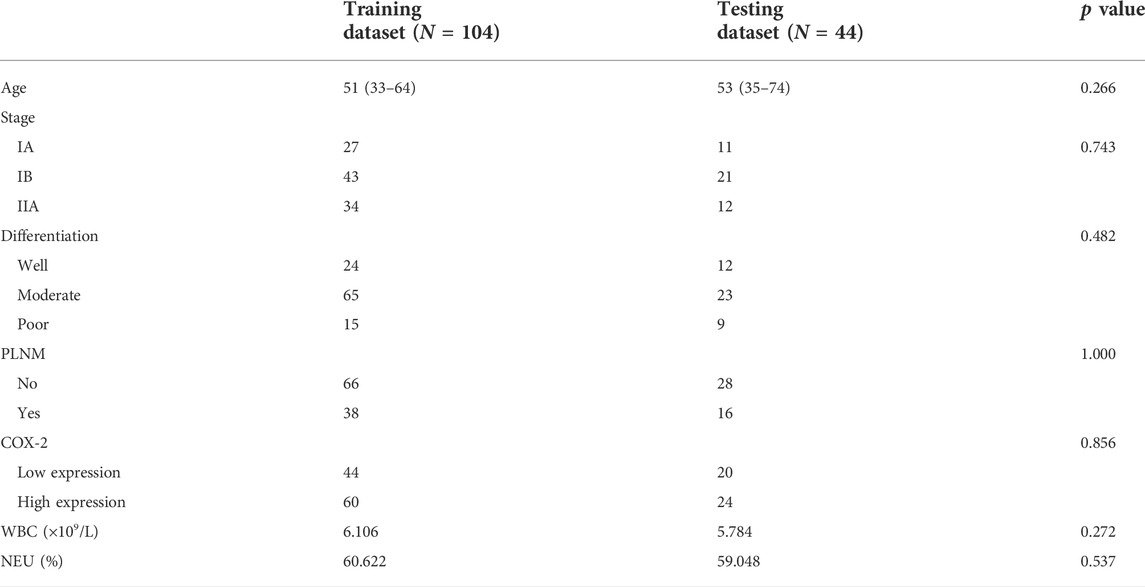
TABLE 1. Patient characteristics.
Filtering and integration of features
A total of 837 texture features were extracted from the ROI in the PET image, including the First Order Features (n = 18), Gray Level Co-occurrence Matrix (GLCM) Features (n = 24), Gray Level Size Zone Matrix (GLSZM) Features (n = 16), Gray Level Run Length Matrix (GLRLM) Features (n = 16), Neigbouring Gray Tone Difference Matrix (NGTDM) Features (n = 5), Gray Level Dependence Matrix (GLDM) Features (n = 14) and Wavelet Features derived from one level of Wavelet decomposistions yielding eight derived images (n = 93*8). The detailed texture feature parameters of PET images were shown in Figure 2. The same 837 texture features were extracted based on the IHC images.
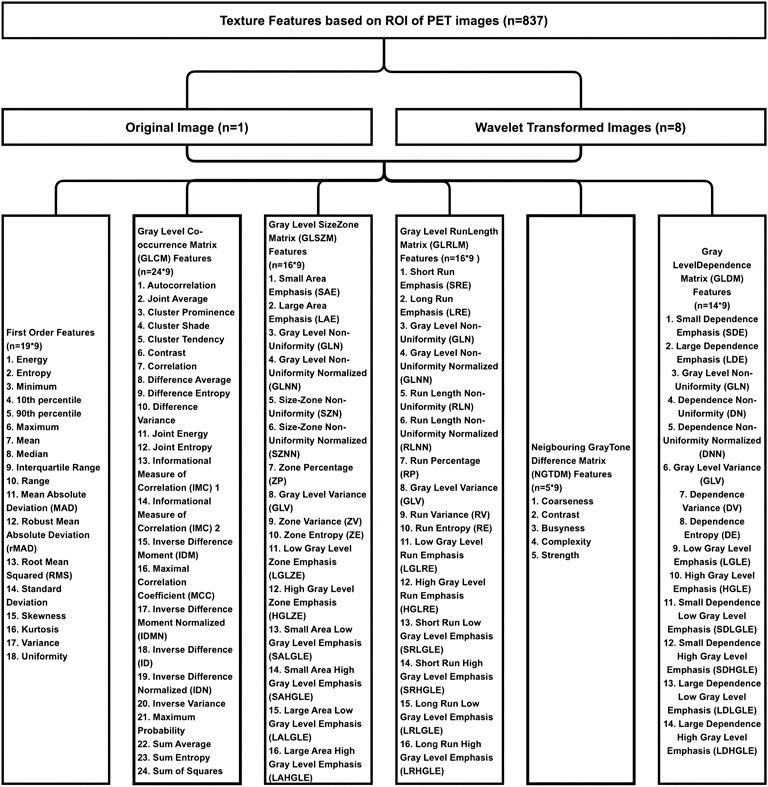
FIGURE 2. The result of extracting texture feature parameters of PET images. Eight hundred and thirty-seven texture features were extracted from the ROI in the PET image, including the first order features (n = 18), gray level co-occurrence matrix (GLCM) features (n = 24), gray level size zone matrix (GLSZM) features (n = 16), gray level run length matrix (GLRLM) features (n = 16), neigbouring gray tone difference matrix (NGTDM) features (n = 5), gray level dependence matrix (GLDM) features (n = 14), and wavelet features derived from one level of wavelet decomposistions yielding eight derived images (n = 93*8).
All clinical features, conventional metabolic parameters, and texture features derived from PET images were selected to predict PLNM. When Lambda was 0.027 in predicting PLNM with the LASSO algorithm, the 14 most informative features were reserved in the training dataset (Figure 3). And minimal binomial deviation for predicting PLNM was acquired with the 14 reserved features. Figure 4 showed that the coefficients of the reserved texture feature were used to predict PLNM with logistic regression algorithm. Partial regression coefficients were negative for nine of the reserved features and positive for five of the features. Then the reserved features were multiplied by their partial regression coefficients and linearly integrated into Rad-score (PLNM). The Rad-score (PLNM) was used to establish the PLNM model with logistic regression algorithm.
Rad-score (PLNM) = − 0.038 * wavelet-LLH-GLCM MCC
−0.177 * wavelet-LLL-GLRLM LongRunEmphasis
+0.076 * wavelet-HLL-GLCM MCC
−0.334 * wavelet-HHL-GLDM LargeDependenceLowGrayLevelEmphasis
+0.671 * wavelet-LHH-Firstorder Median
−0.311 * wavelet-HLH-Firstorder Median
+0.133 * wavelet-LLH-Firstorder Kurtosis
−0.327 * wavelet-LHL-GLCM Correlation
−0.048 * original-GLCM ClusterShade
+0.242 * wavelet-LHH-GLCM Correlation
−0.121 * wavelet-LLH-Firstorder Median
+0.069 * wavelet-HLH-Firstorder Skewness
−0.158 * original-GLDM LargeDependenceLowGrayLevelEmphasis
−0.004 * wavelet-LHH-GLCM ClusterShade − 0.641.
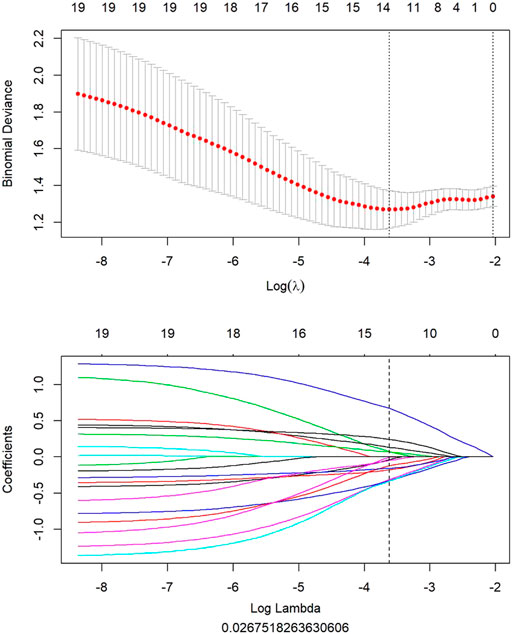
FIGURE 3. All features of PET image selected to predict PLNM by LASSO algorithm. When lambda was 0.027 in predicting PLNM with the LASSO algorithm, 14 most informative features were reserved to predict PLNM in the training dataset.
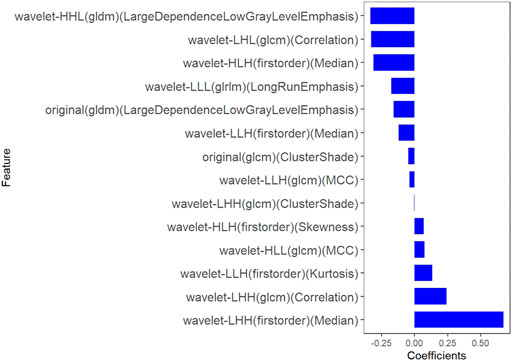
FIGURE 4. The coefficients histogram of texture features was selected to predict PLNM. Using the LASSO model, 14 corresponding texture features were selected to predict PLNM.
Fourteen features were selected to predict COX-2 by LASSO 10-fold cross-validation in the training dataset (Figure 5). The histogram showed the coefficients of the reserved features in Figure 6. Partial regression coefficients were negative for eight of the reserved features and positive for six of the features. Rad-score (COX-2) was integrated according to the calculation formula below. The Rad-score (COX-2) was used to establish the COX-2 model with logistic regression algorithm.
Rad-score (COX-2) = − 0.044 * wavelet-LLH-GLCM MCC
−0.326 * wavelet-LLH-GLCM Correlation
−0.245 * wavelet-LHL-GLCM MCC
+0.165 * wavelet-LLL-GLRLM ShortRunEmphasis
+0.144 * original-GLDM LargeDependenceLowGrayLevelEmphasis
+0.198 * wavelet-HLL-GLDM LargeDependenceLowGrayLevelEmphasis
−0.206 * wavelet-LHL-Firstorder Kurtosis
+0.17 * wavelet-HLH-Firstorder Mean
+0.042 * wavelet-HLH-Firstorder Median
−0.31 * wavelet-HHL-GLCM Correlation
−0.205 * wavelet-LLH-GLDM DependenceVariance
−0.324 * wavelet-HLH-Firstorder Skewness
+0.427 * wavelet-LHH-GLCM Correlation
−0.415 * wavelet-HHL-Firstorder Median + 0.324.
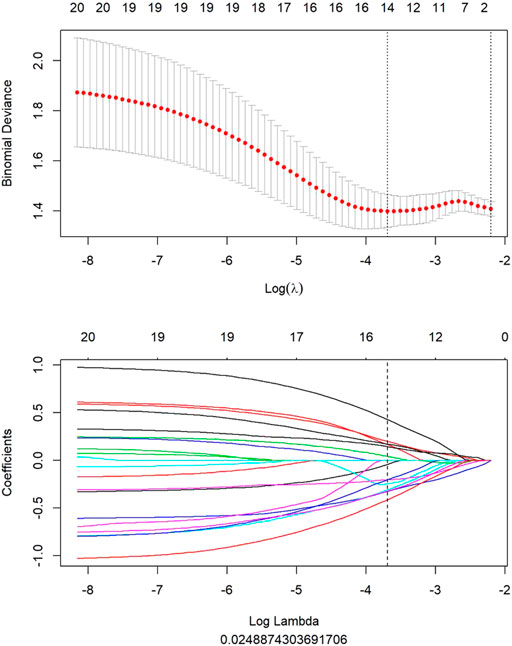
FIGURE 5. All features of PET image selected to predict COX-2 by LASSO algorithm. When lambda was 0.025 in predicting PLNM with the LASSO algorithm, 14 most informative features were reserved to predict PLNM in the training dataset.
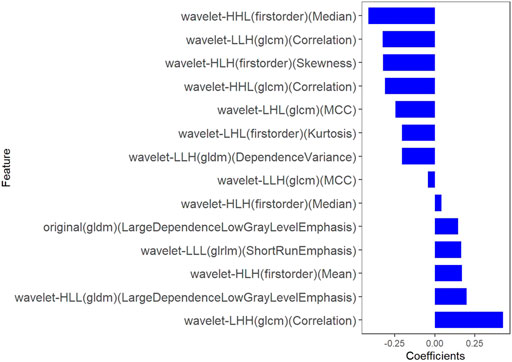
FIGURE 6. The coefficients histogram of texture features was selected to predict COX-2 expression. Using the LASSO model, 14 corresponding texture features were selected to predict COX-2 expression.
Distribution differences of rad-scores in all datasets
The Rad-score (PLNM) of patients with PLNM was higher than the Rad-score (PLNM) of patients with Non-PLNM in the training dataset and testing dataset (p < 0.001, p < 0.05, respectively) (Figure 7). And the Rad-score (COX-2) of patients with high expression of COX-2 was higher than that with low expression of COX-2 in the training dataset (p < 0.001). Whereas, in the testing dataset, there was no statistically significant difference in Rad-score (COX-2) between patients with high COX-2 expression and patients with low COX-2 expression (p < 0.05) (Figure 8).
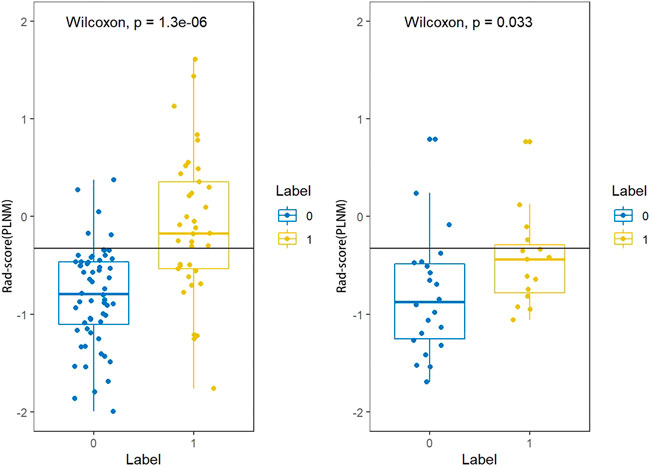
FIGURE 7. Rad-score (PLNM) distribution difference between PLNM negative subgroup and positive subgroup in the training dataset and testing dataset. The rad-score (PLNM) of patients with PLNM was higher than the rad-score (PLNM) of patients with non-PLNM in the training dataset and testing dataset (p < 0.001, p < 0.05, respectively).
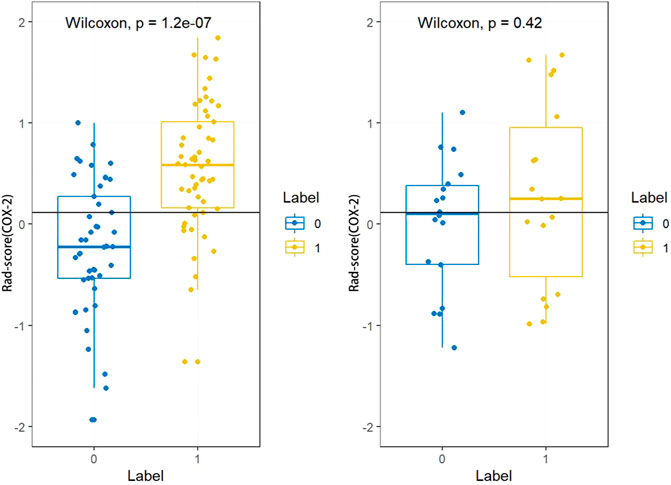
FIGURE 8. Rad-score (COX-2) distribution difference between COX-2 low expression subgroup and high expression subgroup in the training dataset and testing dataset. Rad-score (COX-2) of patients with high expression of COX-2 was higher than that with low expression of COX-2 in the training dataset (p < 0.001). In the testing dataset, there was no significant difference in Rad-score (COX-2) between patients with high COX-2 expression and patients with low COX-2 expression (p < 0.05).
Evaluation of machine learning models
The AUC value of the machine learning model was shown in Figure 9 which was aimed to predict PLNM was 0.817 (p < 0.001) in the training dataset, and 0.786 (p < 0.001) in the testing dataset. And the COX-2 model also behaved well for predicting COX-2 expression levels in the training and testing dataset (AUC = 0.814, p < 0.001; AUC = 0.748, p = 0.001) (Figure 10). The sensitivity (Sen) value of the PLNM model was 65.8% in the training dataset, and 100.0% in the testing dataset. The specificity (Spe) value of the COX-2 model was 72.7% in the training dataset, and 90.0% in the testing dataset (Table 2).
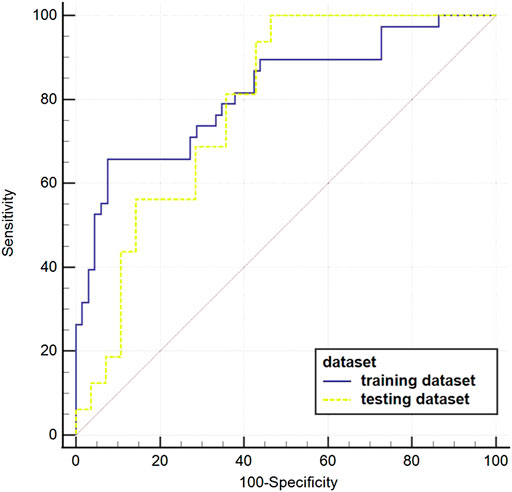
FIGURE 9. The ROC curves of the PLNM model in the training dataset and testing dataset. The blue ROC curve represents the training dataset; the yellow ROC curve represents the testing set. The AUC value of each model that was aimed to predict PLNM was 0.817 (p < 0.001) in the training dataset, and 0.786(p < 0.001) in the testing dataset.
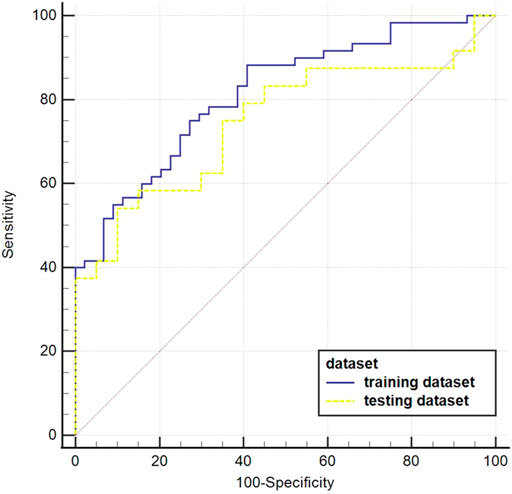
FIGURE 10. The ROC curves of the COX-2 model in the testing dataset. The blue ROC curve represents the training dataset, the yellow ROC curve represents the testing set. Both of them behaved well in predicting COX-2 expression levels in the training dataset and testing dataset (AUC = 0.814, p < 0.001; AUC = 0.748, p = 0.001, respectively).
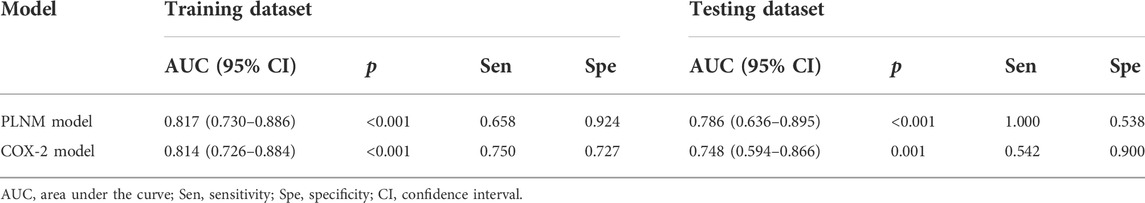
TABLE 2. Evaluation of machine learning model prediction in the training and testing dataset.
The correlation of texture features derived from PET image with same texture features of immunohistochemical image
Table 3 showed the correlation between the texture features derived from ROI in the PET image selected to predict PLNM and the same texture features of the IHC image by Spearman correlation analysis. Only the wavelet-LHH (glcm) (ClusterShade) derived from the PET image was slightly correlated with the same feature of the IHC image (r = −0.165, p < 0.05). The correlation of texture features of the PET image selected to predict the COX-2 expression level with the IHC image’s same texture features as illustrated in Table 4. There was a weak correlation that wavelet-LLL (glrlm) (LongRunEmphasis) derived from the ROI of the PET image correlated with the same feature of the IHC image (r = 0.238, p < 0.05).
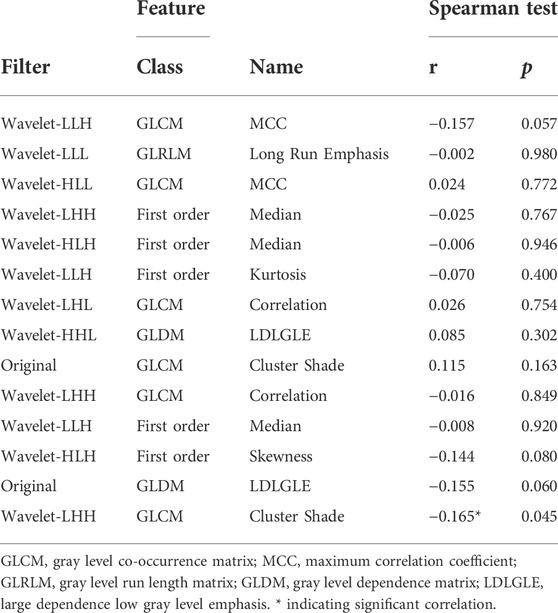
TABLE 3. Correlation of PET texture parameters selected to predict the PLNM with same texture parameters of IHC image.
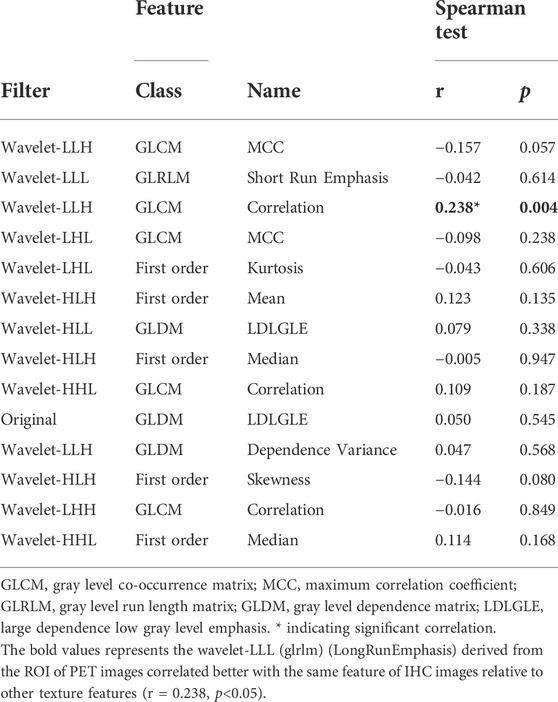
TABLE 4. Correlation of PET texture parameters selected to predict the COX-2 expression level with same texture parameters of IHC image.
Discussion
We provided machine learning models to study the diagnostic value of the textural features in PET images for predicting PLNM and performed well with good accuracy, sensitivity and specificity. Based on PET texture analysis predicting PLNM and COX-2 expression levels, this study revealed that machine learning models could assist clinical treatment of PLN in patients with early-stage cervical cancer. The rate of PLNM among patients with cervical squamous cell carcinoma stages IA-IIA was 36.54% in the training dataset and 36.36% in the testing dataset. The rate of COX-2 high expression among the patients was 57.69% in the training dataset and 54.55% in the testing dataset. The high expression of COX-2 were characteristics to predict PLNM associated with PET texture analysis and enriched level of COX-2 in the IHC images located in tumor, respectively. The Chi-square test or M-U analysis confirmed that the distribution of all clinical features was balanced between the training and testing dataset avoiding the inaccuracy and overfitting of the imbalanced feature distribution for building machine learning models.
The correlation between COX-2 high expression of primary tumor lesions and PLNM has been widely reported in cervical cancer (Ryu et al., 2000; Kim et al., 2003; Liu et al., 2011). The COX-2 model in this study performed well in the training and testing dataset (AUC = 0.814/0.748, p < 0.001/p = 0.001, respectively). And the specificity was 0.727 in the training dataset, and 0.900 in the testing dataset. The correlation feature of GLCM based on original and wavelet transformed images was also selected to calculate the Rad-score (COX-2). This indirectly confirmed that PET texture analysis of the primary tumor can predict that PLNM may be partly due to the high expression of COX-2. At present, the clinical evaluation of COX-2 mainly relies on IHC analysis, and the study ulitized PET/CT texture features for predicting COX-2 expression level before treatment is evaluated. We made a workflow based on the prediction of PLNM and COX-2 expression to assist the clinical management of PLN in early-stage cervical cancer (Figure 11). Kim et al. (2008) have confirmed that images with para-aortic lymph node recurrence possessed valuable expression of COX-2 attributes in cervical cancer across different patients. The prediction of the PLNM model was positive, the PLN dissection may be necessary whereas the prediction of the PLNM model was negative and the predicting COX-2 model was positive, COX-2 inhibitors were helpful for patients to control micrometastasis or recurrence of lymph nodes. Moreover, our results demonstrated the two of selected PET texture to predict PLNM and COX-2 expression that were slightly correlated with corresponding texture features from IHC images.
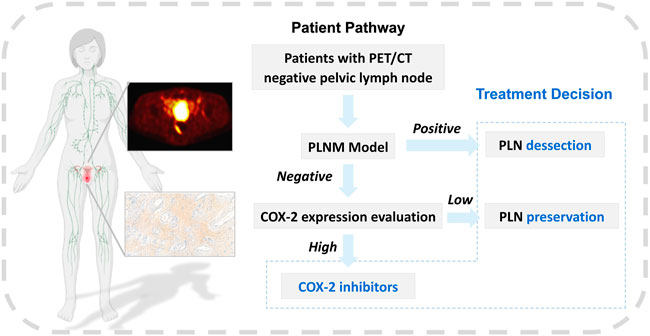
FIGURE 11. The workflow of machine learning models. The workflow of machine learning models in assisting clinical management of early-stage cervical cancer with negative PLN on PET/CT image.
There are several limitations in the current study. Firstly, it was retrospective and performed at a single institution based on a small sample size. Prospective multicenter studies on automatic image acquisition and reconstruction are required to improve the process. Secondly, although we chose 2D ROI to be consistent with the 2D IHC image feature extraction method, the cross-sections of the IHC images in this study may not correspond exactly to the cross-sections of PET/CT. Further clinical studies on large-scale data sets based on the 3D printing technology are needed to achieve more accurate matching of PET images and pathological images to fully address this question. Thirdly, further test-retest studies and more standardized workflow are needed to assess feature robustness of PLNM for better generalization.
Conclusion
In conclusion, combining PET/CT texture analysis to predict PLNM and COX-2 expression can improve the predictive ability of machine learning models for PLNM trends in PLN-negative patients. In addition, the correlation between the texture features of PET images and the corresponding texture features of IHC images provides a reasonable explanation that the texture features of the primary tumor on PET images can predict PLNM. Based on this machine learning model integrating PET/CT radiomic and IHC pathomic features, it is expected to provide guidance for the treatment strategy of negative pelvic lymph node cervical cancer in the near future.
Data availability statement
The raw data supporting the conclusion of this article will be made available by the authors, without undue reservation.
Ethics statement
The studies involving human participants were reviewed and approved by the Shengjing Hospital Ethics Committee.
Author contributions
ZZ: Conceptualization, methodology, investigation, formal analysis, data curation, writing—original draft; XL: Formal analysis, data curation, validation, writing—review and editing; HS: Conceptualization, funding acquisition, writing—review and editing, supervision. All authors contributed to the article and approved the submitted version.
Funding
This study has received funding by the National Natural Science Foundation of China (No. 82071967), Liaoning Science Natural Science Foundation (No. 2019-MS-373), Shenyang High Level Innovative Talents Support Program (No. RC210138) and 345 Talent Project (No. M0377).
Acknowledgments
We would like to express my gratitude to all those who helped us for this paper. Thanks to Xinghao Wang and Chen Xu for their contributions to the paper.
Conflict of interest
The authors declare that the research was conducted in the absence of any commercial or financial relationships that could be construed as a potential conflict of interest.
Publisher’s note
All claims expressed in this article are solely those of the authors and do not necessarily represent those of their affiliated organizations, or those of the publisher, the editors and the reviewers. Any product that may be evaluated in this article, or claim that may be made by its manufacturer, is not guaranteed or endorsed by the publisher.
Abbreviations
AUC, area under the curve; COX-2, cyclooxygenase-2; CT, computed tomography; FIGO, federation international of gynecology and obstetrics; GLCM, grey-level co-occurrence matrix; GLDM, gray level dependence matrix; GLRLM, gray level run length matrix; GLSZM, gray level size zone matrix; IHC, immunohistochemical; IRS, immunoreactive scoring system; LASSO, least absolute shrinkage and selection operator; LNM, lymph node metastasis; MTV, metabolic tumor volume; NGTDM, neigbouring gray tone difference matrix; PET, positron emission tomography; PLN, pelvic lymph node; PLNM, pelvic lymph node metastasis; Rad-score, radiomics score; ROC, receiver operating characteristic; ROI, region of interest; SUV, standardized uptake value; TLG, total pathological glycolysis; 18F-FDG, 18F-fluorodeoxyglucose.
References
Bhatla N., Aoki D., Sharma D. N., Sankaranarayanan R. (2021). Cancer of the cervix uteri: 2021 update. Int. J. Gynaecol. Obstet. 155 , 28–44. doi:10.1002/ijgo.13865
Chen H. H., Su W. C., Chou C. Y., Guo H. R., Ho S. Y., Que J., et al. (2005). Increased expression of nitric oxide synthase and cyclooxygenase-2 is associated with poor survival in cervical cancer treated with radiotherapy. Int. J. Radiat. Oncol. Biol. Phys. 63 (4), 1093–1100. doi:10.1016/j.ijrobp.2005.03.062
Chicklore S., Goh V., Siddique M., Roy A., Marsden P. K., Cook G. J. (2013). Quantifying tumour heterogeneity in 18f-fdg pet/ct imaging by texture analysis. Eur. J. Nucl. Med. Mol. Imaging 40 (1), 133–140. doi:10.1007/s00259-012-2247-0
Fasmer K. E., Gulati A., Dybvik J. A., Ytre-Hauge S., Salvesen O., Trovik J., et al. (2020). Preoperative 18f-fdg pet/ct tumor markers outperform mri-based markers for the prediction of lymph node metastases in primary endometrial cancer. Eur. Radiol. 30 (5), 2443–2453. doi:10.1007/s00330-019-06622-w
Federico A., Anchora L. P., Gallotta V., Fanfani F., Cosentino F., Turco L. C., et al. (2022). Clinical impact of pathologic residual tumor in locally advanced cervical cancer patients managed by chemoradiotherapy followed by radical surgery: A large, multicenter, retrospective study. Ann. Surg. Oncol. 29, 4806–4814. doi:10.1245/s10434-022-11583-4
Henriksson E., Kjellen E., Wahlberg P., Ohlsson T., Wennerberg J., Brun E. (2007). 2-Deoxy-2-[18f] fluoro-D-glucose uptake and correlation to intratumoral heterogeneity. Anticancer Res. 27 (4B), 2155–2159.
Hoellen F., Waldmann A., Banz-Jansen C., Rody A., Heide M., Koster F., et al. (2016). Expression of cyclooxygenase-2 in cervical cancer is associated with lymphovascular invasion. Oncol. Lett. 12 (4), 2351–2356. doi:10.3892/ol.2016.4925
Horn L. C., Bilek K., Fischer U., Einenkel J., Hentschel B. (2014). A cut-off value of 2 Cm in tumor size is of prognostic value in surgically treated figo stage ib cervical cancer. Gynecol. Oncol. 134 (1), 42–46. doi:10.1016/j.ygyno.2014.04.011
Huang M., Chen Q., Xiao J., Liu C., Zhao X. (2013). Prognostic significance of cyclooxygenase-2 in cervical cancer: A meta-analysis. Int. J. Cancer 132 (2), 363–373. doi:10.1002/ijc.27686
Huang Y., Liu Z., He L., Chen X., Pan D., Ma Z., et al. (2016). Radiomics signature: A potential biomarker for the prediction of disease-free survival in early-stage (I or ii) non-small cell lung cancer. Radiology 281 (3), 947–957. doi:10.1148/radiol.2016152234
Ishikawa H., Ohno T., Kato S., Wakatsuki M., Iwakawa M., Ohta T., et al. (2006). Cyclooxygenase-2 impairs treatment effects of radiotherapy for cervical cancer by inhibition of radiation-induced apoptosis. Int. J. Radiat. Oncol. Biol. Phys. 66 (5), 1347–1355. doi:10.1016/j.ijrobp.2006.07.007
Jo H., Kang S., Kim J. W., Kang G. H., Park N. H., Song Y. S., et al. (2007). Hypermethylation of the cox-2 gene is a potential prognostic marker for cervical cancer. J. Obstet. Gynaecol. Res. 33 (3), 236–241. doi:10.1111/j.1447-0756.2007.00517.x
Kang S., Kim M. H., Park I. A., Kim J. W., Park N. H., Kang D., et al. (2006). Elevation of cyclooxygenase-2 is related to lymph node metastasis in adenocarcinoma of uterine cervix. Cancer Lett. 237 (2), 305–311. doi:10.1016/j.canlet.2005.06.027
Kather J. N., Weis C. A., Bianconi F., Melchers S. M., Schad L. R., Gaiser T., et al. (2016). Multi-class texture analysis in colorectal cancer histology. Sci. Rep. 6, 27988. doi:10.1038/srep27988
Kato R., Hasegawa K., Torii Y., Udagawa Y., Fukasawa I. (2015). Factors affecting platinum sensitivity in cervical cancer. Oncol. Lett. 10 (6), 3591–3598. doi:10.3892/ol.2015.3755
Khunamornpong S., Settakorn J., Sukpan K., Srisomboon J., Ruangvejvorachai P., Thorner P. S., et al. (2009). Cyclooxygenase-2 expression in squamous cell carcinoma of the uterine cervix is associated with lymph node metastasis. Gynecol. Oncol. 112 (1), 241–247. doi:10.1016/j.ygyno.2008.09.017
Kim H. J. W. H., Park I. A., Ha S. W. (2003). High cyclooxygenase-2 expression is related with distant metastasis in cervical cancer treated with radiotherapy. Int. J. Radiat. Oncol. Biol. Phys. 55 (1), 16–20. doi:10.1016/s0360-3016(02)03821-x
Kim J. S., Li S., Kim J. M., Yeo S. G., Kim K. H., Cho M. J. (2008). Cyclooxygenase-2 expression as a predictor of para-aortic lymph node recurrence in uterine cervical cancer. Int. J. Radiat. Oncol. Biol. Phys. 70 (5), 1516–1521. doi:10.1016/j.ijrobp.2007.08.048
Kuroda K., Yamamoto Y., Yanagisawa M., Kawata A., Akiba N., Suzuki K., et al. (2017). Risk factors and a prediction model for lower limb lymphedema following lymphadenectomy in gynecologic cancer: A hospital-based retrospective cohort study. BMC Womens Health 17 (1), 50. doi:10.1186/s12905-017-0403-1
Li X., Xu C., Yu Y., Guo Y., Sun H. (2021). Prediction of lymphovascular space invasion using a combination of tenascin-C, cox-2, and pet/ct radiomics in patients with early-stage cervical squamous cell carcinoma. BMC Cancer 21 (1), 866. doi:10.1186/s12885-021-08596-9
Li X. R., Jin J. J., Yu Y., Wang X. H., Guo Y., Sun H. Z. (2021). Pet-ct radiomics by integrating primary tumor and peritumoral areas predicts E-cadherin expression and correlates with pelvic lymph node metastasis in early-stage cervical cancer. Eur. Radiol. 31 (8), 5967–5979. doi:10.1007/s00330-021-07690-7
Liu H., Xiao J., Yang Y., Liu Y., Ma R., Li Y., et al. (2011). Cox-2 expression is correlated with vegf-C, lymphangiogenesis and lymph node metastasis in human cervical cancer. Microvasc. Res. 82 (2), 131–140. doi:10.1016/j.mvr.2011.04.011
Lv K., Guo H. M., Lu Y. J., Wu Z. X., Zhang K., Han J. K. (2014). Role of 18f-fdg pet/ct in detecting pelvic lymph-node metastases in patients with early-stage uterine cervical cancer: Comparison with mri findings. Nucl. Med. Commun. 35 (12), 1204–1211. doi:10.1097/MNM.0000000000000198
Manchana T., Triratanachat S., Sirisabya N., Vasuratna A., Termrungruanglert W., Tresukosol D. (2006). Prevalence and prognostic significance of cox-2 expression in stage ib cervical cancer. Gynecol. Oncol. 100 (3), 556–560. doi:10.1016/j.ygyno.2005.09.014
Nanthamongkolkul K., Hanprasertpong J. (2018). Predictive factors of pelvic lymph node metastasis in early-stage cervical cancer. Oncol. Res. Treat. 41 (4), 194–198. doi:10.1159/000485840
Nica A., Gien L. T., Ferguson S. E., Covens A. (2020). Does small volume metastatic lymph node disease affect long-term prognosis in early cervical cancer? Int. J. Gynecol. Cancer 30 (3), 285–290. doi:10.1136/ijgc-2019-000928
O'Connor J. P. B. (2017). Cancer heterogeneity and imaging. Semin. Cell Dev. Biol. 64, 48–57. doi:10.1016/j.semcdb.2016.10.001
Rudtanasudjatum K., Charoenkwan K., Khunamornpong S., Siriaunkgul S. (2011). Impact of histology on prognosis of patients with early-stage cervical cancer treated with radical surgery. Int. J. Gynaecol. Obstet. 115 (2), 183–187. doi:10.1016/j.ijgo.2011.06.011
Ryu H. S., Chang K. H., Yang H. W., Kim M. S., Kwon H. C., Oh K. S. (2000). High cyclooxygenase-2 expression in stage ib cervical cancer with lymph node metastasis or parametrial invasion. Gynecol. Oncol. 76 (3), 320–325. doi:10.1006/gyno.1999.5690
Sironi S., Buda A., Picchio M., Perego P., Moreni R., Pellegrino A., et al. (2006). Lymph node metastasis in patients with clinical early-stage cervical cancer: Detection with integrated fdg pet/ct. Radiology 238 (1), 272–279. doi:10.1148/radiol.2381041799
Stasinopoulos I., Shah T., Penet M. F., Krishnamachary B., Bhujwalla Z. M. (2013). Cox-2 in cancer: Gordian knot or achilles heel? Front. Pharmacol. 4, 34. doi:10.3389/fphar.2013.00034
Sung H., Ferlay J., Siegel R. L., Laversanne M., Soerjomataram I., Jemal A., et al. (2021). Global cancer statistics 2020: Globocan estimates of incidence and mortality worldwide for 36 cancers in 185 countries. Ca. Cancer J. Clin. 71 (3), 209–249. doi:10.3322/caac.21660
Umbreit E. C., McIntosh A. G., Suk-Ouichai C., Segarra L. A., Holland L. C., Fellman B. M., et al. (2020). Intraoperative and early postoperative complications in postchemotherapy retroperitoneal lymphadenectomy among patients with germ cell tumors using validated grading classifications. Cancer 126 (22), 4878–4885. doi:10.1002/cncr.33051
van Griethuysen Jjm , Fedorov A., Parmar C., Hosny A., Aucoin N., Narayan V., et al. (2017). Computational radiomics system to decode the radiographic phenotype. Cancer Res. 77 (21), e104–e107. doi:10.1158/0008-5472.CAN-17-0339
Wenzel H. H. B., Olthof E. P., Bekkers R. L. M., Boere I. A., Lemmens V., Nijman H. W., et al. (2022). Primary or adjuvant chemoradiotherapy for cervical cancer with intraoperative lymph node metastasis - a review. Cancer Treat. Rev. 102, 102311. doi:10.1016/j.ctrv.2021.102311
Xu L., Stevens J., Hilton M. B., Seaman S., Conrads T. P., Veenstra T. D., et al. (2014). Cox-2 inhibition potentiates antiangiogenic cancer therapy and prevents metastasis in preclinical models. Sci. Transl. Med. 6 (242), 242ra84. doi:10.1126/scitranslmed.3008455
Yeo W., Chan S. L., Mo F. K., Chu C. M., Hui J. W., Tong J. H., et al. (2015). Phase I/ii study of temsirolimus for patients with unresectable hepatocellular carcinoma (hcc)- a correlative study to explore potential biomarkers for response. BMC Cancer 15, 395. doi:10.1186/s12885-015-1334-6
Yost K. J., Cheville A. L., Al-Hilli M. M., Mariani A., Barrette B. A., McGree M. E., et al. (2014). Lymphedema after surgery for endometrial cancer: Prevalence, risk factors, and quality of life. Obstet. Gynecol. 124, 307–315. doi:10.1097/AOG.0000000000000372
Zhao S., Kuge Y., Mochizuki T., Takahashi T., Nakada K., Sato M., et al. (2005). Biologic correlates of intratumoral heterogeneity in 18f-fdg distribution with regional expression of glucose transporters and hexokinase-ii in experimental tumor. J. Nucl. Med. 46 (4), 675–682.
Keywords: PET/CT, lymphatic metastasis, radiomics, cyclooxygenase 2, machine learning
Citation: Zhang Z, Li X and Sun H (2022) Development of machine learning models integrating PET/CT radiomic and immunohistochemical pathomic features for treatment strategy choice of cervical cancer with negative pelvic lymph node by mediating COX-2 expression. Front. Physiol. 13:994304. doi: 10.3389/fphys.2022.994304
Received: 14 July 2022; Accepted: 03 October 2022;
Published: 14 October 2022.
Edited by:
Yi Xu, Shanghai Jiao Tong University, ChinaReviewed by:
Han Lv, Beijing Friendship Hospital, Capital Medical University, ChinaHaiming Li, Fudan University, China
Zhongxiang Ding, Zhejiang University, China
Copyright © 2022 Zhang, Li and Sun. This is an open-access article distributed under the terms of the Creative Commons Attribution License (CC BY). The use, distribution or reproduction in other forums is permitted, provided the original author(s) and the copyright owner(s) are credited and that the original publication in this journal is cited, in accordance with accepted academic practice. No use, distribution or reproduction is permitted which does not comply with these terms.
*Correspondence: Hongzan Sun, sunhongzan@126.com