 Begoña Espejo1†
 Marta Martín-Carbonell2*†
 Irene Checa1†
 Yadid Paternina2Martha Fernández-Daza2
 Juan D. Higuita3Angela Albarracín4Ara Cerquera4
- 1Department of Behavioral Sciences Methodology, School of Psychology, Universidad de Valencia, Valencia, Spain
- 2Psychology Program, Universidad Cooperativa de Colombia, Santa Marta, Colombia
- 3Psychology Program, Universidad Cooperativa de Colombia, Medellín, Colombia
- 4Psychology Program, Universidad Pontificia Bolivariana de Bucaramanga, Bucaramanga, Colombia
Introduction: The Satisfaction with Life Scale (SWLS), developed by Diener, Emmons, Larsen, and Griffin in 1985, comprises five items with seven response options in terms of agreement–disagreement. Recently, there has been a suggestion to reduce the response options of the SWLS to optimize its applicability in different cultural contexts.
Objective: The study aims to assess the psychometric properties of the SWLS with five response options in the Colombian population. Specifically, we studied the dimensionality, invariance by gender and age (among a group of adolescents and emerging adults under 25 years and a group of adults of intermediate age and established adulthood under 59 years), convergent validity (with optimism), and divergent (with pessimism) and concurrent validity with other measures of well-being (flourishing, positive, and negative affects).
Methodology: This project was a cross-sectional study using a non-probabilistic sample of the general population. Participants were included if they identified themselves as Colombian and were at least 18 years of age. The final sample comprised 1,255 participants. The average age was 25.62 years (SD = 8.60) ranging from 18 to 67 years of age, and 35.8% of the participants were men. In addition to SWLS, we used the Flourishing Scale (FS), Life Orientation Test-Revised (LOT-R), and Scale of Positive and Negative Experience (SPANE).
Results: Cronbach's alpha coefficient (0.842), composite reliability (0.851), and average variance extracted (0.537) showed very good values. CFA was conducted to test the one-dimensional structure of FS, showing excellent goodness of fit [ = 15.774, p < 0.001, CFI = 0.992, TLI = 0.985, RMSEA = 0.042, 90% RMSEA CI (0.020, 0.066), and SRMR = 0.016]. The correlations calculated among life satisfaction (SWLS) with flourishing (FS), positive and negative affects (SPANE), optimism, and pessimism (LOT-R) were statistically significant and as expected. Configural, metric, and scalar invariance across gender and age were confirmed. Percentiles were provided for the total score and for age.
Conclusions: The SWLS with five response options has adequate psychometric properties in the Colombian population, and the use of this version (with 5 response options) is recommended due to its greater applicability.
Introduction
In recent decades, politicians and governments have shown an increased interest in evaluating well-being (1). Among other reasons, this is due to the accumulated evidence about its impact on health (2), in academic performance (3) and in labor (4), as well as its value to inform government decisions and evaluate programs aimed at promoting mental health and quality of life in risk groups (5). Research shows that the concept of subjective well-being is multidimensional (6). Among the constitutive components of well-being, satisfaction with life has been identified as a distinct construct that involves a cognitive and global assessment of quality of life as a whole. It has also been conceptualized as the self-assessment of an individual's quality of life according to the comparison between their current state and their standard of what is desirable (7).
According to various authors (5, 8), the most widely used measure for this research is the Satisfaction with Life Scale (SWLS), originally developed by Diener et al. (9). These authors suggest that the scale allows access to the positive side of the individual experience and that it emphasizes self-assessment itself, because the person can establish the basis of their evaluation by choosing the domains that they will take into account when assessing their life, regardless of their emotional state (10). The SWLS is based on the theory of global satisfaction originally proposed by Sumner (11), who conceptualized global satisfaction as a positive attitude toward life itself. This implies that it is an evaluation of all areas and stages of life, which includes both the affective and cognitive aspects, according to the person's expectations.
The SWLS consists of five items with seven response options in terms of agreement–disagreement on a Likert scale ranging from 1 to 7. While the authors of the scale (10) did not provide normative data, they proposed cut-off points that correspond directly to the seven response categories: 31–35, very satisfied; 26–30, satisfied; 21–25, slightly satisfied; 20, neutral; 15–19, slightly dissatisfied; 10–14, dissatisfied; and 5–9, very dissatisfied.
There is sufficient evidence of the validity of the satisfaction with life construct and the SWLS scale, verified, first by their ability to detect differences associated with objective conditions and different life circumstances (12); second, by their correlations with measures not based on self-reporting (13); third, by their association with genetic and physiological variables (14); fourth, by significant changes in scores associated with major life events; and finally by the predictive value of suicidal behaviors (15, 16). SWLS scores have also been shown to positively correlate with health variables and negatively with emotional symptoms, negative thoughts, and coping strategies such as experiential avoidance (17).
Since it was introduced, the SWLS has been used in hundreds of studies (13, 15). It has been validated in numerous languages, such as French (18), German (19), Portuguese (20), Turkish (21), Chinese (22), and even sign language (23). Its psychometric properties have been explored with a wide variety of populations, including adolescents, the elderly, and patients with different health problems (24).
However, modifications to the SWLS response options have recently been recommended in order to optimize its applicability in different cultural contexts (25). This goes in line with previous studies that have shown that offering too many response options could be problematic for people with a low cultural level (26) or generate confusion and boredom in respondents who may find it difficult to distinguish subtle differences between categories (27).
Since the use of Likert scales is intended to adequately represent a construct or continuous latent variable, the question of the optimal number of response alternatives and the effect of categorizing continuous variables becomes particularly relevant. Some authors showed in a study that no psychometric advantages were apparent as of six-response options (28), but this is a subject still under discussion (29). On the other hand, and as a result of a systematic review of published literature on this issue (30), it was concluded that it is best to use five response options. In general, according to studies of the International Test Commission, when data are one-dimensional the best fit is achieved when working with four to six categories (31). In addition, the easier it is for the user to respond to this type of measure, the greater its applicability is, allowing its use to be extended to people with limited comprehension or communication skills, who are often excluded from studies, such as the visually or hearing impaired, people with a low education or those who are illiterate, and people with cognitive problems (26). On the other hand, an invariance study was carried out specifically for the SWLS with Italian and African populations (25). It found that the scale may not be sensitive when it comes to detecting low levels of satisfaction with life, so the authors recommended using fewer response options, especially for the South African population.
There are several adaptations of the SWLS in Spanish: one can be found in public domain on the website of Ed Diener (https://eddiener.com/), the main author of the original scale. It was translated by José A. Reyes-Torres. However, we also found several reports using back translation (32–36). These adaptations differ both in the wording of the items and in their order of presentation, as well as in the number of options and the text of the responses.
Several studies in Ibero-American populations have used the SWLS with five instead of the seven options from the original scale, e.g., in Spain (32, 33, 35, 37), in Chile (38), in Peru (39), in Costa Rica (40) and in Puerto Rico (41). In Mexico it was conducted a validation study of the scale with three-response options (disagree, intermediate, and agree) in a national sample of 13,220 adults above the age of 50 years, finding adequate internal consistency, criterion validity, and confirmation of the one-factor structure (42). In Colombia, different variants of the SWLS have been used in different populations and contexts (43–45). This motivated another authors (46) to conduct an initial validation study with a sample of 121 University students using a version with seven response options (32), but drafted in terms of satisfaction-dissatisfaction (from very dissatisfied to very satisfied), which limits its applicability in cross-cultural studies.
A recent research (47) have recently studied the psychometric properties of Atienza's version (36) in a Colombian sample but with seven response options, instead of the five whose translation was validated by Atienza et al. They have not clarified the origin of the translation used for these seven-answer options. This goes against the recommendations of the International Test Commission for adapting instruments that have been developed in other contexts (31, 48). For the version they studied, Ruiz et al. reported adequate internal consistency and corroborated that the unifactorial model had a very good fit, significant correlations, went in the expected direction with other measures of well-being, and showed metric and scalar gender invariance and with a Spanish sample. However, they did not report normative data that could facilitate its application in contexts where individual differences need to be established.
For these reasons, the present study aimed to evaluate the psychometric properties of Diener's SWLS in the Spanish version by Atienza et al. (35, 36) with Colombian population and using five response options. In addition to being easier to answer for our population, it has been and is widely used in Ibero-American contexts. We investigated whether the one-dimensionality of the instrument with five response options was maintained, as well as the gender invariance. We also studied the age invariance of the SWLS in Colombians, which had not been done previously and constitutes a topic of interest given then reports on the absence of age invariance in other samples (24). We were interested in corroborating the concurrent validity of the SWLS with measures of optimism and pessimism because of existing evidence regarding their relationship (49–51) and their convergent validity with other measures related to well-being, such as prosperity and positive and negative affects (51–53). Finally, another objective was to obtain information to interpret the scores of the Colombian population.
Methods
Participants
The present project was a cross-sectional study using a non-probabilistic sample of the general population. Participation in the survey was completely anonymous and voluntary, and no participant received any type of financial compensation for it. Participants were included if they identified themselves as Colombian and were at least 18 years old. The final sample comprised of 1,255 participants. The average age was 25.62 years (SD = 8.60) ranging from 18 to 67 years, and 64.5% of the participants were female. People who had completed University or graduate studies formed the majority (42.9%) along with those who had completed high school (41.2%), 12.9% had completed secondary school, and only 2.7% of the sample had completed or partially attended primary education; 75.5% were single, 22% were married or had an intimate partner, and 2.5% were divorced or widowed. On the contrary, 43.9% were full-time students and 26.1% were in school and had sporadic or part-time jobs; regarding working status, 23.7% were employed or self-employed, 4.9% were unemployed, 1% were inactive, and 0.4% were retired.
Measures
Satisfaction With Life Scale
This is an instrument designed to measure global cognitive judgment of satisfaction with one's life (9). For the present study, we used the Spanish adaptation with five response options by Atienza et al. (35, 36).
Flourishing Scale
This is an eight-item instrument describing important aspects of human functioning including positive relationships, feelings of competence, and having meaning and purpose in life (54). The instrument uses a seven-point Likert scale ranging from 1 (strongly disagree) to 7 (strongly agree). Total scores range from 8 to 56 with high scores indicating respondents viewing themselves in positive terms in important areas of functioning. This instrument was validated in a general sample of Spanish adults and showed an internal consistency of 0.85 (55). The present study uses the version validated in a Colombian sample, based on the previous Spanish version (56), with an internal consistency of 0.916 in the sample from this study.
Life Orientation Test-Revised
This questionnaire has been used to measure optimism and pessimism (57). The scale is comprised of ten items, four control items, three pessimism items, and three optimism items. Each item of the LOT-R is answered on a five-point Likert scale that ranges from 1 (strongly disagree) to 5 (strongly agree). The scores range from 0 to 12. Higher scores in both subscales indicate high optimism or high pessimism, respectively. This scale was validated in a sample of Colombian adults and showed good psychometric properties (58, 59). Internal consistency in this sample is 0.693 for the Optimism subscale, and 0.636 for the Pessimism subscale. Although some authors question Cronbach's alpha values lower than 0.70, this consideration should not be taken as a “golden rule,” especially due to the reduced number of items on the LOT subscales, since an alpha that is too high could lead one to think that, in reality, the three items measure the same indicator of the construct (60).
Scale of Positive and Negative Experience
This scale allows us to learn how the person evaluates the frequency with which they experience positive and negative feelings, as well as the balance of affections. To this effect, 12 adjectives organized in 2 subscales of 6 items each are used: 6 positive (SPANE-P) and 6 negative experiences (SPANE-N), measuring 3 general and 3 specific emotions in each subscale. The instrument uses a five-point Likert scale ranging from 1 (very rarely or never) to 5 (very often or always). Total scores range from 6 to 30, with high scores indicating a high positive or high negative affect. SPANE-P and SPANE-N can be subtracted to obtain a balanced measure (SPANE-B) that ranges from −24 to 24. In this study, the adapted version was used for a general sample of Colombians (61). The internal consistency in this sample was 0.811 for SPANE-P and 0.799 for SPANE-N.
Procedures
Data from a larger study aimed at validating well-being scales in the Colombian population were used. Following the recommendations of Muñiz et al. (48), an initial qualitative pilot study was conducted. The pilot study's participants were selected using purposeful theoretical sampling serially until obtaining data saturation. In total, 14 people were included based on their willingness to collaborate and after ensuring they were Colombian adults (9 women and 5 men), with different education levels (8 people with a University education, 3 with high school diplomas, and 3 with primary school education), and between the ages of 18 and 81. The scale was responded to using paper and pencil and in an online version. The analysis of the participants' responses revealed that the wording of the items in the version for Spaniards was appropriate for the Colombian context and that the participants correctly understood the items in both versions (paper and pencil, and online). All participants stated that they understood the response options and had no difficulties in choosing the one they considered appropriate in both application formats.
Participants were recruited by different means (email, social networks, and also face-to-face). Data were collected online, with LimeSurvey, an open-source survey tool. When accessing the survey, an explanation of the study was presented, and participants had to read and accept an online informed consent before answering the survey. The study was approved by the Ethics Committee of the Cooperative University of Colombia, which guarantees that data collection complied with the Colombian Law of Data, ensuring confidentiality and anonymity.
Data Analysis
Before studying the construct validity by means of a confirmatory factor analysis, the distribution of frequencies and percentages of the sociodemographic variables was investigated. The means and asymmetry coefficients of the items were checked, as well as the magnitude of the inter-item correlations (using Pearson's correlation coefficient). In addition, item-total corrected correlations were calculated for each item. A confirmatory factor analysis was performed to test the one-factor structure. The parameters were calculated using maximum likelihood robust estimation (MLR). While the nature of the data is ordinal, some studies suggest the use of MLR when the distribution of the data does not fit the normal curve and if there are five or more response options (62–64). In these situations, it can be assumed that the data is continuously distributed (65). The solution offered presents very little variability in the parameters (64), less biased standard errors, and good estimates of correlations between factors (66).
In order to study the fit of the data to the model, the Comparative Fit index (CFI), the Tucker-Lewis index (TLI), the root-mean-square error of approximation (RMSEA), and the standard-root-mean residual (SRMR) were used. Values of 0.90 for the CFI and the TLI, as well as values between 0.06 and 0.08 for the RMSEA and SRMR, indicate an acceptable model fit. Values above 0.95 for the CFI and the TLI and values below 0.05 for the RMSEA and SRMR indicate a good fit to the model (67–69). The factor measurement reliability of the SWLS was evaluated with Cronbach's alpha and with the Composite Reliability Index (CRI) (less biased than alpha) (70). The CRI is identical to the Omega coefficient (71) but more adequate when standardized factor loadings are used (72). In addition, the average variance extracted (AVE) (73) was calculated to evaluate the level of variance captured by the factor.
The measurement invariance by gender and age was evaluated by calculating three nested models that impose successive restrictions: configural, metric and scalar. Configural invariance test identical factor structures (i.e., the same number of factors and items and the same patterns of free and fixed loadings), metric invariance test equality of factor loadings, and scalar invariance test equality of factor loadings and thresholds. A configural model was first tested as a baseline model. In this model, all factor loadings and thresholds were estimated freely across groups. Unlike in models with continuous indicators, in models with categorical indicators with delta parameterization, metric invariance cannot be tested separately from scalar invariance (74, 75). Thus, a scalar invariance model was tested where equality constraints were simultaneously imposed on factor loadings and thresholds. Measurement invariance was examined by comparing the fit indices of the configural model and those of the scalar model. We used the cutoff criteria conventionally used. When sample size is adequate (total N > 300) and sample sizes are equal across the groups, a change of ≥-0.010 in CFI, supplemented by a change of ≥0.015 in RMSEA or a change of ≥0.030 in SRMR would indicate non-invariance (76). To study the measurement invariance according to age, the sample was divided into two groups: a group of adolescents and emerging adults (up to 25 years old) and a group of established adults (between 26 and 59 years old), in line with works by other authors (77). In Table 1 are shown the descriptive statistics for these two groups.
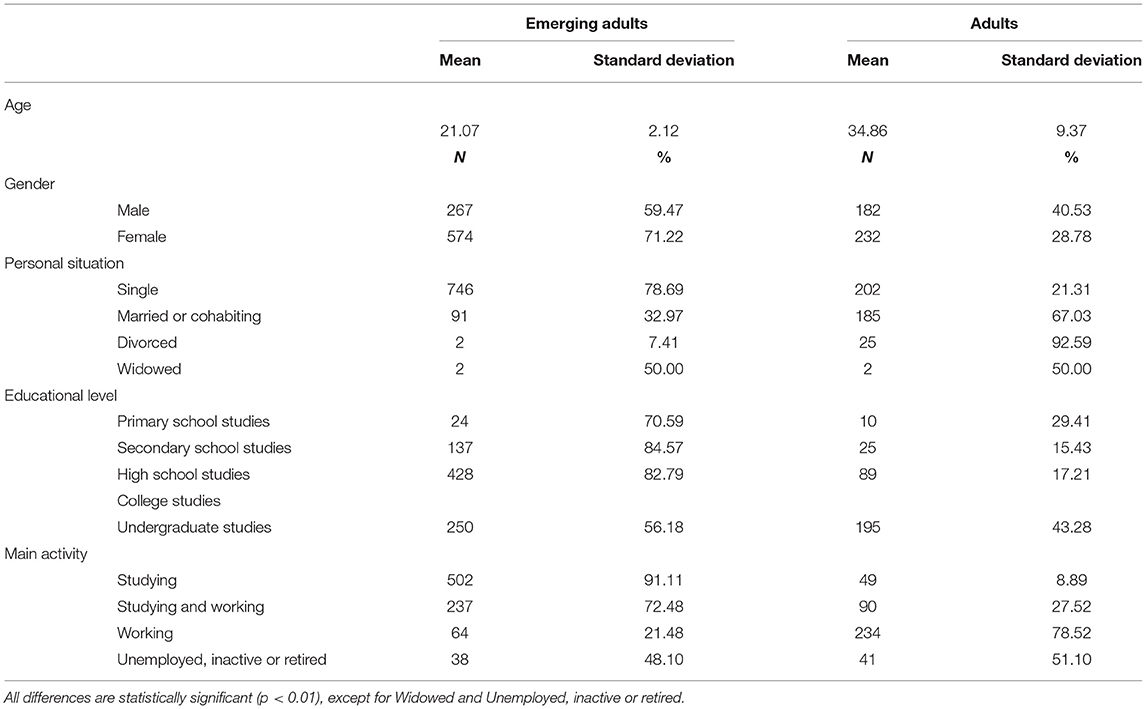
Table 1. Sociodemographic characteristics for the “emerging adults” group and for the “adults” group.
To study the convergent validity of satisfaction with life with other dimensions of well-being, Pearson correlations were calculated between the total scores of this scale and those of FS, SPANE (P and N), Optimism, and Pessimism. Pearson correlations from 0.20 to 0.39 were interpreted as weak; from 0.40 to 0.59 as moderate; and from 0.60 to 0.79 as strong. Above 0.80, the correlation was considered very strong. Finally, descriptive statistics and percentiles were provided for each age group and gender.
In order to carry out the confirmatory factor analysis and the invariance study, the statistical program Mplus 8.6 was used (74). So as to calculate the descriptive correlations among items and with criteria, Cronbach's alpha, the item-total corrected correlations, and the percentiles by groups, IBM SPSS 27 was used.
Results
Table 2 shows the descriptive statistics of the items, the item-total corrected correlations, and the inter-item correlations. Note that the scores are not normally distributed, with values above the midpoint of the response scale predominating. In addition, the correlations among items present moderate values, except for the correlation between Items 3 and 4, which presents a high value.
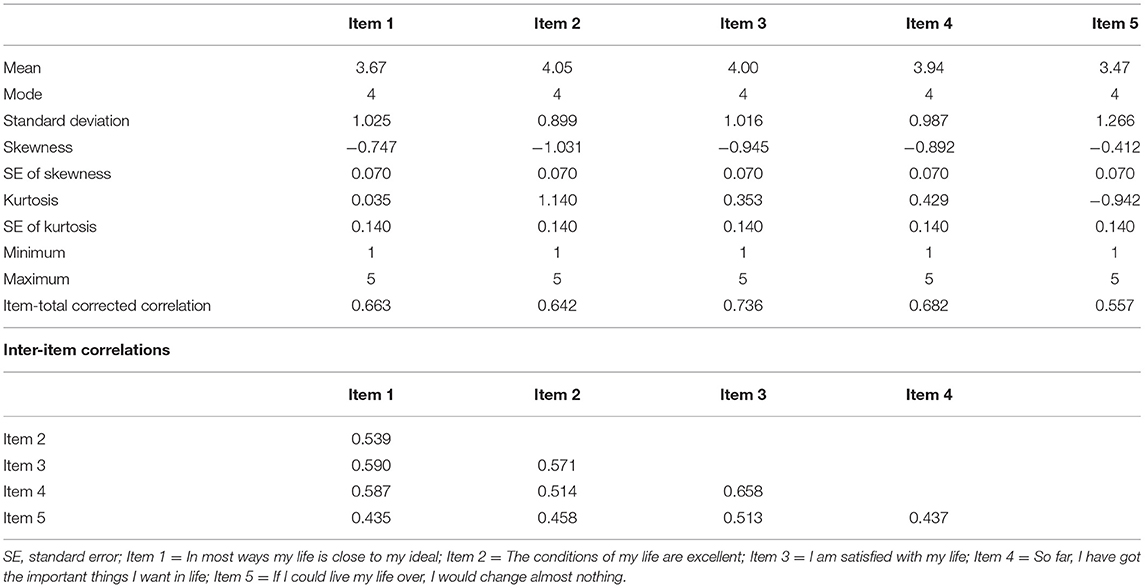
Table 2. Descriptive statistics, item-total corrected correlations, and inter-item correlations among the items (Valid N = 1,222).
Excellent fit values were found in the CFA for the one-dimensional model [ = 15.774, p < 0.001, CFI = 0.992, TLI = 0.985, RMSEA = 0.042, 90% RMSEA CI (0.020, 0.066), SRMR = 0.016]. The factor loadings were all statistically significant (p < 0.001), ranging between 0.605 and 0.828. Cronbach's alpha was 0.842, the CRI was 0.851, and the AVE was 0.537. All of these values can be considered adequate.
Table 3 shows the results for the measurement invariance models by gender and age. The results show that the Colombian SWLS had scalar invariance by gender, and the fit of the one-dimensional model for men and women was good. As can be seen, ΔCFI, ΔRMSEA, and ΔSRMR values are lower than 0.010, 0.015, and 0.030, respectively. Thus, the latent mean values were fixed to zero for men and compared. No differences were found by gender (b = −0.008, z = −0.178, p = 0.859). Regarding the measurement of invariance by age, the results showed scalar invariance for the SWLS, and the fit of the one-dimensional model for emerging adults (until 25 years old) and adults (more than 25 years old) was excellent. Thus, the latent mean values were fixed to zero for emerging adults, showing that adults present more satisfaction (b = 0.155, z = 3.114, p = 0.002).
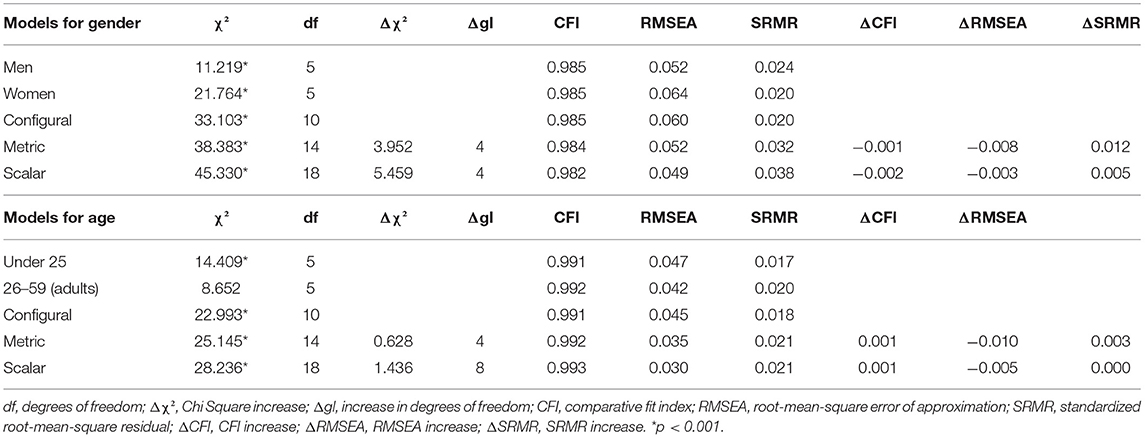
Table 3. Measurement invariance models of the SWLS by gender (reference group: men) and by age (reference group: under 25).
Regarding validity, the SWLS presented statistically significant correlations (p < 0.001) that went in the expected direction regarding the other well-being variables (SPANE-P) (r = 0.603), SPANE-N (r = −0.376), Flourishing (r = 0.492), Optimism (r = 0.566) and Pessimism (r = −0.131). Finally, Table 4 shows the descriptive statistics and percentiles for each age group and gender.
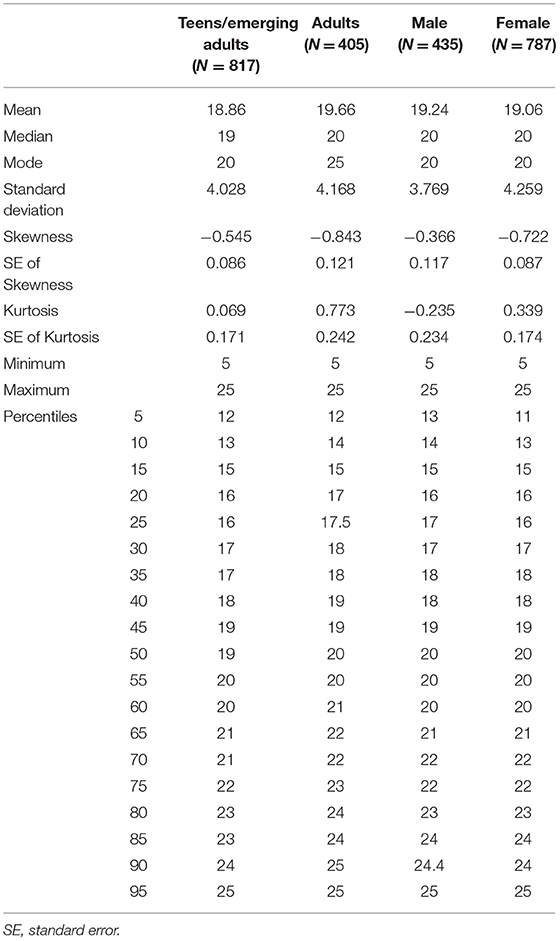
Table 4. Descriptive statistics and percentiles for the satisfaction with life scale (SWLS) by age group and by gender.
Discussion
It is suggested that “One reason for the increasing need for short scales could be a changing way to approach psychological research in general. With research questions becoming more and more complex, involving more and more constructs…” (78). Therefore, the effort to obtain valid instruments to assess well-being that are short and easy to answer is worth it to the point that a version of the SWLS with only three items has already been proposed (79). In the present work, the effort was aimed at evaluating the validity of the SWLS with fewer response options in order to facilitate its application in the Colombian context and offer data that facilitate researchers, clinicians, and, in general, professionals interested in the study of well-being to work on interpretation for evaluation purposes and in the design of interventions.
Despite the importance of how the person is asked to scale their response to a question or statement, there is little consensus in the literature regarding the number of points to include on a Likert response scale. Longer response scales have been suggested as preferable because they will increase variability in total scores and therefore would maximize precision and validity (80–83). However, what is important is that the variation in the scores allows for distinctions between individuals on the psychological characteristic that is evaluated. As early as the middle of the last century, Bendig (84) reported the same reliability for three, five, six, or nine answer options, but a decrease in reliability for 11 options. More recently, various studies (29, 85–88) have concluded that many response options can cause difficulties among participants in perceiving differences between alternatives written in a similar way (for example, agree vs. moderately agree), and induce biases in attributing lower numerical values to variables associated with social inequities and gender (89).
Our study shows that the validity of the SWLS is not affected by a reduction in the number of response options. In fact, this version shows excellent psychometric properties, including evidence of construct and concurrent validity with other measures related to well-being, which coincides with numerous studies carried out in various countries with different variants of the SWLS (18, 20–22, 90) and specifically in the Ibero-American context, with scales with a different number of response options, for example, in Spain (32, 33, 35–37, 91), in Chile (45, 92), in Peru (93), in Mexico (42, 94), in Puerto Rico (41) and in Argentina (95). In this sense, it will be necessary, in future studies, to determine the optimal number of response options, for which it may be useful to work using the Item Response Theory (IRT) so as to delve into the invariant properties of items and optimize the comparison of the results of the scale in different populations, as it is possible that other scales work better in different cultures (31, 83, 96). The use of IRT models in the study of response options can be done by estimating models that do not assume an order in the response categories (such as the nominal Bock model or the rating scale model), which allow estimating a location parameter for each of these response categories. This would allow us to check if the order of the response options is presented as it is assumed when dealing with items with a Likert-type response scale, or if said order is altered (97, 98). Likewise, these location parameters would allow us to check if each answer option has the maximum probability of being chosen for certain values in the trait. In the event that an answer option was less likely to be chosen than other adjacent options, this would indicate that said answer option has no relevance, since people would always prefer to choose one of the adjacent categories. This has been proven in various studies, in which the intermediate category is much less likely to be chosen than the adjacent categories (98, 99). And this can happen depending on the verbal anchor of the intermediate category.
Cross-cultural studies have confirmed the invariance of the unifactorial structure among nations, and initially enabled the detection of large differences that were attributed to sociocultural and socio-economic factors, such as national wealth and democratic governance (100). More recently, cross-cultural research revealed that these differences are also due to how different populations make judgments about satisfaction with life. For example, Emerson et al. (24) conducted a literature review on the cross-cultural invariance of the SWLS that encompassed works published in the last 30 years and included a sample of 27 articles with data from 66,380 respondents across 24 nations. This review corroborated the unifactorial structure of the scale, as well as the invariance by gender, but showed that there was no invariance between age groups and cultures. Similarly, other authors examined the invariance across 26 countries using three different methods, consistently finding configural and metric invariance, but not scalar invariance (101).
In our study, overall gender invariance was found, which was also confirmed for the seven-response option version in the Colombian population, and the total invariance among the youngest population (adolescents and emerging adults) and established adults (47). In this sense, our results are in line with those reported by other investigations with Spaniards (12, 91, 102), as well as with studies in other populations (103–105). However, it differs from other research that has not confirmed age invariance, such as a study carried out in Norwegian population (106). Contradictory results may be explained not only by specific cultural characteristics, but also by the characteristics of the samples, which is why this is a topic that should be studied in depth in the future.
As has been reported in studies with the SWLS around the world, the values of the items above the midpoint of the scale predominate (51). In addition, in our study, we identified differences in satisfaction with life attributable to age, consistent with the results reported by numerous studies (107). However, we did not find differences related to gender. According to Joshanloo and Jovanović (108), research on the relationship between satisfaction with life and gender has shown inconsistent results both in national studies and in large international studies and meta-analyses, since it can be influenced by various moderators such as sociocultural conditions, income, education, and marital status, among others (109). In Colombia, some studies have found that women have less satisfaction with life than men (110, 111) but it has been evaluated indirectly, based on data derived from econometric analyses. In any case, it is a topic that should continue to be studied, considering the limitations of the present study.
Limitations
The scope of the results of our study is limited by the type of non-probability sampling used, as the sample was selected because of its accessibility, which restricts generalization, considering the cultural diversity of Colombia. In addition, the sample differs in the proportion in which age is distributed in the Colombian population. Considering the data from the last National Population and Housing Census of Colombia, our sample presents a higher proportion of young adults, as 82% of participants were under 30 years of age, and <1% of participants was above 65 years. However, nationally, those over 65 represent around 9% of the population, while young people between 18 and 30 years constitute ~16%. Similarly, in our sample, there are more people with a higher educational level than in the population, and it does not include any illiterate people, even though 5.9% of Colombians cannot read or write. Additionally, the online administration restricted participants by allowing only people with Internet access. In this sense, the psychometric properties of the scale should be studied in other populations, such as the rural population, and include representatives from the various ethnic groups that inhabit the national territory. Likewise, for future studies, temporal stability with a test-retest strategy is recommended.
Conclusions
The five-choice SWLS maintains the excellent psychometric properties of the seven-choice version, with the advantage of being easier to answer. In addition, it presents invariance by gender and age groups, and provisional normative data are offered.
Data Availability Statement
The raw data supporting the conclusions of this article will be made available by the authors, without undue reservation.
Ethics Statement
The studies involving human participants were reviewed and approved by Comité de Bioética de Investigación de la Universidad Cooperativa de Colombia. The patients/participants provided their written informed consent to participate in this study.
Author Contributions
MM-C, IC, and BE: conceptualization, methodology, and writing—review and editing. IC and BE: data curation. MM-C and BE: writing—original draft preparation. YP and MF-D: collect data in Santa Marta. AA and AC: collect data in Bucaramanga. JH: collect data in Antioquia. MM-C: project administration. All authors have read and agreed to the published version of the manuscript.
Funding
The research data were part of a broader study, Project: An Analysis of the Psychometric Proper-ties of Diener's Well-Being Scales among the Colombian Population, funded by the Cooperative University of Colombia, in cooperation with the University of Valencia (Spain) and the Pontifical Bolivarian University of Bucaramanga, Grant Number INV2371.
Conflict of Interest
The authors declare that the research was conducted in the absence of any commercial or financial relationships that could be construed as a potential conflict of interest.
Publisher's Note
All claims expressed in this article are solely those of the authors and do not necessarily represent those of their affiliated organizations, or those of the publisher, the editors and the reviewers. Any product that may be evaluated in this article, or claim that may be made by its manufacturer, is not guaranteed or endorsed by the publisher.
Acknowledgments
We would like to thank to our students for their cooperation in data collection. We also thank Crimson Interactive Pvt. Ltd. (Enago) – https://www.enago.com/es/ for their assistance in manuscript translation and editing.
References
1. Landes X. Building happiness indicators some philosophical and political issues. Les ateliers l'éthique. (2016) 10:4–37. doi: 10.7202/1035325ar
2. Kushlev K, Drummond DM, Diener E. Subjective well-being and health behaviors in 2.5 million Americans. Appl Psychol Heal Well-Being. (2020) 12:166–87. doi: 10.1111/aphw.12178
3. Cobo-Rendón R, Pérez-Villalobos M V., Páez-Rovira D, Gracia-Leiva M. A longitudinal study: affective wellbeing, psychological wellbeing, self-efficacy and academic performance among first-year undergraduate students. Scand J Psychol. (2020) 61:518–26. doi: 10.1111/sjop.12618
4. Nangoy R, Mursitama TN, Setiadi NJ, Pradipto YD. Creating sustainable performance in the fourth industrial revolution era: the effect of employee's work well-being on job performance. Manag Sci Lett. (2020) 10:1037–42. doi: 10.5267/j.msl.2019.11.006
5. Kusier AO, Folker AP. The satisfaction with life scale: philosophical foundation and practical limitations. Heal Care Anal. (2021) 29:21–38. doi: 10.1007/s10728-020-00420-y
6. Forgeard MJC, Jayawickreme E, Kern ML, Seligman MEP. Doing the right thing: measuring well-being for public policy. Int J Wellbeing. (2011) 1:79–106. doi: 10.5502/ijw.v1i1.15
8. Kobau R, Sniezek J, Zack MM, Lucas RE, Burns A. Well-being assessment: an evaluation of well-being scales for public health and population estimates of well-being among US adults. Appl Psychol Heal Well Being. (2010) 2:272–97. doi: 10.1111/j.1758-0854.2010.01035.x
9. Diener E, Emmons RA, Larsen RJ, Griffin S. The satisfaction with life scale. J Pers Assess. (1985) 49:71–5. doi: 10.1207/s15327752jpa4901_13
10. Pavot W, Diener E. Review of the satisfaction with life scale. Psychol Assess. (1993) 5:164–72. doi: 10.1037/1040-3590.5.2.164
12. Atienza FL, Martinez N, Silva C. Life satisfaction and self-rated health in adolescents: the relationships between them and the role of gender and age. Span J Psychol. (2020) 23:1–9. doi: 10.1017/SJP.2020.10
13. Pavot W, Diener E. Review of the satisfaction with life scale. In: Diener E, editor. Assessing Well-Being: The Collected Works of Ed Diener. New York, NY: Springer Science + Business Media. 117, Chapter xi, 274 Pages.
14. Triwidyati H, Tentama F. Validity and reliability construct of subjective well-being scale. Int J Sci Basic Appl Res. (2020) 51:191–200. Available online at: http://eprints.uad.ac.id/20150/
15. Jebb AT, Morrison M, Tay L, Diener E. Subjective well-being around the world: trends and predictors across the life span. Psychol Sci. (2020) 31:293–305. doi: 10.1177/0956797619898826
16. Diener E, Inglehart R, Tay L. Theory and validity of life satisfaction scales. Soc Indic Res. (2013) 112:497–527. doi: 10.1007/s11205-012-0076-y
17. Kim ES, Delaney SW, Tay L, Chen Y, Diener E, Vanderweele TJ. Life satisfaction and subsequent physical, behavioral, and psychosocial health in older adults. Milbank Q. (2021) 99:209–39. doi: 10.1111/1468-0009.12497
18. Blais MR Vallerand RJ Pelletier LG Brière Brière NMThe satisfaction scale: Canadian-French validation of the satisfaction with life scale. Can J Behav Sci. (1989) 21:210–23. doi: 10.1037/h0079854
19. Glaesmer H, Grande G, Braehler E, Roth M. The German version of the satisfactionwith life scale (SWLS) psychometric properties, validity, and population-based norms. Eur J Psychol Assess. (2011) 27:127–32. doi: 10.1027/1015-5759/a000058
20. Sancho P, Galiana L, Gutierrez M, Francisco EH, Tomás JM. Validating the portuguese version of the satisfaction with life scale in an elderly sample. Soc Indic Res. (2014) 115:457–66. doi: 10.1007/s11205-012-9994-y
21. Durak M, Senol-Durak E, Gencoz T. Psychometric properties of the satisfaction with life scale among Turkish University students, correctional officers, and elderly adults. Soc Indic Res. (2010) 99:413–29. doi: 10.1007/s11205-010-9589-4
22. Bai X, Wu C, Zheng R, Ren X. The psychometric evaluation of the satisfaction with life scale using a nationally representative sample of China. J Happiness Stud. (2011) 12:183–97. doi: 10.1007/s10902-010-9186-x
23. Wilson JF, Embree J, Guthmann D, Sligar SR, Titus JC, Taylor KC. Satisfaction with life scale in American sign language: validation and normative data. J Am Deaf Rehabil Assoc. (2020) 53:1–10. doi: 10.1037/t80262-000
24. Emerson SD, Guhn M, Gadermann AM. Measurement invariance of the satisfaction with life scale: reviewing three decades of research. Qual Life Res. (2017) 26:2251–64. doi: 10.1007/s11136-017-1552-2
25. Schutte L, Negri L, Delle Fave A, Wissing MP. Rasch analysis of the satisfaction with life scale across countries: findings from South Africa and Italy. Curr Psychol. (2019) 40:4908–17. doi: 10.1007/s12144-019-00424-5
26. Bernal H, Wooley S, Schensul J. The challenge of using Likert-type scales with low-literate ethnic populations. Nurs Res. (1997) 46 3:179–81. doi: 10.1097/00006199-199705000-00009
27. Flaskerud JH. Cultural bias and likert-type scales revisited. Issues Ment Health Nurs. (2012) 33:130–2. doi: 10.3109/01612840.2011.600510
28. Simms LJ, Zelazny K, Williams TF, Bernstein L. Does the number of response options matter? Psychometric perspectives using personality questionnaire data. Psychol Assess. (2019) 31:557–66. doi: 10.1037/pas0000648
29. Claveria O. A new metric of consensus for Likert-type scale questionnaires: an application to consumer expectations. J Bank Financ Technol. (2021) 5:35–43. doi: 10.1007/s42786-021-00026-5
30. Matas A. Diseño del formato de escalas tipo Likert: un estado de la cuestión. Rev Electron Investig Educ. (2018) 20:38–47. doi: 10.24320/redie.2018.20.1.1347
31. Hernández-Baeza A, Muñiz J, García-Cueto E. Comportamiento del modelo de respuesta graduada en función del número de categorías de la escala. Psicothema. (2000) 12:288–91. Available online at: https://www.redalyc.org/pdf/727/72797068.pdf
32. Vázquez C, Duque A, Hervás G. Satisfaction with life scale in a representative sample of Spanish adults: validation and normative data. Span J Psychol. (2013) 16:E82. doi: 10.1017/sjp.2013.82
33. Cabañero-Martínez MJ, Richart-Martínez M, Cabrera-García J, Orts-Cortés MI, Reig-Ferrer A, Tosal-Herrero B. Fiabilidad y validez de la Escala de Satisfacción con la Vida de Diener en una muestra de mujeres embarazadas y puérperas. Psicothema. (2004) 16:449–55. Available online at: https://www.redalyc.org/pdf/727/72716318.pdf
34. Núñez JL, Martín-Albo J, Domínguez E. Propiedades psicométricas de la escala de satisfacción con la vida en sujetos practicantes de actividad física. Rev Psicol del Deport. (2010) 19:291–304. Available online at: https://www.redalyc.org/pdf/2351/235116352009.pdf
35. Atienza FL, Pons D, Balaguer I, García-Merita M. Propiedades Psicométricas de la Escala de Satisfacción con la Vida en Adolescentes. Psicothema. (2000) 12:314–9. Available online at: https://reunido.uniovi.es/index.php/PST/article/view/7597
36. Atienza FL, Balaguer I, Garcia-Merita ML. Satisfaction with life scale: analysis of factorial invariance across sexes. Pers Individ Dif. (2003) 35:1255–60. doi: 10.1016/S0191-8869(02)00332-X
37. Pons D, Atienza FL, Balaguer I, García-Merita ML. Satisfaction with life scale: analysis of factorial invariance for adolescents and elderly persons. Percept Mot Skills. (2000) 91:62–8. doi: 10.2466/pms.2000.91.1.62
38. Álvarez CA, Briceño AM, Álvarez K, Abufhele M, Delgado I. Transcultural adaptation and validation of a satisfaction with life scale for chilean adolescents. Rev Chil Pediatr. (2018) 89:51–8. doi: 10.4067/S0370-41062018000100051
39. Calderón-De la Cruz G, Lozano-Chávez F, Cantuarias-Carthy A, Ibarra-Carlos L. Validación de la Escala Satisfacción con la Vida en trabajadores peruanos. Lib Rev Peru Psicol. (2018) 24:249–64. doi: 10.24265/liberabit.2018.v24n2.06
40. Blanco M, Salazar M. Escala de Satisfacción con la Vida para adultos mayores de Emmons, Larsen, y Griffin. In: Compendio de Instrumentos de Medición IIP-2014. p. 227–231.
41. González-Rivera JA, Rosario-Rodríguez A. Psychometric characteristics of the satisfaction with life scale in a sample of puerto ricans adults. Rev Puertorriquena Psicol. (2020) 1:128–39. Available online at: https://dialnet.unirioja.es/servlet/articulo?codigo=7872123
42. López-Ortega M, Torres-Castro S, Rosas-Carrasco O. Psychometric properties of the satisfaction with life scale (SWLS): secondary analysis of the Mexican health and aging study. Health Qual Life Outcomes. (2016) 14:1–7. doi: 10.1186/s12955-016-0573-9
43. Hernández-Mateus LV, Salamanca-Chacón SA, Umbarila-Contréras LI, Venegas Muñoz CF, Riveros-Munévar F. Validez de constructo y confiabilidad de la Escala de Satisfacción con la Vida, en escolares de zonas rurales y urbanas de Cundinamarca. Actual en Psicol. (2018) 32:71. doi: 10.15517/ap.v32i125.29848
44. Bernal-Romero T, Daza-Pinzón CD, Jaramillo-Acosta PK. Satisfacción con la vida y resiliencia en jóvenes en edad escolar. Rev Iberoam Psicol Cienc y Tecnol. (2015) 8:43–53. doi: 10.33881/2027-1786.rip.8204
45. Sanín-Posada A, Salanora M, Vera-Villarroel P. Satisfacción con la Vida: El rol de la Felicidad en el Trabajo y la Vida. Rev Interam Psicol Ocup. (2019) 38:54–66. doi: 10.21772/ripo.v38n1a05
46. Vinaccia-Alpi S, Parada N, Quiceno JM, Riveros-Munévar F, Vera-Maldonado LA. Satisfaction with life scale (SWLS): validity, reliability and assessment analysis in college students from Bogotá (Col) as sample. Psicogente. (2019) 22:1–13. doi: 10.17081/psico.22.42.3468
47. Ruiz FJ, Suárez-Falcón JC, Flórez CL, Odriozola-González P, Tovar D, López-González S, et al. Validity of the satisfaction with life scale in Colombia and factorial equivalence with spanish data. Rev Latinoam Psicol. (2019) 51:58–65. doi: 10.14349/rlp.2019.v51.n2.1
48. Muñiz J, Elosúa P, Padilla JL, Hambleton RK. Test adaptation standards for cross-lingual assessment. In: Wells CS, Faulkner-Bond M. Educational Measurement. From Foundations to Future. New York, NY: Guilford Press. p. 291–304.
49. Bailey TC, Eng W, Frisch MB, Snyder CR. Hope and optimism as related to life satisfaction. J Posit Psychol. (2007) 2:168–75. doi: 10.1080/17439760701409546
50. Lucas RE, Diener E, Suh E. Discriminant validity of well-being measures. J Pers Soc Psychol. (1996) 71:616–28. doi: 10.1037/0022-3514.71.3.616
51. Pavot W, Diener E, Colvin CR, Sandvik E. Further validation of the satisfaction with life scale: evidence for the cross-method convergence of well-being measures. J Pers Assess. (1991) 57:149–61. doi: 10.1207/s15327752jpa5701_17
52. Diener E, Heintzelman SJ, Kushlev K, Tay L, Wirtz D, Lutes LD, et al. Findings all psychologists should know from the new science on subjective well-being. Can Psychol. (2017) 58:87–104. doi: 10.1037/cap0000063
53. Keyes CLM, Annas J. Feeling good and functioning well: distinctive concepts in ancient philosophy and contemporary science. J Posit Psychol. (2009) 4:197–201. doi: 10.1080/17439760902844228
54. Diener E, Wirtz D, Tov W, Kim-Prieto C, Choi D, Oishi S, et al. New well-being measures: short scales to assess flourishing and positive and negative feelings. Soc Indic Res. (2010) 97:143–56. doi: 10.1007/s11205-009-9493-y
55. Checa I, Perales J, Espejo B. Spanish validation of the flourishing scale in the general population. Curr Psychol. (2018) 37:949–56. doi: 10.1007/s12144-017-9581-0
56. Martín-Carbonell M, Espejo B, Checa I, Fernández-Daza M. Adaptation and measurement invariance by gender of the flourishing scale in a Colombian sample. Int J Environ Res Public Health. (2021) 18:2664. doi: 10.3390/ijerph18052664
57. Scheier MF, Carver CS, Bridges MW. Distinguishing optimism from neuroticism (and trait anxiety, self-mastery, and self-esteem): a reevaluation of the life orientation test. J Pers Soc Psychol. (1994) 67:1063–78. doi: 10.1037/0022-3514.67.6.1063
58. Valdelamar-Jiménez J, Sánchez-Pedraza R. Traducción y adaptación transcultural de la escala life orientation test-revised para medir optimismo disposicional en cuidadores de pacientes con cáncer en Colombia. Rev Fac Nac Salud Pública. (2017) 35:2016–24. doi: 10.17533/udea.rfnsp.v35n2a06
59. Zenger M, Finck C, Zanon C, Jimenez W, Singer S, Hinz A. Evaluation of the Latin American version of the life orientation test-revised. Int J Clin Heal Psychol. (2013) 13:243–52. doi: 10.1016/S1697-2600(13)70029-2
60. Ventura-León J, Peña-Calero BN. The world should not revolve around Cronbachfs alpha ≥ .70. Adicciones. (2021) 33:369–72. doi: 10.20882/adicciones.1576
61. Martín-Carbonell M, Checa I, Fernández-Daza M, Paternina Y, Espejo B. Adaptation and psychometric properties of the scale of positive and negative experience (SPANE) in the general Colombian population. Int J Environ Res Public Heal. (2021) 18:6449. doi: 10.3390/ijerph18126449
62. Johnson DR, Creech JC. Ordinal measures in multiple indicator models: a simulation study of categorization error. Am Sociol Rev. (1983) 48:398. doi: 10.2307/2095231
63. Rhemtulla M, Brosseau-Liard PÉ, Savalei V. When can categorical variables be treated as continuous? A comparison of robust continuous and categorical SEM estimation methods under suboptimal conditions. Psychol Methods. (2012) 17:354–73. doi: 10.1037/a0029315
64. Rigdon EE. Structural equation modeling. In: Modern Methods for Business Research Quantitative Methodology Series. Mahwah, NJ: Lawrence Erlbaum Associates. p. 251–94.
65. Raykov T. Scale construction development using structural equation modeling. In: Hoyle RH, editor. Handbook of Structural Equation Modeling. New York, NY: The Guilford Press. p. 472–92.
66. Li CH. Confirmatory factor analysis with ordinal data: comparing robust maximum likelihood and diagonally weighted least squares. Behav Res Methods. (2016) 48:936–49. doi: 10.3758/s13428-015-0619-7
67. Hu LT, Bentler PM. Cutoff criteria for fit indexes in covariance structure analysis: conventional criteria versus new alternatives. Struct Equ Model. (1999) 6:1–55. doi: 10.1080/10705519909540118
68. Rigdon EE. CFI versus RMSEA: a comparison of two fit indexes for structural equation modeling. Struct Equ Model. (1996) 3:369–79. doi: 10.1080/10705519609540052
69. Rigdon EE, Schumacker RE, Wothke W. A comparative review of interaction nonlinear modeling. In: Schumacker RE, Marcoulides GA, editors. Interaction Nonlinear Effects in Structural Equation Modeling Modern Methods for Business Research. Mahwah, NJ: Lawrence Erlbaum. p. 251–94.
70. Werts CE, Linn RL, Jöreskog KG. Intraclass reliability estimates: testing structural assumptions. Educ Psychol Meas. (1974) 34:25–33. doi: 10.1177/001316447403400104
71. McDonald RP. Test theory: A unified treatment. Mahwah, NJ: Lawrence Erlbaum Associates Publishers (1999).
72. Raykov T. Estimation of composite reliability for congeneric measures. Appl Psychol Meas. (1997) 21:173–84. doi: 10.1177/01466216970212006
73. Fornell C, Larcker DF. Evaluating structural equation models with unobservable variables and measurement error. J Mark Res. (1981) 18:39–50. doi: 10.1177/002224378101800104
75. Wu H, Estabrook R. Identification of confirmatory factor analysis models of different levels of invariance for ordered categorical outcomes. Psychometrika. (2016) 81:1014–45. doi: 10.1007/s11336-016-9506-0
76. Li CH. The Performance of MLR, USLMV, and WLSMV Estimation in Structural Regression Models With Ordinal Variables, New York, NY: George A. Marcoulides (2014).
77. Abubakar A, van de Vijver F, Alonso-Arbiol I, He J, Adams B, Aldhafri S, et al. Measurement invariance of the brief multidimensional student's life satisfaction scale among adolescents and emerging adults across 23 cultural contexts. J Psychoeduc Assess. (2016) 34:28–38. doi: 10.1177/0734282915611284
78. Ziegler M, Kemper CJ, Kruyen P. Short scales - five misunderstandings and ways to overcome them. J Individ Differ. (2014) 35:185–9. doi: 10.1027/1614-0001/a000148
79. Kjell ONE, Diener E. Abbreviated three-item versions of the satisfaction with life scale and the harmony in life scale yield as strong psychometric properties as the original scales. J Pers Assess. (2021) 103:183–94. doi: 10.1080/00223891.2020.1737093
80. Cox EP. The optimal number of response alternatives for a scale: a review. J Mark Res. (1980) 17:407–22. doi: 10.1177/002224378001700401
81. Bisquerra R. ¿Pueden las escalas Likert aumentar en sensibilidad? REIRE Rev d'Innovació i Recer en Educ. (2015) 8:129–47. doi: 10.1344/reire2015.8.2828
82. Wu H, Leung SO. Can likert scales be treated as interval scales?—a simulation study. J Soc Serv Res. (2017) 43:527–32. doi: 10.1080/01488376.2017.1329775
83. Calleja N, Reskala-Sánchez FJ, Rivera-Fong L, Buenrostro-Mercado D. Efecto del número de opciones de respuesta en las propiedades psicométricas de cuatro escalas psicosociales. Rev Psicol y Ciencias del Comport la Unidad Académica Ciencias Jurídicas y Soc. (2019) 10:100–13. doi: 10.29059/rpcc.20191126
84. Bendig AW. The reliability of self-ratings as a function of the amount of verbal anchoring and of the number of categories on the scale. J Appl Psychol. (1953) 37:38. doi: 10.1037/h0057911
85. Dawes J. Do data characteristics change according to the number of scale points used? An experiment using 5-point, 7-point and 10-point scales. Int J Mark Res. (2008) 50:61–77. doi: 10.1177/147078530805000106
86. Hernández A, Espejo B, González-Romá V, Gómez-Benito J. Escalas de respuesta tipo Likert: ¿Es relevante la alternativa “indiferente”? Metodol Encuestas. (2001) 3:135–50. Available online at: https://roderic.uv.es/handle/10550/39081
87. Weijters B, Millet K, Cabooter E. Extremity in horizontal and vertical Likert scale format responses. Some evidence on how visual distance between response categories influences extreme responding. Int J Res Mark. (2021) 38:85–103. doi: 10.1016/j.ijresmar.2020.04.002
88. Chyung SYY, Roberts K, Swanson I, Hankinson A. Evidence-based survey design: the use of a midpoint on the likert scale. Perform Improv. (2017) 56:15–23. doi: 10.1002/pfi.21727
89. Rivera LA, Tilcsik A. Scaling down inequality: rating scales, gender bias, and the architecture of evaluation. Am Sociol Rev. (2019) 84:248–74. doi: 10.1177/0003122419833601
90. Arrindell WA, Meeuwesen L, Huyse FJ. The satisfaction with life scale (SWLS): psychometric properties in a non-psychiatric medical outpatients sample. Pers Individ Dif. (1991) 12:117–23. doi: 10.1016/0191-8869(91)90094-R
91. Checa I, Perales J, Espejo B. Measurement invariance of the satisfaction with life scale by gender, age, marital status and educational level. Qual Life Res. (2019) 28:963–8. doi: 10.1007/s11136-018-2066-2
92. Barrientos-Delgado JE, Cárdenas M. A Confirmatory factor analysis of the spanish language version of the attitudes toward lesbians and gay men (ATLG) measure. Univ Psychol. (2012) 11:579–86. doi: 10.11144/Javeriana.upsy11-2.cfas
93. Inga-Aranda J, Vara-Horna A. Factors associated to life satisfaction in adults over 60 years old In Lima-Peru. Univ Psychol. (2006) 5:475–86. Available online at: http://www.scielo.org.co/scielo.php?script=sci_arttext&pid=S1657-92672006000300004
94. Padrós-Blázquez F, Soriano-Mas C, Navarro-Contreras G. Afecto positivo y negativo: ¿Una dimensión bipolar o dos dimensiones unipolares independientes? Interdiscip Rev Psicol y Ciencias Afines. (2012) 29:151–64. doi: 10.16888/interd.2012.29.1.9
95. Moyano NC, Martínez-Tais M, Muñoz MP. Propiedades psicométricas de la Escala de Satisfacción con la Vida de Diener. Rev Argentina Clínica Psicológica. (2013) 22:161–8. Available online at: https://www.redalyc.org/pdf/2819/281931436008.pdf
96. Asún-Inostroza R, Zúñiga-Rivas C. Ventajas de los modelos politómicos de teoría de respuesta al ítem en la medición de actitudes sociales. El análisis de un caso. Psykhe. (2008) 17:103–15. doi: 10.4067/S0718-22282008000200009
97. González-Romá V, Espejo B. Testing the middle response categories “Not sure”, “in between” and “?” in polytomous items. Psicothema. (2003) 15:278–84. Available online at: https://roderic.uv.es/handle/10550/39080
98. Murray AL, Booth T, Molenaar D. When middle really means “top” or “bottom”: an analysis of the 16PF5 using Bock's nominal response model. J Pers Assess. (2016) 98:319–31. doi: 10.1080/00223891.2015.1095197
99. Hernández A, Espejo B, González-Romá V. The functioning of central categories middle level and sometimes in graded response scales: does the label matter? Psicothema. (2006) 18:300–6. Available online at: https://roderic.uv.es/handle/10550/39123
100. Inglehart R. Culture Shift in Advanced Industrial Society. Princeton, New Jersey: Princeton University Press (1990).
101. Jang S, Kim ES, Cao C, Allen TD, Cooper CL, Lapierre LM, et al. Measurement invariance of the satisfaction with life scale across 26 countries. J Cross Cult Psychol. (2017) 48:560–76. doi: 10.1177/0022022117697844
102. Esnaola I, Benito M, Antonio-Agirre I, Axpe I, Lorenzo M. Longitudinal measurement invariance of the satisfaction with life scale in adolescence. Qual Life Res. (2019) 28:2831–7. doi: 10.1007/s11136-019-02224-7
103. Bronk KC, Hill PL, Lapsley DK, Talib TL, Finch H. Purpose, hope, and life satisfaction in three age groups. J Posit Psychol. (2009) 4:500–10. doi: 10.1080/17439760903271439
104. Gestsdottir S, Magnusson K, Arngrimsson SA, Johannsson E, Arnarsson A, Sveinsson T. Gender differences in development of mental well-being from adolescence to young adulthood: an eight-year follow-up study. Scand J Public Health. (2015) 43:269–75. doi: 10.1177/1403494815569864
105. Tomás JM, Gutiérrez M, Sancho P, Romero I. Measurement invariance of the satisfaction with life scale (SWLS) by gender and age in Angola. Pers Individ Dif. (2015) 85:182–6. doi: 10.1016/j.paid.2015.05.008
106. Clench-Aas J, Nes RB, Dalgard OS, Aarø LE. Dimensionality and measurement invariance in the satisfaction with life scale in Norway. Qual Life Res. (2011) 20:1307–1317. doi: 10.1007/s11136-011-9859-x
107. Steptoe A, Deaton A, Stone AA. Subjective wellbeing, health, and ageing. Lancet. (2015) 385:640–8. doi: 10.1016/S0140-6736(13)61489-0
108. Joshanloo M, Jovanović V. The relationship between gender and life satisfaction: analysis across demographic groups and global regions. Arch Womens Ment Health. (2020) 23:331–8. doi: 10.1007/s00737-019-00998-w
109. Graham C, Chattopadhyay S. Gender and well-being around the world. Int J Happiness Dev. (2013) 1:212–32. doi: 10.1504/IJHD.2013.055648
110. Cardona L, Gómez-Toro C, Henao-Duue JF. ¿Costumbre o Reacción? El efecto de ser víctima de delitos y corrupción en la satisfacción con la vida de los colombianos. In: Center for Research in Economics and Finance (CIEF). Working Papers. Available online at: https://papers.ssrn.com/sol3/papers.cfm?abstract_id=2849148 (accessed July 25).
111. Peláez-Madrigal N,. Caracterización del reporte de la satisfacción con la vida de las mujeres en Colombia. (2019). Available online at: https://repository.eafit.edu.co/handle/10784/14947 (accessed July 25).
Keywords: satisfaction with life scale, response options, psychometric properties, confirmatory factor analysis, well-being assessment, measurement invariance, structural equation modeling
Citation: Espejo B, Martín-Carbonell M, Checa I, Paternina Y, Fernández-Daza M, Higuita JD, Albarracín A and Cerquera A (2022) Psychometric Properties of the Diener Satisfaction With Life Scale With Five Response Options Applied to the Colombian Population. Front. Public Health 9:767534. doi: 10.3389/fpubh.2021.767534
Received: 31 August 2021; Accepted: 08 December 2021;
Published: 13 January 2022.
Edited by:
Peter ten Klooster, University of Twente, NetherlandsReviewed by:
Esra Aki, Hacettepe University, TurkeyClaudia Charry, Santo Tomás University, Colombia
Alexander Moreno, Université de Montréal, Canada
Copyright © 2022 Espejo, Martín-Carbonell, Checa, Paternina, Fernández-Daza, Higuita, Albarracín and Cerquera. This is an open-access article distributed under the terms of the Creative Commons Attribution License (CC BY). The use, distribution or reproduction in other forums is permitted, provided the original author(s) and the copyright owner(s) are credited and that the original publication in this journal is cited, in accordance with accepted academic practice. No use, distribution or reproduction is permitted which does not comply with these terms.
*Correspondence: Marta Martín-Carbonell, martha.martinc@campusucc.edu.co
†These authors have contributed equally to this work