 Congxin Dai1†
 Yanghua Fan1†Yichao Li2Xinjie Bao1Yansheng Li2Mingliang Su2
 Yong Yao1Kan Deng1
 Bing Xing1Feng Feng3
 Ming Feng1*Renzhi Wang1*
- 1Department of Neurosurgery, Peking Union Medical College Hospital, Chinese Academy of Medical Sciences and Peking Union Medical College, Beijing, China
- 2DHC Mediway Technology Co., Ltd., Beijing, China
- 3Department of Radiology, Peking Union Medical College Hospital, Chinese Academy of Medical Sciences and Peking Union Medical College, Beijing, China
Background: Some patients with acromegaly do not reach the remission standard in the short term after surgery but achieve remission without additional postoperative treatment during long-term follow-up; this phenomenon is defined as postoperative delayed remission (DR). DR may complicate the interpretation of surgical outcomes in patients with acromegaly and interfere with decision-making regarding postoperative adjuvant therapy.
Objective: We aimed to develop and validate machine learning (ML) models for predicting DR in acromegaly patients who have not achieved remission within 6 months of surgery.
Methods: We enrolled 306 acromegaly patients and randomly divided them into training and test datasets. We used the recursive feature elimination (RFE) algorithm to select features and applied six ML algorithms to construct DR prediction models. The performance of these ML models was validated using receiver operating characteristics analysis. We used permutation importance, SHapley Additive exPlanations (SHAP), and local interpretable model–agnostic explanation (LIME) algorithms to determine the importance of the selected features and interpret the ML models.
Results: Fifty-five (17.97%) acromegaly patients met the criteria for DR, and five features (post-1w rGH, post-1w nGH, post-6m rGH, post-6m IGF-1, and post-6m nGH) were significantly associated with DR in both the training and the test datasets. After the RFE feature selection, the XGboost model, which comprised the 15 important features, had the greatest discriminatory ability (area under the curve = 0.8349, sensitivity = 0.8889, Youden's index = 0.6842). The XGboost model showed good discrimination ability and provided significantly better estimates of DR of patients with acromegaly compared with using only the Knosp grade. The results obtained from permutation importance, SHAP, and LIME algorithms showed that post-6m IGF-1 is the most important feature in XGboost algorithm prediction and showed the reliability and the clinical practicability of the XGboost model in DR prediction.
Conclusions: ML-based models can serve as an effective non-invasive approach to predicting DR and could aid in determining individual treatment and follow-up strategies for acromegaly patients who have not achieved remission within 6 months of surgery.
Introduction
Acromegaly is a chronic endocrine disease that is mostly caused by growth hormone (GH)-secreting pituitary adenomas (PAs), resulting in excessive circulating levels of insulin-like growth factor 1 (IGF1) and in high morbidity and mortality (1, 2). According to the current Endocrine Society Clinical Practice Guidelines on acromegaly, transsphenoidal surgery (TSS) is the first-line treatment, and its initial cure rate for macroadenomas is 40–50% (3). The remission of acromegaly needs to meet the following two conditions at least 12 weeks after surgery: normalized levels of IGF1 and a random GH level of <1.0 μg/L or a nadir GH level of <0.4 μg/L following an oral glucose tolerance test (OGTT) (3, 4).
According to the literature and our clinical experience, some patients with acromegaly do not reach the remission standard in the short term after surgery but achieve remission without additional postoperative treatment during long-term follow-up; this phenomenon is defined as postoperative delayed remission (5, 6). Changes in GH and IGF1 levels may be inconsistent following surgery, and the reason for delayed remission may be a longer-than-expected period required for IGF1 levels to return to normal (7). The reason may also be that the residual tumor cells gradually necrotize with ischemia after surgery.
Delayed remission may affect a doctor's ability to judge the surgical response and to determine whether the patient needs postoperative adjuvant therapy. Previous studies have focused on the retrospective analysis of clinical risk factors and their associations with delayed remission, and the results have revealed that postoperative 3-month IGF1 (post-3m IGF1) levels might have a significant influence on delayed remission (6). However, the two previous studies (5, 6) on delayed remission in patients with acromegaly have used 3 months as the observation time for postoperative remission, which was too short. It is more reasonable to observe the remission of acromegaly patients within 6 months after surgery. Moreover, the prognosis should not be determined by only one feature. The combined analysis of multiple features may be more helpful for clinical treatment decision-making (8, 9). Thus, compared with a simple analysis of prognosis-related risk factors, it is more conducive to clinical use to build a prediction model with multiple important clinical features. As far as we know, there have been no previous attempts to construct a prediction model for delayed remission of acromegaly with multiple clinical features. Therefore, the establishment of a more comprehensive, effective, and widely used delayed remission prediction model has important implications for the treatment of acromegaly patients who have not achieved remission within 6 months of surgery.
Machine learning (ML) is a subset of artificial intelligence whereby knowledge and information are automatically acquired by extracting patterns from large databases (10, 11). ML is increasingly used in the medical community, particularly in the field of oncology. Previous studies have demonstrated that ML models can provide better accuracy and discrimination for the prediction of prognoses for lung adenocarcinoma (12) and breast cancer (13), chemoradiation therapy response in rectal cancer (14), radiotherapy response for acromegaly (15), surgical outcomes for head and neck cancer (16), and diagnosis for leukemia (17). For sellar region tumors, ML could be more effective for predicting a patient's clinical outcome and could provide better clinical decision support for neuroendocrinologists and neurosurgeons (18).
However, to the best of our knowledge, there have been no previous attempts to use ML algorithms to predict long-term outcomes in patients with acromegaly. Hence, the aims of the present study were to establish an ML model for predicting delayed remission and to try to explain and evaluate the interpretability of that ML model, with a view to assist in the decision-making process regarding acromegaly patients who have not achieved remission within 6 months of surgery.
Materials and Methods
Study Population
The present study was conducted with the participation of acromegaly patients admitted to the Department of Neurosurgery at the Peking Union Medical College Hospital (PUMCH) between January 2000 and October 2017. As shown in the Endocrine Society Clinical Practice Guideline on acromegaly (3), the preoperative diagnostic criteria for acromegaly are as follows: (1) adult patients with clinical symptoms of acromegaly (3), (2) PA confirmed by pituitary magnetic resonance imaging (MRI), and (3) preoperative IGF1 (pre-IGF1) values exceeding the upper limit of the age- and the gender-related reference range (19) and lack of suppression of GH to <1.0 ng/ml following documented hyperglycemia during an oral glucose load.
The inclusion criteria were as follows: (1) the acromegaly patients had undergone initial TSS conducted by the same experienced surgeons in the pituitary treatment group using a microscope or an endoscope in our hospital, (2) PAs had been confirmed by postoperative pathological examination, (3) at 6 months following surgery, the patients who did not meet the postoperative endocrine remission criteria [i.e., either postoperative random GH (post-rGH) levels <1.0 ng/ml or postoperative nadir GH (post-nGH) levels <0.4 ng/ml that were associated with normal age- and gender-matched IGF1 levels] (3, 4), (4) no history of radiotherapy or medical therapy following TSS, and (5) the patients had endocrine follow-up data for more than 18 months following TSS.
After screening, a total of 306 acromegaly patients were eligible for inclusion in the study. They were randomly divided into a training dataset (n = 244), which was used for model construction, and a test dataset (n = 62), which was used for model validation (i.e., a 4:1 ratio, respectively). This study was approved by the ethical review committee of the PUMCH, and the need for patients' informed consent was waived.
Clinical Features
The following 18 relevant clinical features were collected: age, gender, tumor size, Knosp grade (20), hypertension, fasting blood glucose level, pre-rGH level, pre-IGF1 level, preoperative nadir GH (pre-nGH) level, tumor texture, cavernous sinus invasion, post-1w rGH level, post-1w IGF1 level, post-1w nGH level, Ki-67 level (<3 or ≥3%), post-6m rGH level, post-6m IGF1 level, and post-6m nGH level. The tumor size and the Knosp grade were determined using preoperative pituitary contrast-enhanced MRI images (20, 21). The cavernous sinus invasion (22) and the tumor texture (2) were determined by the surgeon during the operation. The cavernous sinus invasion of tumors was considered to be positive if the tumor extended the cavernous sinus and a cavernous sinus defect was observed (23). Tumor that could be suctioned out using an aspirator was considered as soft, while a tumor that could not be suctioned out was considered as firm (2). The Ki-67 index was defined by an immunohistochemistry assay. The definition of delayed remission is that the acromegaly patients do not meet the aforementioned endocrine remission criteria within 6 months of surgery but achieve remission during long-term follow-up (at least 18 months after surgery) without additional postoperative treatment (5). The Pearson correlation coefficient matrix between 18 clinical risk features and remission outcomes is shown in Supplementary Figure 1.
Study Design and ML Algorithms
Before developing the ML prediction model based on the 18 clinical features mentioned above, we first supplemented the missing values according to the k-nearest neighbor algorithm (11, 24). The absence of clinical features cannot exceed 8%, and patients with more than one missing value would be excluded. The continuous data were normalized by z-score normalization (25), and the categorical data were transformed via one-hot encoding (26). To address the serious imbalance in the number of patients with delayed and non-delayed remission, we intend to synthesize new patient samples of delayed remission using three commonly used resampling techniques in the training dataset: the synthetic minority oversampling technique (SMOTE), SMOTETomek, and SMOTEENN (27, 28). After data resampling, the resampling technology used in the present study was determined based on the specificity value in the ML algorithm described below.
We used the following six representative supervised ML algorithms for clinical feature screening and model construction in the training dataset: logistic regression (LR), gradient boosting decision tree (GBDT), adaptive boosting (AdaBoost), extreme gradient boost (XGBoost), categorical boosting (CatBoost), and random forest (RF) (23, 29). The detailed parameters of the six algorithms are presented in Supplementary Table 1.
Feature Selection and Model Construction
The ML predictive models for delayed remission were developed using the six algorithms on all included variables. We carried out feature selection to remove invalid features containing irrelevant or redundant information. The importance of each feature was assessed using the recursive feature elimination (RFE) algorithm, with all features being sorted according to their level of importance. After the features had been sequentially reduced in order of importance, the remaining features were introduced into the corresponding ML algorithm. We calculated the receiver operating characteristic (ROC) curves and the area under ROC (AUC) values of models with different numbers of variables. For each iteration, a random 5-fold cross-validation was performed for training dataset based on the corresponding number of clinical features. The experiment was repeated five times, and we used a grid search approach to identify the optimal parameters for each model in the training dataset (23).
We assessed the predictive performance according to the AUC, accuracy (ACC), Youden's index, and other measurement indicators (30). By comparing the AUC values of the models in the training dataset, we determined the model with the best predictive performance and externally verified it in the test dataset. DeLong test was used to compare the prediction performance of the best ML model and the Knosp grade.
Model Interpretation
ML models usually have distinctive black box and uninterpretable characteristics, which means that the function between the features and the response is invisible to the researcher (23, 31–33).
Permutation importance is an algorithm that calculates the importance score of each feature variable of the dataset (34). The permutation feature importance is defined as the decrease in a model score when a single feature value is randomly shuffled (35). This process breaks the relationship between features and goals, so the decline in model scores indicates how much the model depends on the feature. This technique benefits from the agnostic nature of the model and can be calculated multiple times with different permutations of features. We used this widely adopted method to calculate feature importance in our ML model.
We then introduced an explanation technique called local interpretable model–agnostic explanation (LIME) (36), which explains the predictions of any classifier in an interpretable and faithful manner by learning an interpretable model locally around the prediction. Intuitively, an explanation is a local linear approximation of the model's behavior. It is more straightforward to approximate it around the vicinity of a particular instance when the model is seen as a black box. LIME perturbs the instance that used to be explained and learns a sparse linear model around it as an explanation.
The SHapley Additive exPlanations (SHAP) approach is an extension of LIME; feature weights are represented as SHapley values from game theory. The SHAP approach has a high potential for rationalizing the predictions made by complex ML models (37). In the present study, we used the SHAP method to observe the influence of each feature on the prediction results during the prediction process applied to each sample.
Finally, we used a partial correlation plot (PDP) to show the marginal effects of the most important features of the prediction results from the best ML model (38). A PDP can show whether the relationship between the target and a feature is linear, monotonic, or more complex.
Statistical Analysis
We used version 2.7 of the Python Programming Language (Python Software Foundation, Wilmington, DE, USA) to develop and evaluate these ML models. Independent-sample t-tests were used to compare the differences in normal continuous features and the performance of the different ML models, and Wilcoxon test was used for non-normal continuous features.
Results
Patient Characteristics
After screening, 306 acromegaly patients who had not achieved the remission criteria within 6 months of surgery and had more than 18 months of follow-up data were identified and included in the study. The clinical characteristics of the patients (244 patients in the training dataset and 62 patients in the test dataset) are shown in Table 1. A total of 55 (17.97%) patients met the criteria for delayed remission: 46 (18.85%) patients in the training dataset and nine (14.52%) patients in the test dataset. We detected no significant interclass differences in any of the 18 clinical features between the training dataset and the test dataset (p = 0.05–0.914). The results justify the use of the two datasets as training and test datasets.
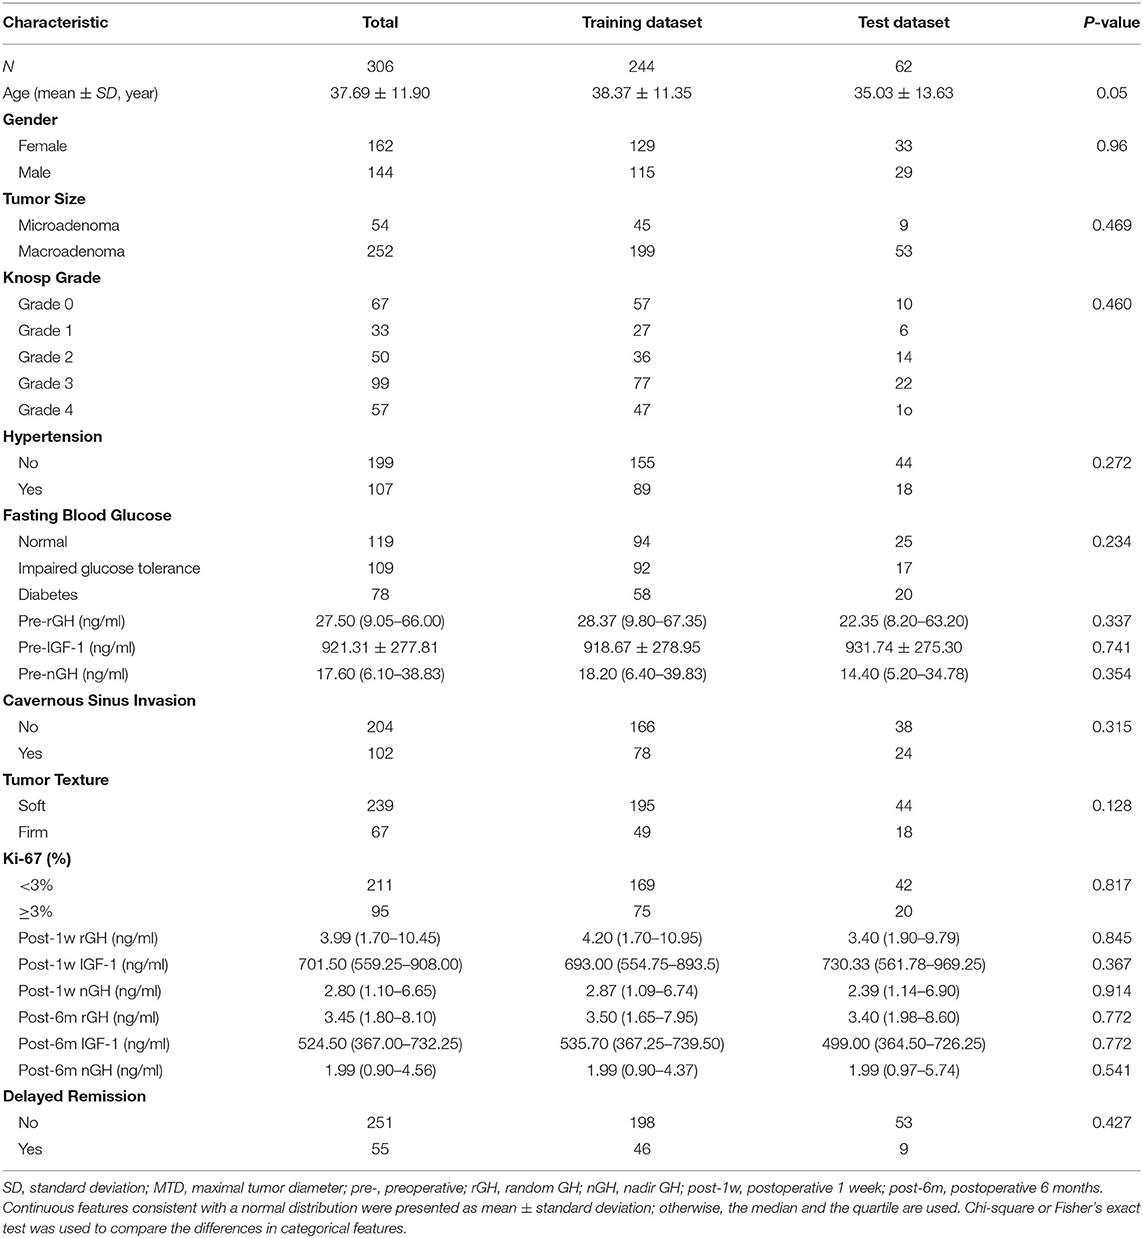
Table 1. Patients' characteristics of the training and the test datasets.
As shown in Table 2, both in the training and the test datasets, five features (post-1w rGH, post-1w nGH, post-6m rGH, post-6m IGF-1, and post-6m nGH) were significantly associated with the delayed remission of acromegaly patients (p = 0.000–0.049). Moreover, age, tumor size, Knosp grade, hypertension, pre-rGH, pre-nGH, cavernous sinus invasion, and Ki-67 index only showed a significant relationship with delayed remission in the training dataset, but there was no statistical difference in the validation dataset. However, we found no significant differences in gender, fasting blood glucose, pre-IGF-1, or tumor texture between the delayed remission and non-delayed remission groups in both the training and the test datasets (p = 0.057–0.454).
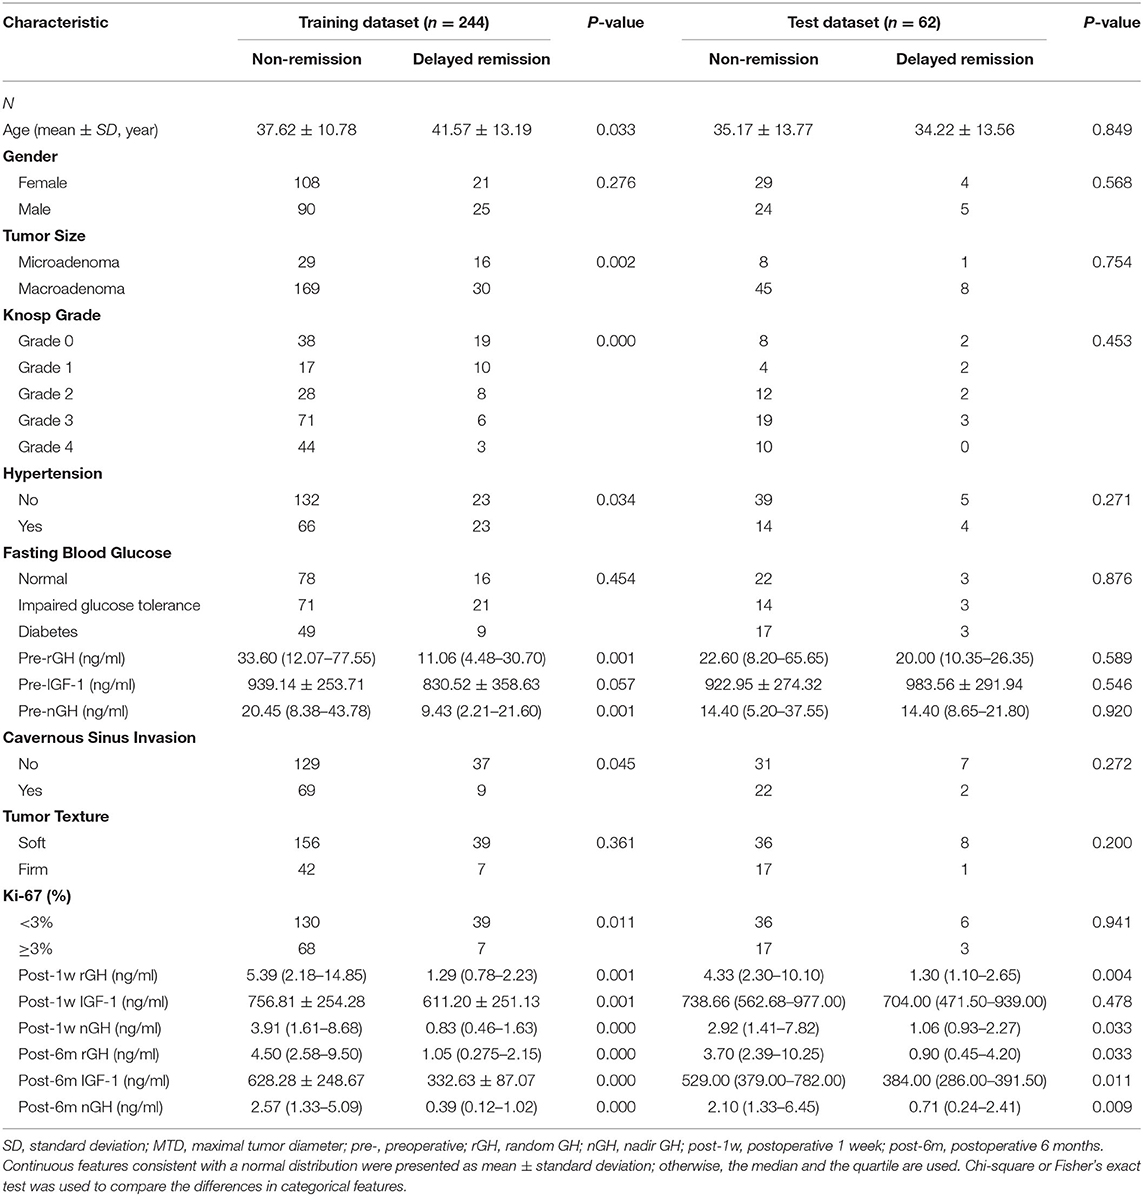
Table 2. Univariate analysis of the clinical characteristics of patients in the training and the test datasets.
Patient Resampling, Feature Selection, and Model Construction
The prediction model we build is geared to identify as many patients with acromegaly as possible with delayed remission, so the sensitivity of the model is particularly important. The evaluation of three resampling methods in six ML algorithms revealed that the SMOTEENN method had the highest sensitivity values in all six ML models (Table 3). Therefore, we chose the SMOTEENN algorithm as the most suitable resampling method for the training dataset in the present study because it was less susceptible to overfitting and had a higher prediction performance than the other resampling methods.
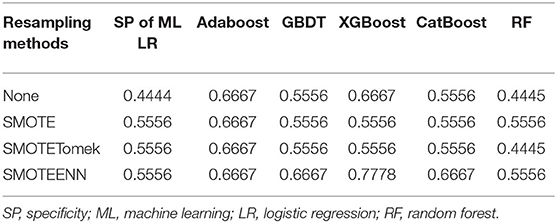
Table 3. The performance of multiple resampling methods on the six ML models.
The 18 available features in the training dataset were used to build delayed remission prediction models based on six ML algorithms. Through the process of RFE feature selection, we determined the optimal feature numbers and AUCs of each algorithm in the training dataset. The best predictive performance was observed in LR (AUC = 0.9060), followed by XGBoost (AUC = 0.8968), CatBoost (AUC = 0.8925), GBDT (AUC = 0.8861), RF (AUC = 0.8647), and AdaBoost (AUC = 0.7313) in the training dataset (Figure 1A).
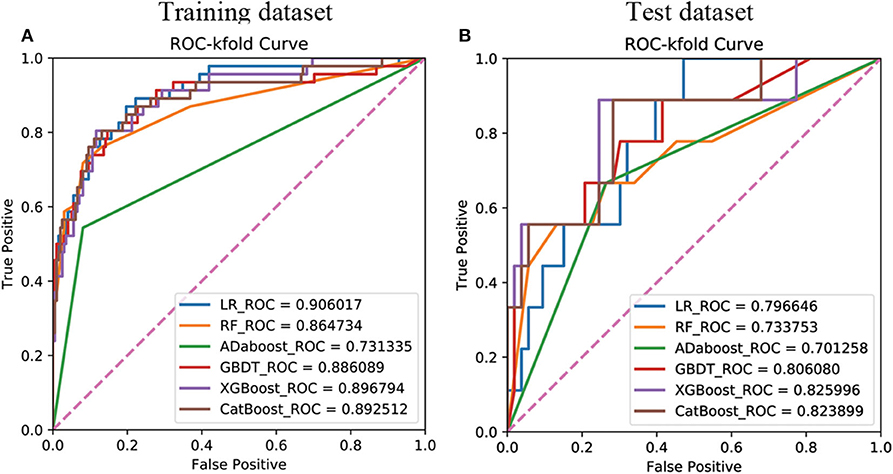
Figure 1. Receiver operating characteristic curves showing the delayed remission predictive performance of six machine learning algorithms based on the selected significant features in the training (A) and test (B) datasets. LR, logistic regression; GBDT, gradient boosting decision tree; XGBoost, extreme gradient boost; AdaBoost, adaptive boosting; CatBoost, categorical boosting.
We then verified the performance of these models in the test dataset and the AUC, ACC, sensitivity, and specificity of each ML model in the test dataset, as shown in Table 4. The results revealed that the prediction model with the highest AUC, sensitivity, and Youden's index was the XGboost model, based on the top 15 important clinical features (AUC = 0.8349, sensitivity = 0.8889, Youden's index = 0.6842) in the test dataset. However, we observed the highest values of ACC (0.7903) and specificity (0.8302) when the LR model contained all 18 clinical features in the test dataset (Figure 1B).
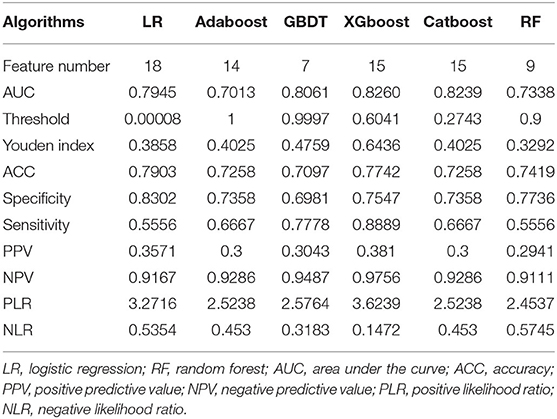
Table 4. The best performance of the six ML algorithms in the test dataset.
The results of the DeLong test suggested that the prediction performance of the XGboost model was significantly better than that of using only the Knosp grade in the training dataset (AUC = 0.7130) and the test dataset (AUC = 0.665). Finally, as described above, according to the best sensitivity, we choose XGboost model as our final prediction model.
Feature Importance
After the application of the classifier-specific feature evaluator for the XGboost model, the included features were ranked based on their information gain; the results of permutation importance demonstrated that the top two risk features were post-6m IGF-1 and post-6m nGH (Figure 2A).
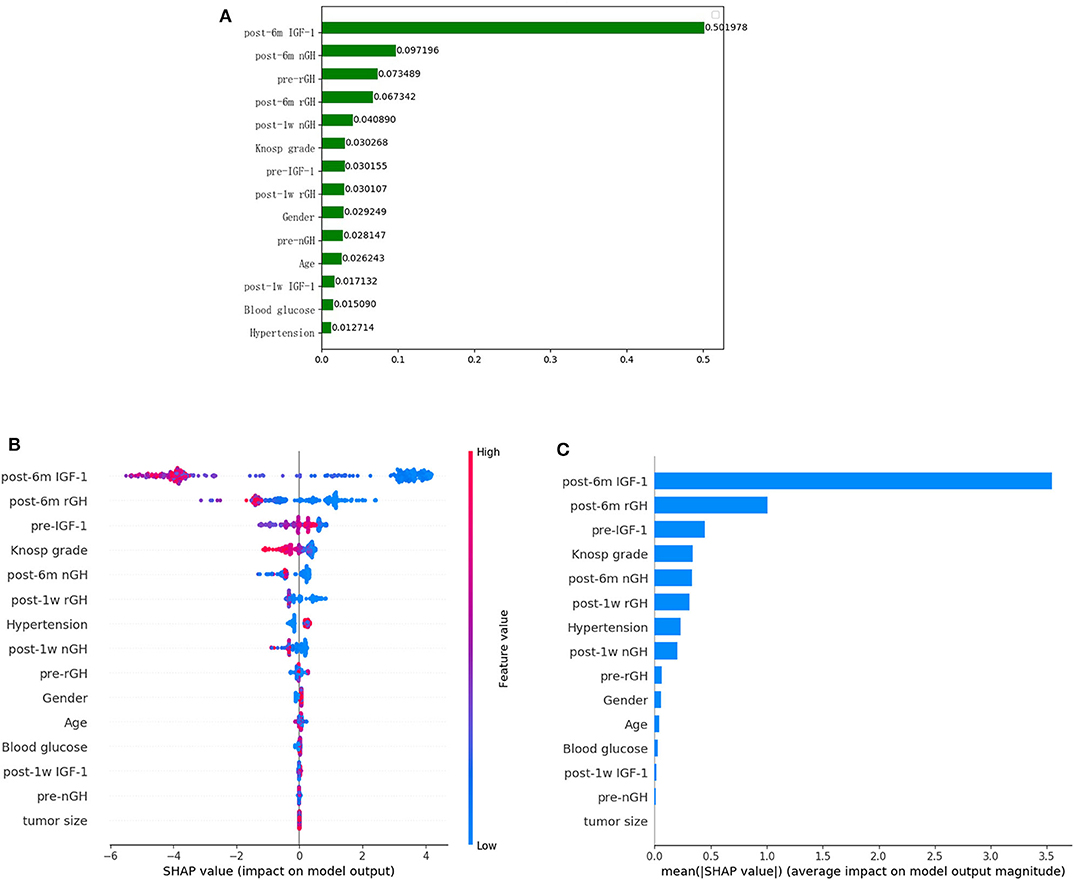
Figure 2. Feature importance ranking based on permutation importance (A) and SHapley Additive exPlanations (SHAP) values (B,C) in XGboost model. (A) The features are ranked based on the permutation importance method in the XGboost model. (B) The features are ranked according to the sum of the SHAP values for all patients, and the SHAP values are used to show the distribution of the effect of each feature on the XGboost model outputs. Red indicates that the value of a feature is high, and blue indicates that the value of a feature is low. The x-axis indicates the effect of SHAP values on the model output. The larger the value of the x-axis, the greater the probability of delayed remission. (C) Standard bar charts were drawn and sorted using the average absolute value of the shape values of each feature in the XGboost model.
To further understand and get an overview on the importance of the features, we implemented the SHAP algorithm, which can identify and map clinical features to the molecular graphs by increasing or decreasing the probability of the predicted activities, thereby enabling the visualization of structural patterns that determine predictions. The top two risk features were post-6m IGF1 and post-6m rGH, as shown in Figures 2B, C; the lower the values of the two features, the more likely the chance of delayed remission.
Univariate and multivariate logistic regression analysis was used to determine the independent clinical risk variables for delayed remission. Similar to the previous results of SHAP, we found a significant association between delayed remission and post-6m IGF1 (OR = 0.991, 95% CI 0.987–0.995, p = 0.000), which means that high post-6m IGF1 tends to achieve a lower delayed remission ratio. Another significant predictor is post-6m nGH; a lower post-6m rGH value is linked to a higher delayed remission ratio (OR = 0.615, 95% CI 0.437–0.866, p = 0.005) (Table 5).
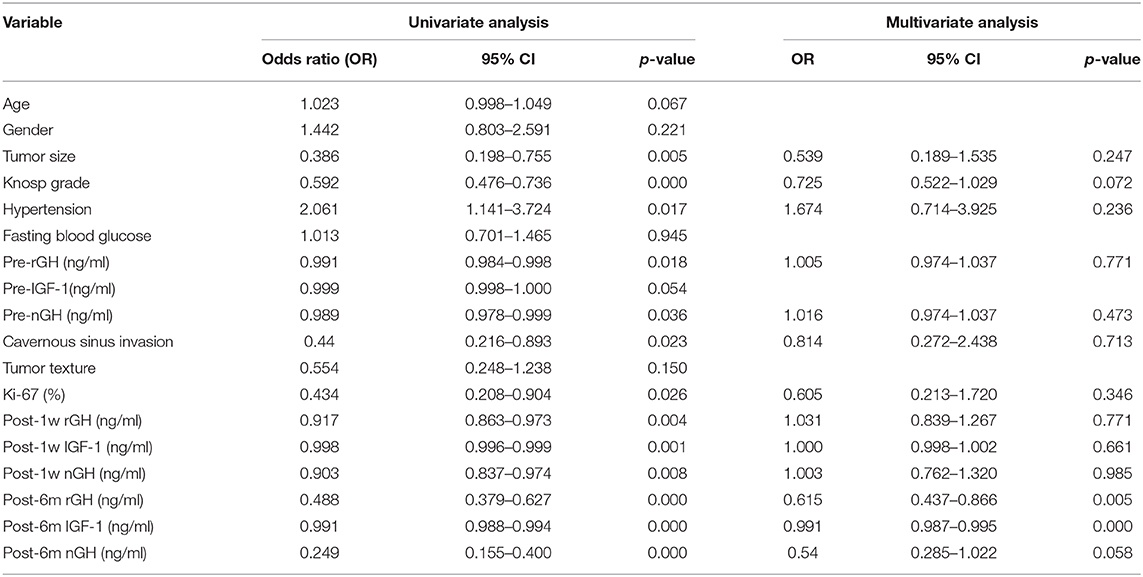
Table 5. Univariate and multivariate analyses measure the correlation between the clinical features and the delayed remission.
Model Interpretation
We used LIME to investigate the feature contributions of each prediction. First, in the test dataset, we presented two patients that had been correctly predicted by the XGBoost prediction models. Usually, the interpretations generated by correctly predicted patients are intuitive and clear: patient 1 from the “true positive” group was correctly predicted as having a high probability of delayed remission (Figure 3A), and patient 2 from the “true negative” group was correctly predicted as having a low probability of delayed remission (Figure 3B).
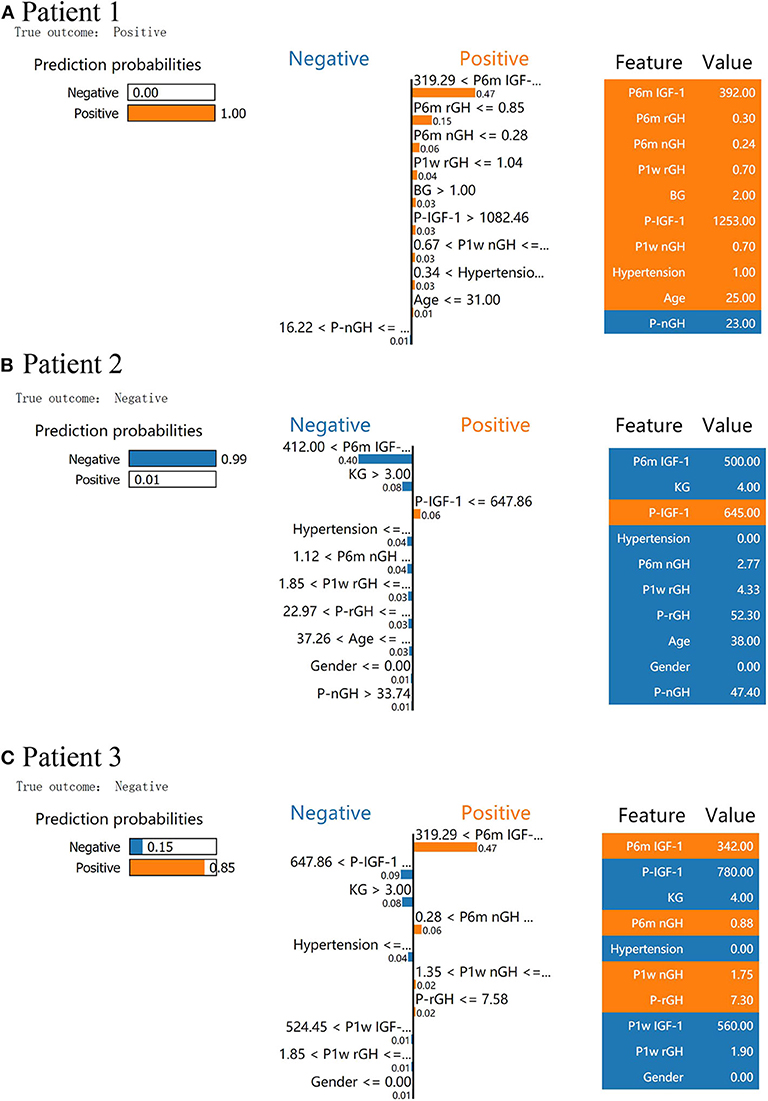
Figure 3. Results of local interpretable model–agnostic explanation (LIME) with XGBoost classifiers applied to two correctly predicted patients [one negative (non-delayed remission) and one positive (delayed remission) patient)] and one incorrectly predicted patient (non-delayed remission patient, incorrectly predicted with high probabilities of delayed remission). The figure reveals the role of various features in the incidence of delayed remission in each patient. The first column represents the prediction probabilities of negative and positive results achieved from the classifiers. The second column shows the contributions made by the features included in the models to the probability. The third column displays the original data values of these features. (A) LIME explanation for patient 1 as true positive, (B) LIME explanation for patient 2 as true negative, and (C) LIME explanation for patient 3 as false positive.
In Figure 3A, XGboost predicts a 100% probability of delayed remission in patient 1, and the prediction is mainly based on post-6m IGF1 = 392.00 ng/ml, post-6m rGH = 0.3 < 0.85 ng/ml, and post-3m nGH = 0.24 < 0.28 ng/ml. We found delayed remission in patient 1 during follow-up, and the XGBoost model accurately predicted delayed remission in patient 1. After follow-up, patient 2 did not achieve delayed remission, and XGBoost predicted a 99% probability of non-delayed remission (Figure 3B). According to the data for patient 2, post-6m IGF1 = 500.00 > 412.00 ng/ml, Knosp grade = 4 > 3, and post-6m nGH > 1.12, which contribute to the negative prediction.
An understanding of the reason behind the incorrect interpretation of the model prediction will increase the clinicians' trust in model behavior and performance. After checking, the XGboost model was correct in predicting all patients with delayed remission in the test dataset. Therefore, we presented a patient 3 with “false positive” predictions (non-delayed remission patient, incorrectly predicted with high probabilities of delayed remission) by the XGBoost model (Figure 3C). The results showed that post-6m IGF1, post-6m nGH, post-1w nGH, and pre-1rGH were the most influential features that caused the prediction error in the XGboost model.
Partial Correlation Plot
We fitted an XGBoost model to predict delayed remission and used PDP to visualize the relationships learned by the model. The influence and the marginal effect of post-6m IGF1 and post-6m rGH—the two most important features of the model—on the predicted delayed remission are presented in Figure 4. The results showed that, as the values continued to increase, the effect of post-6m IGF1 and post-6m rGH on the model gradually increased: the higher the value of post-6m IGF1 or post-6m rGH, the lower the delayed remission probability. However, when the value of post-6m IGF1increased above 510 ng/ml (Figure 4A) or the value of post-6m rGH increased above 7.0 ng/ml (Figure 4B), the effect tended to remain constant. These results make sense in the context of the clinical prediction of delayed remission and support the reliability of our prediction models.
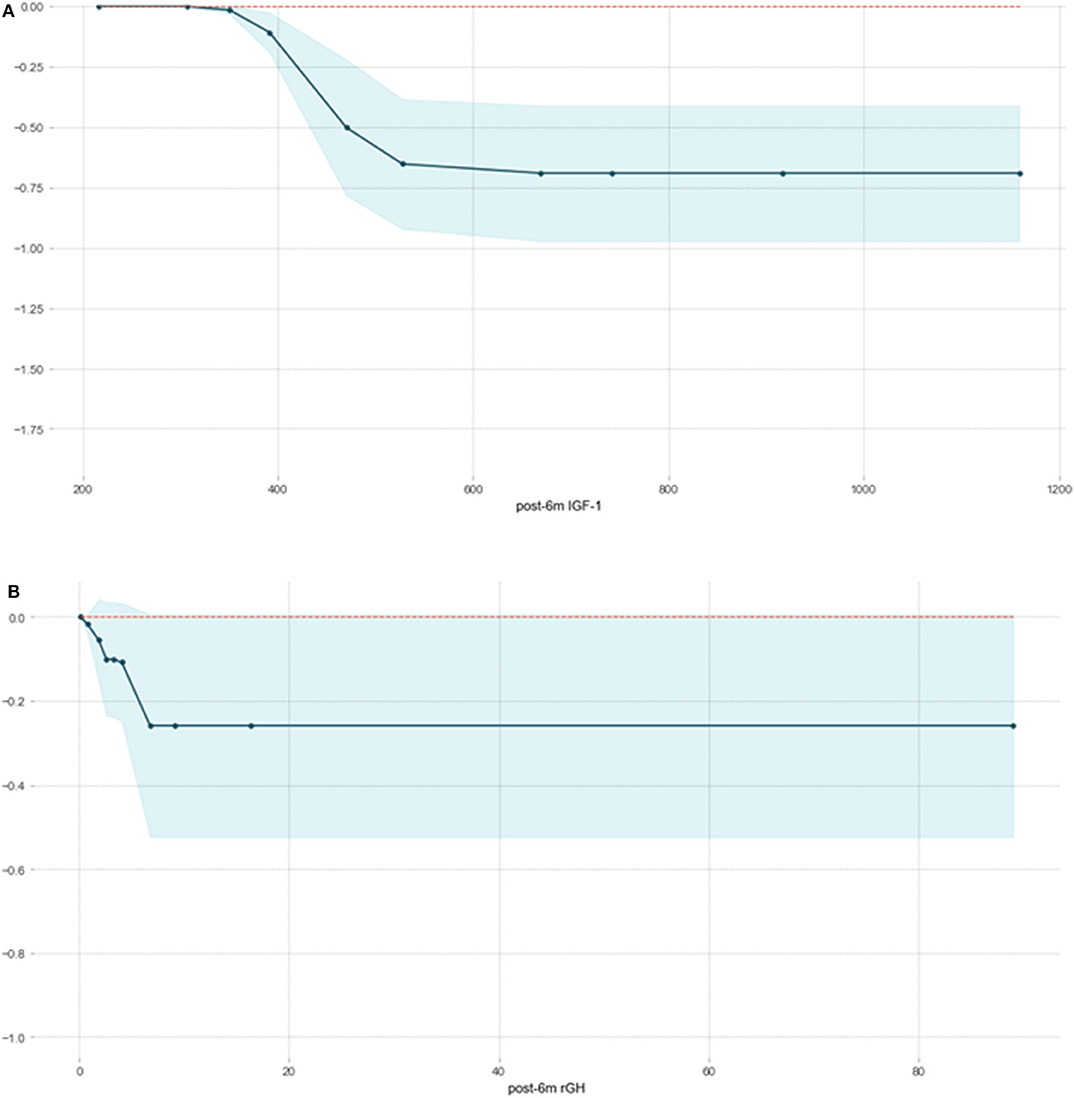
Figure 4. Partial correlation plot of delayed remission probability based on post-6m IGF1 (A) and post-6m rGH (B) in the XGBoost model. The y-axis represents the predicted probability compared with the baseline, and the x-axis represents the value of post-6m IGF1or post-6m rGH. The blue areas represent confidence intervals.
Discussion
In the present study, we developed and validated six ML models for predicting whether acromegaly patients who had not achieved remission in 6 months after TSS would experience delayed remission in long-term follow-up. The XGboost model demonstrated favorable performance as an effective non-invasive tool for determining individual treatment strategies for acromegaly patients.
As already mentioned, according to the current endocrine guidelines, it is customary to judge a patient's surgical response on whether they will achieve endocrine remission within at least 3 months after surgery (3). Patients who have not been cured by surgery usually require further postoperative treatment to control the symptoms and the progression of acromegaly (39). However, some acromegaly patients experience delayed remission without adjuvant postoperative therapy during long-term follow-up (5). The underlying mechanism of delayed remission in acromegaly after TSS remains unclear. One possible hypothesis for delayed remission is that it takes longer than expected for IGF1 levels to return to normal (7). Another hypothesis is that there are still some residual GH-secreting tumor cells after pituitary adenoma resection. Although the GH level is decreased after the operation, it is still higher than the normal range, so the patients cannot reach the remission standard in the short time after the operation. However, because the previous operation destroyed the blood supply of tumor cells, resulting in tumor cell ischemia and necrosis, the secretion level of GH gradually decreased, and then these patients eventually found in long-term follow-up that delayed remission was achieved without postoperative adjuvant treatment (5). Delayed remission may affect a doctor's ability to judge the surgical response and to determine whether the patient requires postoperative adjuvant therapy. Therefore, the accurate identification of delayed remission in short-term “unremission” acromegaly patients can be helpful with regard to decisions on long-term follow-up and treatment strategies.
Previous studies have focused on the retrospective analysis of clinical risk factors and their associations with delayed remission. Wang et al. found that the values of Knosp grade, post-1w rGH, post-1w nGH, post-3m rGH, post-3m IGF1, and post-3m nGH differed significantly between a delayed remission group and a persistent non-remission group (5). Shen et al. found that post-3m IGF1 can be used as a predictor of delayed remission in long-term follow-up (6). The two studies (5, 6) used 3 months as the observation time for postoperative remission, which was too short. Moreover, it is generally believed that a prognosis should not be determined by only one risk factor and that the combined analysis of multiple features is more valuable (40). To date, many studies have demonstrated that the ML approach provides more accurate predictive power than conventional methods with regard to the diagnosis, treatment, and prognosis of saddle region diseases (18) and multiple tumors (12, 41, 42). However, no predictive models for delayed remission in acromegaly patients have been developed. Therefore, in the present study, we retrospectively included 306 acromegaly patients who had not met the remission criteria within 6 months of surgery and established six delayed remission ML prediction models based on 18 clinical features. The six models maintained high performance, with AUCs ranging from 0.7013 to 0.8260 and ACCs ranging from 0.7097 to 0.7903 in the test dataset. The multiple clinical risk features prediction model with the highest AUC, sensitivity, and Youden's index was XGboost, and the prediction performance of the XGboost model was significantly better than that of using only the Knosp grade. The XGboost model showed the best predictive performance and was determined to be the final model used for this study and for clinical use.
Our research has some advantages. First, as with the results of previous studies, the ratio of patients with delayed remission to those with persistent non-remission was 55:251, which demonstrates a significant data imbalance in our data. When performing ML on unbalanced datasets, a small number of samples may not be detected, resulting in learning failure (43). The SMOTE technique can generate a minority class within overlapping areas and is a promising method for dealing with imbalanced datasets. Previous research has demonstrated that SMOTE can also help solve the problem of dataset imbalance in the medical field, such as in the context of type 2 diabetes prediction (44) and lung nodule recognition (45). In the present study, for the patients in the minority class (the delayed remission group), the SMOTE algorithm was able to find k samples (usually five) closest in distance to the minority sample. The distance between the minority sample and its nearest five neighbors was obtained from the standard Euclidean distance. As demonstrated by Ramezankhani et al. (44), synthetic new samples are generated according to the variables and the distance between a minority sample and its nearest neighbor. SMOTEENN and SMOTETomek are new methods derived from SMOTE and aim to eliminate the potentially poor-quality samples generated by SMOTE (27, 28, 46). These generated patients are created based on the characteristics of the original dataset, so they are similar to the original patients in the minority class (the delayed remission group) (47). Based on the evaluation of these three resampling methods of the six ML algorithms, we confirmed that SMOTEENN was the most suitable method for the data in our study.
Second, one disadvantage of ML is that it is considered as a “black box” without a transparent interpretation of the learning process or the outputs, and the function between the clinical features and the response is invisible to the doctor (48). However, it is necessary for doctors to understand the reasons for the ML models to make such predictions in clinical settings and to provide expert knowledge-based validation for the interpretation of ML model outputs. Therefore, in the present study, we first introduced SHAP—a conceptual new agnostic interpretation method—to explain the output-delayed remission prediction ML models. Before SHAP was widely used, researchers often used feature importance or partial dependence plots to explain the ML model. However, although these methods reveal the contribution made by their features to the predictive ability of the model, it is impossible to judge whether the influence of these features on the final forecast is positive or negative. In 2017, Lundberg and Lee proposed the wide application of the SHAP method to explain various complex models (including the black box model). SHAP connects game theory with local explanations, uniting several previous methods, and representing the possible consistent and locally accurate additive feature attribution method based on expectations (49). Compared with conventional feature importance, SHAP has the following two advantages: First, it solves the problem of multicollinearity: it considers not only the influence of a single feature but also the synergy between features. Second, it clarifies whether the influence of a feature is positive or negative. In the present research, we used SHAP to explain why the XGboost model exhibited the best performance and found that the top two risk features were post-6m IGF1 and post-6m rGH; the lower the values of these two features, the greater the likelihood of delayed remission. This result is consistent with clinical cognition and the results from previous studies (5, 6) and clinical practice and further verifies the reliability of the XGboost model. It also demonstrated that the hormone level within 1 week after surgery has poor performance in predicting the long-term prognosis of patients with acromegaly, and the hormone level at 6 months after surgery can play a more important role.
Moreover, it is well-known that explaining the prediction of the black box ML model has become a key issue and is gaining momentum. In particular, achieving the best performance of ML models is not the only focus of data scientists. People are increasingly concerned about the need to explain the predictions of black-box ML models at the global and the local levels (50). Therefore, we introduced a technique called LIME (51), which explains the predictions of any classifier in an interpretable and faithful manner by learning an interpretable model locally around the prediction. Intuitively, an explanation is a local linear approximation of the model's behavior. It is more straightforward to approximate it around the vicinity of a particular instance when the model is seen as a black box. LIME perturbs the instance that used to be explained and learns a sparse linear model around it as an explanation. In the present study, we used the LIME technique to clarify the explanations produced by two correctly predicted patients and to understand the causes and the explanations of the model's incorrect prediction, which will greatly increase a clinician's trust in model behavior and performance. Finally, PDP was used to explain the marginal effects of post-6m IGF1 and post-6m rGH, the two most important features of the XGBoost model. This makes sense in the context of the clinical prediction of delayed remission and helps to confirm the reliability of our prediction models. Furthermore, compared with a simple correlation analysis between clinical factors and prognosis, our ML model has the ability to discover and integrate clinical features that are meaningful for prognosis and can give specific prognostic probability values.
The present study also has some limitations. First, this is a single-center retrospective study involving a small number of patients, so more patients from multiple sources are required to validate the robustness and the repeatability of our model. Second, prospective studies are needed to help confirm the reliability of our model. Third, the follow-up period (at least 18 months post-operation) was relatively short. Because patients who have not achieved remission for a long time after surgery usually undergo adjuvant therapy and therefore would not meet the inclusion criteria of the present study and because ML algorithms need a relatively large sample size to avoid overfitting, we decided to evaluate patients who were followed up for ≥18 months to obtain a larger sample. Finally, in future studies, clinical ML models should be combined with radiomics to build a more comprehensive and accurate predictive model.
Conclusion
In conclusion, it is feasible to use ML-based model to predict delayed remission or persistent active disease in patients with acromegaly whose remission status is uncertain. The use of ML model containing multiple clinical features can serve as an effective non-invasive approach to predict delayed remission and could aid in determining individual treatment and follow-up strategies for acromegaly patients who have not achieved remission within 6 months of surgery.
Data Availability Statement
The raw data supporting the conclusions of this article will be made available by the authors, without undue reservation.
Ethics Statement
The studies involving human participants were reviewed and approved by the Ethical Review Committee of Peking Union Medical College Hospital. Written informed consent for participation was not required for this study in accordance with the national legislation and the institutional requirements.
Author Contributions
CD, YF, and YaL revised the manuscript for important intellectual content. RW and MF take final responsibility for this article. All authors provided contributions to study conception, design, acquisition of data, analysis, interpretation of data, drafting of the article, revising it critically for important intellectual content, and final approval of the version to be published.
Funding
This work was supported by the Graduate Innovation Fund of Peking Union Medical College (2018-1002-01-10), Natural Science Foundation of Beijing Municipality (grant no. 7182137), Capital Characteristic Clinic Project (grant no. Z16100000516092), and Chinese Academy of Medical Sciences (grant no. 2017-I2M-3-014).
Conflict of Interest
YiL, YaL, and MS were employed by the company DHC Mediway Technology Co., Ltd.
The remaining authors declare that the research was conducted in the absence of any commercial or financial relationships that could be construed as a potential conflict of interest.
Acknowledgments
We thank Frank Kitching, MSc., from Liwen Bianji, Edanz Editing China (www.liwenbianji.cn/ac), for editing the English text of a draft of this manuscript.
Supplementary Material
The Supplementary Material for this article can be found online at: https://www.frontiersin.org/articles/10.3389/fendo.2020.00643/full#supplementary-material
Supplementary Figure 1. The Pearson correlation coefficient matrix between 18 risk characteristics and mitigation outcomes. Blue indicates a positive correlation, and red indicates a negative correlation. The darker the color, the greater the absolute value of the correlation coefficient and the closer the corresponding features are.
Abbreviations
PAs, pituitary adenomas; IGF1, insulin-like growth factor 1; GH, growth hormone; OGTT, oral glucose tolerance test; post-3m, postoperative 3 months; ML, machine learning; MRI, magnetic resonance imaging; pre-rGH, preoperative random GH; pre-nGH, preoperative nadir GH; post-rGH, postoperative random GH; post-nGH, postoperative nadir GH; MTD, maximal tumor diameter; IHC, immunohistochemistry; KNN, k-nearest neighbor; LR, logistic regression; GBDT, gradient boosting decision tree; XGBoost, extreme gradient boost; AdaBoost, adaptive boosting; CatBoost, categorical boosting; RF, random forest; RFE, recursive feature elimination; AUC, area under curve; ACC, accuracy; PPV, positive predictive value; NPV, negative predictive value; PLR, positive likelihood ratio; NLR, negative likelihood ratio; LIME, local interpretable model–agnostic explanation; SHAP, SHapley Additive exPlanations; PDP, partial correlation plot.
References
1. Molitch ME. Diagnosis and treatment of pituitary adenomas: a review. JAMA. (2017) 317:516–24. doi: 10.1001/jama.2016.19699
2. Fan Y, Hua M, Mou A, Wu M, Liu X, Bao X, et al. Preoperative noninvasive radiomics approach predicts tumor consistency in patients with acromegaly: development and multicenter prospective validation. Front Endocrinol. (2019) 10:403. doi: 10.3389/fendo.2019.00403
3. Katznelson L, Laws ER Jr, Melmed S, Molitch ME, Murad MH, et al. Acromegaly: an endocrine society clinical practice guideline. J Clin Endocrinol Metab. (2014) 99:3933–51. doi: 10.1210/jc.2014-2700
4. Melmed S, Bronstein MD, Chanson P, Klibanski A, Casanueva FF, Wass JAH, et al. A consensus statement on acromegaly therapeutic outcomes. Nat Rev Endocrinol. (2018) 14:552–61. doi: 10.1038/s41574-018-0058-5
5. Wang Z, Guo X, Gao L, Feng C, Lian W, Deng K, et al. Delayed remission of growth hormone-secreting pituitary adenoma after transsphenoidal adenectomy. World Neurosurg. (2019) 122:e1137–45. doi: 10.1016/j.wneu.2018.11.004
6. Shen M, Tang Y, Shou X, Wang M, Zhang Q, Qiao N, et al. Surgical results and predictors of initial and delayed remission for growth hormone-secreting pituitary adenomas using the Consensus criteria in 162 patients from a single center. World Neurosurg. (2018). doi: 10.1016/j.wneu.2018.11.179. [Epub ahead of print].
7. Nishioka H, Fukuhara N, Yamaguchi-Okada M, Takeshita A, Takeuchi Y, Yamada S. Pitfalls in early biochemical evaluation after transsphenoidal surgery in patients with acromegaly. Endocr J. (2017) 64:1073–8. doi: 10.1507/endocrj.EJ17-0261
8. Birkhahn M, Mitra AP, Cote RJ. Molecular markers for bladder cancer: the road to a multimarker approach. Expert Rev Anticancer Ther. (2007) 7:1717–27. doi: 10.1586/14737140.7.12.1717
9. Huang Y, Liu Z, He L, Chen X, Pan D, Ma Z, et al. Radiomics signature: a potential biomarker for the prediction of disease-free survival in early-stage (I or II) non-small cell lung cancer. Radiology. (2016) 281:947–57. doi: 10.1148/radiol.2016152234
10. Al'Aref SJ, Anchouche K, Singh G, Slomka PJ, Kolli KK, Kumar A, et al. Clinical applications of machine learning in cardiovascular disease and its relevance to cardiac imaging. Eur Heart J. (2019) 40:1975–86. doi: 10.1093/eurheartj/ehy404
11. Fan Y, Li Y, Li Y, Feng S, Bao X, Feng M, et al. Development and assessment of machine learning algorithms for predicting remission after transsphenoidal surgery among patients with acromegaly. Endocrine. (2019) 67:412–22. doi: 10.1007/s12020-019-02121-6
12. Li Y, Ge D, Gu J, Xu F, Zhu Q, Lu C. A large cohort study identifying a novel prognosis prediction model for lung adenocarcinoma through machine learning strategies. BMC Cancer. (2019) 19:886. doi: 10.1186/s12885-019-6101-7
13. Ferroni P, Zanzotto FM, Riondino S, Scarpato N, Guadagni F, Roselli M. Breast cancer prognosis using a machine learning approach. Cancers. (2019) 11:328. doi: 10.3390/cancers11030328
14. Shi L, Zhang Y, Nie K, Sun X, Niu T, Yue N, et al. Machine learning for prediction of chemoradiation therapy response in rectal cancer using pre-treatment and mid-radiation multi-parametric MRI. Magn Reson Imaging. (2019) 61:33–40. doi: 10.1016/j.mri.2019.05.003
15. Fan Y, Jiang S, Hua M, Feng S, Feng M, Wang R. Machine learning-based radiomics predicts radiotherapeutic response in patients with acromegaly. Front Endocrinol. (2019) 10:588. doi: 10.3389/fendo.2019.00588
16. Tighe D, Lewis-Morris T, Freitas A. Machine learning methods applied to audit of surgical outcomes after treatment for cancer of the head and neck. Br J Oral Maxillofac Surg. (2019) 57:771–7. doi: 10.1016/j.bjoms.2019.05.026
17. Salah HT, Muhsen IN, Salama ME, Owaidah T, Hashmi SK. Machine learning applications in the diagnosis of leukemia: current trends and future directions. Int J Lab Hematol. (2019) 41:717–25. doi: 10.1111/ijlh.13089
18. Qiao N. A systematic review on machine learning in sellar region diseases: quality and reporting items. Endocr Connect. (2019) 8:952–60. doi: 10.1530/EC-19-0156
19. Guo X, Gao L, Zhao Y, Wang M, Jiang B, Wang Q, et al. Characteristics of the upper respiratory tract in patients with acromegaly and correlations with obstructive sleep apnoea/hypopnea syndrome. Sleep Med. (2018) 48:27–34. doi: 10.1016/j.sleep.2018.04.011
20. Knosp E, Steiner E, Kitz K, Matula C. Pituitary adenomas with invasion of the cavernous sinus space: a magnetic resonance imaging classification compared with surgical findings. Neurosurgery. (1993) 33:610–7. doi: 10.1227/00006123-199310000-00008
21. Di Ieva A, Rotondo F, Syro LV, Cusimano MD, Kovacs K. Aggressive pituitary adenomas–diagnosis and emerging treatments. Nat Rev Endocrinol. (2014) 10:423–35. doi: 10.1038/nrendo.2014.64
22. Niu J, Zhang S, Ma S, Diao J, Zhou W, Tian J, et al. Preoperative prediction of cavernous sinus invasion by pituitary adenomas using a radiomics method based on magnetic resonance images. Eur Radiol. (2019) 29:1625–34. doi: 10.1007/s00330-018-5725-3
23. Liu Y, Liu X, Hong X, Liu P, Bao X, Yao Y, et al. Prediction of recurrence after transsphenoidal surgery for cushing's disease: the use of machine learning algorithms. Neuroendocrinology. (2019) 108:201–10. doi: 10.1159/000496753
24. Batista GEAPA, Monard MC. An analysis of four missing data treatment methods for supervised learning. Appl Artif Intell. (2003) 17:519–33. doi: 10.1080/713827181
25. Shalabi LA, Shaaban Z, Kasasbeh B. Data mining: a preprocessing engine. J Comput Sci. (2006) 2:735–9. doi: 10.3844/jcssp.2006.735.739
26. Okada S, Ohzeki M, Taguchi S. Efficient partition of integer optimization problems with one-hot encoding. Sci Rep. (2019) 9:13036. doi: 10.1038/s41598-019-49539-6
27. Fotouhi S, Asadi S, Kattan MW. A comprehensive data level analysis for cancer diagnosis on imbalanced data. J Biomed Inform. (2019) 90:103089. doi: 10.1016/j.jbi.2018.12.003
28. Chen T, Shi X, Wong YD. Key feature selection and risk prediction for lane-changing behaviors based on vehicles' trajectory data. Accid Anal Prev. (2019) 129:156–69. doi: 10.1016/j.aap.2019.05.017
29. Ivanov MV, Levitsky LI, Bubis JA, Gorshkov MV. Scavager: a versatile postsearch validation algorithm for shotgun proteomics based on gradient boosting. Proteomics. (2019) 19:e1800280. doi: 10.1002/pmic.201800280
30. Erturk SM. Receiver operating characteristic analysis. AJR Am J Roentgenol. (2011) 197:W784. doi: 10.2214/AJR.11.6484
31. Sun YV. Multigenic modeling of complex disease by random forests. Adv Genet. (2010) 72:73–99. doi: 10.1016/B978-0-12-380862-2.00004-7
32. Fu B, Liu P, Lin J, Deng L, Hu K, Zheng H. Predicting invasive disease-free survival for early-stage breast cancer patients using follow-up clinical data. IEEE Trans Biomed Eng. (2018) 66:2053–64. doi: 10.1109/TBME.2018.2882867
33. Chiew CJ, Liu N, Wong TH, Sim YE, Abdullah HR. Utilizing machine learning methods for preoperative prediction of postsurgical mortality and intensive care unit admission. Ann Surg. (2019). doi: 10.1097/SLA.0000000000003297. [Epub ahead of print].
34. Altmann A, Tolo, Laura I, Sander O, Lengauer T. Permutation importance: a corrected feature importance measure. Bioinformatics. (2010) 26:1340–7. doi: 10.1093/bioinformatics/btq134
36. Pan L, Liu G, Mao X, Li H, Zhang J, Liang H, et al. Development of prediction models using machine learning algorithms for girls with suspected central precocious puberty: retrospective study. JMIR Med Inform. (2019) 7:e11728. doi: 10.2196/11728
37. Rodriguez-Perez R, Bajorath J. Interpretation of compound activity predictions from complex machine learning models using local approximations and shapley values. J Med Chem. (2020) 63:8761–77. doi: 10.1021/acs.jmedchem.9b01101
38. Friedman JH. Greedy function approximation: a gradient boosting machine. Ann Stat. (2001) 29:1189–232. doi: 10.1214/aos/1013203451
39. Colao A, Ferone D, Marzullo P, Cappabianca P, Cirillo S, Boerlin V, et al. Long-term effects of depot long-acting somatostatin analog octreotide on hormone levels and tumor mass in acromegaly. J Clin Endocrinol Metab. (2001) 86:2779–86. doi: 10.1210/jc.86.6.2779
40. Fan Y, Liu Z, Hou B, Li L, Liu X, Liu Z, et al. Development and validation of an MRI-based radiomic signature for the preoperative prediction of treatment response in patients with invasive functional pituitary adenoma. Eur J Radiol. (2019) 121:108647. doi: 10.1016/j.ejrad.2019.108647
41. Burki TK. Predicting lung cancer prognosis using machine learning. Lancet Oncol. (2016) 17:e421. doi: 10.1016/S1470-2045(16)30436-3
42. Kourou K, Exarchos TP, Exarchos KP, Karamouzis MV, Fotiadis DI. Machine learning applications in cancer prognosis and prediction. Comput Struct Biotechnol J. (2015) 13:8–17. doi: 10.1016/j.csbj.2014.11.005
43. Nekooeimehr I, Lai-Yuen SK. Adaptive semi-unsupervised weighted oversampling (A-SUWO) for imbalanced datasets. Expert Syst Appl. (2016) 46:405–16. doi: 10.1016/j.eswa.2015.10.031
44. Ramezankhani A, Pournik O, Shahrabi J, Azizi F, Hadaegh F, Khalili D. The impact of oversampling with SMOTE on the performance of 3 classifiers in prediction of type 2 diabetes. Med Decis Making. (2016) 36:137–44. doi: 10.1177/0272989X14560647
45. Sui Y, Wei Y, Zhao D. Computer-aided lung nodule recognition by SVM classifier based on combination of random undersampling and SMOTE. Comput Math Methods Med. (2015) 2015:368674. doi: 10.1155/2015/368674
46. Batista GEAPA, Prati RC, Monard MC. A study of the behavior of several methods for balancing machine learning training data. ACM SIGKDD Explor Newslett. (2004) 6:20–29. doi: 10.1145/1007730.1007735
47. Chawla NV. Data mining for imbalanced datasets: an overview. In Maimon O, Rokach L, editors. Data Mining and Knowledge Discovery Handbook. Boston, MA: Springer US (2005). p. 853–67. doi: 10.1007/0-387-25465-X_40
48. Wang X, Wang D, Yao Z, Xin B, Wang B, Lan C, et al. Machine learning models for multiparametric glioma grading with quantitative result interpretations. Front Neurosci. (2018) 12:1046. doi: 10.3389/fnins.2018.01046
49. Lundberg S, Lee S-I. A unified approach to interpreting model predictions. In: Advances in Neural Information Processing Systems. Long Beach (2017).
50. Elshawi R, Al-Mallah MH, Sakr S. On the interpretability of machine learning-based model for predicting hypertension. BMC Med Inform Decis Mak. (2019) 19:146. doi: 10.1186/s12911-019-0874-0
Keywords: acromegaly, delayed remission, machine learning, LIME, SHAP
Citation: Dai C, Fan Y, Li Y, Bao X, Li Y, Su M, Yao Y, Deng K, Xing B, Feng F, Feng M and Wang R (2020) Development and Interpretation of Multiple Machine Learning Models for Predicting Postoperative Delayed Remission of Acromegaly Patients During Long-Term Follow-Up. Front. Endocrinol. 11:643. doi: 10.3389/fendo.2020.00643
Received: 03 May 2020; Accepted: 07 August 2020;
Published: 16 September 2020.
Edited by:
Gianluca Tamagno, Wexford General Hospital, IrelandReviewed by:
Pinar Kadioglu, Istanbul University-Cerrahpasa, TurkeyAleksandra Jawiarczyk-Przybyłowska, Wroclaw Medical University, Poland
Copyright © 2020 Dai, Fan, Li, Bao, Li, Su, Yao, Deng, Xing, Feng, Feng and Wang. This is an open-access article distributed under the terms of the Creative Commons Attribution License (CC BY). The use, distribution or reproduction in other forums is permitted, provided the original author(s) and the copyright owner(s) are credited and that the original publication in this journal is cited, in accordance with accepted academic practice. No use, distribution or reproduction is permitted which does not comply with these terms.
*Correspondence: Ming Feng, fengming@pumch.cn; Renzhi Wang, wangrz@126.com
†These authors have contributed equally to this work