Spatiotemporal Controls on the Urban Aerobiome
 Gwynne Á. Mhuireach
 Clarisse M. Betancourt-Román2,3
  Bart R. Johnson
- 1Department of Landscape Architecture, University of Oregon, Eugene, OR, United States
- 2Biology and Built Environment Center, University of Oregon, Eugene, OR, United States
- 3Department of Internal Medicine, Division of Infectious Diseases, University of Michigan, Ann Arbor, MI, United States
- 4Institute for a Sustainable Environment, University of Oregon, Eugene, OR, United States
Greater exposure to environmental microorganisms has been hypothesized to reduce the likelihood of developing autoimmune disorders, and vegetation is known to be a source of diverse microbiota to the air. However, the spatiotemporal dynamics of airborne microbial communities in urban environments with varying amounts and types of vegetation are poorly understood. In this study we used high-throughput sequencing of the bacterial 16S rRNA gene to assess whether fine-scale variation in urban vegetation influences the diversity, composition, or structure of airborne bacterial communities over time. We used passive settling dishes to collect airborne bacteria from 36 sites representing three urban land cover types (forest, grassland, paved) over a 3-month period in Eugene-Springfield, Oregon, USA. We used remote sensing data (aerial 4-band orthoimagery and LiDAR) and geographic information systems (GIS) to assess detailed site characteristics (e.g., total vegetation cover and structural diversity) for each site. Our initial analysis indicated that site was the most important factor explaining variation in bacterial community structure (R2 = 0.32, p < 0.001), followed by sampling date (R2 = 0.24, p < 0.001), while land cover type was a significant but weak predictor (R2 = 0.06, p < 0.001) and other vegetation metrics were even less predictive. However, when samples were analyzed separately by date, the explanatory power of land cover type increased substantially; six of nine dates showed significant effects (p < 0.05) with R2 ranging from 0.16–0.31, indicating that land cover type had a marked influence on bacterial community structure that was obscured by the effects of site and sampling date. Despite the importance of site as a predictor of bacterial community structure, Mantel tests for spatial correlation were insignificant for most sampling dates, suggesting that localized site characteristics were driving this relationship. We use our results to propose a space-time conceptual model of the interactions between site-scale environmental features (e.g., vegetation characteristics) and regional-scale temporal processes and events (e.g., agricultural harvesting) to understand and perhaps manage intraurban airborne bacterial communities.
Introduction
Humans inhale an estimated one microgram of DNA daily, which, if it all belonged to bacteria, would represent on the order of 108 bacterial genomes (Després et al., 2007). Yet little is known about the composition and diversity of airborne microorganisms—the aerobiome—particularly in outdoor urban environments. Understanding how landscape features, such as vegetation, influence the urban aerobiome may represent a new approach for improving public health. Connections between airborne microbial exposures and human health have long been recognized in the context of infectious disease (West et al., 2008), and data on the potential health benefits of certain microbial exposures are beginning to emerge (Ege et al., 2011; Hanski et al., 2012; Ruokolainen et al., 2015). Recent research suggests that microbes commonly associated with vegetation, soil, water, and wildlife are critical to human immune function (Sorci et al., 2016; Rook et al., 2017). A lack of adequate childhood immune priming through exposure to environmental microbes has been implicated in a variety of autoimmune disorders later in life, including allergies, asthma, and mental disorders (Haahtela et al., 2013; Raison and Miller, 2013; Rook, 2013).
Is it possible to manage the urban aerobiome through managing the landscape? The answer to this question depends, in part, on whether landscape design influences the local aerobiome. Although we know that regional aerobiome composition varies dynamically across space and time in association with factors such as land use, meteorological conditions, and season (Burrows et al., 2009; Bowers et al., 2010), few studies have investigated these interactions at a fine spatial scale. Vegetation represents a substantial source of airborne microorganisms (Lindemann et al., 1982; Lindemann and Upper, 1985; Pedgley, 1991). The global phyllosphere hosts up to 1026 microorganisms (Morris and Kinkel, 2002), which may be released to the air via evapotranspiration, wind, rain, and other processes. Vegetation is comprised of numerous plant species, each of which may host distinct microbial communities (Lambais et al., 2014; Laforest-Lapointe et al., 2016) and may have differential rates of microbial emission to the air (Kinkel, 1997). Although some studies have found striking contrasts between microbial composition on plant leaves and in nearby air (Vokou et al., 2012), others have found that a significant fraction of airborne bacteria originates from nearby vegetation (Lymperopoulou et al., 2016). We might therefore hypothesize that urban neighborhoods with varying proportions of vegetated vs. sealed soils or different types of vegetation would have different aerobiome composition and/or diversity (Mhuireach et al., 2016).
To date, most studies have investigated only a limited number of sites and land cover types, usually at single points in time. The propensity for different land cover types to harbor distinctive airborne microbial communities that maintain a detectable signal over time remains poorly understood. Furthermore, although differences in microbial communities have been observed across large-scale land uses like agricultural vs. urban (Bowers et al., 2010), few studies have examined whether there is substantial variation in community composition or structure across typical intraurban land cover types or vegetation cover at the scale of the city block or neighborhood. Importantly, the most appropriate vegetation metric(s) for capturing site-scale influences on aerobiome community structure are largely unknown, e.g., the cover of surrounding vegetation as seen from above, its structural diversity, or its species composition.
In this study, we investigated the influence of land cover and vegetation on urban airborne bacterial communities across space and time. Our primary objectives were to determine: (a) whether common urban land cover types representing extremes of vegetation cover, type, and diversity (i.e., forest, grassland, paved) exhibited differences in airborne bacterial richness or structure1 over time; (b) which metrics best captured landscape features that influenced bacterial community structure over time; and (c) which bacterial taxa contributed to differences in community structure across land cover types. A greater understanding of urban aerobiome assembly will be foundational for designers, planners and land managers to one day engineer green spaces that promote public health.
Methods
Overview and Site Descriptions
The study took place in the Eugene-Springfield metropolitan area of Oregon, USA, during July-September, 2015. Eugene-Springfield is located in the Willamette Valley, a region known for its agriculture, especially grass seed production, and its forests. The study area has a Mediterranean climate (Köppen climate class Csb; Kottek et al., 2006); weather during the sampling period is typically warm and dry, with winds blowing primarily from the north until the wet-season precipitation begins in late summer/early fall and winds shift to originate from the south-southwest.
A total of 36 urban sites were selected, representing three land cover types—forest, grassland (e.g., urban turf or meadow), and paved. We attempted to select sampling sites such that vegetated sites (forest and grassland) had >75% vegetation cover within a 50-meter radius and non-vegetated sites (paved) had <25% (Supplementary Figure 1). Within the vegetated sites, forest and grassland differed by both plant species' composition and vertical structural diversity. Furthermore, we stratified the sites across a broad range of vegetation cover within the greater surrounding context (i.e., within 800 m), so that not all vegetated sites sat within large areas of high vegetation cover and not all paved sites sat within large areas of low vegetation cover.
Site locations were chosen to disperse samples of each land cover type across the study area (Figure 1). The majority of forest and grass sites were publicly owned parks and natural areas, while the paved sites were all privately owned business parking lots. Samples were collected in 2015 on July 14 (pilot), August 4, 14, 18, and 25, and September 1, 15, 22, and 29. The 36 sites were split into two groups of 18 to allow for set-up and take-down of all sampling stations within a specified time window while achieving adequate spatial representation. Samples were collected from each group every other sampling day during August and September, for a total of four samples per site, not including the July samples (Supplementary Table 1).
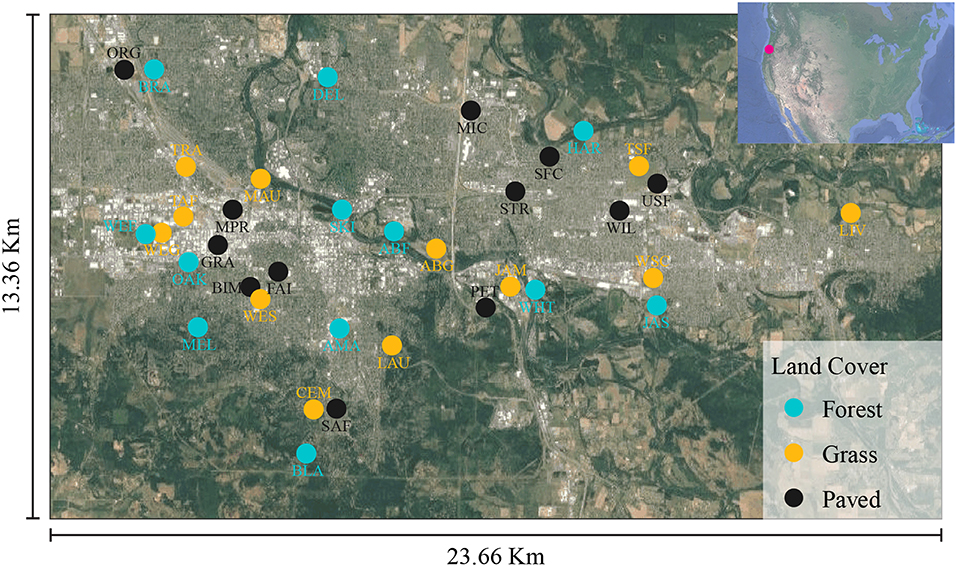
Figure 1. Sample selection criteria and site locations in Eugene-Springfield, Oregon, USA.
Vegetation Analysis
Vegetation analyses were performed using ArcGIS 10.3 (ESRI, 2011) and FUSION (McGaughey, 2016). Vegetation cover within 50, 100, 200, 400, and 800-meter circular buffer zones (i.e., radii from sampling point) around each site was measured by summing the proportions of trees and shrubs, green grass, and senesced grass within each buffer zone (Figure 2A). To do this, we differentiated land cover into six categories (trees and shrubs, green grass, senesced grass, dirt, and light-colored and dark-colored built surfaces) using pixel-based supervised classification with maximum likelihood estimation of aerial 4-band orthoimagery (acquired from National Agriculture Imagery Program). Water was lumped into the dark-colored built surface category because separating it was not important to our study and is difficult to accurately achieve. All sites were visited in person for ground-truthing and classification accuracy was validated at numerous (~30) random locations within the GIS map by comparing classified pixels with known values. One site (WSC) was found to be artificial turf rather than living vegetation and was excluded from microbial analyses.
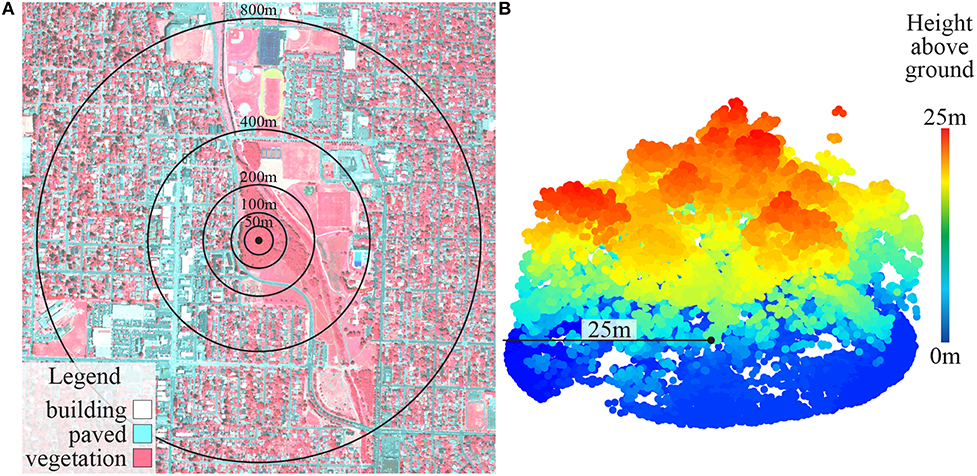
Figure 2. (A) False color vegetation map (site AMA) with buffer zones; and (B) LiDAR point cloud showing vertical vegetation structure (site ABF).
Vegetation structural diversity within 25-m buffers for forest and grassland sites was measured using LiDAR (Light Detection And Ranging) point clouds (Figure 2B) obtained from the Oregon Department of Geology and Mineral Industries (DOGAMI). We extracted vertical cylinders from the point cloud and partitioned all the points into 1.5-m height bins. The number of points within each height bin was used to calculate a Shannon-Wiener index of vertical structural diversity for each site. Plant species composition within a 25-m radius of the sampling point was recorded with ocular estimates of cover using Daubenmire (1959) cover classes with the Bailey and Poulton (1968) modification. Plant species diversity was also calculated using the Shannon-Wiener index.
Meteorological Conditions
At each sampling location we measured air temperature at 1-min intervals for the entire sampling period using iButton dataloggers (Fondriest Environmental, #DS1921G) 2 m above the ground. Prior to the sampling campaign iButtons were evaluated against a HOBO Datalogger (Onset, #U12) to ensure accuracy. Results showed that all iButton measurements were within ±1°C of the HOBO datalogger. Wind speed and direction data for the study area as a whole were obtained from the Eugene airport weather station after the sampling campaign ended, and the average, minimum, and maximum speeds, as well as dominant direction, were calculated for each sampling period.
Bacterial Collection and Analysis
We collected airborne bacteria at selected sites using passive settling dishes (sterile plastic petri dishes; Fisher Scientific, 100 × 15 mm) for a 24-h period on each sampling day. Passive settling dishes have been shown to collect samples of airborne bacteria with community structure similar to samples collected simultaneously by vacuum-powered “button” samplers (Mhuireach et al., 2016; Leppänen et al., 2018). At each site, three settling dishes and their lids were installed two meters above the ground on portable sampling towers. Set-up occurred between the hours of 06:00 and 11:00 and take-down was during the same time period the following day. After collection, all samples were immediately placed on ice, transported to the lab and stored at −80°C until processing.
The three petri dishes and lids from each sample site were individually swabbed with nylon-flocked swabs (COPAN FLOQSwabs, 502CS01) and then pooled before extraction. Samples were randomized and processed for sequencing following protocols used in Mhuireach et al. (2016). We included negative controls for all processing steps (collection, extraction and PCR), as well as PCR positive controls. Manufacturer's instructions were used to extract DNA using MoBio PowerWater kits. Polymerase chain reaction (PCR) amplification was performed in triplicate using 515F/806R primers targeting the V4 region of the bacterial 16S rRNA gene (5′ -GTGCCAGCMGCCGCGG- 3′/5′ -TACNVGGGTATCTAATCC- 3′; Caporaso et al., 2012). PCR triplicates were pooled, cleaned using AMPure beads and quantified with Quant-iT PicoGreen dsDNA Assay kit (cat#: P7589). The final library consisted of equal molar amount from each sample, normalized to the lowest concentration, and sequenced in one sequencing run at the University of Oregon on the Illumina NextSeq platform, (PE-150).
All bioinformatic processing was performed in R, using the dada2 package (Callahan et al., 2016). The dada2 workflow automates filtering, trimming, dereplication, inference of sequence variants, merging of paired-end reads, sequence table construction, chimera removal, and taxonomy assignment. After reviewing read quality plots, we truncated forward reads at 140 bp and reverse reads at 135 bp, which still allowed a minimum overlap of 20. Reads were also truncated when base quality score dropped to 2 or lower. Reads with maximum expected error >2 {calculated by EE = sum [10(−−Q/10)]} were discarded. The dada2 package outputs amplicon sequence variants (SV), which represent individual taxa that are resolved down to single-nucleotide differences (Callahan et al., 2016). The Ribosomal Database Project (RDP) Classifier was used to assign taxonomy. SVs of interest were identified to putative species level by querying the National Center for Biotechnology Information (NCBI) Basic Local Alignment Search Tool (BLAST) with exact rRNA sequences when the RDP-assigned taxonomy was in question. Fourteen samples (ABF-8.04, BRA-8.04, CEM-8.14, GRA-8.04, MAU-9.15, MIC-8.04, SFC-8.18, TSF-8.04, USF-8.14, USF-9.29, WEF-8.14, WEF-9.22, WEG-8.04, and WIL-8.14), had fewer than our threshold of 10,000 sequence reads and were removed from downstream analyses. Data files are accessible at Figshare doi: 10.6084/m9.figshare.7266707.
To reduce the impact of potential laboratory and reagent contaminants in low-biomass samples (Salter et al., 2014; Glassing et al., 2016), we identified all potential contaminants by listing the taxa observed in the negative controls (sterile petri dishes, extraction reagents, PCR reagents). Potentially consequential contaminants were determined by plotting the relative abundances of all taxa found in controls against their relative abundance in experiment samples (Supplementary Figure 2). We found three taxa, identified as belonging to the genera Vibrio, Methylobacterium, and Acinetobacter, that were above our arbitrary 0.05 threshold for relative abundance in controls (all three were well under 0.05 relative abundance in collected samples) and removed them from downstream analyses.
Statistical Analyses
We used R (version 3.5.0) for all statistical analyses, specifically the following packages: DESeq2, ggplot2, phyloseq, and vegan. Singletons and doubletons were included for species richness calculations and removed prior to other analyses. We performed rarefaction analysis to compute species richness since our sample sizes were unequal, which can lead to inaccurate diversity index comparisons (Gihring et al., 2012). To accomplish this, we used the rarefy function in the vegan package, which we set to randomly subsample from all samples at the minimum sample size of 26,180 to estimate expected numbers of species. We then tested for significant differences in expected numbers of species using the Kruskal-Wallis test, followed by pairwise Wilcoxon Rank Sum Test with Bonferroni correction for multiple testing.
For all beta diversity visualizations and analyses, we used the variance stabilizing transformation function in DESeq2, which adjusts for variation in dispersion due to differing sample sizes (Love et al., 2014), and the Morisita-Horn distance. Overall temporal patterns in beta diversity were visualized using principal coordinates analysis (PCoA) ordination. We used direct gradient analysis in the form of a constrained PCoA to assess the amount of bacterial community structural variation attributable to land cover type. This is a useful technique for identifying real patterns in noisy data sets, since the ordination axes are required to be linearly related to the variable(s) of interest (Erb-Downward et al., 2012). To calculate statistically significant associations between bacterial community structure and environmental variables of interest we used permutational multivariate analysis of variance (PERMANOVA; Anderson, 2017), as implemented in the adonis function of the vegan package (Oksanen et al., 2018), where values were obtained using type III sums of squares with 9999 permutations of residuals under a reduced model. The PERMANOVA was performed first to test for the effect of land cover type while controlling for time (i.e., sampling date), followed by a post hoc pairwise test also based on the adonis function (Martinez Arbizu, 2017) to determine which land cover comparisons contributed most to observed variation. Site effect, other vegetation metrics, and meteorological factors, were tested individually, since they were confounded in various ways. We performed PERMANOVA tests for land cover separately for each sampling date to evaluate effects that may have been obscured by the effect of time. Separately by date, we also executed a Mantel test based on Spearman's rank correlation to assess whether there was an effect of spatial autocorrelation (i.e., samples close together in space being more similar to each other than to samples at a distance). For this test, we created a matrix of spatial distances between pairs of sites based on their latitude and longitude, which was used as input, along with the Morisita-Horn distance. Finally, generalized linear models (GLMs) based on the negative binomial distribution were executed using DESeq2 to determine which bacterial classes, families, and genera contributed to differences in community structure across land cover types. To perform this test, we split up the dataset into pairwise groups of forest vs. paved, grass vs. forest, and grass vs. paved sites. All statistical analyses used a significance level of p < 0.05 and were adjusted for multiple testing using Bonferroni correction.
Results
Vegetation Analysis
Average vegetation cover proportion within 50 m of each sampling site was 0.11 for paved sites, 0.90 for grass sites, 0.97 for forest sites (all vegetation analysis outputs shown in Supplementary Table 2). Two of the forest sites were located within 50 m of water bodies and thus have lower values for proportion of vegetation cover; one of the grass sites was later found to be artificial turf, which resulted in vegetation values similar to those of paved sites (this site is included in Supplementary Table 2, but excluded from microbial analyses); and some of the paved sites were planted with individual landscaping planters, increasing their values to as high as 0.34. Proportion of vegetation cover within the 800-m buffer ranged from 0.21 to 0.85, where the averages were 0.48 for paved sites, 0.53 for grass sites, and 0.60 for forest sites. Shannon-Wiener index values for structural diversity of forest sites ranged from 2.33 to 3.35 and values for grass sites ranged from 0.22 to 1.41. Two forest sites were outside the boundary of our LiDAR data and could not be assessed. We also computed Shannon-Wiener indices for plant species diversity of each site, which ranged from 0.54 to 2.52.
Meteorological Conditions
Daily average temperatures across sampling dates ranged from 13.1 to 23.7°C (Supplementary Table 3). Paved sites tended to have the highest average temperatures and greatest fluctuation between the daily minimum and maximum, while forested sites tended to have the lowest temperatures and least fluctuation. Dates earlier in the season were generally warmer than later sampling dates; September 15 was the coolest of all dates. Average wind speeds for the study area ranged from 2.1 m/s on August 25 to 5.0 m/s on September 22 (Supplementary Table 4). The prevailing wind direction for most dates was from the north, except on August 14, September 1, and September 29, when it blew primarily from the south. There was no precipitation recorded during sampling, however, it did rain heavily on the 2 days prior to the September 1 sampling date, and in between sampling dates on September 2 and 17.
Bacterial Community Diversity, Composition, and Structure
After quality filtering there were 12,531,851 total sequence reads, including singletons. Singletons and doubletons comprised 1,362 reads, which were removed for all analyses except species richness. After removing singletons and doubletons, the number of reads per sample ranged from 26,180 to 215,283. The total number of sequence variants observed was 34,417, comprising 30 different phyla. Across the entire study, the most abundant phyla were Proteobacteria (47%), Actinobacteria (26%), Firmicutes (10%), Bacteroidetes (9%), and Planctomycetes (3%). Within the Proteobacteria, the Alphaproteobacteria class comprised 29%, Gammaproteobacteria 9%, Betaproteobacteria 7%, and Deltaproteobacteria 2%. The most ubiquitous SV in the study comprised 901,173 reads (7% of the total) and was putatively identified as Sphingomonas faeni. Species richness computed by rarefaction analysis (subsampled at 26,180 reads) ranged from 448 to 2,106 expected SVs and was significantly associated with sampling date (F = 16.5, p < 0.001) and site (F = 1.9, p = 0.007), but not with land cover type (F = 1.7, p = 0.2).
Land cover type explained a small but significant portion of variation in beta diversity among samples when using direct gradient analysis (Figure 3). The first axis (CAP1) accounted for the large majority of variance explained. Variability in grass and paved sites was largely constrained to the second axis (CAP2), while forests exhibited similar variability across both axes, and showed less intermixing with grass and paved sites than did grass and paved sites with each other. Post hoc pairwise testing of land cover types confirmed that the largest difference was between forest and paved sites (R2 = 0.06, p < 0.001), followed by forest and grass sites (R2 = 0.04, p < 0.001), and the smallest difference was between grass and paved sites (R2 = 0.03, p < 0.001). The significant but relatively minor effect of land cover type when samples across all dates were included was substantiated by a PERMANOVA testing for the effect of land cover type while controlling for sampling date, which showed that land cover type was a significant but weak predictor of similarity (R2 = 0.06, p < 0.001).
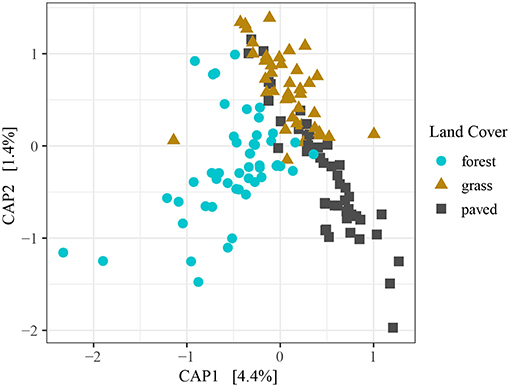
Figure 3. Constrained PCoA ordination plot for all samples, using Morisita-Horn dissimilarity distance on variance-stabilizing transformed counts, colored by land cover type.
Sampling date explained four times more variation among samples than land cover type (R2 = 0.24, p < 0.001). We visualized the effect of sampling date in a principal coordinates analysis (PCoA) plot of Morisita-Horn distances on the variance-stabilizing transformed counts (Figure 4), where samples represented by points that are closer together have more similar community structure than points further away. In particular, samples collected in July and early August formed tight and distinct clusters, while those collected later were more dispersed. Within each cluster, paved sites tended to form a discrete subgroup from the vegetated sites, especially for the September sampling dates, indicating that paved sites had more similar community structure to each other than to vegetated sites, particularly during periods when there was large variability among samples.
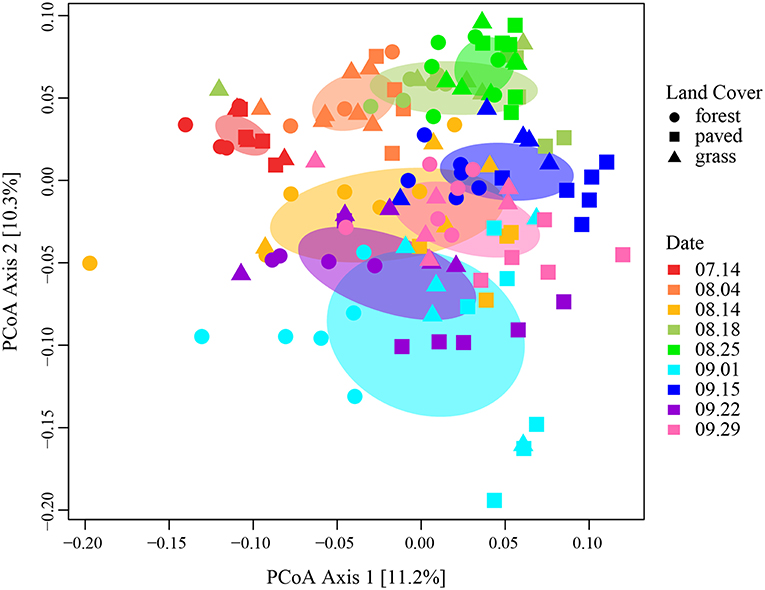
Figure 4. PCoA ordination plot for all samples, using Morisita-Horn dissimilarity distance on variance-stabilizing transformed counts, colored by sampling date. Ellipses represent 1 standard deviation from the mean.
The large effect of sampling date appears to be driven by changing relative abundances of the dominant bacterial taxa over the course of the sampling campaign (Figure 5). On the first sampling date, for example, communities were dominated by members of the bacterial families, Sphingomonadaceae, Microbacteriaceae, and Cytophagaceae which decreased in relative abundance on each of the next two sampling dates, while taxa from other families, including Acetobacteraceae and Enterobacteriaceae, became more dominant.
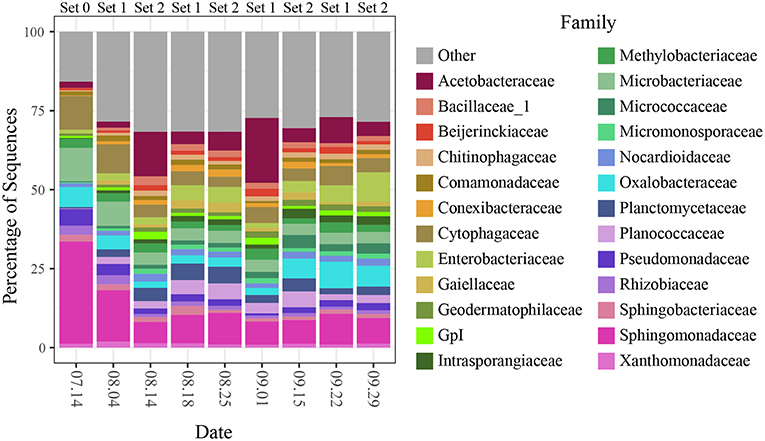
Figure 5. Community composition at the family level for all sites split by sampling date.
The interactions between spatial and temporal trends became clearer when community composition (for the top 25 most abundant SVs) was broken out for each site separately across sampling dates (Figure 6; genera and relative abundance values in Supplementary Materials). Some taxa had high relative abundance across all sites on certain dates—for instance, the members of Sphingomonadaceae, Microbacteriaceae and Cytophagaceae on the first two sampling dates, which may explain the tighter clustering of points for those two dates in the ordination. On other dates, some taxa were extremely abundant at only certain sites. For example, on September 1, the relative abundance of Gluconobacter sp. (family Acetobacteraceae) rose to over 50% of all sequences at two paved sites (BIM and SAF). Importantly, the spikes in Acetobacteraceae abundance at two forest sites on 8.14 and 8.25 are due to a different SV—Granulibacter sp. Another notable feature was the high relative abundance of a taxon belonging to family Enterobacteriaceae, putatively Erwinia billingiae, which was found at highly maintained grass sites (e.g., irrigated and mowed—cemetery CEM, park MAU, golf course LAU) across several dates.
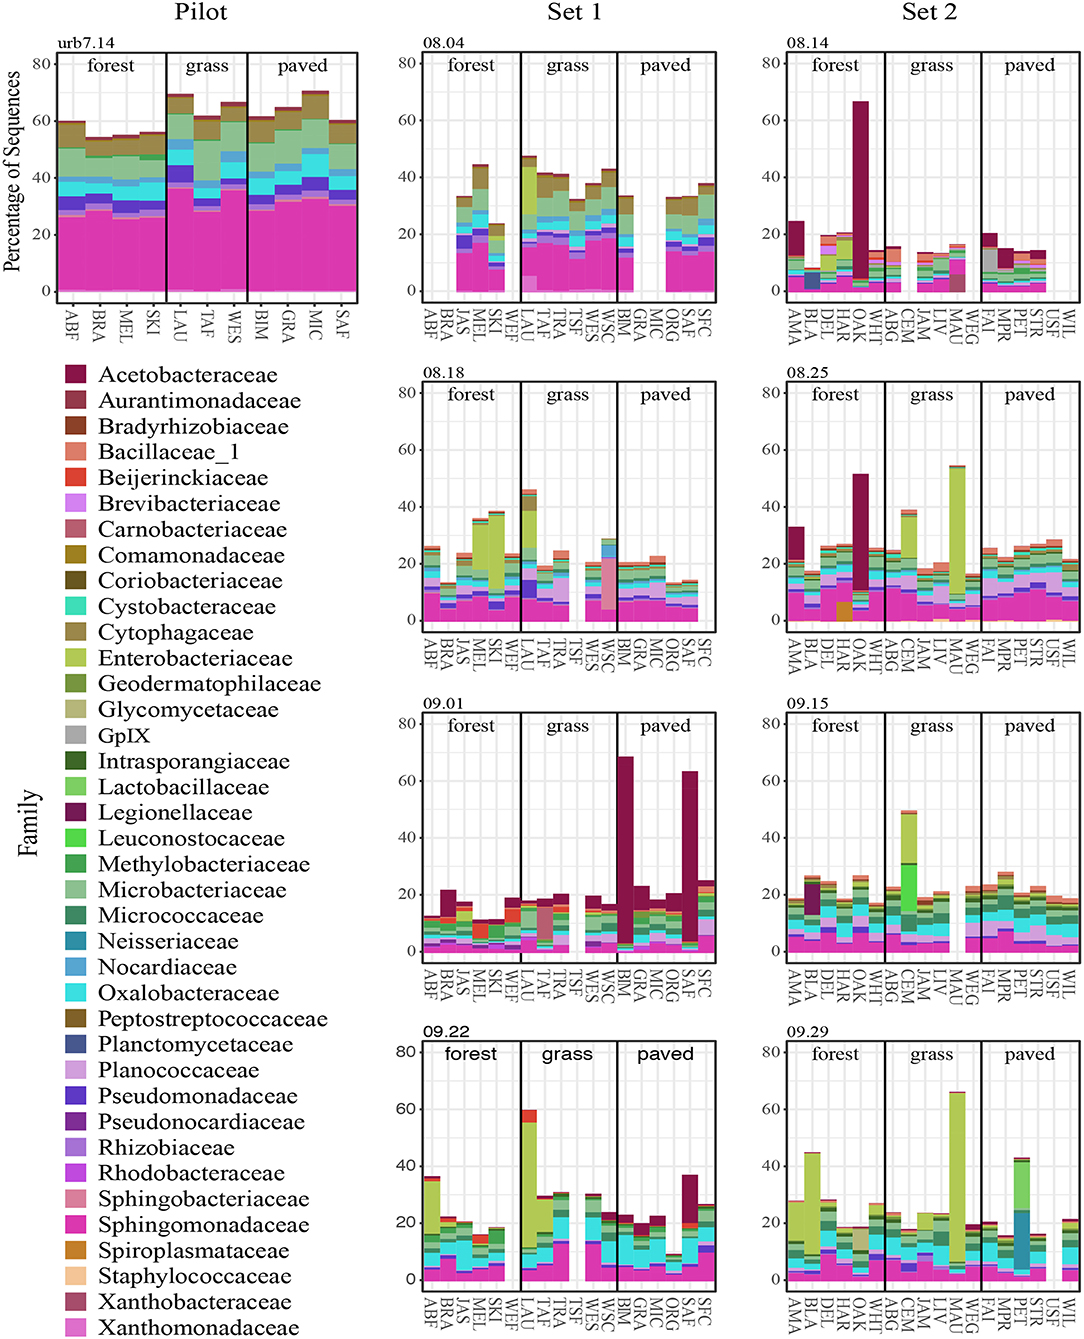
Figure 6. Top 25 most abundant SVs on each sampling date, colored by family.
When we performed individual PERMANOVA tests for all major variables of interest, site was the dominant factor explaining variation in community structure and, in fact, was a stronger predictor than sampling date, while other vegetation and meteorological variables had marginal, though significant, associations (Table 1). Each of these factors was tested separately, since they were substantially confounded with one another (e.g., site with land cover type, sampling date with wind direction). The results for sampling date and land cover type were virtually identical to the results from the multivariate PERMANOVA.
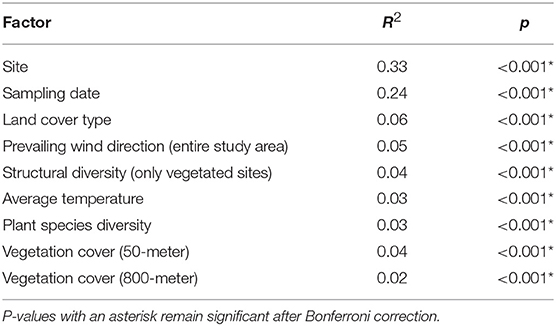
Table 1. Results from individual PERMANOVA analyses on selected environmental factors, using Morisita-Horn distance on variance-stabilizing transformed counts.
We next analyzed samples separately by date to see whether the strong effects of sampling date and site masked other important relationships. The explanatory power of land cover type increased dramatically in this analysis—six out of the nine dates were highly significant with R2 ranging from 0.16 to 0.30 (Table 2 and Supplementary Figure 3). We also tested whether community similarity was associated with spatial proximity for each sampling date. Despite the strong predictive power of site when samples across all dates were analyzed together, the Mantel test showed no spatial autocorrelation for eight of nine sampling dates, while one date (August 25) showed significant effects of spatial proximity. Because we sampled two sets of sites on alternating dates, we tested for the effect of sampling set and found a minor effect on community analyses (R2 = 0.037, p < 0.0001), including the temporal patterns shown in Figure 4. We examined each analysis for possible sampling set effects and found no evidence of any impact.
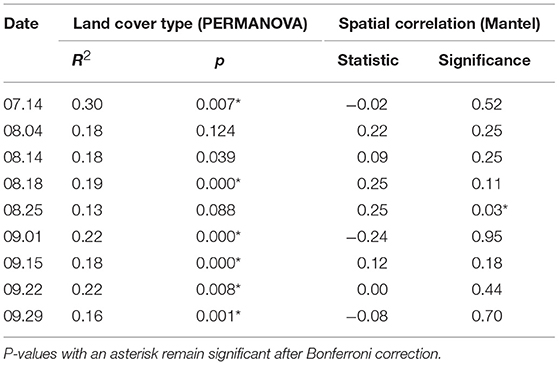
Table 2. Results of PERMANOVA analyses on land cover type and Mantel spatial correlation test for each sampling date, using Morisita-Horn distance on variance-stabilizing transformed counts.
Finally, we examined whether individual taxonomic groups contributed to the observed variation in community structure across land cover types, using a negative binomial GLM to identify differentially abundant taxa. We first tested at the class level and found that the relative abundance of 29 of 53 bacterial classes varied significantly across forest, grass, and paved sites (Figures 7A,B), with 17 of these classes present in very low abundances (<1%). For example, Gammaproteobacteria, a high-abundance class, was enriched at vegetated sites (both grass and forest), while Deinococci, Thermomicrobia, and Anaerolineae, all low-abundance classes, were enriched at paved sites.
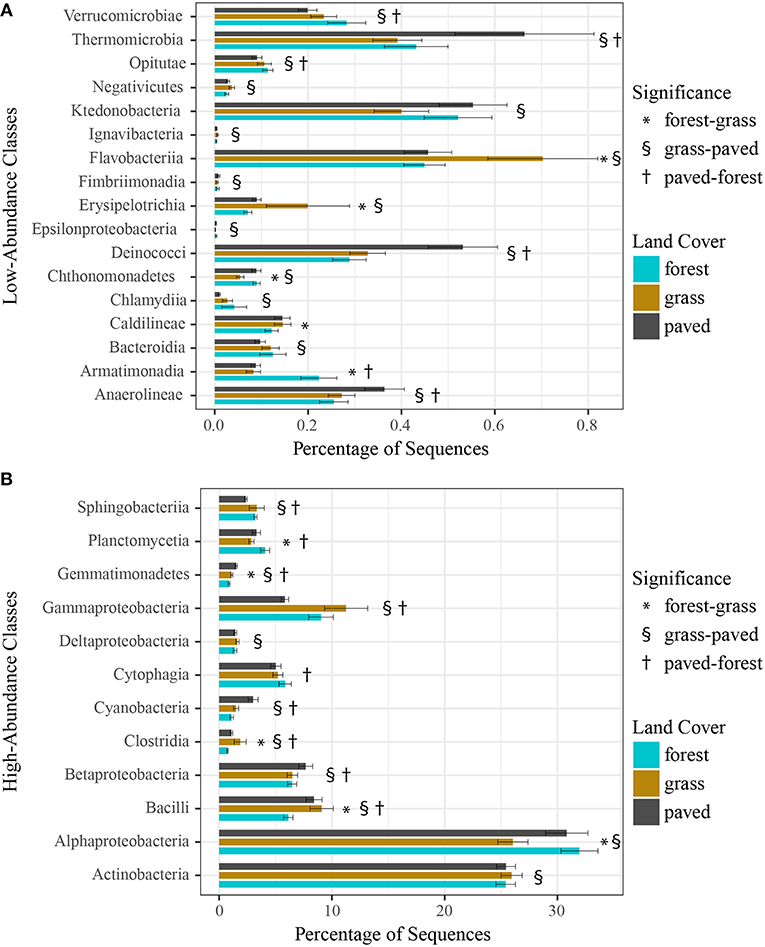
Figure 7. (A) Low-abundance (<1%) and (B) high-abundance (>1%) bacterial classes that were differentially abundant across land cover types, using a negative binomial GLM. Bars show mean relative abundance for each land cover type, error bars indicate standard error of the mean.
Because comparisons at higher taxonomic levels can mask important distinctions at lower taxonomic levels, we performed the same test for differential abundance of genera. We chose genera because many taxa were not resolved to species. A total of 37 differentially abundant taxa were found for the forest-grass contrast, while the forest-paved contrast showed more than twice as many (80), and the grass-paved contrast nearly twice as many again (154). Forests showed the fewest enriched indicators, comprising only 35% of the forest-grass indicators, and 37% of the forest-paved indicators. For the grass-paved contrast, 57% were enriched in grass sites and 43% enriched in paved sites.
At the genus level, we noted that within the family Acetobacteraceae (class Alphaproteobacteria) one genus (Granulibacter) was highly indicative of forests, while other genera in the same family (Gluconobacter, Rubritepida, Acidicaldus) were indicative of paved areas (Supplementary Figure 4). Likewise, several genera within the family Enterobacteriaceae (class Gammaproteobacteria) had contrasting abundance patterns. For example, when comparing forest with paved sites, Arsenophonus and Erwinia were enriched in forest sites and Citrobacter was enriched in paved sites, but Citrobacter was enriched in grass sites when compared with either forests or paved sites (Supplementary Figures 4–6).
Discussion
Despite decades of study of aerobiome structure and dynamics (e.g., Carnelley et al., 1887; Pedgley, 1991; Shaffer and Lighthart, 1997; Womack et al., 2010; Gandolfi et al., 2013), we still have only a rudimentary understanding of the relevant environmental, spatial, and temporal drivers. Although the basic processes through which microorganisms become airborne from vegetation (e.g., evapotranspiration, rain splash, wind gusts) have been identified, prediction and quantification of the actual numbers emitted from plant leaves remains challenging (Morris et al., 2014). Microorganisms, like dust particles of the same size order (i.e., 0.1–10 μm for bacteria), can remain airborne for hours to weeks, and can be transported long distances via movement of the regional air mass (Després et al., 2012). Modeling spatiotemporal patterns of aerobiome structure is also challenging, since air is a fluid medium exhibiting complex movement patterns and physical interactions ranging in scale from relatively stable continental air cells to localized turbulent eddies. Within an urban environment, these interactions may be influenced by neighborhood features, such as topography, vegetation structure, and the shape, size, and distribution of nearby buildings. Supporting this, Després et al. (2012) suggested that urban areas might show more distinctive patterns of aerobiome variation than, for example, agricultural regions due to greater heterogeneity of different point sources. On the other hand, air movement may dilute the signals of localized sources, in effect, washing out differences across sites.
Similar to other 16S surveys of airborne bacterial communities (e.g., Bowers et al., 2013; Seifried et al., 2015; Lymperopoulou et al., 2016; Genitsaris et al., 2017), we found that the phyla Proteobacteria, Actinobacteria, Firmicutes, and Bacteroidetes comprised most of the observed taxa, perhaps indicating either that airborne communities are broadly similar regardless of geographic location and season, or that high-level taxonomic assessment masks important species-level variation. Supporting the former, it has been suggested that there is a well-mixed collection of “background” microbiota originating from large-area sources, like extensive forest, grass fields, or marine environments (Gandolfi et al., 2013; Seifried et al., 2015), and that they tend to be highly resilient against the hostile conditions of long-range atmospheric transport (Fierer et al., 2008; Wéry et al., 2018). Despite high-level similarity of our results to those of other bacterial surveys, at finer taxonomic resolutions we uncovered subtle compositional patterns related to site-scale features, such as land cover and management, as well as temporal shifts possibly associated with regional agricultural activities, prevailing wind direction, and vegetation phenology, suggesting a constant interplay between microbes transmitted by regional and continental air masses and those emitted from local sources (Seifried et al., 2015; Innocente et al., 2017). To begin understanding this spatiotemporal interplay, we developed a conceptual model of potential influences on aerobiome assembly across different scales (Figure 8) to guide our discussion.
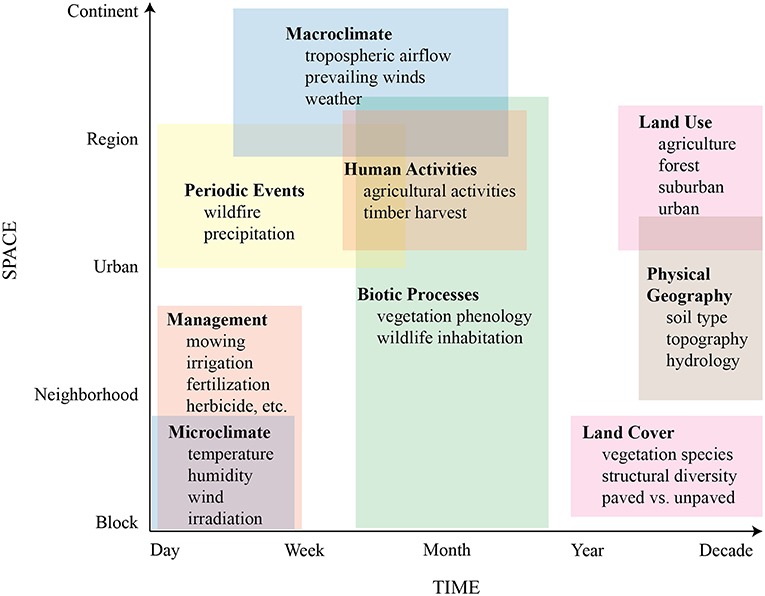
Figure 8. Conceptual model of potential controls on aerobiome assembly across spatiotemporal scales.
We propose that at individual sampling sites, airborne microbial community structure is influenced both by local features, such as land cover, microclimate, management, biotic processes, and physical geography, with greater retention or dilution of locally-sourced microbes depending on the degree of mixing with the regional air mass (Gandolfi et al., 2013). The latter is likely affected by both local topography and nearby vegetation (Wuyts et al., 2008), which could attenuate or increase local air movement. Air movement could affect the local aerobiome in complex ways. Air movement of ~1.4 m/s is enough to release bacterial cells from plant leaves when they are not firmly adhered or tucked into leaf surface topography; gentle gusts of ~5.6 m/s are more effective at removing bacteria in quantity (Morris et al., 2014). Thermal convection and turbulent eddies produced by interactions between air mass movement and earth surface roughness could also influence the degree of overall mixing of local- and distant-sourced bacteria.
At broader spatial and temporal scales, we surmise that microbial community structure of the regional air mass is primarily driven by larger-scale features that include periodic events, human activities, biotic processes, land uses, and physical geography, as well as macroclimatic influences such as prevailing winds and tropospheric transport from distant continents (Lighthart, 1984; Womack et al., 2010; Smith et al., 2012; Mhuireach et al., 2016). A recent study indicated that aerobiome composition in the Spain's Pyrenees Mountains was strongly correlated with the air mass regional origin at different times of the year, with the result that bacteria associated with freshwater, agricultural, and urban areas were more dominant in the summer, while forest and marine-associated taxa were more dominant in the winter (Cáliz et al., 2018).
Space Is More Important Than Time
Within the spatial and temporal scope of our study, space (site) explained bacterial community similarity better than any other variable, followed by time (sampling date). Other vegetation and meteorological variables, while significant, explained far less community variation (Table 1). Consistent with our results, other recent studies also have found airborne bacterial composition to be closely coupled with individual sampling sites (Seifried et al., 2015; Docherty et al., 2018). In contrast, several earlier culture-independent aerobiome studies found spatial location within an urban area to be insignificant compared to the effect of time (e.g., Brodie et al., 2007; Fierer et al., 2008; Bowers et al., 2013). In our study, proximity to other sites did not influence similarity in bacterial community structure for most sampling dates (Table 2), perhaps indicating that the larger urban air mass was well-mixed and distributed across the study area and that unique microbial taxa originating from individual sites became undetectable short distances away due to rapid dilution with distance. This idea is supported by the diminishing importance of the proportion of vegetation cover with increasing buffer size around sampling points (Supplementary Figure 7). For richness on the other hand, time (sampling date) was more important than space (site), and cover type was not significant. Variation in richness may have been most strongly influenced by the strength of local sources as a function of wind speed and changes in the dominance of regionally abundant microbes under the influence of prevailing winds. We expect that air movement at the local scale of individual sites has a strong effect on airborne microbial community dynamics and that nearby vegetation, especially multilayered forests with tall trees, alters patterns of air movement. Using wind dataloggers at individual sites in future studies may help disentangle the dual roles of vegetation as microbial source and mediator of air movement.
We conjecture that site serves as a proxy variable that captures a suite of local features such as vegetation structure, plant species composition and diversity, microclimate, and site management regimes, that can alter bacterial sources, dispersal capabilities, and survival rates, and thus affect bacterial community structure. Land cover type, our principal variable of interest, had a significant but subtle association with bacterial community similarity (Figure 3). To lesser degrees, the same held for structural diversity, plant species diversity, vegetation cover, temperature, and prevailing winds (Table 1). Vegetation structure, species diversity and cover are site-specific, quantitative characteristics influenced by cover type, while local temperature and windspeed (the latter likely affecting the dispersion of locally sourced microbes) will also be influenced by microclimates created by vegetation and topography under the influence of daily weather. As we discuss later, vegetation and microclimate may be modified by site management. It is thus possible that each of these variables captures a small component of the much larger, overall effect of “site.”
When samples were analyzed separately for each date, the association with land cover type increased from R2 = 0.06 to a daily average of R2 = 0.20 (Table 2), suggesting a much stronger role of land cover type that was obscured by the substantial changes in bacterial community structure associated with time. This emphasizes the need for models and analyses that can disentangle local and distant influences on microbial community structure at any given point in time.
We further investigated whether certain bacterial taxa were associated with each of the three land cover types by examining differentially abundant taxa at the class and genus levels. Paved sites were characterized by enrichment of the classes Deinococci, Thermomicrobia, Anaerolineae, and Cyanobacteria (Figures 7A,B). Many of these groups, especially Deinococci, are known for their ability to survive hostile conditions, such as intense radiation, desiccation, and heavy metal contamination, suggesting that they may originate and persist on the asphalt of parking lots, with its extreme physical environment and pollutant deposition from automobiles. Paved sites had large numbers of enriched taxa at the genus level, as well (Supplementary Figures 4, 6), possibly because they represent a unique but relatively consistent type of biophysical environment.
Bacterial communities of forested sites were both the most distinctive and variable (Figure 3), yet they had the fewest differentially abundant genera (Supplementary Figures 4, 5) and only two classes—Armatimonadia and Planctomycetia (Figures 7A,B)—that were enriched compared to both other cover types. A potential explanation for these seemingly contradictory findings is that individual forest sites are characterized by different sets of indicator taxa and, therefore, the differential abundance test shows fewer enriched taxa when all forest sites were aggregated. This idea is consistent with results from Mhuireach et al. (2016) showing that while bacterial communities collected from parking lots tended to be similar to each other, those from grassy parks were different both from parking lots and—importantly—other parks. In terms of the mechanisms that might underlie this idea, we note that: (a) different plant species host distinct bacterial communities and each forest site had different plant species composition; (b) trees are large sources of bacteria due to their large surface area; and (c) forests moderate microclimate (e.g., air flow, temperature, radiation) such that more bacteria from local sources may survive and be retained than at other land cover types. If this is the case, then testing for differential abundance by aggregating all forest sites may have resulted in fewer indicator taxa than grassland or paved sites, even though individual forests might host bacterial communities that are distinct from other land cover types. This possibility is consistent with our finding that site identity was a stronger predictor of bacterial community similarity than land cover type when samples across all dates were analyzed together.
Grassland sites in this study were particularly enriched in the classes Flavobacteriia, Erysipelotrichia, Gammaproteobacteria, and Clostridia, and they had the greatest number of enriched genera (Supplementary Figures 5, 6). One member of the genus Erwinia was notably abundant at three different grass sites—a cemetery, a golf course, and a public park—each of which undergoes intensive management regimes (e.g., mowing, irrigation, fertilization). We further examined the life history of this SV, which was putatively identified as Erwinia billingiae in the NCBI BLAST database, and found that it is a non-pathogenic plant-associated bacterium commonly found on fruit tree flowers and leaves (Kube et al., 2010). Interestingly, this same SV was found in high abundance at another intensively managed grassland park in our earlier (2013) pilot study, leading us to speculate that this bacterium may have been released in high quantities at these sites during mowing or irrigation events that coincided with our sampling dates. This would agree with Maron et al. (2006), who suggested that daily and weekly variations in urban bacterial community structure were related to anthropogenic activities.
Temporal Patterns Appear to be Associated With Regional- and Local-Scale Events
Even the brief three-month duration of our study revealed strong temporal patterns and fluctuations from one sampling date to the next. These fluctuations tended to mask relationships between bacterial community structure and fine-scale vegetation metrics, while suggesting key interactions across larger spatial and temporal scales. As indicated by our conceptual model (Figure 8), our study encompassed multiple processes occurring across a range of days to months that could be expected to impact the aerobiome. In particular, seasonal biotic processes (e.g., vegetation senescence), changes in weather and prevailing winds, and regional-scale human activities (e.g., agriculture) appeared to play roles in the observed shifts in dominant taxonomic groups, as has been noted in other studies (Gandolfi et al., 2015; Lee et al., 2017).
Taxa that were distributed relatively equally across all sites suggest a regional rather than local source. For instance, we found that July samples for all sites were dominated by an SV putatively identified as Sphingomonas faeni whose relative abundance generally decreased over the course of the sampling campaign. S. faeni has been previously isolated from air in agricultural barns where bales of hay were being broken open (Andersson et al., 1999). While undisturbed agricultural fields contribute modest numbers ranging from 46 to 6,500 CFU/m3 of bacteria to the air (Lindemann et al., 1982), crop harvesting may increase that by several orders of magnitude to an estimated average of 6.4 × 10⁸ CFU/m3 (Lighthart, 1984). Because our study area was located downwind of a large grass seed production region (Linn County, Oregon) and July is a prime harvesting month, we posit that S. faeni may have been released through seasonal agricultural activities, which corroborates previous work (Mhuireach et al., 2016).
Several taxonomic groups changed in relative abundance over the course of the campaign. For example, families Sphingomonadaceae, Cytophagaceae, and Microbacteriaceae decreased over the first three sampling dates, while Acetobacteraceae, Enterobacteriaceae, and Oxalobacteraceae showed individualistic patterns of change (Figure 5). These changes may reflect both seasonal trends and daily fluctuations associated with late summer, such as lowering temperatures, precipitation events, or switches in prevailing winds, and were often observed as an interaction between time and space. For example, Gluconobacter (family Acetobacteraceae), was primarily found in paved locations on several different dates and was particularly abundant on September 1 after 2 days of heavy rain, following months of summer drought.
Notably, four of these six abundant families were relatively evenly distributed across all sites on most days despite changes to overall abundance (again suggesting a regional origin), while on the other hand, Acetobacteraceae and Enterobacteriaceae, emerged as dominants on some days largely because of extreme spikes of abundance at a small number of individual sites, suggesting a response to localized conditions. In some cases, we have been able to link these spikes to a potential interaction between a particular cover type and a disturbance, such as precipitation or irrigation.
The temporal results provide two major take-home points. First, microbes from the broader regional landscape, where large areas of single land cover types such agriculture or forest are found, may have the capacity to overwhelm local microbial sources at particular times of the year or under the influence of abrupt shifts in regional weather patterns that alter the primary sources of microbes to an entire city. Second, both seasonal fluctuations and localized events can lead to highly site-specific responses from day to day. Although these findings are far from definitive, they begin to shed light on possible aerobiome assembly mechanisms suggested in our conceptual model that warrant further investigation. In particular, they suggest that attempts to shape the urban aerobiome could require actions that range from site scale interventions to landscape planning.
Conclusions
Our investigation revealed patterns of fine-scale spatial and temporal variability in the urban aerobiome and suggests potential controls over its community structure and richness that range from regional land uses and air movement, to localized vegetation and site management. In particular, our space-time model of aerobiome assembly posits that the shifting interplay of multiple drivers across multiple scales—many of which are influenced or controlled by people—collectively shape the aerobiome at any given location and point in time, including the degree of homogenization or localization of bacterial communities. Our work also suggests that the effects of coarse-scale urban land cover types on bacterial communities can be substantially influenced by finer-scale influences at individual sites, such as irrigation and mowing regimes, the presence of asphalt surfaces and automobile use, and variation in plant species composition and vegetation structure. These findings offer evidence that it may be possible to manage the urban microbiome to some degree through actions ranging from regional land-use planning to site-scale design and management. Although our work revealed that certain bacterial groups varied in abundance and diversity across land cover types, further research is needed to confirm whether differential degrees of exposure to these airborne bacteria can impact health.
The idea of shaping the urban aerobiome through vegetation management is virtually unexplored. Extensive evidence suggests that vegetation is a key factor in creating healthy neighborhoods (see Kuo, 2015; Frumkin et al., 2017), but we have limited knowledge of how to design green spaces for optimal benefits. With green space decreasing rapidly in many cities due to population growth and increasing density (Dallimer et al., 2011; Gan et al., 2014; Chen et al., 2017), there is a critical need for evidence-based guidelines for designing and managing urban vegetation. Over 150 years ago, the landscape architect Frederick Law Olmsted revolutionized the practice of urban design by pioneering the development of publicly accessible parks to improve the health and well-being of urban residents through contact with nature (Roper and Olmsted, 1973; Rybczynski, 1999; Eisenman, 2013). At a time when industrialization was leading to crowded, unhealthy cities, his innovations were based on observation and principles but no data. This study provides empirical evidence that urban vegetation design and planning can change the urban aerobiome. The societal implications of that finding depend on whether such changes affect human well-being.
Data Availability
The datasets generated and analyzed for this study can be found in the figshare repository [https://doi.org/10.6084/m9.figshare.7266707.v1].
Author Contributions
GM, BJ, and JG conceived and crafted the study design. GM and CB-R performed all microbial collection and labwork, using facilities provided by JG. GM performed all analyses. GM wrote the first draft under the supervision of BJ with input from JG. GM and BJ were primarily responsible for editing and revisions. BJ supervised overall project development and was primarily responsible for overseeing the work. All authors contributed, read, and approved the final manuscript.
Funding
This research was supported by the Alfred P. Sloan Foundation through grants to the Biology and the Built Environment Center, and by a STAR Fellowship Assistance Agreement (#91769501-0) awarded by the U.S. Environmental Protection Agency (EPA). It has not been formally reviewed by EPA. The views expressed in this publication are solely those of the author, and EPA does not endorse any products or commercial services mentioned in this publication.
Conflict of Interest Statement
JG is Chief Technology Officer at Phylagen, Inc.
The remaning authors declare that the research was conducted in the absence of any commercial or financial relationships that could be construed as a potential conflict of interest.
Acknowledgments
We are grateful to the Eugene Parks and Recreation Department, Willamalane Park and Recreation District, and the individual landowners who granted us permission to collect samples. This manuscript contains material published in the lead author's dissertation (Mhuireach, 2018).
Supplementary Material
The Supplementary Material for this article can be found online at: https://www.frontiersin.org/articles/10.3389/fevo.2019.00043/full#supplementary-material
Footnotes
1. ^Following Nemergut et al. (2013) we use the term “richness” to indicate the number of different sequence variants (i.e., species) observed, and “structure” to describe both the composition and relative abundance of taxa.
References
Anderson, M. J. (2017). “Permutational Multivariate Analysis of Variance (PERMANOVA),” in Wiley StatsRef: Statistics Reference Online (American Cancer Society), 1–15. doi: 10.1002/9781118445112.stat07841
Andersson, A. M., Weiss, N., Rainey, F., and Salkinoja-Salonen, M. S. (1999). Dust-borne bacteria in animal sheds, schools and children's day care centres. J. Appl. Microbiol. 86, 622–634.
Bailey, A. W., and Poulton, C. E. (1968). Plant communities and environmental interrelationship in a portion of the Tillamook burn, Northwestern Oregon. Ecology 49, 1–13. doi: 10.2307/1933554
Bowers, R. M., Clements, N., Emerson, J. B., Wiedinmyer, C., Hannigan, M. P., and Fierer, N. (2013). Seasonal variability in bacterial and fungal diversity of the near-surface atmosphere. Environ. Sci. Technol. 47, 12097–12106. doi: 10.1021/es402970s
Bowers, R. M., McLetchie, S., Knight, R., and Fierer, N. (2010). Spatial variability in airborne bacterial communities across land-use types and their relationship to the bacterial communities of potential source environments. ISME J. 5, 601–612. doi: 10.1038/ismej.2010.167
Brodie, E. L., DeSantis, T. Z., Parker, J. P. M., Zubietta, I. X., Piceno, Y. M., and Andersen, G. L. (2007). Urban aerosols harbor diverse and dynamic bacterial populations. Proc. Natl. Acad. Sci. U.S.A. 104, 299–304. doi: 10.1073/pnas.0608255104
Burrows, S. M., Elbert, W., Lawrence, M. G., and Pöschl, U. (2009). Bacteria in the global atmosphere–Part 1: review and synthesis of literature data for different ecosystems. Atmos. Chem. Phys. 9, 9263–9280. doi: 10.5194/acp-9-9263-2009
Cáliz, J., Triadó-Margarit, X., Camarero, L., and Casamayor, E. O. (2018). A long-term survey unveils strong seasonal patterns in the airborne microbiome coupled to general and regional atmospheric circulations. Proc. Natl. Acad. Sci. U.S.A. 115, 12229–12234. doi: 10.1073/pnas.1812826115
Callahan, B. J., McMurdie, P. J., Rosen, M. J., Han, A. W., Johnson, A. J. A., and Holmes, S. P. (2016). DADA2: High-resolution sample inference from Illumina amplicon data. Nat. Meth. 13, 581–583. doi: 10.1038/nmeth.3869
Caporaso, J. G., Lauber, C. L., Walters, W. A., Berg-Lyons, D., Huntley, J., Fierer, N., et al. (2012). Ultra-high-throughput microbial community analysis on the Illumina HiSeq and MiSeq platforms. ISME J. 6, 1621–1624. doi: 10.1038/ismej.2012.8
Carnelley, T., Haldane, J. S., and Anderson, A. M. (1887). The carbonic acid, organic matter, and micro-organisms in air, more especially of dwellings and schools. Philos. Trans. R Soc. Lond. B 178, 61–111. doi: 10.1098/rstb.1887.0004
Chen, B., Nie, Z., Chen, Z., and Xu, B. (2017). Quantitative estimation of 21st-century urban greenspace changes in Chinese populous cities. Sci. Total Environ. 609, 956–965. doi: 10.1016/j.scitotenv.2017.07.238
Dallimer, M., Tang, Z., Bibby, P. R., Brindley, P., Gaston, K. J., and Davies, Z. G. (2011). Temporal changes in greenspace in a highly urbanized region. Biol. Lett. 7, 763–766. doi: 10.1098/rsbl.2011.0025
Després, V., Huffman, J. A., Burrows, S. M., Hoose, C., Safatov, A., Buryak, G., et al. (2012). Primary biological aerosol particles in the atmosphere: a review. Tellus B Chem. Phys. Meteorol. 64:15598. doi: 10.3402/tellusb.v64i0.15598
Després, V. R., Nowoisky, J. F., Klose, M., Conrad, R., Andreae, M. O., and Pöschl, U. (2007). Characterization of primary biogenic aerosol particles in urban, rural, and high-alpine air by DNA sequence and restriction fragment analysis of ribosomal RNA genes. Biogeosciences 4, 1127–1141. doi: 10.5194/bg-4-1127-2007
Docherty, K. M., Pearce, D. S., Lemmer, K. M., and Hale, R. L. (2018). Distributing regionally, distinguishing locally: examining the underlying effects of local land use on airborne bacterial biodiversity. Environ. Microbiol. 20, 3529–3542. doi: 10.1111/1462-2920.14307
Ege, M. J., Mayer, M., Normand, A.-C., Genuneit, J., Cookson, W. O., Braun-Fahrländer, C., et al. (2011). Exposure to environmental microorganisms and childhood asthma. N. Engl. J. Med. 364, 701–709. doi: 10.1056/NEJMoa1007302
Eisenman, T. S. (2013). Frederick Law Olmsted, green infrastructure, and the evolving city. J. Plan. Hist. 12, 287–311. doi: 10.1177/1538513212474227
Erb-Downward, J. R., Sadighi Akha, A. A., Wang, J., Shen, N., He, B., Martinez, F. J., et al. (2012). Use of direct gradient analysis to uncover biological hypotheses in 16S survey data and beyond. Sci. Rep. 2:774. doi: 10.1038/srep00774
Fierer, N., Liu, Z., Rodriguez-Hernandez, M., Knight, R., Henn, M., and Hernandez, M. T. (2008). Short-term temporal variability in airborne bacterial and fungal populations. Appl. Environ. Microbiol. 74, 200–207. doi: 10.1128/AEM.01467-07
Frumkin, H., Bratman, G. N., Breslow, S. J., Cochran, B., Kahn, P. H., Lawler, J. J., et al. (2017). Nature contact and human health: a research agenda. Environ. Health Perspect. 125:075001. doi: 10.1289/EHP1663
Gan, M., Deng, J., Zheng, X., Hong, Y., and Wang, K. (2014). Monitoring urban greenness dynamics using multiple endmember spectral mixture analysis. PLoS ONE 9:e112202. doi: 10.1371/journal.pone.0112202
Gandolfi, I., Bertolini, V., Ambrosini, R., Bestetti, G., and Franzetti, A. (2013). Unravelling the bacterial diversity in the atmosphere. Appl. Microbiol. Biotechnol. 97, 4727–4736. doi: 10.1007/s00253-013-4901-2
Gandolfi, I., Bertolini, V., Bestetti, G., Ambrosini, R., Innocente, E., Rampazzo, G., et al. (2015). Spatio-temporal variability of airborne bacterial communities and their correlation with particulate matter chemical composition across two urban areas. Appl. Microbiol. Biotechnol. 99, 4867–4877. doi: 10.1007/s00253-014-6348-5
Genitsaris, S., Stefanidou, N., Katsiapi, M., Kormas, K. A., Sommer, U., and Moustaka-Gouni, M. (2017). Variability of airborne bacteria in an urban Mediterranean area (Thessaloniki, Greece). Atmos. Environ. 157, 101–110. doi: 10.1016/j.atmosenv.2017.03.018
Gihring, T. M., Green, S. J., and Schadt, C. W. (2012). Massively parallel rRNA gene sequencing exacerbates the potential for biased community diversity comparisons due to variable library sizes. Environ. Microbiol. 14, 285–290. doi: 10.1111/j.1462-2920.2011.02550.x
Glassing, A., Dowd, S. E., Galandiuk, S., Davis, B., and Chiodini, R. J. (2016). Inherent bacterial DNA contamination of extraction and sequencing reagents may affect interpretation of microbiota in low bacterial biomass samples. Gut Pathog. 8:24. doi: 10.1186/s13099-016-0103-7
Haahtela, T., Holgate, S., Pawankar, R., Akdis, C. A., Benjaponpitak, S., Caraballo, L., et al. (2013). The biodiversity hypothesis and allergic disease: World Allergy Organization position statement. World Allergy Organ. J. 6:3. doi: 10.1186/1939-4551-6-3
Hanski, I., von Hertzen, L., Fyhrquist, N., Koskinen, K., Torppa, K., Laatikainen, T., et al. (2012). Environmental biodiversity, human microbiota, and allergy are interrelated. Proc. Natl. Acad. Sci. U.S.A. 109, 8334–8339. doi: 10.1073/pnas.1205624109
Innocente, E., Squizzato, S., Visin, F., Facca, C., Rampazzo, G., Bertolini, V., et al. (2017). Influence of seasonality, air mass origin and particulate matter chemical composition on airborne bacterial community structure in the Po Valley, Italy. Sci. Total. Environ. 593–594, 677–687. doi: 10.1016/j.scitotenv.2017.03.199
Kinkel, L. L. (1997). Microbial population dynamics on leaves. Annu. Rev. Phytopathol. 35, 327–347. doi: 10.1146/annurev.phyto.35.1.327
Kottek, M., Grieser, J., Beck, C., Rudolf, B., and Rubel, F. (2006). World Map of the Köppen-Geiger climate classification updated. Meteorol. Zeitschr. 15, 259–263. doi: 10.1127/0941-2948/2006/0130
Kube, M., Migdoll, A. M., Gehring, I., Heitmann, K., Mayer, Y., Kuhl, H., et al. (2010). Genome comparison of the epiphytic bacteria Erwinia billingiae and E. tasmaniensis with the pear pathogen E. pyrifoliae. BMC Genomics 11:393. doi: 10.1186/1471-2164-11-393
Kuo, M. (2015). How might contact with nature promote human health? Promising mechanisms and a possible central pathway. Front. Psychol. 6:1093. doi: 10.3389/fpsyg.2015.01093
Laforest-Lapointe, I., Messier, C., and Kembel, S. W. (2016). Host species identity, site and time drive temperate tree phyllosphere bacterial community structure. Microbiome 4:27. doi: 10.1186/s40168-016-0174-1
Lambais, M. R., Lucheta, A. R., and Crowley, D. E. (2014). Bacterial community assemblages associated with the phyllosphere, dermosphere, and rhizosphere of tree species of the Atlantic forest are host taxon dependent. Microb. Ecol. 68, 567–574. doi: 10.1007/s00248-014-0433-2
Lee, J. Y., Park, E. H., Lee, S., Ko, G., Honda, Y., Hashizume, M., et al. (2017). Airborne bacterial communities in three east Asian cities of China, South Korea, and Japan. Sci. Rep. 7:5545. doi: 10.1038/s41598-017-05862-4
Leppänen, H. K., Täubel, M., Jayaprakash, B., Vepsäläinen, A., Pasanen, P., and Hyvärinen, A. (2018). Quantitative assessment of microbes from samples of indoor air and dust. J. Expo. Sci. Environ. Epidemiol. 28, 231–241. doi: 10.1038/jes.2017.24
Lighthart, B. (1984). Microbial aerosols: Estimated contribution of combine harvesting to an airshed. Appl. Environ. Microbiol. 47, 430–432.
Lindemann, J., Constantinidou, H. A., Barchet, W. R., and Upper, C. D. (1982). Plants as sources of airborne bacteria, including ice nucleation-active bacteria. Appl. Environ. Microbiol. 44, 1059–1063.
Lindemann, J., and Upper, C. D. (1985). Aerial dispersal of epiphytic bacteria over bean plants. Appl. Environ. Microbiol. 50, 1229–1232.
Love, M. I., Huber, W., and Anders, S. (2014). Moderated estimation of fold change and dispersion for RNA-seq data with DESeq2. Genome Biol. 15, 1–21. doi: 10.1186/s13059-014-0550-8
Lymperopoulou, D. S., Adams, R. I., and Lindow, S. E. (2016). Contribution of vegetation to the microbial composition of nearby outdoor air. Appl. Environ. Microbiol. 82, 3822–3833. doi: 10.1128/AEM.00610-16
Maron, P. A., Mougel, C., H. Lejon, D. P., Carvalho, E., Bizet, K., Marck, G., et al. (2006). Temporal variability of airborne bacterial community structure in an urban area. Atmos. Environ. 40, 8074–8080. doi: 10.1016/j.atmosenv.2006.08.047
Martinez Arbizu, P. (2017). pairwiseAdonis: Pairwise Multilevel Comparison Using Adonis. R Package Version 0.0.1.
Mhuireach, G. (2018). Relationships among airborne microbial communities, urban land uses and vegetation cover: Implications for urban planning and human health. dissertation, University of Oregon, Eugene OR.
Mhuireach, G., Johnson, B. R., Altrichter, A. E., Ladau, J., Meadow, J. F., Pollard, K. S., et al. (2016). Urban greenness influences airborne bacterial community composition. Sci. Total Environ. 571, 680–687. doi: 10.1016/j.scitotenv.2016.07.037
Morris, C. E., and Kinkel, L. L. (2002). “Fifty years of phyllosphere microbiology: significant contributions to research in related fields,” in Phyllosphere Microbiology, eds S. E. Lindow, V. J. Elliott, and E. I. Hecht-Poinar (American Phytopathological Society), 365–375.
Morris, C. E., Leyronas, C., and Nicot, P. C. (2014). “Movement of bioaerosols in the atmosphere and the consequences for climate and microbial evolution,” in Aerosol Science, eds I. Colbeck and M. Lazaridis (Chichester: John Wiley & Sons, Ltd), 393–415. doi: 10.1002/9781118682555.ch16
Nemergut, D. R., Schmidt, S. K., Fukami, T., O'Neill, S. P., Bilinski, T. M., Stanish, L. F., et al. (2013). Patterns and processes of microbial community assembly. Microbiol. Mol. Biol. Rev. 77, 342–356. doi: 10.1128/MMBR.00051-12
Oksanen, J., Blanchet, F. G., Friendly, M., Kindt, R., Legendre, P., McGlinn, D., et al. (2018). Vegan: Community Ecology Package.
Pedgley, D. E. (1991). “Aerobiology: The atmosphere as a source and sink for microbes,” in Microbial Ecology of Leaves, Brock/Springer Series in Contemporary Bioscience (New York, N. Y: Springer), 43–59. doi: 10.1007/978-1-4612-3168-4_3
Raison, C. L., and Miller, A. H. (2013). Malaise, melancholia and madness: the evolutionary legacy of an inflammatory bias. Brain Behav. Immun. 31, 1–8. doi: 10.1016/j.bbi.2013.04.009
Rook, G., Bäckhed, F., Levin, B. R., McFall-Ngai, M. J., and McLean, A. R. (2017). Evolution, human-microbe interactions, and life history plasticity. Lancet 390, 521–530. doi: 10.1016/S0140-6736(17)30566-4
Rook, G. A. (2013). Regulation of the immune system by biodiversity from the natural environment: an ecosystem service essential to health. Proc. Natl. Acad. Sci. U.S.A. 110, 18360–18367. doi: 10.1073/pnas.1313731110
Roper, L. W., and Olmsted, F. L. (1973). FLO: A Biography of Frederick Law Olmsted. Baltimore: Johns Hopkins University Press.
Ruokolainen, L., von Hertzen, L., Fyhrquist, N., Laatikainen, T., Lehtomäki, J., Auvinen, P., et al. (2015). Green areas around homes reduce atopic sensitization in children. Allergy 70, 195–202. doi: 10.1111/all.12545
Rybczynski, W. (1999). A Clearing in the Distance: Frederick Law Olmsted and America in the 19th Century. New York, NY: Scribner.
Salter, S. J., Cox, M. J., Turek, E. M., Calus, S. T., Cookson, W. O., Moffatt, M. F., et al. (2014). Reagent and laboratory contamination can critically impact sequence-based microbiome analyses. BMC Biol. 12:87. doi: 10.1186/s12915-014-0087-z
Seifried, J. S., Wichels, A., and Gerdts, G. (2015). Spatial distribution of marine airborne bacterial communities. Microbiologyopen 4, 475–490. doi: 10.1002/mbo3.253
Shaffer, B. T., and Lighthart, B. (1997). Survey of culturable airborne bacteria at four diverse locations in Oregon: urban, rural, forest, and coastal. Microb. Ecol. 34, 167–177.
Smith, D. J., Jaffe, D. A., Birmele, M. N., Griffin, D. W., Schuerger, A. C., Hee, J., et al. (2012). Free tropospheric transport of microorganisms from Asia to North America. Microb. Ecol. 64, 973–985. doi: 10.1007/s00248-012-0088-9
Sorci, G., Guivier, E., Lippens, C., and Faivre, B. (2016). “Microbes, parasites and immune diseases,” in Evolutionary Thinking in Medicine, From Research to Policy and Practice, eds A. Alvergne, C. Jenkinson, and C. Faurie (Cham: Springer), 211–223. doi: 10.1007/978-3-319-29716-3_15
Vokou, D., Vareli, K., Zarali, E., Karamanoli, K., Constantinidou, H.-I. A., Monokrousos, N., et al. (2012). Exploring biodiversity in the bacterial community of the Mediterranean phyllosphere and its relationship with airborne bacteria. Microb. Ecol. 64, 714–724. doi: 10.1007/s00248-012-0053-7
Wéry, N., Galès, A., and Brunet, Y. (2018). “Short-Scale Transport of Bioaerosols,” in Microbiology of Aerosols (Hoboken, NJ: John Wiley & Sons, Ltd), 137–154.
West, J. S., Atkins, S. D., Emberlin, J., and Fitt, B. D. L. (2008). PCR to predict risk of airborne disease. Trends Microbiol. 16, 380–387. doi: 10.1016/j.tim.2008.05.004
Womack, A. M., Bohannan, B. J. M., and Green, J. L. (2010). Biodiversity and biogeography of the atmosphere. Philos. Trans. R Soc. Lond. B Biol. Sci. 365, 3645–3653. doi: 10.1098/rstb.2010.0283
Keywords: urban, vegetation, aerobiome, bacteria, spatiotemporal, greenspace
Citation: Mhuireach GÁ, Betancourt-Román CM, Green JL and Johnson BR (2019) Spatiotemporal Controls on the Urban Aerobiome. Front. Ecol. Evol. 7:43. doi: 10.3389/fevo.2019.00043
Received: 31 October 2018; Accepted: 05 February 2019;
Published: 11 March 2019.
Edited by:
Peter Groffman, The Graduate Center, CUNY, United StatesReviewed by:
Gregory O'Mullan, Queens College (CUNY), United StatesIryna Dronova, University of California, Berkeley, United States
Copyright © 2019 Mhuireach, Betancourt-Román, Green and Johnson. This is an open-access article distributed under the terms of the Creative Commons Attribution License (CC BY). The use, distribution or reproduction in other forums is permitted, provided the original author(s) and the copyright owner(s) are credited and that the original publication in this journal is cited, in accordance with accepted academic practice. No use, distribution or reproduction is permitted which does not comply with these terms.
*Correspondence: Gwynne Á. Mhuireach, gwynhwyf@uoregon.edu