 Shuguang Li
 Shijun Sun1
 Yuyao Yin
 Henan Li
 Hui Wang
- 1Department of Clinical Laboratory, Peking University People's Hospital, Beijing, China
- 2Department of Pharmacology, Xingtai Medical College, Xingtai, China
To investigate the epidemiology and genetic structure of Staphylococcus aureus bacteremia in China, a total of 416 isolates from 22 teaching hospitals in 12 cities from 2013 and 2016 were characterized by antibiogram analysis, multilocus sequence typing (MLST), spa typing and staphylococcal cassette chromosome mec (SCCmec) typing. The predominant meticillin-susceptible (MSSA) genotypes in 2013 were ST188 (19.1%), ST7 (8.7%), and ST398 (7.8%), respectively, and they continued to be the main genotypes in 2016. The prevalence of meticillin-resistant S. aureus (MRSA) were 36.5% (66/181) and 36.6% (86/235) in 2013 and 2016, respectively. Interestingly, the susceptibility rates of MRSA to rifampicin and fluoroquinolones increased significantly from 2013 to 2016 (P < 0.01), and this was associated with changes in genetic structure. ST239-t030-MRSA, the predominant genotype among all MRSAs in 2013 (34.8%), was replaced by ST59-t437-MRSA (15.1%) in 2016. Further analysis revealed that the ST239-t030-MRSA were more resistant to rifampicin, tetracycline and fluoroquinolones than ST59-t437-MRSA (P < 0.01). To further gain insight into the mechanisms underlying the changes of genetic structure, in vitro competition and fitness measurements were performed. Importantly, ST239-t030-MRSA displayed lower growth rate and lower competitive advantage compared to ST59-t437-MRSA. Together, our findings reveal that fitness advantage of ST59-t437-MRSA over ST239-t030-MRSA may lead to changes in genetic structure and increased susceptibility of MRSA to rifampicin and fluoroquinolones in Chinese patients with S. aureus bacteremia. Our study supports temporal dynamics in MRSA clone diversities, further providing critical insights into the importance of continued monitoring of MRSA.
Introduction
Gram positive Staphylococcus aureus is one of the most common pathogens of hospital- and community-acquired infections with substantial morbidity and mortality (Li et al., 2016; Musicha et al., 2017). The mortality rate associated with serious S. aureus infection, especially bacteremia, is as high as 15–25% (Vogel et al., 2016; Asgeirsson et al., 2017; Recker et al., 2017). The S. aureus bacteremia is further exacerbated by the emergence and widespread circulation of drug-resistant strains, especially methicillin-resistant S. aureus (MRSA) (Gordon and Lowy, 2008; Recker et al., 2017).
The multicenter surveillance network is important in monitoring bacterial resistance in different regions and providing crucial insight into clinical infection control and rational use of antibiotics. One of the important tools in bacterial resistance surveillance is to track population structure changes for a given pathogen. In S. aureus, staphylococcal cassette chromosome mec (SCCmec) element, multilocus sequence typing (MLST), and spa typing have been widely used (Ito et al., 1999; Enright et al., 2000; Harmsen et al., 2003). Utilizing those methods, we have previously shown that ST239-MRSA-SCCmecIII and ST5-MRSA-SCCmecII were the predominant clones in Chinese hospitals in 2005–2006 and 2010–2011, respectively, while ST7-t091/t796, ST188-t189, and ST398-t571/t034 were the most prevalent methicillin-sensitive S. aureus (MSSA) bacteremia clones (Liu et al., 2009; He et al., 2013). This study aimed at investigating whether the population structure of S. aureus causing bacteremia has changed over the past several years and determine the underlying mechanism leading to the temporal dynamics in MRSA clone diversities.
Materials and Methods
Bacterial Isolates Collection
A total of 416 consecutive, non-duplicate S. aureus bacteremia isolates were collected from 22 teaching hospitals in 12 cities from January–December in 2013 (181 isolates) and 2016 (235 isolates); the cities including Beijing, Changsha, Chongqing, Guangzhou, Hangzhou, Jinan, Nanjing, Shanghai, Shenyang, Tianjin, Wuhan and Xi'an, representing the capitals of 12 different provinces, and were distributed in distant geographic areas in China (the surveyed cities were same as that referred in He et al., 2013). These isolates were provided by the Gram Positive Cocci Resistance Surveillance (GPRS) networks and Chinese Antimicrobial Resistance Surveillance of Nosocomial Infections (CARES) networks (detail information of these two networks was shown in Acknowledgments). For GPRS networks, each center was required to send 50 non-repetitive consecutive Gram-positive cocci isolates in 2013, and 20 non-repetitive consecutive bacteremia S. aureus isolates in 2016; for CARES networks, 180 non-repetitive consecutive isolates from bloodstream infection, hospital-acquired pneumonia and intra-abdominal infection were sent from each center in 2013 and 2016. S. aureus isolates were re-identified by routine microbiology/biochemical methods, and/or the Vitek® 2 system (bioMérieux, Hazelwood, MO, US) in Peking University People's Hospital (the Central Laboratory). All isolates were stored at −80°C. The study was approved by the research ethics board at Peking University People's Hospital. Informed consent was not needed as this was a retrospective study and patients were anonymized.
Antimicrobial Susceptibility Testing
The minimum inhibitory concentrations (MICs) of routine clinical antibiotics were determined using broth microdilution method (tedizolid and daptomycin) or agar dilution method (agents other than tedizolid and daptomycin) according to the CLSI guidelines (M7-A9) (CLSI, 2012). Isolates were categorized into resistant (R), intermediate (I), or susceptible (S) according to CLSI M100-S27 (CLSI, 2017). The MIC interpretive criteria for tigecycline were as recommended by the US Food and Drug Administration (FDA). S. aureus ATCC 29213 was used as quality control.
Molecular Typing Methods
All S. aureus isolates were investigated by MLST and spa typing. Genomic DNA was prepared using DNA Extraction Kit (TIANGEN Biotech, China). MLST was performed as described previously and the sequences of the PCR products were compared with an MLST database (http://saureus.mlst.net) (Enright et al., 2000); a neighbor-joining tree was constructed with the concatenated sequences of the seven MLST genes (arcc, aroe, glpf, gmk, pta, tpi, and yqil) using MEGA5 (Tamura et al., 2011), and only one sequence from the same sequence types (STs) was used to avoid duplication. The clustering of STs was performed using eBURST V3 algorithm (http://eburst.mlst.net/) by comparing the present dataset to that of the S. aureus MLST database of 4408 STs by the end of November 2017 (https://pubmlst.org/saureus/), and ran with the default settings. STs that showed at least six of seven identical alleles were grouped into clonal complexes (CC). The spa genes were sequenced and spa types were assigned based on comparisons with the spa database (http://spa.ridom.de/spatypes.shtml) (Harmsen et al., 2003). Genes encoding the cassette chromosome recombinase (ccr) complex and mec complex were typed by multiplex PCR as previously described (Zhang et al., 2009, 2012).
Growth Assay and Calculation of Generation Times
The randomly selected four ST59-t437-MRSA isolates, 2016-ST59-t437-1, 2016-ST59-t437-2, 2013-ST59-t437-1, 2013-ST59-t437-2, and four ST239-t030-MRSA isolates, 2016-ST239-t030-1, 2016-ST239-t030-2, 2013-ST239-t030-1, and 2013-ST239-t030-2, were shortly named A1, A2, B1, B2, C1, C2, D1, D2, respectively. Isolates were cultured overnight in LB broth, diluted to an OD600 of 0.01 and grown at 37°C with agitation at 200 rpm. The cell density was determined every 0.5 h by measuring the OD600. All these eight randomly selected S. aureus isolates were cultured to logarithmic growth phase (OD600 = 0.3) in LB broth at 37°C with agitation at 200 rpm. The numbers of colonies were counted at the beginning and after 60 min of time interval. Then the generation time was calculated as
where G = generation time, t = time interval, b = number of bacteria at the end of the time interval, and B = number of bacteria at the beginning of a time interval (Smits and Riemann, 1988; Li et al., 2017).
In vitro Competition and Fitness Measurements
The randomly selected eight isolates were diluted to 0.5 × 10⁷ colony-forming units (CFU)/ml, equal volumes were combined, thus the initial ratio of the isolate pairs was close to 1:1, then 10 μl of the mixture was added to 20 ml LB broth and cultured at 37°C with agitation at 200 rpm. At 24-h intervals, 10 μl bacterial subcultures were transferred to fresh LB broth; meanwhile, 10 μl was inoculated on drug-free MH agar, and 10 μl on MH agar containing 1 μg/ml rifampicin. The numbers of ST59-t437 (susceptible to rifampicin, MIC ≤ 0.016 μg/ml) and ST239-t030 (resistant to rifampicin, MIC ≥ 128 μg/ml) colonies were counted, and after 96 h, adaptive difference was calculated as
relative adaptive fitness as
and the fitness cost as
where rt = number of resistant colonies and st = number of sensitive colonies (Sander et al., 2002; Guo et al., 2012; Nielsen et al., 2012; Li et al., 2017).
Statistical Analysis
All susceptibility data and molecular test results were analyzed using the software WHONET-5.6. Statistical analysis of growth curves were performed with the software GraphPad Prism version 5 using one-way analysis of variance (ANOVA) followed by Tukey–Kramer tests; percentage values or frequencies were analyzed pairwise by two tailed chi-square test or Fisher's exact test, if appropriate. P < 0.05 was considered to be statistically significant.
Results
The Prevalence of MRSA
Among the 416 bacteremia S. aureus isolates obtained in 2013 (n = 181) and 2016 (n = 235), the average prevalence of MRSA were 36.5% (66/181) and 36.6% (86/235), respectively. The distribution of MRSA from the 12 investigative cities is shown in Table 1. For cities where the number of S. aureus isolates was more than 10, the prevalence of MRSA was calculated. The prevalence of MRSA ranged from 18.8% (6/32) in Guangzhou to 55.5% (11/20) in Wuhan in 2013; and from 27.3% (15/55) in Beijing to 60.0% (12/20) in Shanghai in 2016.
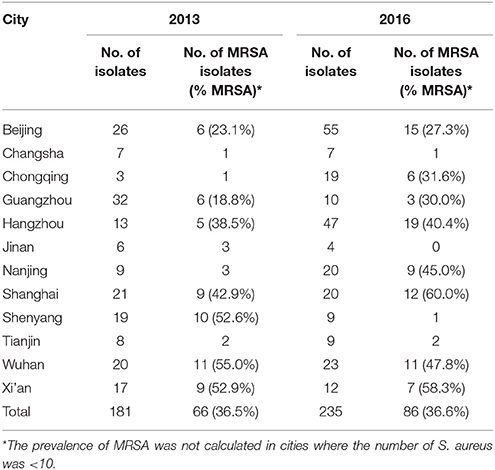
Table 1. Distribution of meticillin-resistant Staphylococcus aureus (MRSA) from bacteremia in 12 cities throughout China in 2013 and 2016.
Antimicrobial Activities
All isolates were susceptible to vancomycin, teicoplanin, tigecycline, linezolid, tedizolid, and daptomycin. The MIC50, MIC90 and geometric mean MICs of those antimicrobials remained similar between 2013 and 2016 (Table 2). In addition to the above-mentioned antimicrobials, trimethoprim-sulfamethoxazole displayed the best antimicrobial activity (93.9–98.8% sensitivity in MRSA and 98.3–99.3% sensitivity in MSSA), while erythromycin exhibited the poorest antimicrobial activity (9.3–10.6% sensitivity in MRSA and 52.3–60.0% sensitivity in MSSA). Interestingly, the susceptibility rates of MRSA to rifampicin and fluoroquinolones (moxifloxacin, levofloxacin, and ciprofloxacin) were significantly increased from 2013 to 2016 (20.8–28.4% of increase, P < 0.01). The antimicrobial resistant profiles among all MSSAs remained similar from 2013 to 2016 (data not shown).
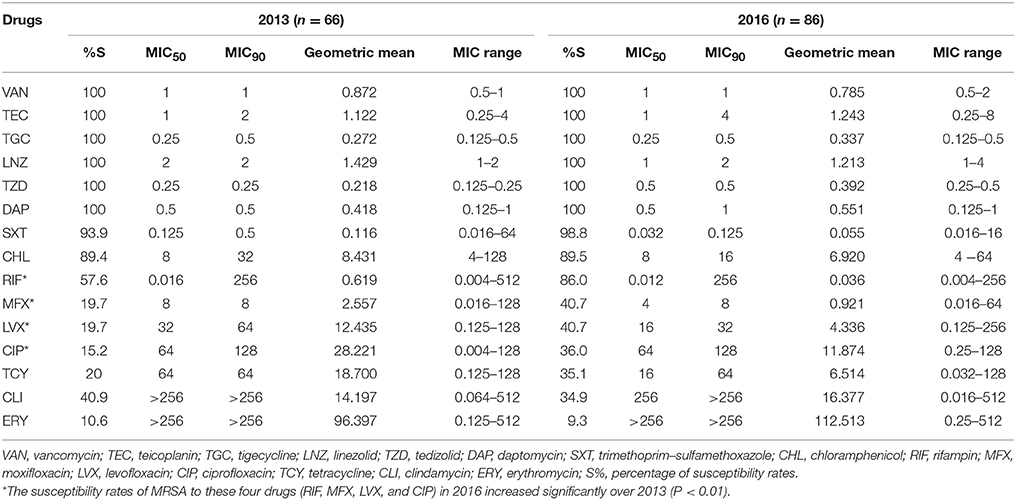
Table 2. Activity profile of antibiotics against all meticillin-resistant Staphylococcus aureus (MRSA) isolates collected in China in 2013 and 2016 (MIC, μg/ml).
Molecular Typing and Prevalence of Genotypes
A total of 45 STs, which belonged to 25 CCs, and 111 spa types were identified in 2013 (28 STs and 61 spa types) and 2016 (32 STs and 82 spa types) (Figure 1 and Table 3). CC5, CC8, CC188, CC59, CC7, and CC398 were the most prevalent CCs, including 18.0% (75/416), 14.4% (60/416), 11.3% (47/416), 8.4% (35/416), 7.5% (31/416), and 7.0% (29/416) of the isolates, respectively. An MLST dendrogram indicated that ST1, ST5, ST6, ST7, ST8, ST15, ST30, ST59, ST72, ST88, ST398, ST630, and ST965 included both MRSA and MSSA isolates (Figure 1). ST239 genotypes were all MRSA isolates. For ST398, ST6, ST630, and ST1, all the isolates were MSSA in 2013; while MRSA were present in 25% (5/20), 8.3% (1/12), 36.4% (4/11), and 50.0% (1/2) of those isolates in 2016, respectively.
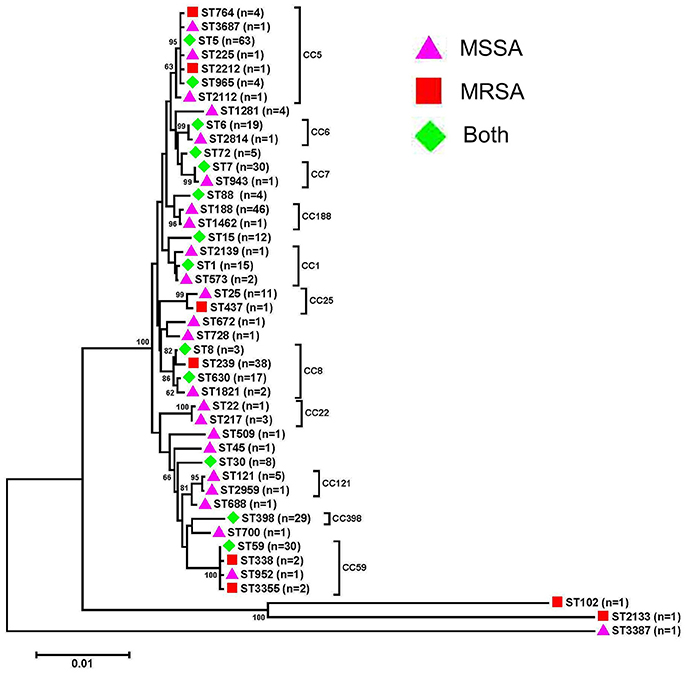
Figure 1. Phylogenetic analysis of multilocus sequence types (STs) of bacteremia Staphylococcus aureus isolates. The neighbor-joining tree was constructed with the concatenated sequences of the seven MLST genes (arcc, aroe, glpf, gmk, pta, tpi, and yqil) based on the distance matrix of pair-wise differences between STs. Bootstrap support was based on 1,000 replicates, and only branch nodes higher than 60 were shown. The bar is equivalent to one nucleotide change per 100 bp. MSSA, meticillin-susceptible S. aureus; MRSA, meticillin-resistant S. aureus.
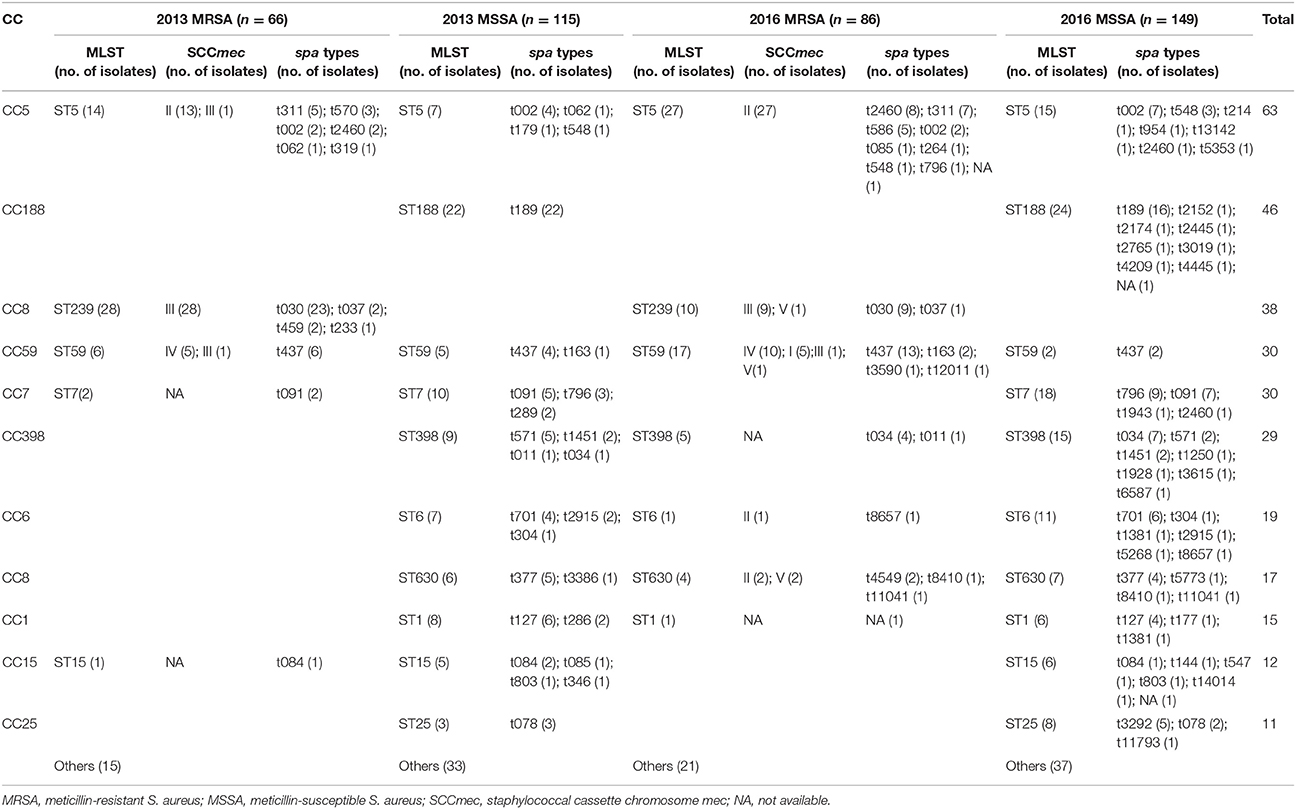
Table 3. The 11 predominant multilocus sequence types (MLSTs) and relationship between various molecular types of 416 Staphylococcus aureus bacteremia isolates in 2013 and 2016.
The 11 predominant STs containing isolates more than 10 were shown in detail in Table 3. The six predominant STs (ST5, ST188, ST239, ST59, ST7, and ST398) included 15.1% (63/416), 11.1% (46/416), 9.1% (38/416), 7.2% (30/416), 7.2% (30/416), 7.0% (29/416) of the isolates. When ST types and oxacillin (OXA) sensitivity were combined, the six predominant genotypes in 2013 were ST239-MRSA (15.5%), ST188-MSSA (12.2%), ST5-MRSA (7.7%), ST7-MSSA (5.5%), ST398-MSSA (5.0%), and ST1-MSSA (4.4%), while in 2016 were ST5-MRSA (11.5%), ST188-MSSA (10.2%), ST7-MSSA (7.7%), ST59-MRSA (7.2%), ST5-MSSA (6.4%), and ST398-MSSA (6.4%). Notably, the prevalence of ST239-MRSA was significantly decreased from 2013 to 2016 (15.5% vs. 4.3%, P < 0.001). Instead, ST5-MRSA and ST59-MRSA became the two predominant MRSA genotypes in 2016. ST188-MSSA and ST7-MSSA were the two predominant MSSA genotypes in both 2013 and 2016. When ST types, spa types and OXA sensitivity were combined analysis, 72 and 119 genotypes were obtained in 2013 and 2016, respectively; the ratio of the number of genotypes to the number of isolates was significantly increased from 2013 to 2016 (0.398 vs. 0.506, P < 0.05).
Activity Profile of Antibiotics to ST59-t437 and ST239-t030 MRSA Isolates
All ST239-t030 were MRSA isolates (n = 32); while the prevalence of MRSA in ST59-t437 were 60% (6/10) in 2013 and 86.7% (13/15) in 2016. Importantly, ST239-t030, the predominant genotype among all MRSAs in 2013 (34.8%), was replaced by ST59-t437 (15.1%) in 2016. The susceptibility rates of ST59-t437-MRSA (n = 19) to rifampicin (100%), moxifloxacin (94.7%), levofloxacin (94.7%), ciprofloxacin (78.9%), and tetracycline (46.2%) were all significantly higher than those from ST239-t030-MRSA (n = 32, all the isolates were resistant to those antimicrobials, P < 0.01). In addition, the predominant resistance profile of ST239-t030-MRSA was oxacillin-ciprofloxacin-levofloxacin-moxifloxacin-erythromycin-clindamycin-tetracycline-rifampin in 2013 (30.4%, 7/23) and 2016 (55.5%, 5/9); while the predominant resistance profile of ST59-t437-MRSA was oxacillin-erythromycin-clindamycin-tetracycline in 2013 (16.7%, 1/6) and 2016 (61.5%, 8/13).
Growth Rates of ST59-t437 and ST239-t030 MRSA Isolates
To further gain insight into the mechanisms underlying the changes of genetic structure, growth rates between ST59-t437 and ST239-t030 were examined. Growth characteristics of the randomly selected ST59-t437 and ST239-t030 MRSA isolates are shown in Figure 2. The OD600 values of the four ST59-t437 isolates were higher than that of the ST239-t030 isolates throughout the 24 h. Among the pairwise comparison of growth curves, A1C1, B2C1, and B2D1 showed significant statistical differences (P < 0.05), i.e., the growth of A1 was significantly faster than C1; B2 was significantly higher than C1 and D1. The average generation time of ST59-t437 (A1, 40 min; A2, 25 min; B1, 27 min; B2, 25 min) and ST239-t030 isolates (C1, 38 min; C2, 33 min; D1, 33 min; D2, 42 min) were 29 ± 6 (min) and 37 ± 3 (min), respectively. Taken together, ST59-t437 isolates demonstrated faster growth rates compared to ST239-t030 isolates.
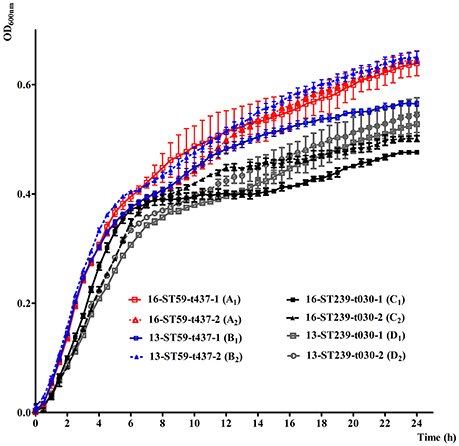
Figure 2. In vitro growth characteristics of random selected ST59-t437 and ST239-t030 meticillin-resistant Staphylococcus aureus (MRSA) isolates cultured at 37°C in LB broth. The means and standard deviation of three independent experiments are shown. The abbreviated codes (A1, A2, B1, B2, C1, C2, D1 and D2) for the isolates are listed in the brackets. Among the pairwise comparison of growth curves, A1C1, B2C1, and B2D1 showed significant statistical differences (P < 0.05), when using one-way analysis of variance (ANOVA) followed by Tukey–Kramer tests.
In Vitro Competition between ST59-t437 and ST239-t030 MRSA Isolates
In vitro competition experiments showed that ST59-t437 exhibited competitive advantage in three pairs (A1C2, A1D1, and A1D2) with the fitness cost C > 10%. In addition, a fourth pair (A2D1) displayed slightly advantage with C-value of 3.8% (Table 4). ST59-t437 and ST239-t030 showed similar fitness in the rest 4 pairs (the absolute C < 1.5%). Thus, ST59-t437 exhibited a trend toward better fitness compared to ST239-t030.
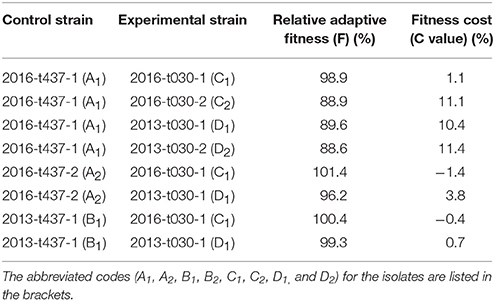
Table 4. In vitro competition results between ST59-t437 and ST239-t030 meticillin-resistant Staphylococcus aureus isolates.
Discussion
This study aimed at investigating whether the population structure of S. aureus causing bacteremia has changed over the past several years and determine the underlying mechanism. The prevalence of MRSA were 36.5% and 36.6% in 2013 and 2016, respectively, which were lower than those from our previous study in 2010–2011 (47.5%) (He et al., 2013), and were lower than those from Latin America in 2011–2014 (45.4%) (Arias et al., 2017). Interestingly, Shanghai (42.9–60.0%) and Xi'an (52.9–58.3%) continued to show high MRSA prevalence from 2010 to 2016 (He et al., 2013). The prevalence of MRSA in Beijing was declined from 36.7% to 23.1–27.3%. In contrast, the prevalence of MRSA from Wuhan was increased from 31.5% in 2010–2011 to 47.8–55.0% in 2013 and 2016. Of note, the prevalence of MRSA decreased in most cities in China since 2011, which is similar to a previous study from Finland (Jokinen et al., 2017). Interestingly, the susceptibility rates of MRSA to fluoroquinolones were significantly increased from 2013 to 2016, which is also a trend recently reported in MRSA from Germany (Schaumburg et al., 2014).
One of the most important findings in this study is the population structure change among MRSA isolates. The prevalence of ST239-MRSA was significantly decreased from 2013 (42.4%) to 2016 (11.6%) (P < 0.001). Multidrug-resistant ST239 is one of the most successful and persistent clones that globally dispersed (Baines et al., 2015), and was the most predominant genotype in our previous studies (Liu et al., 2009; He et al., 2013). ST239 had two important spa types, t030, and t037. ST239-t030-MRSA, the most predominant genotype in China from 2005 to 2013, decreased significantly in 2016 (10.5%) (P < 0.001) (Liu et al., 2009; He et al., 2013). This genotype was mainly distributed at Wuhan (39.1%) and Beijing (33.3%) in 2013 and 2016, respectively. Of note, ST239-t030-MRSA isolates were all resistant to rifampicin, tetracycline and fluoroquinolones (moxifloxacin, levofloxacin and ciprofloxacin). The resistance genes they carry or acquire may be a burden in evolution (Baines et al., 2015; Lee et al., 2015; Li et al., 2017). Similarly, the prevalence of ST239-t037-MRSA was decreased from 2010 to 2016 (13.4% in 2010–2011 vs. 3.0% in 2013 and 1.2% in 2016).
ST5 contained both MRSA and MSSA isolates, and MRSA prevalence in this ST was slightly reduced from 2010–2011 to 2016 (73.7% vs. 64.3%; He et al., 2013). Interestingly, the prevalence of ST5 was increased among all STs in MRSA from 2010–2011 to 2016 (12.5–31.4%). In addition, we noticed that the spa profiles in this ST has changed during the past seven years: t570 was the predominant one in 2010–2011, while t311 became the main genotype in 2013 and t2460 became the main genotype in 2016. The prevalence of MRSA within ST59 were 54.5% and 89.5% in 2013 and 2016, respectively. Four spa types were obtained in this study, t437 (r04-r20-r17-r20-r17-r25-r34), t163 (r04-r20-r17-r20-r17-r45-r16-r34), t3590 (r04-r02-r17-r20-r17-r25-r34) and t12011 (r04-r02-r17-r20-r17-r25-r34-r34). Taken the repeat pattern into consideration, these four spa types might be originate from two ancestors. Importantly, the prevalence of ST59-t437-MRSA among all MRSAs increased from 3.6% in 2010–2011 (He et al., 2013) to 9.1% in 2013, and there was a further increase in 2016 (15.1%). The geographical distribution of ST59-t437-MRSA was scattered, while Guangzhou (2/6) and Chongqing (3/13) were the major distributed cities in 2013 and 2016, respectively.
As ST239-t030-MRSA displayed more resistant rates to multiple antimicrobials compared to ST59-t437-MRSA, we investigated whether the presence of multi-drug resistant genes represents the “fitness cost,” making them less competitive (Baines et al., 2015; Lee et al., 2015; Li et al., 2017). Indeed, ST239-t030-MRSA displayed lower growth rate and a trend toward lower competitive advantage compared to ST59-t437-MRSA. Thus, the fitness cost may lead to the replacement of ST239-t030-MRSA by ST59-t437-MRSA, which correlated with the increased susceptibility of MRSA population to rifampicin and fluoroquinolones.
The present study showed that ST5 and ST59 were the most predominant bacteremia MRSA genotypes in China in 2016, which is different from findings in other countries: the majority of bacteremia MRSA isolates were ST5 and ST8 in Latin America in 2011–2014 and Minnesota, US in 2015 (Arias et al., 2017; Park et al., 2017), ST22 and ST239 in Australian in 2014 (Coombs et al., 2016), ST239 and ST22 in Iran in 2015–2016 (Goudarzi et al., 2017). Even in China, ST239 was still the predominant genotype in a burn center of Chongqing in 2011–2016 (Jiang et al., 2017). These studies complement our understandings of population structure of bacteremia S. aureus.
The predominant MSSA genotypes have remained basically unchanged: ST188-MSSA (13.7–19.1%), ST7-MSSA (8.7–18.5%), and ST398-MSSA (7.3–10.1%) were the three predominant MSSA genotypes from 2010–2011 to 2016. Interestingly, ST398 contained only MSSA in 2010–2011 and 2013, but MRSA strains occurred in Beijing (n = 2), Nanjing (n = 2) and Shanghai (n = 1) in 2016, which correlated with patients with infective endocarditis, nephropathy or hepatic encephalopathy. The emergence of ST398-t034/t011-MRSA might be due to an import of this clone from Europe, where livestock-associated MRSA (LA-MRSA) is widespread, and an increase of LA-MRSA has been reported for some regions in Europe (Schaumburg et al., 2012). However, these five ST398-MRSA isolates were susceptible to all surveyed drugs except erythromycin (two isolates were resistant to erythromycin). The occurrence of ST398-MRSA in China is important, which should be taken seriously and further studied with whole genome sequencing.
The limitations of present study were that the number of selected isolates for competition experiments was small, may not reflect the whole genotype population, and no genomic information supported for the growth advantage of ST59-t437-MRSA isolates. Further research would increase the sample size and do complete genomic comparison.
In conclusion, our findings reveal that fitness advantage of ST59-t437-MRSA over ST239-t030-MRSA may lead to changes in genetic structure and increased susceptibility of MRSA to rifampicin and fluoroquinolones in Chinese patients with S. aureus bacteremia. Our study supports temporal dynamics in MRSA clone diversities, further providing critical insights into the importance of continued monitoring of MRSA.
Author Contributions
HW conceived and designed the study. SL, SS, CY, HC, YY, HL, and CZ performed experiments described in this study. SL wrote the draft, and HW revised it. All authors approved the final version.
Funding
The study was partially supported by National Natural Science Foundation of China (Grant Nos. 81625014, 81501775, and 81371856).
Conflict of Interest Statement
The authors declare that the research was conducted in the absence of any commercial or financial relationships that could be construed as a potential conflict of interest.
Acknowledgments
The authors thank all of the participants of the Gram Positive GPRS networks and Chinese CARES networks for providing isolates. The authors thank Dr. Yudong Liu (NIAMS/NIH) for editorial assistance. The 22 hospitals (principal collaborators) that participated in this study are as follows. Beijing: Beijing Chao-Yang Hospital (Chunxia Yang); China-Japan Friendship Hospital (Bin Cao, Yingmei Liu); Chinese PLA General Hospital (Yanping Luo); Peking Union Medical College Hospital (Hongli Sun); Peking University People's Hospital (HW); Changsha: Xiangya Hospital of Central South University (Wenen Liu); Chongqing: Affiliated Xinan Hospital of Third Military Medical University (Zhiyong Liu); Guangzhou: First Affiliated Hospital of Sun Yat-sen University (Kang Liao); Guangdong General Hospital (Liyan Zhang); Guangzhou Institute of Respiratory Disease (Chao Zhuo); Hangzhou: Sir Run Run Shaw Hospital, School of Medicine, Zhejiang University (Yunsong Yu, Feng Zhao); The First Affiliated Hospital, Zhejiang University (Qing Yang, Hongchao Chen); The Second Affiliated Hospital of Zhejiang University School of Medicine (Rong Zhang); Jinan: Shandong Provincial Hospital (Yan Jin); Nanjing: The First Affiliated Hospital with Nanjing Medical University (Yaning Mei); Shanghai: Ruijin Hospital Shanghai Jiao Tong University School of Medicine (Yuxing Ni, Lizhong Han, Feifei Gu); Zhongshan Hospital of Fudan University (Bijie Hu); Shenyang: The First Hospital of China Medical University (Yunzhuo Chu); Tianjin: Tianjin Medical University General Hospital (Zhidong Hu); Wuhan: Affiliated Puai Hospital of Tongji Medical College, Huazhong University of Science and Technology (Ji Zeng); Tongji Hospital, Tongji Medical College, Huazhong University of Science and Technology (Ziyong Sun, Zhongju Chen, Lei Tian); Xi'an: Xijing Hospital, The Fourth Military Medical University (Xiuli Xu).
References
Arias, C. A., Reyes, J., Carvajal, L. P., Rincon, S., Diaz, L., Panesso, D., et al. (2017). A prospective cohort multicenter study of molecular epidemiology and phylogenomics of Staphylococcus aureus bacteremia in nine latin American countries. Antimicrob. Agents Chemother 61, e00816–e00817. doi: 10.1128/AAC.00816-17
Asgeirsson, H., Thalme, A., and Weiland, O. (2017). Staphylococcus aureus bacteraemia and endocarditis - epidemiology and outcome: a review. Infect. Dis. 6, 1–18. doi: 10.1080/23744235.2017.1392039
Baines, S. L., Holt, K. E., Schultz, M. B., Seemann, T., Howden, B. O., Jensen, S. O., et al. (2015). Convergent adaptation in the dominant global hospital clone ST239 of methicillin-resistant Staphylococcus aureus. MBio 6:e00080. doi: 10.1128/mBio.00080-15
CLSI (2012). Methods for Dilution Antimicrobial Susceptibility Tests for Bacteria that Grow Aerobically; Approved Standard, 9th Edn. Document M7-A9. Wayne, PA: CLSI.
CLSI (2017). Performance Standards for Antimicrobial Susceptibility Testing, 27th Edn. Wayne, PA: CLSI.
Coombs, G. W., Daley, D. A., Thin Lee, Y., Pearson, J. C., Robinson, J. O., Nimmo, G. R., et al. (2016). Australian Group on antimicrobial resistance Australian Staphylococcus aureus sepsis outcome programme annual report, 2014. Commun. Dis. Intell. Q. Rep. 40, E244–E254.
Enright, M. C., Day, N. P., Davies, C. E., Peacock, S. J., and Spratt, B. G. (2000). Multilocus sequence typing for characterization of methicillin-resistant and methicillin-susceptible clones of Staphylococcus aureus. J. Clin. Microbiol. 38, 1008–1015.
Gordon, R. J., and Lowy, F. D. (2008). Pathogenesis of methicillin-resistant Staphylococcus aureus infection. Clin. Infect. Dis. 46(Suppl. 5), S350–S359. doi: 10.1086/533591
Goudarzi, M., Seyedjavadi, S. S., Nasiri, M. J., Goudarzi, H., Sajadi Nia, R., and Dabiri, H. (2017). Molecular characteristics of methicillin-resistant Staphylococcus aureus (MRSA) strains isolated from patients with bacteremia based on MLST, SCCmec, spa, and agr locus types analysis. Microb. Pathog. 104, 328–335. doi: 10.1016/j.micpath.2017.01.055
Guo, B., Abdelraouf, K., Ledesma, K. R., Nikolaou, M., and Tam, V. H. (2012). Predicting bacterial fitness cost associated with drug resistance. J. Antimicrob. Chemother 67, 928–932. doi: 10.1093/jac/dkr560
Harmsen, D., Claus, H., Witte, W., Rothgänger, J., Claus, H., Turnwald, D., et al. (2003). Typing of methicillin-resistant Staphylococcus aureus in a university hospital setting by using novel software for spa repeat determination and database management. J. Clin. Microbiol. 41, 5442–5448. doi: 10.1128/JCM.41.12.5442-5448.2003
He, W., Chen, H., Zhao, C., Zhang, F., Li, H., Wang, Q., et al. (2013). Population structure and characterisation of Staphylococcus aureus from bacteraemia at multiple hospitals in China: association between antimicrobial resistance, toxin genes and genotypes. Int. J. Antimicrob. Agents 42, 211–219. doi: 10.1016/j.ijantimicag.2013.04.031
Ito, T., Katayama, Y., and Hiramatsu, K. (1999). Cloning and nucleotide sequence determination of the entire mec DNA of pre-methicillin-resistant Staphylococcus aureus N315. Antimicrob. Agents Chemother 43, 1449–1458.
Jiang, B., Yin, S., You, B., Huang, G., Yang, Z., Zhang, Y., et al. (2017). A 5-year survey reveals increased susceptibility to glycopeptides for methicillin-resistant Staphylococcus aureus isolates from Staphylococcus aureus bacteremia patients in a Chinese burn center. Front. Microbiol. 8:2531. doi: 10.3389/fmicb.2017.02531
Jokinen, E., Laine, J., Huttunen, R., Lyytikäinen, O., Vuento, R., Vuopio, J., et al. (2017). Trends in incidence and resistance patterns of Staphylococcus aureus bacteremia. Infect. Dis. 50, 52–58. doi: 10.1080/23744235.2017.1405276
Lee, C. R., Lee, J. H., Park, K. S., Jeong, B. C., and Lee, S. H. (2015). Quantitative proteomic view associated with resistance to clinically important antibiotics in Gram-positive bacteria: a systematic review. Front. Microbiol. 6:828. doi: 10.3389/fmicb.2015.00828
Li, S., Guo, Y., Zhao, C., Chen, H., Hu, B., Chu, Y., et al. (2016). In vitro activities of tedizolid compared with other antibiotics against Gram-positive pathogens associated with hospital-acquired pneumonia, skin and soft tissue infection and bloodstream infection collected from 26 hospitals in China. J. Med. Microbiol. 65, 1215–1224. doi: 10.1099/jmm.0.000347
Li, S., Yin, Y., Chen, H., Wang, Q., Wang, X., and Wang, H. (2017). Fitness cost of daptomycin-resistant Staphylococcus aureus obtained from in Vitro daptomycin selection pressure. Front Microbiol. 8:2199. doi: 10.3389/fmicb.2017.02199
Liu, Y., Wang, H., Du, N., Shen, E., Chen, H., Niu, J., et al. (2009). Molecular evidence for spread of two major methicillin-resistant Staphylococcus aureus clones with a unique geographic distribution in Chinese hospitals. Antimicrob. Agents Chemother 53, 512–518. doi: 10.1128/AAC.00804-08
Musicha, P., Cornick, J. E., Bar-Zeev, N., French, N., Masesa, C., Denis, B., et al. (2017). Trends in antimicrobial resistance in bloodstream infection isolates at a large urban hospital in Malawi (1998-2016): a surveillance study. Lancet Infect. Dis. 17, 1042–1052. doi: 10.1016/S1473-3099(17)30394-8
Nielsen, K. L., Pedersen, T. M., Udekwu, K. I., Petersen, A., Skov, R. L., Hansen, L. H., et al. (2012). Fitness cost: a bacteriological explanation for the demise of the first international methicillin-resistant Staphylococcus aureus epidemic. J. Antimicrob. Chemother 67, 1325–1332. doi: 10.1093/jac/dks051
Park, K. H., Greenwood-Quaintance, K. E., Uhl, J. R., Cunningham, S. A., Chia, N., Jeraldo, P. R., et al. (2017). Molecular epidemiology of Staphylococcus aureus bacteremia in a single large Minnesota medical center in 2015 as assessed using MLST, core genome MLST and spa typing. PLoS ONE 12:e0179003. doi: 10.1371/journal.pone.0179003
Recker, M., Laabei, M., Toleman, M. S., Reuter, S., Saunderson, R. B., Blane, B., et al. (2017). Clonal differences in Staphylococcus aureus bacteraemia-associated mortality. Nat. Microbiol. 2, 1381–1388. doi: 10.1038/s41564-017-0001-x
Sander, P., Springer, B., Prammananan, T., Sturmfels, A., Kappler, M., Pletschette, M., et al. (2002). Fitness cost of chromosomal drug resistance conferring mutations. Antimicrob. Agents Chemother 46, 1204–1211. doi: 10.1128/AAC.46.5.1204-1211.2002
Schaumburg, F., Idelevich, E. A., Peters, G., Mellmann, A., von Eiff, C., Becker, K., et al. (2014). Trends in antimicrobial non-susceptibility in methicillin-resistant Staphylococcus aureus from Germany (2004-2011). Clin. Microbiol. Infect. 20, O554–O557. doi: 10.1111/1469-0691.12519
Schaumburg, F., Köck, R., Mellmann, A., Richter, L., Hasenberg, F., Kriegeskorte, A., et al. (2012). Population dynamics among methicillin-resistant Staphylococcus aureus isolates in Germany during a 6-year period. J. Clin. Microbiol. 50, 3186–3192. doi: 10.1128/JCM.01174-12
Smits, J. D., and Riemann, B. (1988). Calculation of cell production from [3H]thymidine incorporation with freshwater bacteria. Appl. Environ. Microbiol. 54, 2213–2219.
Tamura, K., Peterson, D., Peterson, N., Stecher, G., Nei, M., and Kumar, S. (2011). MEGA5: molecular evolutionary genetics analysis using maximum likelihood, evolutionary distance, and maximum parsimony methods. Mol. Biol. Evol. 28, 2731–2739. doi: 10.1093/molbev/msr121
Vogel, M., Schmitz, R. P., Hagel, S., Pletz, M. W., Gagelmann, N., Scherag, A., et al. (2016). Infectious disease consultation for Staphylococcus aureus bacteremia - A systematic review and meta-analysis. J. Infect. 72, 19–28. doi: 10.1016/j.jinf.2015.09.037
Zhang, K., McClure, J. A., and Conly, J. M. (2012). Enhanced multiplex PCR assay for typing of staphylococcal cassette chromosome mec types I to V in methicillin-resistant Staphylococcus aureus. Mol. Cell Probes 26, 218–221. doi: 10.1016/j.mcp.2012.04.002
Zhang, K., McClure, J. A., Elsayed, S., and Conly, J. M. (2009). Novel staphylococcal cassette chromosome mec type, tentatively designated type VIII, harboring class A mec and type 4 ccr gene complexes in a Canadian epidemic strain of methicillin-resistant Staphylococcus aureus. Antimicrob. Agents Chemother 53, 531–540. doi: 10.1128/AAC.01118-08
Keywords: MRSA, bacteremia, population structure, genotype, fitness cost, in vitro competition
Citation: Li S, Sun S, Yang C, Chen H, Yin Y, Li H, Zhao C and Wang H (2018) The Changing Pattern of Population Structure of Staphylococcus aureus from Bacteremia in China from 2013 to 2016: ST239-030-MRSA Replaced by ST59-t437. Front. Microbiol. 9:332. doi: 10.3389/fmicb.2018.00332
Received: 15 January 2018; Accepted: 12 February 2018;
Published: 27 February 2018.
Edited by:
Dongsheng Zhou, Beijing Institute of Microbiology and Epidemiology, ChinaReviewed by:
Fangyou Yu, Shanghai Pulmonary Hospital, Tongji University School of Medicine, ChinaFrieder Schaumburg, University Hospital Münster, Germany
Copyright © 2018 Li, Sun, Yang, Chen, Yin, Li, Zhao and Wang. This is an open-access article distributed under the terms of the Creative Commons Attribution License (CC BY). The use, distribution or reproduction in other forums is permitted, provided the original author(s) and the copyright owner are credited and that the original publication in this journal is cited, in accordance with accepted academic practice. No use, distribution or reproduction is permitted which does not comply with these terms.
*Correspondence: Hui Wang, wanghui@pkuph.edu.cn; whuibj@163.com